quantitative assessment of operational security
TRANSCRIPT

Quantitative Assessment ofOperational Security —
A Modeling and Measurement based Approach
Mohamed Kaâniche
ZISC Workshop on IT Security Risk Management ETH Zurich, September 16, 2004
LAAS-CNRSToulouse, France

Outline
Context: fault forecasting
Quantitative evaluation: LAAS approach
Validation based on real attack data
Conclusion and Perspectives

Context Exponentially growing number of security incidents and vulnerabilities
despite the growing usage of security protection mechanisms
http://www.cert.org/present/cert-overview-trends/
Prevention and protection are not sufficient Need for assessment and fault forecasting to support design,
management and administration activities
1995 1996 1997 1998 1999 2000 2001 2002 2003
100 000
80 000
90 000
70 000
60 000
50 00040 000
30 000
20 000
10 0000 2340 2412 2573 2134
9859
21756
55100
82094
3734
Total incidents reported (1998-2002): 182 463
20031995 1996 1997 1998 1999 2000 2001 2002
171 345 311 262417
1090
2437
4129
5 0004 500
4 000
2 500
2 000
1 500
1 000
5000
Total vulnerabilities reported (1995-2002): 9 162
3 000
3 500

Fault forecasting
Focused on accidental faults rather than malicious faults
Objectiveso Gain confidence that the system is able to deliver service that can
justifiably be trustedo Support architecture design decisions: achieve the best dependability-
performance tradeoff
Evaluation methodso Qualitative:
identify and rank failures, or the methods used to avoid themo Quantitative:
evaluate in terms of probabilities the degree of satisfaction of certainattributes of dependabilityMTFF: Mean Time to First FailureR(t): Prob. continuous service delivery during t

Quantitative evaluation techniques
Modeling controlled experiments data collected during operation
Measurement assumptions

Security evaluation
Traditional methods
o Evaluation (TCSEC, ITSEC, CC, ...):~ qualitative evaluation
o Risk assessment: subjective evaluation of vulnerabilities, threats, consequences
o Not well suited to take into account the dynamic evolution ofsystems and their environment during operation: “How the system has been built? ” rather than “How it is operated? ”

Quantitative security evaluation
Probabilistic modeling framework Measure = effort needed for a potential attacker to
defeat the security policy Objectives
o Take into account security/usability trade-offso Monitor security evolutions according to configuration and use
changeso Identify the best security improvement for the least usability
change
Proposed approach
Identify security objectives: security policy
Model system vulnerabilities
Model the attack processes
Compute significant measures
R. Ortalo, Y. Deswarte, M. Kaâniche, "Experimenting with Quantitative Evaluation Tools forMonitoring Operational Security", IEEE Transactions on Software Engineering, Vol.25, N°5,pp.633-650, Sept./Oct. 1999.

Vulnerability modeling
Node = a set of privileges (user, group, role, …) Arc = a method to transfer privileges = vulnerability Path = a set of vulnerabilities usable by a possible attacker to defeat
a security objective Weight = for each arc, effort to exploit the arc’s vulnerability
1) X can guess Y's password2) X can install a Trojan horse that
Y can activate3) X can exploit a flaw in Y's mailer4) Y is a subset of X5) Y uses a program that X can
modify6) X can modify a "setuid" program
owned by Y7) X is in Y's .rhosts
BP1
A
Xadmin
Finsider
12
4
5
6
7
3
Privilege graph

Attack process: Assumptions
Attack process = all possible successful attack scenarios General assumptions
o The attacker knows only the vulnerabilities that can be exploited with theprivileges he already owns
o The attacker will not exploit vulnerabilities that would give privileges healready owns
and, one of the following assumptions:o Total Memory (MT): the attacker remembers all the vulnerabilities he did not
exploit in the previous steps, and he can “backtrack”.o Local Memory (ML): the attacker considers only the vulnerabilities that can be
exploited with the new privileges he just acquired.

Attack process: Examples
TM assumption
1
11
1
33
2
2
3
3 3
3 33
3
3
3 6
6
66666
5
5557
6
4 4
4
6 6
ML assumption
3
3
6 5
7
4
12
BP1
A
Xadmin
F
12
4
5
6
7
3
insider

Measure computation
Identify the attacker-target couples
For each couple, compute:METF-ML: Mean Effort To security Failure
(i.e. to reach the target) with ML assumption.METF-TM: Mean Effort To security Failure with MT
assumption.Shortest Path: Mean effort to go through the shortest path.Number of Paths:Number of possible paths from the attacker
to the target nodes.

ESOPE tool set (Évaluation de la Sécurité OPErationnelle)
VulnerabilityAnalyzerUNIX
PrivilegeGraph
Archive
Security PolicyDefinition
Analysis &Computation
Measures

Experimental assessment
Objectiveso Validate the approach
Assess the relevance of the measures wrt. systemchanges (configuration, users, …)
Demonstrate the feasibility of the approachconsidering an operational networked environment
o The aim was not to: correct the identified vulnerabilities

Experiment context
Target System:• Unix• 700 users
300 machines - LAN• 13 months
(June 1995 - July 1996)
13 types of vulnerabilities(fichiers .rhosts, .*rc, passwords,
etc.)
4 difficulty levels
Security objectivesType Weight
immediate 10easy 10
2
difficult 103
very difficult 104
Attacker TargetObjective 1 insider rootObjective 2 insider admin_group
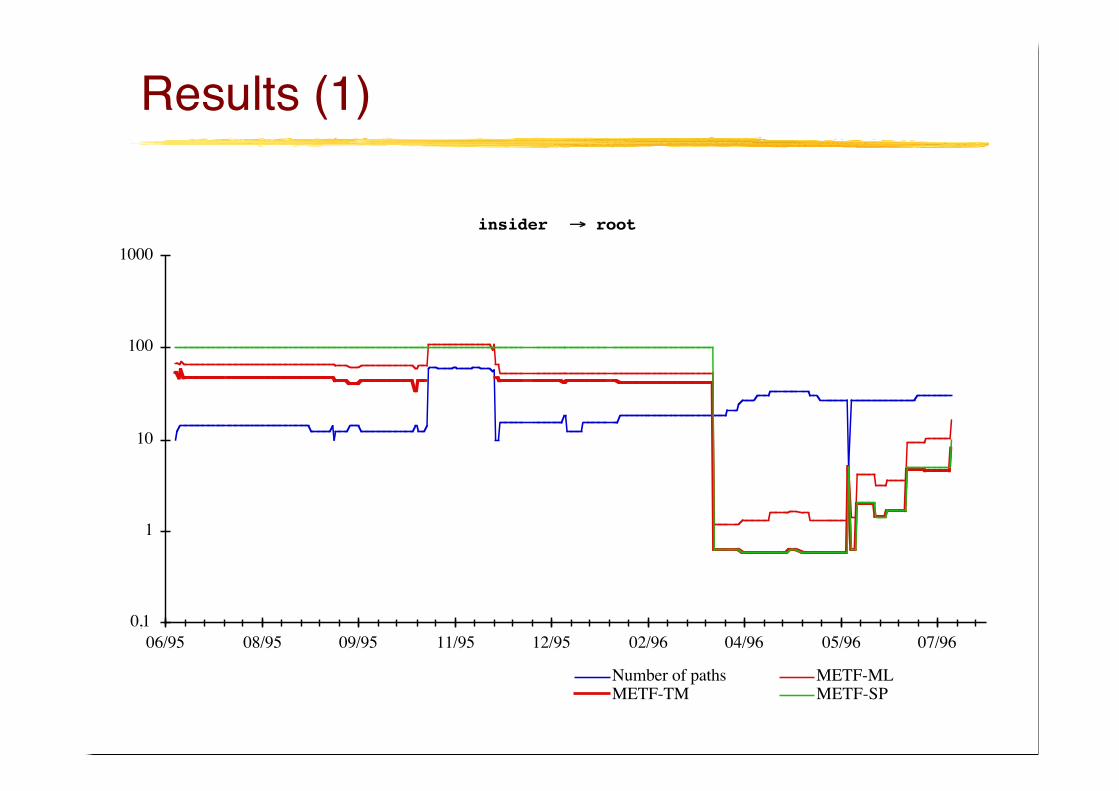
Results (1)
insider ! root
0,1
1
10
100
1000
06/95 08/95 09/95 11/95 12/95 02/96 04/96 05/96 07/96
Number of paths METF-MLMETF-TM METF-SP
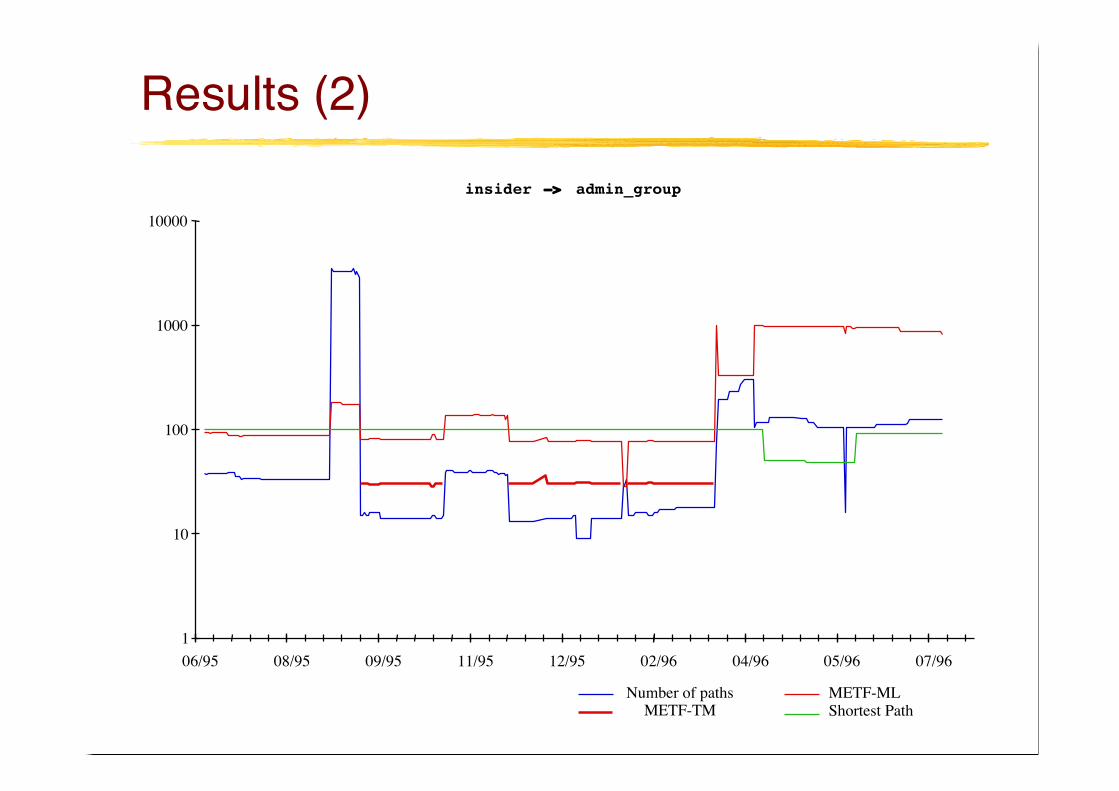
Results (2)insider −> admin_group
1
10
100
1000
10000
06/95 08/95 09/95 11/95 12/95 02/96 04/96 05/96 07/96
Number of pathsMETF-TM
METF-MLShortest Path

Comparison of the various measures
The Shortest Path (SP) is not sensitive enoughto reveal important events
The Number of Paths (NP) changes too oftenand would raise a large number of false alarms
METF-ML exhibits a good sensitivity toimportant events
METF-TM is easier to interpret, but is sometimestoo complex to be computed

Problems
Is the model valid in the real world?
TM and ML are two extreme behaviors, butwhat would be a “real” attacker behavior?
Weight parameters are assessed arbitrarily(subjective?)o Tenacity? Collusion? Attack rates?
We need real data !!

Validation based on real attack data
Collect real life data to learn and analyzeattackers behaviors, tools and tactics
Objectiveso Validate attack assumptionso Analyze adequacy of the privilege graph to describe
new vulnerabilities and derive attack scenarioso Extend security evaluation approach by taking into
account distribution of attacks in time, correlationbetween attacks, etc.
Honeypots and Honeynets
Honeypoto An information system resource who’s value lies in
being probed, attacked or compromisedo Anything going to or from a honeypot is likely a probe,
attack or compromise
Honeyneto A network of honeypotso All systems placed within the Honeynet are
production systems : Solaris, Windows, Linuxhttp://www.honeynet.org/alliance/

Types of Honeypots
Real vs Virtual systemso Virtual honeypots: possibility to run multiple operating systems
and services on a single computer system
Low vs. high interaction systemso Low interaction honeypots
work by emulating services and OS easy to maintain and deploy Minimal risk Honeyd
o High interaction honeypots Usually complex solutions that use a real OS No emulation, the attacker sees a real system Higher risk Vmware, User Mode Linux

Experiment
Data Storage
Administration
Internet
Honeypot
DMZ
Firewall
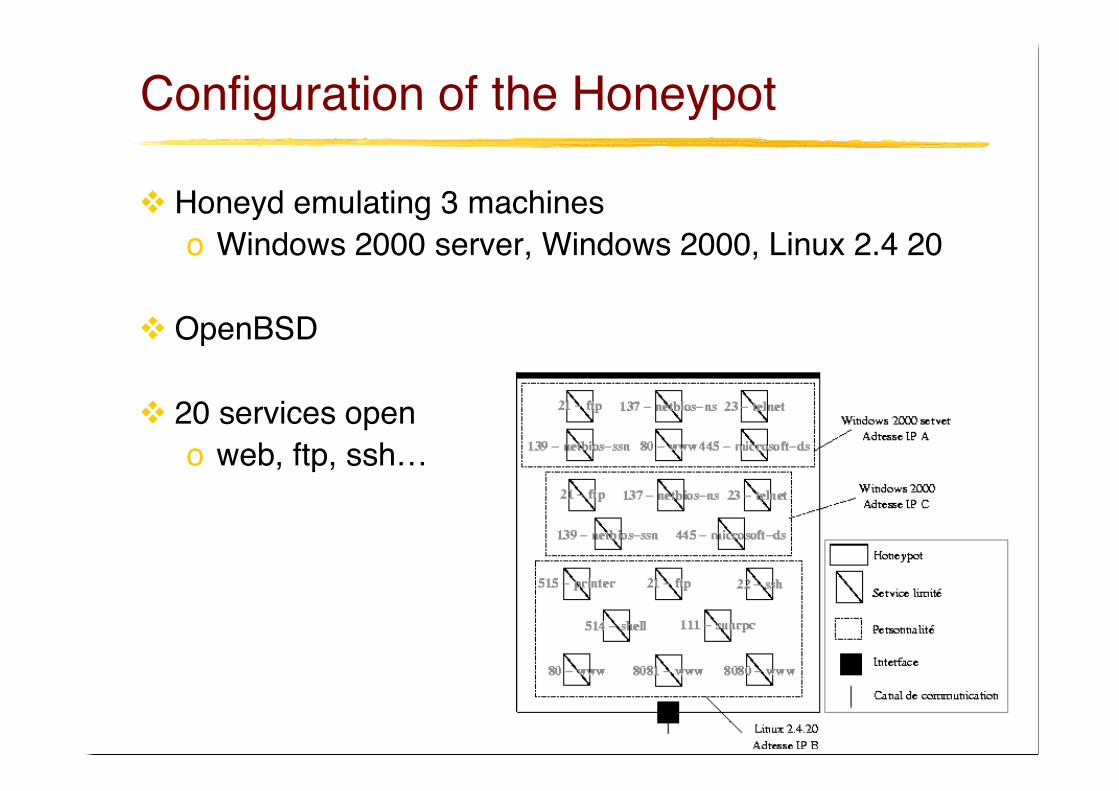
Configuration of the Honeypot
Honeyd emulating 3 machineso Windows 2000 server, Windows 2000, Linux 2.4 20
OpenBSD
20 services openo web, ftp, ssh…

OpenBSD
Secure platform Firewall used to capture input data and identify
communications
Honeypot
Firewall data

Deployment
Data collection:o started on 25 May 2004o 87days
First attack: 15 minutes after deployment
Preliminary statisticso 12570 IP addresses interacted with the honeypoto 31998 communications: ~376 per day

Data analysis
Origin of attacksDestination of attacksTargeted servicesTiming and duration of the attacksEtc.

Origin of the attacking machines
Eurecom Study
UK6%France6%Germany6%Danemark13 %USA14 %
CountryPercentage
USA17%Netherlands21%Australia33%
CountryPercentage
[Dacier et al. 2004] Honeypots: Practical Means to Validate Malicious Fault Assumptions, IEEE Pacific-Rim Int. Symp. on Dependable Computing (PRDC-2004), March 2004, pp. 383- 388
Oceania0.1%
Europe64.8%
Africa0.6%
Asia14.2%
South America0.3%
North America20.1%

Destination of attacks
0
50
100
150
200
250
26-mai
2-juin
9-juin
16-juin
23-juin
30-juin
7-juil 14-juil
21-juil
28-juil
4-aoû Date
Nu
mb
er
of
att
acks p
er
day
AllLinux 2.4.20Windows 2000Windows 2000 Server

Time and geographic distribution
0
50
100
150
200
250
26-mai
2-juin
9-juin
16-juin
23-juin
30-juin
7-juil 14-juil
21-juil
28-juil
4-aoû Date
Nu
mb
er
of
att
ac
ks
pe
r d
ay
All
Europe
North America
Asia

Distribution per hour of the day
100
150
200
250
300
350
400
450
500
1 2 3 4 5 6 7 8 9 10 11 12 13 14 15 16 17 18 19 20 21 22 23 24
Hour
Nu
mb
er o
f att
acks

Targeted services
Eurécom
80135139445Port
web10.3%epmap10.9%netbios-ssn21.2%microsoft-ds29.6%
ServicePercentage
44580
139Port
microsoft-ds10%web22%netbios-ssn51%
ServicePercentage

Time between attacks (1)Time between attacks: Intruder Machine. Service

Time between attacks (2)Time between attacks: Intruder Machine

Perspectives Data collection
o Several honeynets (different domains, locations, etc.)o Need to analyze if data collected from different locations (e.g.,
.com vs. .edu) exhibit similar or different statistical patterns
Data Analysiso Identify attacks and characterize their distribution in space & time
Known and new vulnerabilities attack scenarios trend analysis
Security modeling and evaluationo Validate the proposed approach based on the privilege graph using high-
interaction honeypotso Analyze how results are useful for designers/administrators