quantitative comparison of end-to-end availability of service paths in ring and mesh- restorable...
Post on 19-Dec-2015
216 views
TRANSCRIPT

Quantitative Comparison of End-to-End Quantitative Comparison of End-to-End Availability of Service Paths in Ring and Mesh-Availability of Service Paths in Ring and Mesh-
Restorable NetworksRestorable Networks
Matthieu Clouqueur, Wayne D. [email protected], [email protected]
National Fiber Optic Engineers Conference - NFOEC 2003
Orlando, Florida, USA

Matthieu Clouqueur and Wayne D. GroverNFOEC 20032
OutlineOutline
• Motivation
• Goals of Study
• Survivability Schemes Models
• Description of Test Cases
• Sample Results
• Discussion of Results
• Conclusion

Matthieu Clouqueur and Wayne D. GroverNFOEC 20033
MotivationMotivation
• Rings are often associated with high availability because they provide high restoration speed.
• Mesh is often thought to provide lower availability associated with low capacity redundancy and slower restoration.
We ask:
• Which really provides higher availability: ring or mesh ?
• How do ring and mesh compare in service path availability and in the range of availability levels they can offer ?
• In mesh, what would be the effects of affecting priorities to selected services ?

Matthieu Clouqueur and Wayne D. GroverNFOEC 20034
Goals and MethodologyGoals and Methodology
• Provide a true “apples-to-apples” comparison of end-to-end service path availability in ring and mesh:– Ring and Mesh are compared on identical facilities graphs serving identical
demands
– Efficient capacity designs are used for both architectures
– Exact survivability mechanisms are emulated
– Both architectures experience identical failure sequences
• Comparison is based on:– Average path unavailability (versus path length)
– Average number of outages experienced per year per service path (versus path length)
– Statistical frequency of total path outage times per year

Matthieu Clouqueur and Wayne D. GroverNFOEC 20035
Simulation Numerical DetailsSimulation Numerical Details
• Statistics of Failures:– Mean time between failures (MTBF): 1 year on each span
– Negative exponential distribution (Poisson process)
• Statistics of Repair:– Mean time to repair (MTTR): 12 hours
– Negative exponential distribution

Matthieu Clouqueur and Wayne D. GroverNFOEC 20036
Main Assumptions of the Availability AnalysisMain Assumptions of the Availability Analysis
• Previous work shows that what dominates service unavailability is:– Reconfiguration times (to single failures)
– Single node-failures
– Dual span-failures
– Triple failures
• The present analysis is based on the effects of dual span-failures– The contribution of reconfiguration times is not taken into account.
• The analysis is based on restorability investigations performed on a per path basis for 7each particular failure scenario occurring in the simulation

Matthieu Clouqueur and Wayne D. GroverNFOEC 20037
Modelling Ring SurvivabilityModelling Ring Survivability
• The Bi-directional Line Switched Ring (BLSR) model is assumed:
Protection channels
Working channels
Loop-back
Loop-back
1
2
34
5
Note: A dual fibre cut affecting a ring does not cause all service paths on the ring to experience outage
Detailed inspection is performed on a per path basis to identify paths affected by the dual failure.
surviving path
failed path

Matthieu Clouqueur and Wayne D. GroverNFOEC 20038
Modelling Mesh SurvivabilityModelling Mesh Survivability
• Adaptive mesh restoration behaviour is assumed:– Restoration paths for a failed span are dynamically searched within
remaining spare capacity (not according to pre-plan)
Note: Restoration of a failed span includes an effort to restore any spare capacity used on that span
A restoration path affected by a second failure may survive
9
7
13
21
2022
11
6
10
12
2324
17
19
16
1418
15
failed backup path is itself restored
Restoration to a first failure can be based on a pre-plan.
Second failure response is adaptive

Matthieu Clouqueur and Wayne D. GroverNFOEC 20039
Mesh Restoration with PrioritiesMesh Restoration with Priorities
• Capacity designs used are identical to normal single failure restorable designs (no additional capacity)
• A certain percentage of demands is given “Priority” status on each origin/destination node pair– The Priority service paths are considered first for restoration and will
therefore have a higher dual-failure restorability and therefore a higher availability
• Three service mixes: 10/90, 30/70, 50/50 (% high P. / % low P.)
Questions:– How much is the availability of Priority services improved?
– How much is the availability of non-Priority services degraded?

Matthieu Clouqueur and Wayne D. GroverNFOEC 200310
Three test casesThree test cases
1
2
34
56
7
8
9
10
1112
13
14
15
16
17
18
1920
2122
23
24
25
26
27
28
29
30
31
32
N22
N23
N01
N02
N25
N21
N20
N24
N03
N04
N05
N08
N07
N06
N10N09
N11N12
N15
N14
N13
N16
N18
N19
N17
(32 nodes, 45 edges) (25 nodes, 50 edges)
Hubbed Demand Matrix
Gravity-based Demand Matrix
Gravity-based Demand Matrix
net32-A net32-B 25n50s1
Topology
Type of Demand
Test case

Matthieu Clouqueur and Wayne D. GroverNFOEC 200311
Study DetailsStudy Details
• Mesh:– Working paths are routed on shortest path
– Minimal spare capacity placed by Integer Linear Programming Optimization*
– Average working path length: net32-A: 5.5; net32-B: 2.2; 25n50s1: 2.8
• Ring:– Ring designs using efficient methods developed in PhD work by D. Morley**
– # of rings in design: net32-A & net-32B: 8 OC-48; 25n50s1: 19 OC-48
– Average number of spans/ring: net32-A & net32-B: 11; 25n50s1: 9.4
– Working paths routed by shortest ring-constrained routing
* J. Doucette, W. D. Grover, “Influence of modularity and economy-of-scale effects on design of mesh-restorable DWDM networks,” IEEE JSAC, vol. 18, no. 10, October 2000, pp. 1912-1923.
** G. D. Morley, Analysis and Design of Ring-Based Networks, Ph.D. Thesis, University of Alberta, Spring 2001.
and G. D. Morley, W. D. Grover, “Tabu search optimization of optical ring transport networks,” in Proceedings of IEEE GLOBECOM 2001, November 2001, vol. 4, pp. 2160-2164.

Matthieu Clouqueur and Wayne D. GroverNFOEC 200312
Statistical ConsiderationsStatistical Considerations
• Results for each test case are based on series of 1000 one-year simulations
• Total of dual (or higher order) failures arising over 1000 trials:– Net32-A & Net32-B: 2619
– 25n50s1: 3180
• Average number of outage events per path being the basis for availability results:– Ring: 64.7
– Mesh: 45.9
• This was shown to give good confidence levels on results:– E.g. for 25n50s1 test case, over 10 separate 1000 one-year trials, standard
deviation of average unavailability Uave results was calculated to be 2.7 % of Uave
Matthieu Clouqueur and Wayne D. GroverNFOEC 200313
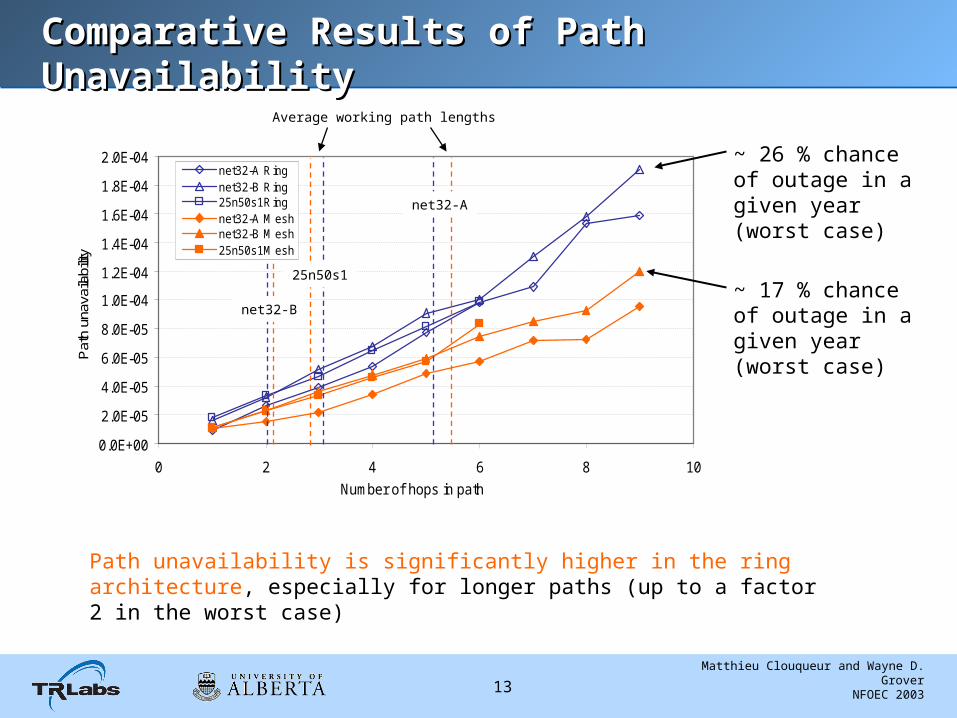
Comparative Results of Path UnavailabilityComparative Results of Path Unavailability
0.0E+00
2.0E-05
4.0E-05
6.0E-05
8.0E-05
1.0E-04
1.2E-04
1.4E-04
1.6E-04
1.8E-04
2.0E-04
0 2 4 6 8 10
Number of hops in path
Pat
h un
avai
labi
lity
net32-A R ingnet32-B R ing25n50s1 R ingnet32-A M eshnet32-B M esh25n50s1 M esh
Path unavailability is significantly higher in the ring architecture, especially for longer paths (up to a factor 2 in the worst case)
~ 26 % chance of outage in a given year (worst case)
~ 17 % chance of outage in a given year (worst case)
net32-B
net32-A
25n50s1
Average working path lengths

Matthieu Clouqueur and Wayne D. GroverNFOEC 200314
0.0%
0.1%
0.2%
0.3%
0.4%
0.5%
0.6%
0 5 10 15 20 25 30 35 40 45 50 55 60 65 70
Total outage per year (hours)
Fre
quen
cy
25n50s1 Mesh
w orst case: 48 hours(Prob = 6x10⁻⁵ %)
0.0%
0.1%
0.2%
0.3%
0.4%
0.5%
0.6%
0 5 10 15 20 25 30 35 40 45 50 55 60 65 70
Total outage per year (hours)
Fre
quen
cy
25n50s1 Ring
w orst case: 72 hours(Prob = 2.5x10⁻⁴ %)
Comparing Distributions of Outage TimesComparing Distributions of Outage Times
Ring: 93.7 % of paths experience no outage in a year
Mesh: 95.4 % of paths experience no outage in a year
median
~ 6 hours
Results for test case 25n50s1
median
~ 6 hours
90th percentile
15 hours
90th percentile
13.5 hours
Matthieu Clouqueur and Wayne D. GroverNFOEC 200315
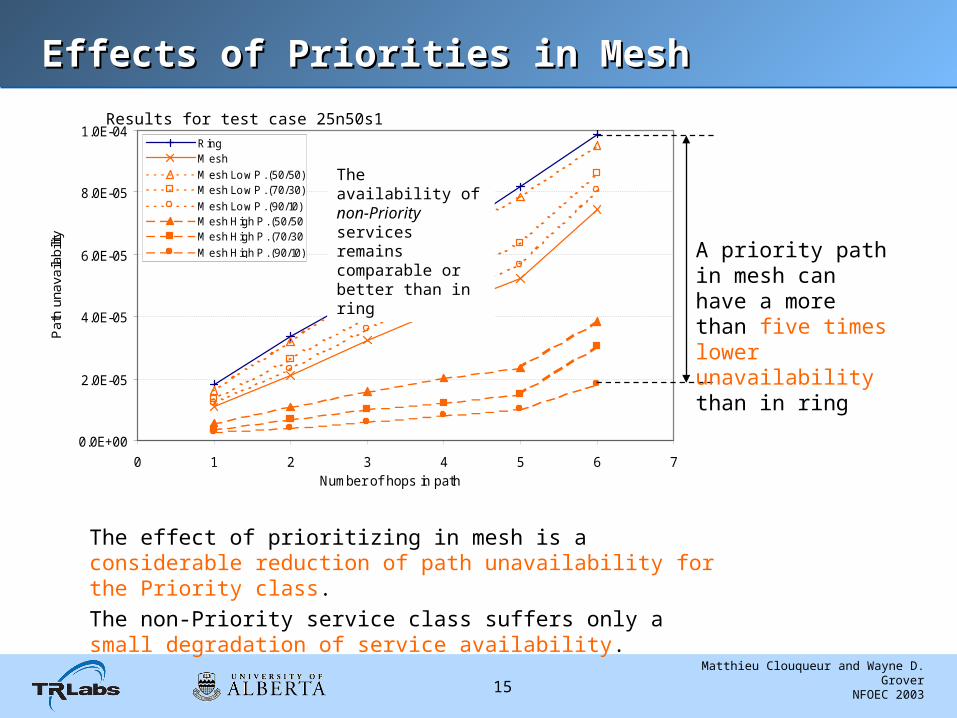
Effects of Priorities in MeshEffects of Priorities in Mesh
0.0E+00
2.0E-05
4.0E-05
6.0E-05
8.0E-05
1.0E-04
0 1 2 3 4 5 6 7Number of hops in path
Pat
h un
avai
labi
lity
RingM eshM esh Low P . (50/50)M esh Low P . (70/30)M esh Low P . (90/10)M esh High P . (50/50)M esh High P . (70/30)M esh High P . (90/10)
The effect of prioritizing in mesh is a considerable reduction of path unavailability for the Priority class.
The non-Priority service class suffers only a small degradation of service availability.
The availability of non-Priority services remains comparable or better than in ring
Results for test case 25n50s1
A priority path in mesh can have a more than five times lower unavailability than in ring

Matthieu Clouqueur and Wayne D. GroverNFOEC 200316
Additional Insights from the StudyAdditional Insights from the Study
• The effect of priorities is a significant reduction of the probability of paths experiencing outage in a given year:– E.g. for 6-hop paths in the 25n50s1 test case, the probability of
experiencing outage in a given year drops from 12% to 2% is the path is included in the 10% priority class (10/90 scheme).
• Experimental results show that the advantage of mesh over ring is greater in the highly connected topology– This is especially true for results of prioritized mesh and confirms the
understanding that mesh benefits greatly from high network diversity
• Under the 10/90 service mix Priority services achieve the lowest unavailability while the availability of non-Priority services remains virtually unchanged

Matthieu Clouqueur and Wayne D. GroverNFOEC 200317
ConclusionConclusion
• Despite its lower capacity requirements, the mesh architecture achieves better availability than ring– The key is mesh’s better ability to withstand dual-failure states even with
less redundancy than rings.
• With prioritization of services, high priority services can be offered very low unavailability (3 to 5 times less than with rings) while non-Priority service still enjoy comparable or better availability than with rings.
Concluding comment:
What matters most for high availability is not fast restoration to single failures but the ability to provide high restorability to dual failures. This minimizes the probability of MTTR-scale outages on service paths.