quantitative determination of compounds from akebia ... · akebia quinata, which is also known as...
TRANSCRIPT

1956 Bull. Korean Chem. Soc. 2014, Vol. 35, No. 7 Nguyen Thi Yen et al.
http://dx.doi.org/10.5012/bkcs.2014.35.7.1956
Quantitative Determination of Compounds from Akebia quinata by
High-Performance Liquid Chromatography
Nguyen Thi Yen, Nguyen Van Thu, Bing Tian Zhao, Jae Hyun Lee,† Jeong Ah Kim,‡ Jong Keun Son,§
Jae Sui Choi,# Eun Rhan Woo,¶ Mi Hee Woo, and Byung Sun Min*
College of Pharmacy, Catholic University of Daegu, Gyeongsan, Gyeongbuk 712-702, Korea. *E-mail: [email protected]†College of Oriental Medicine, Dongguk University, Gyeongbuk 780-714, Korea
‡College of Pharmacy, Research Institute of Pharmaceutical Sciences, Kyungpook National University, Daegu 702-701, Korea§College of Pharmacy, Yeungnam University, Gyeongsan 712-749, Korea
#Faculty of Food Science and Biotechnology, Pukyung National University, Busan 608-737, Korea¶College of Pharmacy, Chosun University, Gwangju 501-759, Korea
Received February 25, 2014, Accepted March 6, 2014
To provide the scientific corroboration of the traditional uses of Akebia quinata (Thunb.) Decne., a detailed
analytical examination of A. quinata stems was carried out using a reversed-phase high performance liquid
chromatography (RP-HPLC) method coupled to photodiode array detector (PDA) for the simultaneous
determination of four phenolic substances; cuneataside D (1), 2-(3,4-dihydroxyphenyl)ethyl-O-β-D-gluco-
pyranoside (2), 3-caffeoylquinic acid (3) and calceolarioside B (4). Particular attention was focused on the main
compound, 3-caffeoylquinic acid (3), which has a range of biological functions. In addition, 2-(3,4-
dihydroxyphenyl)ethyl-O-β-D-glucopyranoside (2) was considered as a discernible marker of A. quinata from
its easy confuse plants. The contents of compounds 2 and 3 ranged from 0.72 to 2.68 mg/g and from 1.66 to
5.64 mg/g, respectively. The validation data indicated that this HPLC/PDA assay was used successfully to
quantify the four phenolic compounds in A. quinata from different locations using relatively simple conditions
and procedures. The pattern-recognition analysis data from 53 samples classified them into two groups,
allowing discrimination between A. quinata and comparable herbs. The results suggest that the established
HPLC/PDA method is suitable for quantitation and pattern-recognition analyses for a quality evaluation of this
medicinal herb.
Key Words : Akebia quinata, Lardizabalaceae, HPLC, Pattern-recognition analyses, 3-Caffeoylquinic acid
Introduction
Akebia quinata (Thunb.) Decne. is the most studied species
of the Lardizabalaceae family. The herb was used as an
important crude drug for promoting urination and counter-
acting inflammation in traditional Chinese medicine.1
Akebia quinata, which is also known as the chocolate vine,
is a woody perennial plant that grows either as a twining
vine or as groundcover. The plant is distributed widely in
East Asia, including: China, Japan and Korea.2 Although
extensive phytochemical analyses of the stems, pericarps
and seeds of A. quinata were carried out in the 1970’s with
particular attention paid to the triterpenes and triterpene
saponins,3 there is no report of an analytical method for the
quantitation of this plant. In 2009, Fumiyo Kikaota et al.1
performed a molecular biological identification of Akebia
plant species and discriminating Akebiae Caulis from non-
Akebia plants. In a report on the characterization of the
stems of Akebia trifoliata, Yoshihiro Mimaki et al.3 identi-
fied four saponins that were obtained in good yield but were
not isolated from A. quinata stems. They concluded that
these compounds are suitable marker compounds for chemi-
cally distinguishing between A. trifoliata and A. quinata by
a conventional TLC examination. Despite this, it is still
necessary to develop a quality evaluation method for this
herb. Furthermore, discriminating A. quinata from other
related crude drugs originating from non-Akebia plants is
needed. The Chinese name of A. quinata is “Mutong”, which
was originally called “Tongcao” in history. In modern times,
however, the name “Tongcao” has been given to the herb,
Tetrapanax papyriferus. Other plants that have also been
known by the name, Mu Tong, inlcude Aristolichiae man-
shuriensis caulis (Guan-Mutong) and Clematidis armandii
caulis (Chuan-Mutong). One study reported that A. man-
shuriensis (Aristolochiaceae) is the source of Akebia plants,
Akebiae Caulis sometimes causes renal failure due to the
constituent, aristolochic acid,4 and has been banned from
clinical use in China.5 Therefore, in this study, the stems of
A. manshuriensis, C. armandii and T. papyriferus were used
as comparative herbs of A. quinata.
Almost a hundred triterpenes or triterpene saponins have
been isolated and elucidated from the stems of A. quinata.3,6-8
On the other hand, compounds, such as saponins in A. quinata
with very few chromophore groups, will poorly absorb UV
radiation and are difficult to detected using this type of
detector. Therefore, a simple, low-cost, and reasonable analy-
tical method is needed for a quality evaluation of A. quinata
through the simultaneous determination of four phenolic

Pattern Analysis of Akebia quinata by HPLC Bull. Korean Chem. Soc. 2014, Vol. 35, No. 7 1957
compounds that have strong UV absorbance. Among them,
3-caffeoylquinic acid has been reported to have a variety of
bioactivities: anti-amnesic action by inhibiting acetylcholine-
sterase,9 anti-nociceptive and anti-pyretic actions by inhibit-
ing inflammation,10 anti-ischemic action by inhibiting oxida-
tive stress and apoptosis,11 and anti-anxyolytic action by
inhibiting oxidative stress.12 Caffeoylquinic acids are also
believed to be responsible for the digestive and hepato-
protective activities in some medicinal plants.13,14 In a worthy
addition, calceolarioside B was reported to exhibit moderate
binding affinity on HIV gp41 with IC50 values of 0.1 mg/
mL.15 By focusing on some index compounds, cuneataside
D (1), 2-(3,4-dihydroxyphenyl)ethyl-O-β-D-glucopyranoside
(2), 3-caffeoylquinic acid (3) and calceolarioside B (4)
(Figure 1) were selected as marker compounds to establish a
comprehensive quality evaluation method for 46 samples of
A. quinata and 7 comparative herbal samples including two
same species of A. trifloliata with 5 different species of T.
papyriferus, A. manshuriensis and C. armandii.
Experimental
Materials. HPLC grade methanol was purchased from
Fisher Scientific Korea Ltd. Distilled and deionized water
were obtained from the instrument center (Catholic University
of Daegu, Daegu, Korea) and used throughout the study.
Trifluoroacetic acid (TFA) was obtained from Sigma-Aldrich
(USA). Others solvents and reagents were of analytical
grade. The reference standards of compounds (1-4) were
supplied from Prof. Eun Rhan Woo, Chosun University,
Gwangju, Korea. The purities of these marker compounds
were determined to be greater than 95% by normalization of
the peak areas detected by HPLC analyses. The internal
standard of methyl p-hydroxyl benzoate (methyl paraben)
was purchased from Sigma-Aldrich (German). Fifty three
samples cultured in different regions in Korea and China
were collected in 2013 corresponding to forty six A. quinata
samples (AQ1-AQ41; AQ44-AQ48), two C. armandii samples
(CA42, CA49), two A. trifloliata samples (AT50, AT51),
two A. manshuriensit samples (AM52, AM53) and a sample
of T.papyriferus (TP43). The origin of sample was identified
by Prof. Je Hyun Lee, Dongguk University, Korea and
voucher specimens were deposited in Catholic University of
Daegu.
HPLC Apparatus and Chromatographic Conditions.
HPLC analysis was performed on a Waters Alliance 2695
chromatograph equipped with a photodiode array detector
(PDA; UV/UV Waters 2996). It was used to check the purity
and verify the specificity of the evaluated compounds. UV
spectra were recorded in range 190-400 nm. The chromato-
graphic separation of analyses was carried out on an Agilent
Eclipse XDB-C18 column (5.0 µm, 150 × 4.6 mm i.d.)
performed at ambient temperature using a Thermo (Waters
Corp.). Equipment control, data acquisition and integration
were performed with Waters Empower software. The mobile
phase consisting of gradient elution of 0.05% (v/v) TFA in
water (solvent A, pH 2.3) and methanol (solvent B) was run
with gradient elution at a flow rate of 1.0 mL/min. The linear
gradient elution was set as follows: 0-15 min, form 5 to 20%
of B; 15-25 min, 20-27% of B; 25-50 min, 27-60% of B. The
injection volume was 10 µL. The column temperature was
maintained at 30 °C. UV absorption was monitored at 280
nm. The existence of four marker compounds in the extract
of A. quinata was identified by comparing their retention
times with the standards (Figure 2). The presence of standard
compounds was confirmed again by HPLC recovery test and
co-TLC. Four compounds were used for HPLC analysis to
determine their quantities in A. quinata. Quantification was
conducted using an internal standard method based on the
peak area ratio of the analyte/I.S. vs the amount of each
analyte.
Sample Preparation. To determine the content of four
marker compounds and pattern recognition analysis of A.
quinata samples, the dried stems powder were used for each
extraction. A. quinata stems samples were powdered and
sieved through 50 mesh, and about 0.20 g of the powder
were accurately weighed and added 10 mL of 70% meth-
anol, accurately measured weight and ultrasonically extract-
ed for 60 minutes at 40 oC. The solution was cooled, weigh-
ed again, and made up the loss in weight with 70% meth-
Figure 1. Chemical structures of marker compounds 1-4.

1958 Bull. Korean Chem. Soc. 2014, Vol. 35, No. 7 Nguyen Thi Yen et al.
anol. The sample mixture was filtered through 0.45 µM
membrane filter (Whatman), then 10 µL of aliquot from the
filtrate was subjected to HPLC analysis.
Preparation of Standard Solutions. Based on the solu-
bility of each component in MeOH, standard stock solutions
(1000 µg/mL) were prepared by dissolving each reference
compound in MeOH and then preserved in a refrigerator at
less than 4 oC. Working standard solutions were prepared by
serial dilution of stock solutions with MeOH. Linear regre-
ssion equations were determined by calculation of integrated
peak areas (y) of six serial minimum concentrations versus
each concentration (x, µg/mL).
Linearity, Calibration Range, Limits of Detection, and
Quantification. MeOH stock solution, which contained four
compounds, was prepared and diluted to an appropriate
concentration for the construction of calibration curves. Six
concentration levels (3.125, 6.25, 12.5, 25.0, 50.0 and 100.0
µg/mL) of the mixed standard solution were injected in
triplicate. The calibration curves were constructed by plott-
ing the peak area ratio (phenolic/IS) versus the amount of
each compound. The good linearity (correlation coefficient
values R2 > 0.9983) was achieved in relatively wide con-
centration ranging from 3.125 to 100.0 µg/mL for all the
compounds. The lowest concentration of working solution
was diluted with methanol to yield a series of appropriate
concentrations, and the limit of detection (LOD) and quanti-
fication (LOQ) under the chromatographic conditions were
separately determined at signal-to-noise ratio (S/N) of about
3 and 10, respectively. The data are summarized in Table 1.
Precision and Accuracy. The precision and accuracy of
the method were assessed by analyzing three control samples
at concentrations of 6.25; 50.0; 100.0 µg/mL. Intra-day
precision and accuracy were determined by analyzing five
replicates of each of control samples described above on a
single day. Accuracy was calculated by dividing the mea-
sured mean phenolic concentration by the theoretical mean
phenolic concentration. Precision was expressed as the
coefficient of variation (CV, %), calculated as the ratio of the
standard deviation to the measure mean phenolic concent-
ration. The remaining quality control samples had intra-
assay precision below 3.91% and accuracy between 98.61%
and 105.79%. The inter-day precision and accuracy were
evaluated from the variability of multiple analyses (n = 5) of
quality control samples analyzed on a single analytical run
and extended for three days. The remaining quality control
samples had inter-assay precision below 3.91% and accuracy
between 93.33% and 105.34%. Precision and accuracy data
are presented in Table 2.
Stability. The mixture of four marker compounds was
divided into two parts: one was stored at 5 oC and another
was kept at room temperature. Two parts were analyzed in
triplicate at 0, 1, 3, 5, 10, 15, 30 days. The resulting data
indicated that marker compounds 1 and 2 remained stable
more than 96.36% while compounds 3 and 4 signified
Figure 2. Representative HPLC chromatograms of mixed standards (a) and the extract of A. quinata stems (b) at 280 nm. The UV spectracorresponding to the phenolic compounds are shown above the chromatogram. Key to peak identification: 1, cuneataside D; 2, 2-(3,4-dihydroxyphenyl)ethyl-O-β-D-glucopyranoside; 3, 3-caffeoylquinic acid; 4, calceolarioside B and peak ‘IS’ was internal standard.

Pattern Analysis of Akebia quinata by HPLC Bull. Korean Chem. Soc. 2014, Vol. 35, No. 7 1959
lability in room temperature during the experiment period
(Figure 3).
Recovery. To determine the effectiveness of this method,
recovery experiment was carried out. Accurate amounts of
the four standards were added into a sample of A. quinata,
which was quantified previously. The mixture was extracted
and compounds using the above-established method. Each
sample was analyzed in triplicate. For comparison, a blank
sample (not spiked with standard compounds) was prepared
and analyzed. The average percentage recoveries were
evaluated by calculating the ratio of detected amount versus
added amount. As shown in Table 3, the recovery rates were
Table 1. Calibration data for 4 marker compounds 1-4 (n = 3)
CompoundRegression equation Linear range
(µg/mL)
LOD
(ng/mL)
LOQ
(ng/mL)(y = ax + b)a R2
1
2
3
4
y = 0.0054x + 0.0099
y = 0.0062x + 0.0116
y = 0.0277x + 0.0258
y = 0.0321x + 0.0393
0.9988
0.9983
0.9993
0.9995
3.125-100
3.125-100
3.125-100
3.125-100
89.58
70.35
16.34
13.31
298.60
235.51
54.46
44.35
ay is the peak area ratio (peak area/IS area), x is the corresponding injection concentration (µg/mL), a is the slope and b is the intercept of the regressionline, R2 is correlation coefficient.
Table 2. Precision and accuracy of analytical results
Compounds
Norminal
Conc.
(µg/mL)
Intra- day Inter- day
Observed
(µg/mL)
Accuracy
(%)
Precision
(C.V., %)
Observed
(µg/mL)
Accuracy
(%)
Precision
(C.V., %)
1
100.00 104.04 104.04 1.83 104.30 104.30 3.63
50.00 52.89 105.79 3.91 51.79 103.57 5.16
6.25 6.44 103.13 2.50 6.52 104.32 2.77
2
100.00 102.09 102.11 1.82 103.52 103.52 2.31
50.00 49.02 98.61 1.51 46.66 93.33 1.87
6.25 6.03 103.59 3.23 6.27 100.31 1.81
3
100.00 101.81 101.81 3.35 105.34 105.34 5.38
50.00 52.35 104.03 1.22 49.26 98.53 1.48
6.25 6.55 104.89 3.54 6.07 97.19 0.68
4
100.00 103.54 103.54 2.51 104.40 104.40 2.53
50.00 50.91 101.83 0.90 49.20 98.40 1.08
6.25 6.39 102.34 3.59 5.99 95.97 0.60
Figure 3. Stability of marker compounds 1-4.
Table 3. Recovery of marker compounds through addition standard(n = 5)
CompoundsOriginal
(µg/mL)
Added
(µg/mL)
Calconc.
(µg/mL)
Recovery
(%)SD
1 0.00
12.5
25.0
50.0
11.56
23.37
48.76
92.47
93.48
97.52
1.27
1.60
2.86
2 25.10
12.5
25.0
50.0
37.53
48.09
72.30
99.43
91.96
94.40
4.58
1.50
1.09
3 268.12
12.5
25.0
50.0
279.65
294.31
317.59
92.25
104.79
98.95
2.18
1.94
4.87
4 9.46
12.5
25.0
50.0
22.80
35.23
61.42
106.76
103.12
103.93
2.22
0.30
3.49

1960 Bull. Korean Chem. Soc. 2014, Vol. 35, No. 7 Nguyen Thi Yen et al.
in the range 91.96-104.79%, and their RSD values were less
than 5%.
Robustness. The robustness of the method was studied by
introducing changes in column (i.e. Agilent Eclipse XDB-
C18 (5.0 µm, 150 × 4.6 mm i.d.), Shisheido Capcell pak C18
(5.0 µm, 250 × 4.6 mm i.d.), Waters Xselect HSS C18 (5.0
µm, 250 × 4.6 mm i.d.), separation flow (i.e. 0.8 mL/min,
1.0 mL/min, 1.2 mL/min) (Table 4) and separation temper-
ature (i.e. 25, 30, 35, and 40 oC).
Pattern Recognition Analysis. Hierarchical clustering
analysis (HCA) is a multivariate analysis technique that is
used to sort samples into groups. Owing to its unsupervised
character, HCA is a pattern recognition technique that
performed on autoscaled data, sample similarities were
calculated on the basis of the squared Euclidean distance and
the Ward hierarchical agglomerative method was used to
establish clusters. The similarity or dissimilarity between
samples is usually represented in a dendrogram for ease of
interpretation. Each sample is similar to the others within a
group but different from those in other groups with respect
to a predetermined selection criterion.16 In this study we
used four marker compound contents [cuneataside D (1), 2-
(3,4-dihydroxyphenyl)ethyl-O-β-D-glucopyranoside (2), 3-
caffeoylquinic acid (3), and calceolarioside B (4)] for con-
ducting pattern recognition analysis using software package
IBM SPSS Statistics 19.0 to evaluate the phyto-chemical
equivalency among fifty three samples [forty six A. quinata
samples (AQ1-AQ41; AQ44-AQ48), two C. armandii samples
(CA42, CA49), two A. trifloliata samples (AT50, AT51),
two A. manshuriensit samples (AM52, AM53) and a sample
of T. papyriferus (TP43)] (Figure 6).
Results and Discussion
Optimization of Extraction Method. To achieve a com-
plete extraction of the components studied from Akebia
Table 4. Robustness
Analytes
1 2 3 4
Mean SD Mean SD Mean SD Mean SD
Column Theoretical plate (N)
Aligent 7465 1018 9716 1674 11319 626 34345 1868
Xselect 9353 992 11371 695 13634 1684 51189 2574
Shishedo 4510 635 4742 131 14958 119 28001 3039
Capacity factor (k')
Aligent 3.45 0.07 4.12 0.09 7.28 0.18 13.23 0.42
Xselect 3.34 0.02 4.15 0.01 7.07 0.01 12.92 0.03
Shishedo 3.12 0.08 3.72 0.10 7.04 0.21 11.80 0.48
Separation factor (α)
Aligent 1.15 0.00 1.62 0.01 1.72 0.01 0.96 0.01
Xselect 1.19 0.00 1.57 0.00 1.72 0.00 1.02 0.00
Shishedo 1.15 0.00 1.70 0.01 1.59 0.02 0.98 0.00
Resolution (Rs)
Aligent 3.21 0.24 12.15 0.45 19.21 0.23 2.06 0.34
Xselect 4.38 0.08 12.40 0.24 23.49 0.82 1.40 0.03
Shishedo 2.31 0.07 9.07 0.03 12.54 0.07 0.91 0.17
Flow rate
(mL/min)
Theoretical plate (N)
0.8 6013 381 9741 887 11443 1931 40305 8570
1.00 7465 1018 9716 1674 11319 626 34345 1868
1.2 3997 451 6945 177 9294 138 21608 2204
Capacity factor (k')
0.8 3.62 0.11 4.32 0.11 7.59 0.20 13.33 0.45
1.00 3.45 0.07 4.12 0.09 7.28 0.18 13.23 0.42
1.2 4.64 0.13 5.57 0.14 10.37 0.29 19.26 0.61
Separation factor (α)
0.8 1.15 0.00 1.61 0.00 1.67 0.02 0.97 0.01
1.00 1.15 0.00 1.62 0.01 1.72 0.01 0.96 0.01
1.2 1.17 0.00 1.73 0.01 1.78 0.01 0.89 0.01
Resolution (Rs)
0.8 3.10 0.07 12.14 0.79 18.82 1.46 1.34 0.38
1.00 3.21 0.24 12.15 0.45 19.21 0.23 2.06 0.34
1.2 2.78 0.07 12.18 0.07 17.38 0.59 5.59 0.43

Pattern Analysis of Akebia quinata by HPLC Bull. Korean Chem. Soc. 2014, Vol. 35, No. 7 1961
quinata, four solvent systems including methanol, 70%
methanol, ethanol, and 70% ethanol were used for the test.
The extraction efficiencies of all the components from each
solvent extraction systems were obtained and compared. The
results indicated that for compound 1, the methanol and 70%
methanol solvent systems were more efficient than the
ethanol and 70% ethanol solvent systems. For compounds 2
and 3, 70% methanol was most efficient. In addition, the
effects of the extraction time and methods on the extraction
efficiency were investigated using three different methods,
i.e. shaking, refluxing and sonication for 30, 60 and 120 min.
The results showed that sonication for 60 min using 70%
methanol was the preferred procedure (Figure 4). Plant
materials contain a wide variety of different ballast compounds
that can interfere with the analytical compounds and can
damage the analytical column. Therefore, a series of con-
centration extracts of A. quinata were tested to determine a
more appropriate level. A 20 µg/mL extract of A. quinata
was obtained by sample preparation that showed good
separation and prevented overlap of the peaks due to over-
load.
Optimization of HPLC Conditions. A HPLC method
was developed to separate and quantify all the analyzed
ingredients of A. quinata. The effects of the composition of
the mobile phase on separation were tested to optimize the
chromatographic condition. At the beginning, acetonitrile
was used because of its lower viscosity. This helps reduce
the back pressure and obtain results with a slightly better
peak shape. Unfortunately, cuneataside D (1) and 2-(3,4-
dihydroxyphenyl)ethyl-O-β-D-glucopyranoside (2) are polar.
Therefore, it is important to reduce the percentage of organic
components in the mobile phase to increase the compound’s
retention. With 2% acetonitrile, compounds 1 and 2 were
eluted at 6.25 and 7.25 min, respectively, with just a 20
minute total runtime. Because a low percentage of organic
solvent was used continuously, the de-wetting problem
occurred. The chromatogram showed complete loss of reten-
tion because the low organic or pure aqueous mobile phase
is expelled from the pores (dewetted) whereas the retentivity
is a function of the surface area and ligand density. On the
other hand, if the surface is non-wetted, then the effective
chromatographic surface area is reduced > 95%. Therefore,
the retentivity of the analyte was reduced. This means that
the poor capture or otherwise is “hydrophobic collapse”. For
this reason, methanol was used instead. Equilibration of the
column with 5% methanol allowed superior separation and
the more economical use of methanol for routine analysis
than acetonitrile. The retention time of compounds 1 and 2
was 10.49 and 12.06 min, respectively (Figure 2). Further-
more, initial screening experiments showed that the mobile
phase needed to be acidic. As a result, methanol and 0.05%
TFA aqueous were chosen as the eluting solvent system to
achieve the desired separation and acceptable tailing factor
within a running time of 50 min.
The robustness was determined to evaluate the reliability
of established HPLC methods. The theoretical plate number
(N), capacity factor (k'), separation factor (α), and resolution
(Rs) were evaluated. To examine the suitability of three
different columns, Eclipse XDB C18, Capcell pak C18 and
Xselect HSS C18 columns with a particle size of 5 μm were
used. The column temperature was controlled to 30 °C and
the flow rate was kept at 1.0 mL/min. All these compounds
showed a capacity for separation of the band center. Although
the Water Xselect HSS C18 achieves a high resolution and
good peak sharp as Agilent Eclipse XDB-C18, it takes
longer time for elution. The Xselect HSS C18 column and
Capcell pak C18 did not separate compound 4 and the
internal standard at a 1.2 and 0.8 mL/min flow rate, respec-
tively. In contrast, the Agilent Eclipse XDB-C18 column
showed good resolution at all flow rates. With a flow rate of
1.0 mL/min, the Agilent column had the highest theoretical
plate with good resolution of most analytes. The separation
temperature was evaluated at 25, 30, 35, and 40 °C with
regard to four analytical factors using the Agilent column.
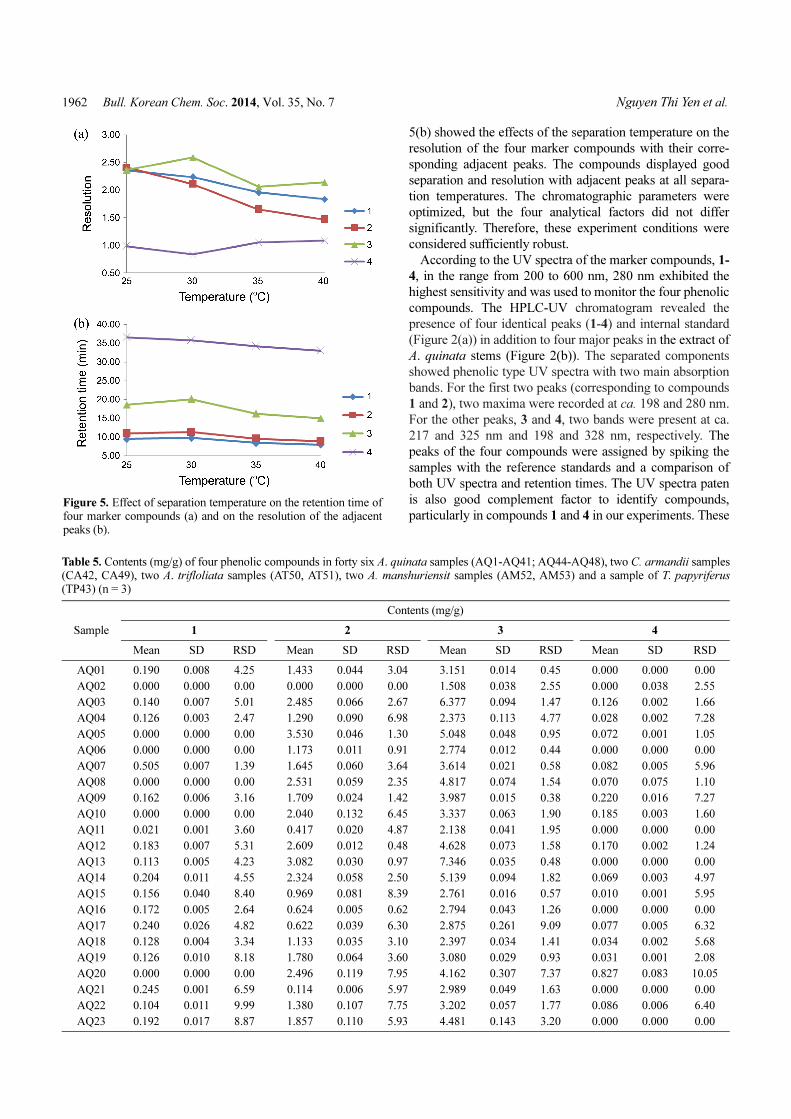
The retention time of the marker compounds, 1-4, decreased
with increasing separation temperature (Figure 5(a)). Figure
Figure 4. Effect of extraction time and method on the yields (mg/g) of marker compounds 1-4.
1962 Bull. Korean Chem. Soc. 2014, Vol. 35, No. 7 Nguyen Thi Yen et al.
5(b) showed the effects of the separation temperature on the
resolution of the four marker compounds with their corre-
sponding adjacent peaks. The compounds displayed good
separation and resolution with adjacent peaks at all separa-
tion temperatures. The chromatographic parameters were
optimized, but the four analytical factors did not differ
significantly. Therefore, these experiment conditions were
considered sufficiently robust.
According to the UV spectra of the marker compounds, 1-
4, in the range from 200 to 600 nm, 280 nm exhibited the
highest sensitivity and was used to monitor the four phenolic
compounds. The HPLC-UV chromatogram revealed the
presence of four identical peaks (1-4) and internal standard
(Figure 2(a)) in addition to four major peaks in the extract of
A. quinata stems (Figure 2(b)). The separated components
showed phenolic type UV spectra with two main absorption
bands. For the first two peaks (corresponding to compounds
1 and 2), two maxima were recorded at ca. 198 and 280 nm.
For the other peaks, 3 and 4, two bands were present at ca.
217 and 325 nm and 198 and 328 nm, respectively. The
peaks of the four compounds were assigned by spiking the
samples with the reference standards and a comparison of
both UV spectra and retention times. The UV spectra paten
is also good complement factor to identify compounds,
particularly in compounds 1 and 4 in our experiments. TheseFigure 5. Effect of separation temperature on the retention time offour marker compounds (a) and on the resolution of the adjacentpeaks (b).
Table 5. Contents (mg/g) of four phenolic compounds in forty six A. quinata samples (AQ1-AQ41; AQ44-AQ48), two C. armandii samples(CA42, CA49), two A. trifloliata samples (AT50, AT51), two A. manshuriensit samples (AM52, AM53) and a sample of T. papyriferus(TP43) (n = 3)
Sample
Contents (mg/g)
1 2 3 4
Mean SD RSD Mean SD RSD Mean SD RSD Mean SD RSD
AQ01 0.190 0.008 4.25 1.433 0.044 3.04 3.151 0.014 0.45 0.000 0.000 0.00
AQ02 0.000 0.000 0.00 0.000 0.000 0.00 1.508 0.038 2.55 0.000 0.038 2.55
AQ03 0.140 0.007 5.01 2.485 0.066 2.67 6.377 0.094 1.47 0.126 0.002 1.66
AQ04 0.126 0.003 2.47 1.290 0.090 6.98 2.373 0.113 4.77 0.028 0.002 7.28
AQ05 0.000 0.000 0.00 3.530 0.046 1.30 5.048 0.048 0.95 0.072 0.001 1.05
AQ06 0.000 0.000 0.00 1.173 0.011 0.91 2.774 0.012 0.44 0.000 0.000 0.00
AQ07 0.505 0.007 1.39 1.645 0.060 3.64 3.614 0.021 0.58 0.082 0.005 5.96
AQ08 0.000 0.000 0.00 2.531 0.059 2.35 4.817 0.074 1.54 0.070 0.075 1.10
AQ09 0.162 0.006 3.16 1.709 0.024 1.42 3.987 0.015 0.38 0.220 0.016 7.27
AQ10 0.000 0.000 0.00 2.040 0.132 6.45 3.337 0.063 1.90 0.185 0.003 1.60
AQ11 0.021 0.001 3.60 0.417 0.020 4.87 2.138 0.041 1.95 0.000 0.000 0.00
AQ12 0.183 0.007 5.31 2.609 0.012 0.48 4.628 0.073 1.58 0.170 0.002 1.24
AQ13 0.113 0.005 4.23 3.082 0.030 0.97 7.346 0.035 0.48 0.000 0.000 0.00
AQ14 0.204 0.011 4.55 2.324 0.058 2.50 5.139 0.094 1.82 0.069 0.003 4.97
AQ15 0.156 0.040 8.40 0.969 0.081 8.39 2.761 0.016 0.57 0.010 0.001 5.95
AQ16 0.172 0.005 2.64 0.624 0.005 0.62 2.794 0.043 1.26 0.000 0.000 0.00
AQ17 0.240 0.026 4.82 0.622 0.039 6.30 2.875 0.261 9.09 0.077 0.005 6.32
AQ18 0.128 0.004 3.34 1.133 0.035 3.10 2.397 0.034 1.41 0.034 0.002 5.68
AQ19 0.126 0.010 8.18 1.780 0.064 3.60 3.080 0.029 0.93 0.031 0.001 2.08
AQ20 0.000 0.000 0.00 2.496 0.119 7.95 4.162 0.307 7.37 0.827 0.083 10.05
AQ21 0.245 0.001 6.59 0.114 0.006 5.97 2.989 0.049 1.63 0.000 0.000 0.00
AQ22 0.104 0.011 9.99 1.380 0.107 7.75 3.202 0.057 1.77 0.086 0.006 6.40
AQ23 0.192 0.017 8.87 1.857 0.110 5.93 4.481 0.143 3.20 0.000 0.000 0.00

Pattern Analysis of Akebia quinata by HPLC Bull. Korean Chem. Soc. 2014, Vol. 35, No. 7 1963
compounds are found in small amounts and are difficult to
recognize them among closely eluting compounds.
Sample Analysis. The established analytical method was
then used to quantitatively analyze four marker compounds
1-4 in 46 samples of A. quinata (AQ1-AQ41; AQ44-AQ48)
and 7 comparative samples including 2 samples of the same
genus [A. trifloliata samples (AT50, AT51)] and 5 different
genus samples [one T. papyriferus (TP43), two A. manshuri-
ensis (AM52, AM53) and two C. armandii (CA42, CA49)]
using the regression equation described above. Each sample
was analyzed in triplicate to ensure reproducibility of the
quantitative result. Table 5 lists their contents. The data
revealed the highly variable contents of the four marker
compounds in samples. In 46 samples of A. quinata, the
contents of compound 3 ranged from 1.66 to 5.64 mg/g. This
was found to be the most abundant component in most
samples, whereas compounds 1 and 4 were found in small
amounts. In addition, the content of compound 2, ranging
from 0.72 to 2.68 mg/g was also high in large samples.
In the comparative group, none of the four marker com-
pounds were detected in C. armandii, whereas compound 4
was detected in the A. manshuriensis samples. Two samples
of A. trifloliata and one sample of T. papyriferus contained
only compounds 3 and 4. Compound 2 was observed in all
A. quinata samples but was not detected in the comparative
samples. This discrepancy induced discrimination between
A. quinata and comparative herbs.
Pattern Recognition Analysis. A hierarchical clustering
analysis of 53 samples by using IBM SPSS Statistics 19.0
software was performed (Figure 6). The original data for
HCA were exported from contents of the four marker
compounds in samples (Table 5). As is shown in Fig. 6, the
samples could be clustered into two groups, A (A. quinata)
and B (comparative samples). There were two main clusters
corresponding to different origins of samples in dendrogram,
while the subsets gave more information on the samples of
different batches. Therefore, pattern-recognition analysis can
provide more comprehensive information for the chemical
equivalency that can identify Akebia species and discriminate
A. quinata from the other plants.
Table 5. Continued
Sample
Contents (mg/g)
1 2 3 4
Mean SD RSD Mean SD RSD Mean SD RSD Mean SD RSD
AQ24 0.260 0.009 3.11 0.500 0.025 5.09 4.153 0.015 0.35 0.000 0.000 0.00
AQ25 0.000 0.000 0.00 2.018 0.006 3.29 3.463 0.043 1.23 0.015 0.000 2.25
AQ26 0.135 0.020 3.84 1.549 0.031 1.97 2.966 0.054 1.83 0.000 0.000 0.00
AQ27 0.000 0.016 2.97 0.523 0.017 3.49 3.247 0.090 2.78 0.000 0.000 0.00
AQ28 0.118 0.004 3.38 2.305 0.069 3.00 4.447 0.169 3.79 0.050 0.005 10.11
AQ29 0.000 0.000 0.00 1.328 0.029 2.17 2.455 0.042 1.69 0.014 0.001 9.57
AQ30 0.000 0.000 0.00 2.141 0.045 2.09 3.314 0.016 0.49 0.010 0.001 8.88
AQ31 0.000 0.000 0.00 2.153 0.021 0.99 3.240 0.030 0.92 0.023 0.001 4.53
AQ32 0.000 0.000 0.00 1.501 0.008 0.55 4.603 0.011 0.24 0.000 0.000 0.00
AQ33 0.134 0.003 2.49 1.217 0.041 3.34 3.469 0.069 1.98 0.000 0.000 0.00
AQ34 0.155 0.006 9.74 1.479 0.047 3.36 2.691 0.237 8.79 0.061 0.007 10.24
AQ35 0.000 0.000 0.00 3.179 0.038 1.18 4.259 0.012 0.28 0.000 0.000 0.00
AQ36 0.000 0.000 0.00 0.634 0.018 2.85 4.044 0.053 1.32 0.357 0.014 4.05
AQ37 0.000 0.000 0.00 0.947 0.050 5.29 2.108 0.028 1.31 0.023 0.002 8.92
AQ38 0.000 0.000 0.00 2.700 0.048 1.79 3.718 0.003 0.08 0.088 0.004 4.24
AQ39 0.000 0.000 0.00 2.425 0.067 2.78 3.910 0.073 1.86 0.073 0.006 8.69
AQ40 0.100 0.002 2.29 0.226 0.020 8.67 1.587 0.024 1.53 0.087 0.002 2.25
AQ41 0.120 0.002 8.79 1.021 0.065 6.35 1.900 0.044 2.32 0.066 0.005 8.16
CA42 0.000 0.000 0.00 0.000 0.000 0.00 0.000 0.000 0.00 0.000 0.000 0.00
TP43 0.000 0.000 0.00 0.000 0.000 0.00 0.920 0.028 2.80 2.448 0.226 9.23
AQ44 0.000 0.000 0.00 0.508 0.017 3.37 4.055 0.343 8.25 0.066 0.006 9.82
AQ45 0.000 0.000 0.00 4.223 0.088 2.08 5.081 0.107 2.11 0.077 0.005 6.46
AQ46 0.000 0.000 0.00 2.698 0.104 3.87 5.611 0.170 3.02 0.758 0.008 1.11
AQ47 0.000 0.000 0.00 3.128 0.180 5.74 4.801 0.380 7.91 0.000 0.000 0.00
AQ48 0.000 0.012 8.96 2.629 0.135 5.15 3.859 0.201 5.20 0.000 0.000 0.00
CA49 0.000 0.000 0.00 0.000 0.000 0.00 0.000 0.000 0.00 0.000 0.000 0.00
AT50 0.000 0.000 0.00 0.000 0.000 0.00 0.854 0.085 9.29 0.654 0.065 9.97
AT51 0.000 0.000 0.00 0.000 0.000 0.00 0.180 0.013 7.34 0.320 0.021 6.68
AM52 0.000 0.000 0.00 0.000 0.000 0.00 0.000 0.000 0.00 0.573 0.015 2.64
AM53 0.000 0.000 0.00 0.000 0.000 0.00 0.000 0.000 0.00 0.855 0.026 3.01

1964 Bull. Korean Chem. Soc. 2014, Vol. 35, No. 7 Nguyen Thi Yen et al.
Conclusion
In this study, qualitative and quantitative analyses of the
phenolic substances of A. quinata were performed including
optimization of the extraction method and the experiment
for validation along with the pattern-recognition method.
Based on these results, this HPLC method was proven to be
a simple, accurate and reasonable analytical method for the
simultaneous quantification of the four phenolic compounds
in the A. quinata. The developed assay was applied success-
fully to quantify the phenolic compounds in 46 batches of
the A. quinata collected from different locations in Korea
and China. The variation in the contents of the main com-
pounds affects the quality, stability and therapeutic effects of
this medicinal herb. Therefore, the simultaneous determina-
tion of the major-components can play an important role in a
quality evaluation, used part, and on guidance for the good
crude drug source of A. quinata. These results confirm that
compound 2 can serve as a marker compound to distinguish
A. quinata and some plants prescribed as the source plants of
Akebia plants e.g. A. manshuriensis, Aristolochiaceae, and
Clematis spp., Ranunculaceae. Furthermore, the combination
of quantitative analysis and pattern-recognition analysis was
found to be a more comprehensive technique than quanti-
tative analysis alone for quality control and species identi-
fication of the Akebia quinata herbal drug.
Acknowledgments. This work was supported by a grant
from the National Center for Standardization of Herbal
Medicine funded by the Ministry of Food and Drug Safety,
Republic of Korea (12172MFDS890 and 13182MFD602)
and National Research Foundation of Korea (BK21 Plus;
22A20130000073).
References
1. Kitaoka, F.; Kakiuchi, N.; Long, C.; Itoga, M.; Mitsue, A.; Mouri,
C.; Mikage, M. Biol. Pharm. Bull. 2009, 32, 665. 2. Kawata, J.; Kameda, M.; Miyazawa, M. J. Ole Sci. 2007, 56, 59.
3. Minaki, Y.; Kuroda, M.; Yokosuka, A.; Harada, H.; Fukushima,
A.; Sashida, Y. Chem. Pharm. Bull. 2003, 51, 960. 4. Nortier, J. L.; Vanherweghem, J. L. Toxicology 2002, 181-182,
577.
5. Notice from the State Food and Drug Administration of P. R.China, issued on April 1, 2003.
6. Wang, Y.; Lu, J.; Lin, R. C. Chin. Tradit. Herb Drugs 2004, 35,
495. 7. Liu, G. Y.; Ma, S. C.; Zheng, J.; Zhang, J.; Lin, R. C. J. Integr.
Plant Biol. 2007, 49, 196.
8. Gao, H. M.; Wang, Z. M. Phytochemistry 2006, 67, 2697. 9. Kwon, S. H.; Lee, H. K.; Kim, J. A.; Hong, S. I.; Kim, H. C.; Jo,
T. H.; Park, Y. I.; Lee, C. K.; Kim, Y. B.; Lee, S. Y.; Jang, C. G.
Eur. J. Pharmacol. 2010, 649, 210.10. Santo, M. D.; Almeida, M. C.; Lopes, N. P.; de Souza, G. E. Biol.
Pharm. Bull. 2006, 29, 2236.
11. Lapchak, P. A. Exp. Neurol. 2007, 205, 407.12. Bouayed, J.; Rammal, H.; Dicko, A.; Younos, C.; Soulimani, R. J.
Neurol. Sci. 2007, 262, 77.
13. Basnet, P.; Matsushige, K.; Hase, K.; Kadota, S.; Namba, T. Biol.Pharm. Bull. 1996, 19, 1479.
14. Azzini, E.; Bugianesi, R.; Romano, F.; Di Venere, D.; Miccadei,
S.; Durazzo, A.; Foddai, M.S.; Catasta, G.; Linsalata, V.; Maiani,G. Br. J. Nutr. 2007, 97, 963.
15. Kim, H. J.; Yu, Y. J.; Park, H. Planta. Med. 2002, 68, 1034.
16. Lu, X. F.; Bi, K. S.; Zhao, X.; Chen, X. H. J. Pharm. Anal. 2012,2, 327.
Figure 6. Pattern analysis of 53 samples. (A) A. quinata (AQ1-AQ41; AQ44-AQ48), (B) [C. armandii (CA42, CA49), A. trifloliata (AT50,AT51), A. manshuriensit (AM52, AM53) and T. papyriferus (TP43)].