quantitative evaluation of the determinants of resolution in time-of-flight spectrometers for medium...
TRANSCRIPT
Quantitative evaluation of the determinants of resolution in time-of-¯ight spectrometers for medium energy ion beam analysis
Kyle McDonald a, Robert A. Weller a,*, V.Kh. Liechtenstein b
a Vanderbilt University, Nashville TN 37235, USAb RRC ``Kurchatov Institute'', 123182 Moscow, Russian Federation
Received 1 September 1998; received in revised form 8 December 1998
Abstract
The determinants of resolution of a time-of-¯ight spectrometer for medium energy ion beam analysis have been
identi®ed and analyzed. The primary determinants are uncertainty of ion path length, kinematic dispersion from the
®nite detector solid angle, straggling in the start foil and variability of the start foil thickness. The ®rst three of these
have been considered in previous studies of time-of-¯ight spectrometer resolution, but foil non-uniformity has not been
examined in detail. Using backscattering analysis and atomic force microscopy, we have measured the thickness and
roughness of carbon start foils and found them to be larger than suggested by their nominal speci®cations. As a result,
energy uncertainty introduced by foil non-uniformity has been found to be a critical factor in determining resolution.
Using measured values of foil parameters and known geometric characteristics of our spectrometer, Monte Carlo
simulations of backscattering spectra of SiO2 thin ®lms on Si substrates have been computed and found to reproduce
well the experimentally observed system resolution of 1350 eV for 104 keV He. Additional simulations show that
spectrometer design changes could reduce this value to about 1 keV at which point it is, for all practical purposes,
optimum. Ó 1999 Elsevier Science B.V. All rights reserved.
PACS: 07.81.+a; 68.55.-a; 68.35.Bs; 61.18.Bn
Keywords: Time-of-¯ight spectrometer; Resolution; Thin ®lms; Carbon foils; Roughness; Backscattering spectrometry
1. Introduction
Backscattering spectrometry is a mature tech-nique widely used for the quantitative analysis ofthin ®lms and interfaces. In conventional back-scattering analysis a silicon surface barrier detector
is used for energy spectrometry. Although surfacebarrier detectors are extremely well suited to thisapplication, their resolution typically exceeds 10keV so that beam energies in the MeV range arerequired to achieve adequate di�erentiation ofimportant spectral features. Surface barrier detec-tors also degrade quickly when used to detectheavy ions. As a result, surface barrier detectorsare not well suited to experiments involving heavyions or reduced ion-beam energies, which
Nuclear Instruments and Methods in Physics Research B 152 (1999) 171±181
* Corresponding author. Tel.: 615-343-6027; fax: 615-343-
6614; e-mail: [email protected]
0168-583X/99/$ ± see front matter Ó 1999 Elsevier Science B.V. All rights reserved.
PII: S 0 1 6 8 - 5 8 3 X ( 9 8 ) 0 1 0 9 3 - 3
fundamental considerations of the collision crosssection suggest would lead to superior surfaceanalytical results.
A number of considerations, including similarstopping power, larger scattering cross section,and less radiation damage, point to the 100±300keV energy range as especially useful for ion beamanalysis, particularly of ultra-thin ®lms. However,alternatives to surface barrier detectors must beimplemented for particle spectrometry. Mostcommonly, electrostatic and time-of-¯ight spec-trometers have been used. Medium energy ionscattering using a toroidal electrostatic spectrom-eter has been shown to provide exceptional reso-lution, DE/E�10ÿ3, corresponding to a depthresolution <1 nm [1,2]. As a result, this techniquehas been singularly e�ective for analyzing ultrathin ®lms (�1±10 nm) [3±5]. However, an electro-static analyzer is sensitive to the charge state of thebackscattered particle and only limited energyranges can be measured at one time.
Time-of-¯ight spectrometry is an attractive al-ternative to electrostatic spectrometry for a num-ber of reasons. Originally developed for use innuclear physics to measure heavy ion reactions, its®rst application in materials analysis was forheavy-ion backscattering [6±9]. Time-of-¯ightspectrometers are insensitive to the charge state ofthe backscattered particle and can measure allenergies simultaneously, characteristics whichclosely parallel those of surface barrier detectors.Moreover, time-of-¯ight spectrometers can beoptimized for speci®c applications such as heavy
ion backscattering, where they deliver high sensi-tivity, mass and depth resolution [10].
The ®rst application of time-of-¯ight spec-trometry to surface analysis by medium energybackscattering is now almost a decade old [11,12].The original spectrometer designs proposed byMendenhall and Weller stressed simplicity andwere intended to yield medium energy backscat-tering spectra with information content similar tothat which is obtainable with a surface barrierdetector at conventional energies. However, it hasbecome apparent that with a properly designedsystem the ultimate resolution of the technique canbe very high, and that the information obtained,especially about ®lms <10 nm in thickness, cannotbe duplicated by conventional MeV backscatter-ing. It is thus natural to ask what factors controlthe resolution of a time-of-¯ight spectrometer andin what relative measure, so that a system can beoptimized for the best possible performance in thedepth pro®ling of ultra-thin ®lms.
2. Background
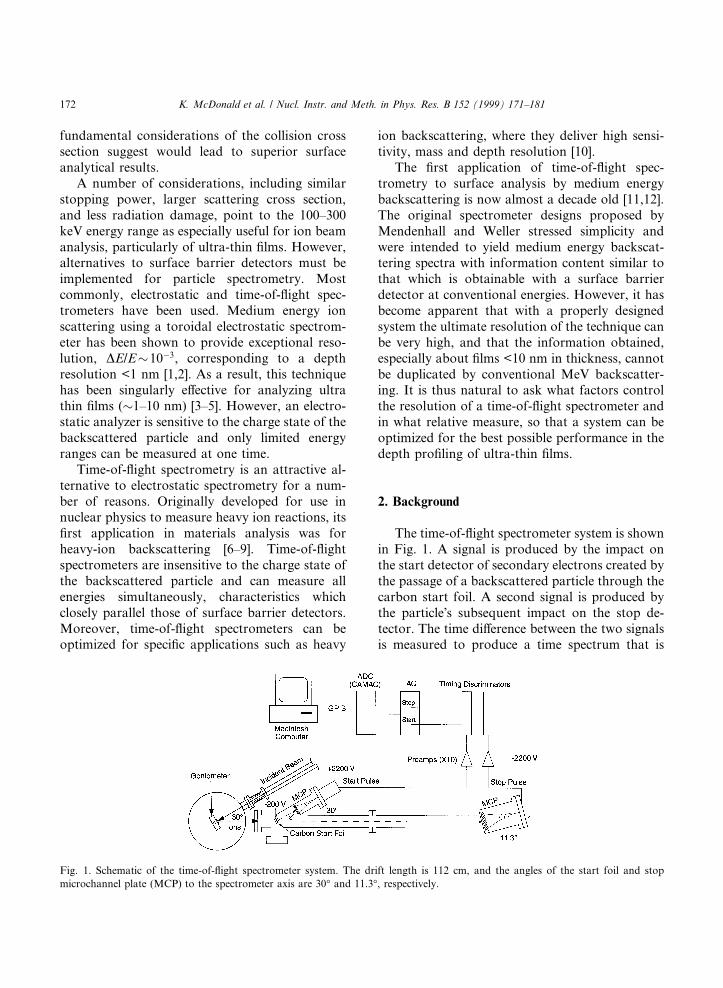
The time-of-¯ight spectrometer system is shownin Fig. 1. A signal is produced by the impact onthe start detector of secondary electrons created bythe passage of a backscattered particle through thecarbon start foil. A second signal is produced bythe particleÕs subsequent impact on the stop de-tector. The time di�erence between the two signalsis measured to produce a time spectrum that is
Fig. 1. Schematic of the time-of-¯ight spectrometer system. The drift length is 112 cm, and the angles of the start foil and stop
microchannel plate (MCP) to the spectrometer axis are 30° and 11.3°, respectively.
172 K. McDonald et al. / Nucl. Instr. and Meth. in Phys. Res. B 152 (1999) 171±181
then mathematically converted to an energy spec-trum for analysis.
The primary determinants of the resolution fora time-of-¯ight spectrometer are straggling in thestart foil, start foil thickness variability, ion pathlength uncertainty, and kinematic dispersion fromthe ®nite spectrometer acceptance angle. Chargeexchange in the start foil (which is biased at aboutÿ200 V with respect to ground), the intrinsic sec-ondary electron energy spectrum, the instrumentaltiming uncertainty, beam energy stability, strag-gling in the target, multiple scattering in the startfoil, target bias, and other processes a�ect themeasured resolution to a lesser extent. By opti-mizing the spectrometer design, the e�ects of theseprocesses can be substantially reduced, and thespectrometerÕs resolution can approach funda-mental physical limits.
Because the backscattered ion beam approxi-mates a point source originating from the target,there is a distribution of scattering angles forparticles entering the spectrometer. This angularspread leads to a distribution of ¯ight paths be-tween the start foil and stop detector and a dis-tribution of velocities associated with thekinematic factor. By adjusting the angle betweenthe start foil and the stop detector, the e�ects ofpath length di�erences and kinematic dispersioncan be reduced [13]. In the current spectrometercon®guration (Fig. 1), the scattering angle is 150°,the start foil is oriented 30° to the spectrometeraxis, and the stop detector angle is 11.3°. The stopdetector angle was calculated to minimize the pathlength di�erence and kinematic dispersion for he-lium scattering from silicon at 150° with a start foilangle of 30°. Slight ¯ight time di�erences ([1 ns)still exist for other target species because of kine-matic dispersion. Because the e�ects of path lengthdi�erence and kinematic dispersion are so closelycorrelated, henceforth in this paper they will becombined as a single e�ect, path length di�erences.
Because of the random nature of the depositionof the carbon foils, large errors (�25%) in thethickness are common [14,15]. Also, even thoughpure graphite is used to manufacture the foils,oxygen, hydrogen, and other impurities are easilyadsorbed from the deposition process and the re-lease agent [16±18]. Furthermore, because the re-
lease agent is itself an evaporated thin ®lm itssurface morphology will strongly in¯uence that ofthe carbon foil. As a result of these inherentcharacteristics, the foils are expected to be thickerand less uniform than their nominal values. If thefoil were uniform and only thicker than nominal,the expected energy loss and straggling in the foilwould increase. The resolution would be adverselya�ected due to the increase in straggling, but theextra width would simply add in quadrature to thenominal resolution. If the foil is non-uniform,however, the variation in thickness leads to a tra-jectory-dependent variation in the energy loss,straggling, and multiple scattering that broadensspectral features in a manner dependent on thethickness distribution. If the magnitude of thenon-uniformity and its e�ect on resolution aresmall, these questions could probably be ignoredand small corrections to calculations with thenominal thickness could be used. We have dis-covered, however, that not only can foil non-uni-formity not be ignored, but that it is a very largedeterminant of resolution.
In early work, we used a carbon start foil with aquoted areal density of 1.7� 5% lg/cm2. Themeasured resolution using this foil was 2.7 keV for104 keV helium ions. Monte Carlo simulations,however, predicted a resolution of 1.1 keV, and soa large constituent of the resolution was unex-plained. Published analyses of spectrometer reso-lution associated all unexplained extra width withpath length uncertainty [8,19]. However, back-scattering analysis of the foil showed that thethickness was 2.6 lg/cm2 and highly non-uniform.Atomic force microscopy (see Fig. 2(a)) con®rmedthis result by showing that the foils, measured tobe 13 nm thick, had a root-mean-square (rms)roughness of 10 nm [20]. These observations sug-gested strongly that the carbon foil morphologywas in¯uencing spectrometer resolution morestrongly than had previously been appreciated.
This paper presents the results of a program toidentify and quantify all the signi®cant elements ofresolution for the tilted-start-foil spectrometer de-sign ®rst proposed in Ref. [11] (Fig. 1). The spec-trometer resolution was determined bybackscattering analysis of high-quality SiO2 thin®lms on Si. We introduce a method to parameterize
K. McDonald et al. / Nucl. Instr. and Meth. in Phys. Res. B 152 (1999) 171±181 173

the foil non-uniformity that is distinct from simplerms surface roughness and measure the relevantparameters experimentally. These parameters arethen combined with known geometrical factors toproduce Monte Carlo simulations of the SiO2
backscattering spectra that are in excellent agree-ment with experimental observations. By extendingthese simulations to other geometries, we suggestthe optimum spectrometer con®guration and pre-dict its resolution for both real and ideal start foils.
3. Procedure
In order to minimize the contribution ofstraggling to resolution and to reduce the e�ects of
multiple scattering in the start foil, diamond-likecarbon foils with a nominal diameter of 1.27 cmand thickness of 0.6 lg/cm2 were produced andmounted on gridded apertures [21,22]. These areapproximately as thin as it is possible to make aself-supporting foil even over a gridded opening.The foils are deposited by sputtering pure graphitein a low-density krypton plasma and are consid-ered hydrogen free [23]. Atomic force microscopywas used to evaluate surface morphology of thefoil and measure the rms roughness.
To measure the energy resolution of the spec-trometer, ion backscattering spectra were taken ofa set of high-quality SiO2/Si samples with oxidethicknesses from 2 to 12 nm. The samples wereanalyzed using a 270 keV He beam with a scat-tering angle of 150°. The beam currents were 30±100 nA with a total dose of 1015 He ions, and thebeam spot size was 5 mm2. The samples were tilted45° to the incident ion beam (75° to the spec-trometer) with an exit angle of 15° to the sampleplane. This angle was used to orient the siliconsubstrate in the á11 0ñ channeling direction to re-duce the silicon background in the region of thespectrum containing the oxygen peak. This orien-tation also has a depth resolution �3 times greaterthan normal incidence. To determine if there is anenergy that optimizes the depth resolution forbackscattering from oxygen at 45°, additionalspectra were taken at beam energies from 150 to270 keV in 15 keV increments.
The oxygen peaks were ®t with the followingsemi-empirical function
f �E� �c0 � c1E � Hm������2pp r2Exp
ÿ�E ÿ E2�22r2
2
! "
ÿr1Expÿ�E ÿ E1�2
2r21
!!#
� H1
21� m E
��ÿ E1 � E2
2
� ����� Erf
E ÿ E2���2p
r2
� �ÿ Erf
E ÿ E1���2p
r1
� �� ���1�
which is derived from the convolution of a nega-tively sloped line segment extending from E2 to E1,
Fig. 2. (a) Atomic force microscope image of a C foil measured
to be 2.6 lg/cm2 (13 nm) thick exhibiting an rms roughness of
10 nm. (b) Atomic force microscope image of a diamond-like
carbon foil measured to be 1.2 lg/cm2 (6 nm) thick with an rms
roughness of 6 nm.
174 K. McDonald et al. / Nucl. Instr. and Meth. in Phys. Res. B 152 (1999) 171±181

representing the oxygen peak, and a Gaussianweight function of constant width, which repre-sents straggling and the system resolution. Sincethe system resolution and straggling are actuallyfunctions of energy and not constant, a correctionis made to the convolution by having di�erentwidths for the front and back edges. This functionis superimposed on a linear background from thesilicon in the spectrum. E1 and E2 are the energiesof the front (surface) and back (buried interface)edges of the peak, respectively, and r1 and r2 arethe front and back edge widths expressed asstandard deviations. H is the height of the centerof the peak, m the slope parameter of the top ofthe peak determined by the scattering cross sec-tion, and c0 and c1 are the intercept and slope ofthe linear background. The adjustable parametersof the equation are E1, E2, r1, r2, H, c0, and c1.The slope parameter, m, was determined fromspectrum simulations and held constant during the®t. Resolution as used in this paper is de®ned asthe full width at half maximum of an isolatedGaussian peak, or equivalently, the width of theedge of an error function from 12% to 88% of theedge height. This value is 2.35 times the corre-sponding standard deviation. The resolution of thespectrometer was assumed to be equal to the frontedge width of the oxygen peak.
Backscattering analysis was also used to deter-mine the diamond-like carbon foil thickness andnon-uniformity. Spectra were taken of a baretantalum sample and of a diamond-like carbon foilnominally 0.8 lg/cm2 thick mounted on a nickelmesh placed in front of the tantalum sample. Thedisplacement of the tantalum edge and the increaseof its width are measures of the carbon foilthickness and uniformity, respectively.
Monte Carlo simulations of the backscatteringspectra were computed in order to assist in theinterpretation of experimental data. Processes in-cluded in the calculations were (1) ®nite beam size,(2) angles of the target, foil, and stop detector withrespect to beam, (3) ion scattering angle, scatterdepth, and solid angle weighted by the scatteringcross section, (4) start foil uniformity, (5) energyloss and straggling in target and start foil, and (6)multiple scattering in the start foil. Random scat-tering depth and scattering angle were determined
from distributions derived from the Lenz±Jensencross section. Multiple scattering was determinedfrom distributions computed using the methods inRef. [24]. For each simulated spectrum, 105 tra-jectories were computed. Charge exchange in thefoil, intrinsic instrumental timing resolution, andsecondary electron timing uncertainties were notincluded in the calculations since they are small,independent e�ects.
4. Results and discussion
Fig. 2(b) shows an atomic force microscopeimage of the surface of a 0.6 lg/cm2 diamond-likecarbon foil. Clearly, with a rms roughness of 6 nmthe diamond-like carbon is smoother than theconventional foil shown in Fig. 2(a) whose rmsroughness is 10 nm. However, it still is substan-tially rough when viewed in comparison with itsnominal thickness, which is of order 3 nm.
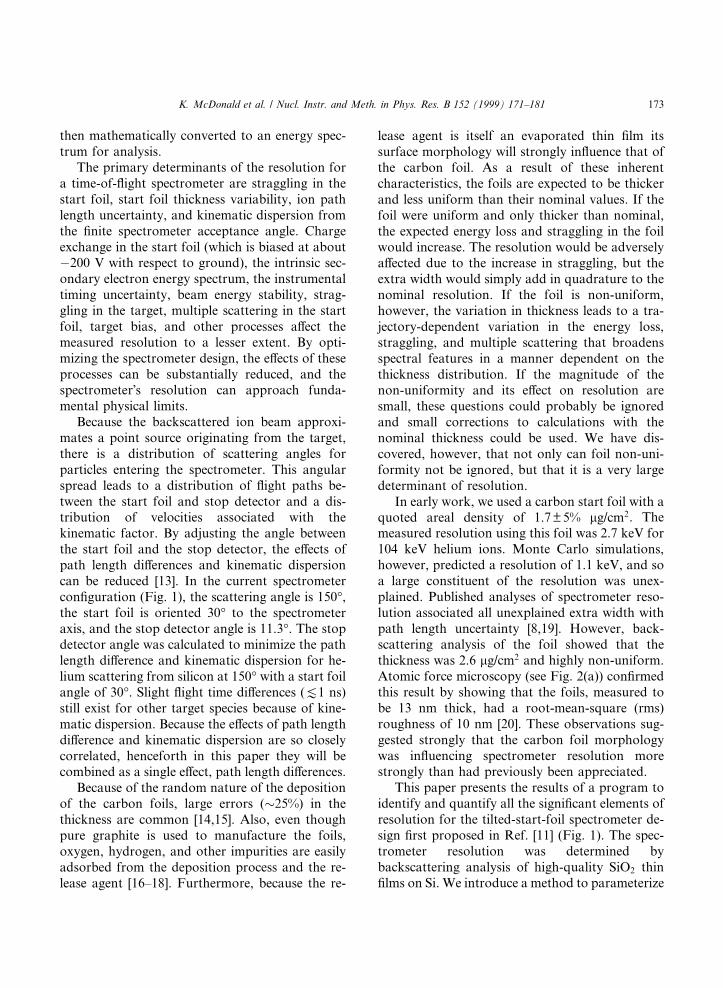
Fig. 3(a) shows a typical backscattering spec-trum of an SiO2 ®lm with nominal thickness of 10nm on a Si substrate. The original time-of-¯ightspectrum has been mathematically rendered as anenergy spectrum. The beam is incident along theá110ñ channeling direction in order to minimizebackground in the region of the oxygen peak andto enhance depth resolution. Fig. 3(b) shows anexpanded view of the oxygen peak along with anon-linear least squares ®t to the data using thefunction given in Eq. (1). The system resolution istaken to be the width of the leading edge at ap-proximately 104 keV.The resolution, obtained asan average over an ensemble of backscatteringspectra like those of Fig. 3, is 1350� 40 eV for 104keV helium particles. This corresponds to a depthresolution of 1.3 nm for oxygen in SiO2 at a beamincident at 45° with respect to the surface normaland 0.5 nm at a 55° incident angle, or an im-provement of approximately a factor of 2 whencompared with the results obtained with the foil inFig. 2(a).
The energy dependence of the spectrometerresolution is shown in Fig. 4(a). It is well charac-terized by a linear relationship (728�44 eV)+((6.4� 0.4)´10ÿ3) E, where E is the energy of theparticle entering the spectrometer in eV. The
K. McDonald et al. / Nucl. Instr. and Meth. in Phys. Res. B 152 (1999) 171±181 175
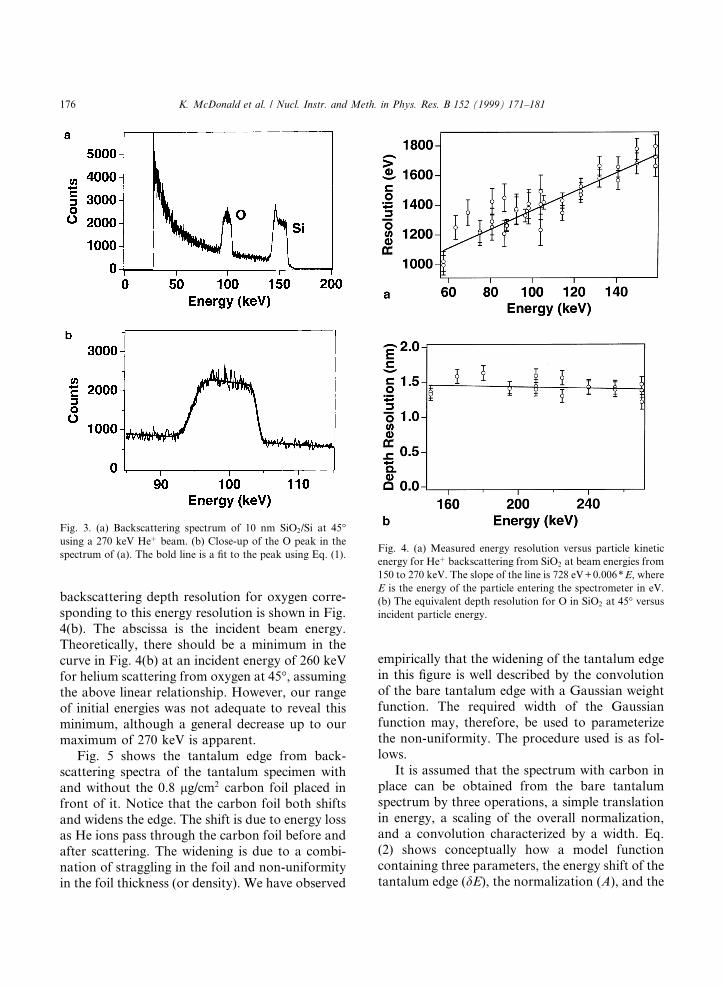
backscattering depth resolution for oxygen corre-sponding to this energy resolution is shown in Fig.4(b). The abscissa is the incident beam energy.Theoretically, there should be a minimum in thecurve in Fig. 4(b) at an incident energy of 260 keVfor helium scattering from oxygen at 45°, assumingthe above linear relationship. However, our rangeof initial energies was not adequate to reveal thisminimum, although a general decrease up to ourmaximum of 270 keV is apparent.
Fig. 5 shows the tantalum edge from back-scattering spectra of the tantalum specimen withand without the 0.8 lg/cm2 carbon foil placed infront of it. Notice that the carbon foil both shiftsand widens the edge. The shift is due to energy lossas He ions pass through the carbon foil before andafter scattering. The widening is due to a combi-nation of straggling in the foil and non-uniformityin the foil thickness (or density). We have observed
empirically that the widening of the tantalum edgein this ®gure is well described by the convolutionof the bare tantalum edge with a Gaussian weightfunction. The required width of the Gaussianfunction may, therefore, be used to parameterizethe non-uniformity. The procedure used is as fol-lows.
It is assumed that the spectrum with carbon inplace can be obtained from the bare tantalumspectrum by three operations, a simple translationin energy, a scaling of the overall normalization,and a convolution characterized by a width. Eq.(2) shows conceptually how a model functioncontaining three parameters, the energy shift of thetantalum edge (dE), the normalization (A), and the
Fig. 4. (a) Measured energy resolution versus particle kinetic
energy for He� backscattering from SiO2 at beam energies from
150 to 270 keV. The slope of the line is 728 eV+0.006*E, where
E is the energy of the particle entering the spectrometer in eV.
(b) The equivalent depth resolution for O in SiO2 at 45° versus
incident particle energy.
Fig. 3. (a) Backscattering spectrum of 10 nm SiO2/Si at 45°using a 270 keV He� beam. (b) Close-up of the O peak in the
spectrum of (a). The bold line is a ®t to the peak using Eq. (1).
176 K. McDonald et al. / Nucl. Instr. and Meth. in Phys. Res. B 152 (1999) 171±181

width of the Gaussian function (r), was con-structed.
STa�C�E� � AZ 1
ÿ1STa�e� W �r; E � dE ÿ e� de; �2�
where STa�C(E) is the tantalum spectrum with thecarbon in place, STa(E) is the bare tantalum spec-trum, and
W �r; E� � 1����������2pr2p Exp
ÿE2
2r2
� ��3�
is the Gaussian weight function with r as its rms.In practice, the convolution (Eq. (2)) is performedby using fast Fourier transforms of the bare tan-talum spectrum and Gaussian function followedby shifting and scaling.
This model function was used in a fully non-linear ®tting procedure [25] in order to obtain thebest values of the three parameters and a covari-ance matrix. The advantage of this method is thatthe contribution to the edge width attributable tothe tantalum surface roughness and instrumentalresolution are separated from the edge widthwhich is added by the foil without the need forextra parameters. In addition, error estimates forall the parameters are immediately available fromthe covariance matrix.
The nominal thickness of the foil was deter-mined from the energy shift of the tantalum edge
using stopping power calculations. Although theexact amount of hydrogen, oxygen, and othercontaminants adsorbed on the carbon is unknown,it should only be a few atomic percent [16±18].Therefore, the foil was assumed to be pure carbonfor energy loss and straggling calculations, andwith this assumption, an areal density of 1.6 lg/cm2 was obtained.
In order to associate the e�ective foil thicknessdistribution with the observed increase in tantalumedge width, it was necessary to compute simulatedbackscattering spectra for targets with a non-uni-form layer. This was accomplished by computingthe convolution of a simulated tantalum spectrumcovered with various thicknesses of carbon layersusing Gaussian quadrature to manually evaluatethe convolution integral [26]. Two foil thicknessdistributions were considered, a Gaussian (see Eq.(3)) terminated at �3 r because the foil had ®nitethickness, and a ®nite step function given by Eq.(4),
W �r; x� � 1
2���3p
r; jxj6
���3p
r;
W �r; x� � 0; jxj >���3p
r;
�4�
where r is the rms of the step distribution. Fiftyterms were used in the quadrature sum, and theresult was a simulated spectrum with the thicknessand fractional rms roughness of the carbon foil asparameters. Spectra were simulated for a 1.6 lg/cm2 carbon foil, with fractional roughness valuesfrom 0 to 0.3 for the Gaussian and 0 to 0.55 for thestep function.
Using the same procedure as was used to reducethe experimental data, the tantalum edges in thesesimulated spectra were ®t to obtain the additionaledge width and edge displacement produced bycarbon coverage. The results of these calculationsare shown in Fig. 6 as points, with the interpo-lating functions shown as smooth curves. Notethat the di�erence between the extra edge widthsgenerated by the two distributions is small. Thisimplies that the critical parameter a�ecting theresolution is the rms roughness, not the detailedshape of the distribution.
Using Fig. 6, the additional edge width fromthe experimental data was then converted to an
Fig. 5. Ta edge in the backscattering spectra of bare Ta and Ta
with a 1.6 lg/cm2 diamond-like carbon foil placed in front. The
bold line is the ®t to the Ta edge with the foil in front using the
bare Ta edge as a basis.
K. McDonald et al. / Nucl. Instr. and Meth. in Phys. Res. B 152 (1999) 171±181 177

equivalent foil roughness. The extra edge widthadded to the tantalum by the 1.6 lg/cm2 foil usedin the experiment (Fig. 5) was 1530 eV, whichcorresponds to a fractional non-uniformity of foilthickness of 0.24 for the Gaussian distribution and0.26 for the ®nite step distribution. We assume thefractional non-uniformity is approximately con-stant in this thickness range and so also attributethe same fractional non-uniformity to foils used inthe spectrometer. It is important to note, however,that the roughness being measured here is not thesame as that measured by atomic force microsco-py. Correlations in roughness on the two sides ofthe foil as well as possible micro-voids, density¯uctuations, and the total size of the measuredregion must be considered.
Note by way of comparison that the rmsroughness obtained by atomic force microscopyon one side of these foils was 6 nm (Fig. 2(a)).Fora 1.2 lg/cm2 foil (the value obtained by scaling thenominal 0.6 lg/cm2 by the same factor as wasobserved for the 0.8 lg/cm2 specimen), the 0.24non-uniformity corresponds to a rms length ofabout 1.4 nm. The discrepancy between this valueand the atomic force microscopy result indicatesstrong correlation between the topography on thetwo sides of the foil, probably as a result of the
morphology of the underlying surface or releaseagent.
Monte Carlo simulations of the spectrometerwere performed using the foil parameters deter-mined by the procedure described above. Thetarget was assumed to be 10 nm of SiO2, and theincident He energies ranged from 150 to 270 keV.We assumed that the foil thickness scaling deter-mined from the 0.8 lg/cm2 foil also applies to the0.6 lg/cm2 foil mounted in the spectrometer. Wealso used a Gaussian foil thickness distribution(the same results are achieved with a step distri-bution) and so assumed a carbon start foil with athickness of 1.2� 24% lg/cm2. The simulatedspectra were ®t in exactly the same way as theexperimental data (Eq. (1)) and the resolution wasidenti®ed with the leading edge of the peaks. Theenergy dependence of the resolution obtained fromthese simulations is shown in Fig. 7. The simula-tion omits intrinsic timing, secondary electrontiming, and charge exchange in the foil. Theseterms are estimated to add �250 eV to the reso-lution, in quadrature. For an energy of 104 keV,the simulation yields a resolution of 1350� 30 eV,which becomes 1370� 30 eV when the instrumen-tal e�ects are added. This value compares favor-ably with the experimentally measured resolutionof 1350� 40 eV. The agreement between the sim-ulated and experimental resolutions is, in fact,excellent for all energies.
Fig. 7. Energy resolution versus particle kinetic energy for
Monte Carlo simulations of He� backscattering from SiO2 at
beam energies from 150 to 270 keV. The slope of the line is 768
eV+0.006*E, with E in eV.
Fig. 6. Incremental edge width versus foil roughness as deter-
mined by the ®tting of simulated spectra of C covered Ta using
a simulated spectrum of bare Ta in conjunction with the
Gaussian and ®nite step convolution models discussed in the
text. The points are the extra edge widths determined by the ®ts
and the solid lines are the interpolation functions.
178 K. McDonald et al. / Nucl. Instr. and Meth. in Phys. Res. B 152 (1999) 171±181

It is a common practice to model the totalspectrometer resolution by the addition in quad-rature of various contributions such as those fromstraggling, instrumental e�ects, path length di�er-ences, and foil uniformity [8,27]. However, becausefoil uniformity is coupled to variations in the totalenergy loss, straggling, and multiple scattering, it isclear that many of these terms are not statisticallyindependent. To determine the magnitudes of therelative contributions of these processes to thetotal observed resolution we have performed ad-ditional Monte Carlo simulations of the oxygenpeak assuming both rough and uniform start foils.The results of simulations for di�erent foil con-®gurations are shown in Table 1.
Simulation of a uniform 1.2 lg/cm2 carbon foilyields a resolution of 1070 eV. In this case, theresolution is determined only by straggling andpath length di�erences, which are not stronglycorrelated. Straggling alone for a uniform 1.2 lg/cm2 carbon foil is �800 eV, and its subtraction inquadrature from the total resolution gives an es-timate of �700 eV for the contribution from pathlength di�erences. By subtracting in quadraturethe resolution obtained for a hypothetical uniformfoil from that of a 1.2�24% lg/cm2 foil, themagnitude of the e�ect of foil non-uniformity isestimated to be �800 eV. Although these valuesare only estimates, the large e�ect foil non-uni-formity has on the resolution can clearly be seen.
The resolution obtained by simulating a uni-form foil, 1070 eV at 104 keV, is an estimate of thebest resolution achievable for a spectrometer in thegeometric con®guration shown in Fig. 1. If the
1.2�24% lg/cm2 start foil is oriented normal tothe spectrometer axis [19] and the stop detector isaligned at angle of 5.4°, which removes path lengthdi�erences for oxygen, the simulated resolution is1090 eV. Using the same estimation method asabove, the straggling is �800 eV, path length dif-ferences add �200 eV, and foil roughness adds�700 eV. Simulation of a uniform foil in thisspectrometer con®guration yields a resolution of800 eV. This value represents the absolute physicallimit for the best achievable resolution of thespectrometer with a 1.2 lg/cm2 start foil.
From these results, we conclude that the opti-mum design is to orient the start foil and detectornormal to the spectrometer axis and to provide the¯exibility to adjust the angle of the stop detector tominimize path length di�erences for the spectralfeature of greatest interest. Several start foil con-®gurations using electrostatic mirrors or magnetshave been designed for heavy ions or high-energyparticles that meet these criteria and appear to bethe best systems for creating start pulses [19,28±30]. Extra caution should be used when using thesedesigns for medium energy ions, however. Forexample, all ®elds should be properly terminatedto eliminate stray ®elds and thereby reduce thedeviation of the exiting ions and the correspondingpath length perturbations.
5. Conclusions
The determinants of resolution of a time-of-¯ight spectrometer for medium energy backscat-
Table 1
Results of Monte Carlo simulations of backscattering from a 10 nm SiO2 ®lm. The measured thickness and non-uniformity of the
nominally 0.6 lg/cm2 diamond-like carbon ®lm were 1.2 lg/cm2 and 24%. The experimentally observed resolution including all
contributions was 1350�40 eV
Thickness
(lg/cm2)
Non-unifor-
mity (%)
Start detector
angle
Stop detector
angle
Instrumental resolution
(eV)
Resolution for oxygen
(eV)
1.2 24 30° 11.3° 250 1370�30
1.2 24 30° 11.3° 0 1350�30
1.2 0 30° 11.3° 0 1070�20
1.2 24 0° 5.4° 0 1090�20
1.2 0 0° 5.4° 0 800�20
K. McDonald et al. / Nucl. Instr. and Meth. in Phys. Res. B 152 (1999) 171±181 179
tering have been quantitatively evaluated. Ofgreatest importance are straggling in the start foil,start foil thickness variability, path length di�er-ences, and kinematic dispersion from the ®nitespectrometer acceptance angle. In our spectrome-ter, the resolution has been greatly improved byusing a diamond-like carbon start foil, which issmoother and thinner than the conventional arc-deposited carbon foils used previously. The ap-parent thickness of foils nominally under 1 lg/cm2
is approximately a factor of two greater, probablydue to the nature of the deposition process or theaccumulation of contaminants in handling. Aresolution of 1350�40 keV is obtained for heliumat an energy of 104 keV. This corresponds to adepth resolution of 1.3 nm for oxygen in SiO2 at a45° sample angle and 0.5 nm at a 55° sample angle.Monte Carlo simulations indicate that it is possibleto achieve a resolution of �1 keV by geometricre®nements, at which point the thickness anduniformity of the start foil are the only degrees offreedom available for additional improvements.The correlation between the surface topographyon the two sides of the foil implied by the datapresented here suggests that with improved fabri-cation techniques, possibly involving improvedsurface morphology of the release agent, suchimprovements may be possible.
Acknowledgements
The authors thank M. L. Green, Lucent Tech-nologies, for providing the SiO2/Si ®lms and J.Hamilton and J. Taylor, Vanderbilt University, forthe atomic force microscopy measurements. Thiswork was supported by the US Army ResearchO�ce under contract DAAH 04-95-1-0565 and bya grant from Texas Instruments.
References
[1] R.G. Smeenk, R.M. Tromp, H.H. Kersten, A.J.H. Boer-
boom, F.W. Saris, Nucl. Instr. and Meth. 195 (1982) 581.
[2] J.F. van der Veen, Surf. Sci. Rep 5 (1985) 199.
[3] J.C. Lee, C.S. Chung, H.J. Kang, Y.P. Kim, H.K. Kim,
D.W. Moon, J. Vac. Sci. Technol. A 13 (1995) 1325.
[4] D. H�uttner, O. Meyer, J. Reiner, G. Linker, Nucl. Instr.
and Meth. B 118 (1996) 578.
[5] E.P. Gusev, H.C. Lu, T. Gustafsson, E. Garfunkel, Appl.
Surf. Sci. 104/105 (1996) 329.
[6] A. Chevarier, N. Chevarier, S. Chiodelli, Nucl. Instr. and
Meth. 189 (1981) 525.
[7] A. Chevarier, N. Chevarier, Nucl. Instr. and Meth. 218
(1983) 1.
[8] M. D�obeli, P.C. Haubert, R.P. Livi, S.J. Spicklemire,
D.L. Weathers, T.A. Tombrello, Nucl. Instr. and Meth.
B 47 (1990) 148.
[9] T.M. Stanescu, J.D. Meyer, H. Baumann, K. Bethge,
Nucl. Instr. and Meth. B 50 (1990) 167.
[10] J.A. Knapp, J.C. Banks, Nucl. Instr. and Meth. B 79
(1993) 457.
[11] M.H. Mendenhall, R.A. Weller, Nucl. Instr. and Meth.
B 40/41 (1989) 1239.
[12] M.H. Mendenhall, R.A. Weller, Nucl. Instr. and Meth.
B 47 (1990) 193.
[13] R.A. Weller, K. McDonald, D. Pedersen, J.A. Keenan,
Nucl. Instr. and Meth. B 118 (1996) 556.
[14] M. Rubel, B. Emmoth, H. Bergsaker, M.A. Gruntman,
V.K. Liechtenstein, Nucl. Instr. and Meth. B 47 (1990)
202.
[15] G. Both, E.P. Kanter, Z. Vager, B.J. Zabransky,
D. Zajfman, Rev. Sci. Instrum. 58 (1987) 424.
[16] D. Balzer, G. Bonani, Nucl. Instr. and Meth. 167 (1979)
129.
[17] D.L. Weathers, J.L. Duggan, R.B. Escue, F.D. McDaniel,
Nucl. Instr. and Meth. A 303 (1991) 69.
[18] A. Veeck, K.X. Jing, Q. Sui, L.G. Moretto, G.J. Wozniak,
Nucl. Instr. and Meth. B 108 (1996) 159.
[19] M. D�obeli, R.M. Ender, V. Liechtenstein, D. Vetterli,
Nucl. Instr. and Meth. B 142 (1998) 417.
[20] R. A. Weller, ``Depth resolution of time-of-¯ight medium
energy backscattering for the analysis of thin silicon oxide
and oxynitride ®lms,'' Fourteenth International Confer-
ence on the Application of Accelerators in Research and
Industry, Denton, Texas Nov. 6-9, 1996.
[21] T.M. Ivkova, V.K. Liechtenstein, E.D. Olshanski, Nucl.
Instr. and Meth. A 362 (1995) 77.
[22] V.Kh. Liechtenstein, T.M. Ivkova, E.D. Olshanski,
I. Feigenbaum, R. DiNardo, M. D�obeli, Nucl. Instr. and
Meth. A 397 (1997) 140.
[23] J.C. Angus, C.C. Hayman, Science 241 (1988) 913.
[24] M.H. Mendenhall, R.A. Weller, Nucl. Instr. and Meth.
B 93 (1994) 5.
[25] W.H. Press, B.P. Flannery, S.A. Teukolsky, W.T. Vetter-
ling, Numerical Recipes in C, Cambridge U. Press,
Cambridge, 1988, p. 540.
[26] R.A. Weller, ``Evaluation of medium energy backscat-
tering spectra with Mathematica,'' Fifteenth Interna-
tional Conference on the Application of Accelerators
in Research and Industry, Denton, Texas, Nov. 4-7,
1998.
180 K. McDonald et al. / Nucl. Instr. and Meth. in Phys. Res. B 152 (1999) 171±181
[27] J.K. Kim, Y.S. Kim, G.D. Kim, H.W. Choi, H.J. Woo,
S.Y. Cho, C.N. Whang, Nucl. Instr. and Meth. B 140
(1998) 380.
[28] A.M. Zebelman, W.G. Meyer, K. Halbach, A.M. Pos-
kanzer, R.G. Sextro, G. Gabor, D.A. Landis, Nucl. Instr.
and Meth. 141 (1977) 439.
[29] F. Busch, W. Pfe�er, B. Kohlmeyer, D. Sch�ull,
F. P�uhlho�er, Nucl. Instr. and Meth. 171 (1980) 71.
[30] Z. Fang, D.J. OÕConnor, Rev. Sci. Instrum. 68 (1997)
4027.
K. McDonald et al. / Nucl. Instr. and Meth. in Phys. Res. B 152 (1999) 171±181 181