quantitative imaging of water flow in soil and roots using
TRANSCRIPT
Quantitative imaging of water flow in soil and roots
using neutron radiography and deuterated water
to obtain the PhD. degree
in the Faculty of Agricultural Sciences,
Division of Soil Hydrology
Georg-August-University Göttingen, Germany
Presented by
Mohsen Zarebanadkouki,
07. Sep. 1983, Iran
Accepted on recommendation of
Prof. Dr. Andrea Carminati.
Prof. Dr. Christoph Leuschner
Prof. Dr. Hans-Jörg Vogel

Göttingen, 21 March 2013
D7 )
Supervisor: Prof. Dr. Andrea Carminati.
Head of the Division of the Soil Hydrology
Georg-August University of Göttingen
Büsgenweg 2, 37077 Göttingen
Co-supervisor: Prof. Dr. Christoph Leuschner
Head of the Department Plant Ecology and Ecosystem Research
Georg-August University of Göttingen
Untere Karspüle 2, 37073 Göttingen
Examiner: Prof. Dr. Hans-Jörg Vogel
Head of the Department of Soil Physics
Helmholtz center for environmental science-UFZ
Theodor-Lieser-Straße 4, 06120 Halle (Saale)
Date of dissertation: 08 May 2013

Summary
Where and how fast do roots take up water? Despite its importance in plant and soil sciences,
there is limited experimental information on the location of water uptake along the roots of
transpiring plants growing in soil. The answer to this question requires direct and in-situ
measurement of the local flow of water into the roots. The aim of this study was to develop
and apply a new method to quantify the local fluxes of water into different segments of the
roots of intact plants. To this end, neutron radiography was used to trace the transport of
deuterated water (D2O) into the roots of lupines.
Lupines were grown in aluminum containers filled with sandy soil. The soil was partitioned
into different compartments using 1cm-thick layers of coarse sand as capillary barriers. These
barriers limited the diffusion of D2O within the soil compartments. D2O was locally injected
into the selected soil compartments during the day (transpiring plants) and night (non-
transpiring plants). Transport of D2O into roots was then monitored by neutron radiography
with spatial resolution of 100 µm and time intervals of 10 seconds. Neutron radiographs
showed that: i) transport of D2O into roots was faster during the day than during the night; 2)
D2O quickly moved along the roots towards the shoots during the day, while at night this
axial transport was negligible. The differences between day and night measurements were
explained by convective transport of D2O into the roots. To quantify the net flow of water
into roots, a simple convection-diffusion model was developed, where the increase rate of
D2O concentration in roots depended on the convective transport (net root water uptake) and
the diffusion of D2O into roots.
The results showed that water uptake was not uniform along the roots. Water uptake was
higher in the upper soil layers than in the deeper ones. Along an individual roots, the water
uptake rate was higher in the proximal segments than in the distal segments. In lupines most
of the water uptake occurred in the lateral roots. The function of the taproot was to collect
water from the laterals and transport it to the shoots. This function is ensured by a low radial
conductivity and a high axial conductive.
We also applied the technique to measure how rhizosphere affects root water uptake. As was
recently reported in the literature, in this study was also observed that the soil in the
immediate vicinity of the roots, the so called rhizosphere, becomes hydrophobic as the soil
dries. For the first time, it was shown that hydrophobicity of the rhizosphere decreased root
water uptake after drying and subsequent irrigation. It was concluded that, after drying, the
rhizosphere became a significant resistance to the local flow of water into the roots. This may
change the pattern of the water uptake zone along the roots.
The significance of this study is the development of a new method to locally quantify water
flow into roots of living plants. This method makes it possible to quantitatively measure
where and how fast roots take up water in soils. This technique will allow understanding the
function of roots in different plants, during root maturation and in response to varying
external conditions, such as water content, transpiration demand, nutrient supply, and many
other factors. The answer to these questions would open wide ranges of agronomy
applications aimed at managing irrigation practice.
Zusammenfassung
Wo und wie schnell nehmen Wurzeln Wasser auf? Obwohl diese Frage in Pflanzen- und
Bodenwissenschaften von großer Bedeutung ist, gibt es nur wenige experimentelle Daten
darüber, an welcher Stelle der Wurzeln eine transpirierende Pflanze das Wasser aus dem
Boden erhält. Die Antwort auf diese Frage erfordert direkte und in-situ Messungen des
lokalen Wasserflusses in die Wurzel hinein. Ziel dieser Arbeit war es, eine neue Methode zu
entwickeln und anzuwenden, um den lokalen Wasserfluss in unterschiedliche Segmente der
Pflanzenwurzeln zu quantifizieren.
Dabei wurde Neutronenradiographie eingesetzt um den Transport von deuteriertem Wasser
(D2O) in die Wurzel von Lupinen zu untersuchen.
Die Lupinen wuchsen in Aluminium Containern, die mit sandigem Boden gefüllt waren. Der
sandige Boden wurde mit Hilfe von 1cm-dicken Schichten groben Sandes in verschiedene
Bereiche eingeteilt. Diese Schichten reduzierten die Diffusion von D2O zwischen den
verschiedenen Bereichen. D2O wurde in ausgewählte Bereiche tagsüber (transpiriende
Pflanzen) und nachts (nicht transpiriernde Pflanze) injiziert. Transport von D2O in die
Wurzeln hinein wurde durch Neutronenradiographie mit einer räumlichen Auflösung von 100
µm in Intervallen von 10 Sekunden aufgezeichnet. Die Messungen zeigten: i) Transport von
D2O in die Wurzel hinein war tagsüber schneller als nachst; ii) D2O wurde tagsüber schnell
entlang der Wurzel in Richtung Spross transportiert, während dieser axiale Fluss nachts
vernachlässigbar war. Die Unterschiede zwischen Tag- und Nachtmessungen wurden durch
konvektiven Transport von D2O in den Wurzeln erklärt. Um den effektiven Wasserfluss in
die Wurzeln hinein zu quantifizieren, wurde ein einfaches Konvektions-Diffusions Modell
entwickelt, wobei die Zunahme der D2O Konzentration in Wurzeln vom konvektiven
Transport abhängt und von the Diffusion des D2O in die Wurzeln.
Die Ergebnisse zeigten, dass die Wasseraufnahme nicht gleichmäßig entlang der Wurzel
stattfindet. Die Wasseraufnahme war in den oberen Bodenschichten höher als in den tieferen.
Entlang einzelner Wurzeln war der radiale Fluss in nahen Teilen der Wurzel höher als in den
weiter entfernten Teilen der Wurzel. In Lupinen fand die Wasseraufnahme im Wesentlichen
in den lateralen Wurzeln statt. Die Funktion der Pfahlwurzel war es, das Wasser der lateralen
Wurzeln zu sammeln und zum Spross zu transportieren. Diese Funktion wird durch eine
geringe radiale und eine hohe axiale Leitfähigkeit sichergestellt.
Wir haben diese Technik auch angewandt um den Einfluss der Rhizosphäre auf die
Wasseraufnahme zu untersuchen. Wie vor Kurzem auch in der Literatur berichtet wurde,
wurde auch in dieser Arbeit beobachtet, dass der Boden in der unmittelbaren Nähe der
Wurzeln, der sogenannten Rhizosphäre, hydrophob wird, wenn der Boden trocken wird. Zum
ersten Mal konnte gezeigt werden, dass durch die Hydrophobizität der Rhizosphäre die
Wasseraufnahme nach Trocknung und folgender Bewässerung reduziert wird. Es wurde die
Schlussfolgerung gezogen, dass nach Trocknung die Rhizosphäre einen entscheidenden
Wiederstand für den Wasserfluss zur Wurzel darstellt. Das beeinflusst vermutlich auch die
Ausdehnung des Bereiches der Wurzeln, in dem Wasser aufgenommen wird.
Die Bedeutung dieser Arbeit ist die Entwicklung einer neuen Methode, um Wasseraufnahme
durch Wurzeln lebender Pflanzen lokal zu quantifizieren. Diese Methode macht es möglich
quantitativ zu messen, wo und wie schnell Wurzeln Wasser im Boden aufnehmen.
Diese Technik wird es erleichtern, die Funktionsweise der Wurzeln verschiedener Pflanzen
zu verstehen und den Einfluss von Wurzelwachstum und wechselnder äußerer Bedingungen,
wie Wassergehalt, Transpiration und Verfügbarkeit von Nährstoffen und vieler weiterer
Faktoren zu untersuchen.
Die Antwort auf diese Fragen könnten einen weiten Bereich für landwirtschaftliche
Anwendungen eröffnen, die darauf abzielen, Bewässerungsmethoden zu verbessern.
Acknowledgement
Firstly, I would like to express my deep gratitude to Prof. Dr. Andrea Carminati, my
supervisor, for his numerous supports and encouragements throughout my study. Above of
all, I would like to thank for his great understanding and friendship. I feel very lucky to
have had him as my supervisor.
I thank the members of my PhD committee, Prof. Dr. Christoph Leuschner and Prof. Dr.
Hans-Jörg Vogel for agreeing to supervise and examine my PhD thesis.
I appreciate very much the scientific and friendly supports of Dr. Yangmin Kim during my
study. I would like to thank her in particular for introducing me to the late Prof. Dr. Ernst
Steudle who stands in my mind as a great icon in the scientific community.
My warmest gratitude and enormous thanks go to Dr. Ahmad Moradi for his scientific and
friendly supports during my study. Above of all, I thank him for informing me about this
position and supporting me to get this position. I also thank Prof. Dr. Majid Afyuni who
introduced me to Dr Ahmad Moradi. Their great supports and encouragements throughout
the study are highly appreciated.
My enormous thanks go to Prof. Dr. Sascha Ostwald and Prof. Dr. Hans-Jörge Vogel for
hosting me at the Helmholtz Center for Environmental Research, Halle (Saale) in early
stages of study.
My thanks also go to members of Paul Scherer Institute (PSI) of Switzerland for the precious
technical supports during the measurements with neutron radiography.
I offer my deepest sense of acknowledgement to my beloved wife, Mina Moghani for
her unconditional supports and encouragements during last years. I also thank my little girl,
Ronia for blessing me with her birth during the writing of the thesis.
The financial support of the IPSWaT scholarship program (under stipendium IPS 11/Q04)
from the German Federal Ministry of Education and Research (BMBF) is gratefully
acknowledged.
Mohsen Zarebanadkouki
Göttingen, Germany, 21 March 2013

Table of Contents
Chapter 1
Introduction ................................................................................................................................... 1
Why we need to study root water uptake ............................................................................... 1
Root water uptake................................................................................................................... 1
Root anatomy ......................................................................................................................... 3
Water flow in root .................................................................................................................. 4
Radial pathways of water into roots ....................................................................................... 5
Effect of soil on root water uptake ......................................................................................... 8
Rhizosphere ............................................................................................................................ 9
Location of water uptake along roots ................................................................................... 11
Review of root water uptake measurements ........................................................................ 12
1-Measurements of fluxes into and along single roots. ........................................................ 12
2-Measurement root water using potometer ..................................................................... 14
3- Experiment with dye tracers ......................................................................................... 15
4- Measurement of root water uptake in soil .................................................................... 17
5- Measurement root water using heat-based sap flow gauges ........................................ 18
Aim of this study .................................................................................................................. 19
Outlooks ............................................................................................................................... 20
References ............................................................................................................................ 21
Chapter 2
Quantification and modeling of local root water uptake using neutron radiography and
deuterated water ......................................................................................................................... 27
Abstract ................................................................................................................................ 28
Introduction .......................................................................................................................... 28
Materials and methods ......................................................................................................... 31

Preparation of the soil and plants ..................................................................................... 31
Neutron radiography ......................................................................................................... 32
Tracing the flow of water into roots by deuterated water ................................................. 32
Image processing .............................................................................................................. 33
Model of D2O transport into root ..................................................................................... 35
Calculation of Cs ............................................................................................................... 39
Independent quantification of axial flow rate ................................................................... 39
Results .................................................................................................................................. 40
Visualization of D2O uptake in the root ........................................................................... 40
Quantification of radial water flow in roots ..................................................................... 42
Quantification of axial water flow rate ............................................................................. 48
Discussion ............................................................................................................................ 51
Acknowledgments ................................................................................................................ 53
References ............................................................................................................................ 54
Chapter 3
Where do roots take up water? Neutron radiography of water flow into roots of
transpiring plants growing in soil .............................................................................................. 59
Summary .............................................................................................................................. 60
Introduction .......................................................................................................................... 61
Materials and methods ......................................................................................................... 63
Plant and soil preparation ................................................................................................. 63
Deuterated water ............................................................................................................... 65
Image processing ............................................................................................................. 66
Model of D2O transport in roots ....................................................................................... 67
Quantification of axial flux along the root ....................................................................... 71
Results .................................................................................................................................. 71
Discussion ............................................................................................................................ 78
Appendix A: Derivation of the model of D2O transport into roots ...................................... 83
Appendix B: D2O concentration in the roots: experimental results and best fits with single
and double exponential curves ............................................................................................. 86
References ............................................................................................................................ 87
Chapter 4
Reduced root water uptake after drying and rewetting .......................................................... 91
Abstract ................................................................................................................................ 92
Introduction .......................................................................................................................... 93
Materials and methods ......................................................................................................... 96
Plants and soil ................................................................................................................... 96
Neutron radiography ......................................................................................................... 97
D2O injection experiments................................................................................................ 97
Image processing ............................................................................................................. 98
Quantification of the water fluxes .................................................................................... 98
Results .................................................................................................................................. 99
Discussion .......................................................................................................................... 106
Acknowledgements ............................................................................................................ 112
References .......................................................................................................................... 112
Chapter 5
A method to measure hydraulic conductivity of the rhizosphere after drying ................... 115
Abstract .............................................................................................................................. 116
Introduction ........................................................................................................................ 117
Material and methods ......................................................................................................... 118
Preparation of the soil and plants ................................................................................... 118
Neutron radiography ....................................................................................................... 119
Infiltration experiments .................................................................................................. 119
Root segmentation .......................................................................................................... 120

Quantification of water content in the bulk soil ............................................................. 120
Quantification of water content in the rhizosphere ........................................................ 121
Quantification of water content in roots ......................................................................... 122
Effective hydraulic conductivity of the rhizosphere ....................................................... 122
Results ................................................................................................................................ 123
Discussion .......................................................................................................................... 129
Appendix ............................................................................................................................ 131
References .......................................................................................................................... 132
Chapter 6
Final conclusions ....................................................................................................................... 135
Summary………………………………………………………………………………….135
Limitations of the method .................................................................................................. 138
Outlooks ............................................................................................................................. 139
Curriculum Vitae ............................................................................................................. 141
List of Figures
Chapter 1
Figure 1: radial pathways of water into roots. ........................................................................... 7
Figure 2: Measured and calculated value of water uptake along a 20 cm excised root of
Maize........................................................................................................................................ 14
Figure 3: Water uptake of different location of roots along the seminal axes of barley, at two
air humidity regimes, in relation to the development of the endodermis. ............................... 15
Figure 4: Water flux into different locations of roots along the axes and branches of mature
maize grown in aeroponic culture. ........................................................................................... 17
Chapter 2
Figure 1: Illustration of D2O transport in root. ........................................................................ 38
Figure 2: Neutron radiographs of the samples at night and day.. ............................................ 41
Figure 3: Neutron radiographs of the samples before D2O injection and after injection . ...... 42
Figure 4: Average D2O concentration in the soil near the roots after injecting 3 ml of D2O
during night and day measurement.. ....................................................................................... 44
Figure 5: Average D2O concentration in roots after D2O injection during the night and day in
the root tip, and in stele after excluding cortex contribution during the night and day.. ......... 45
Figure 6: Total volume of D2O passing the barrier as a function of time after D2O injection
and total volume of D2O passing the barrier divided by the concentration in the root at the
barrier . Linear regression of the data in the right figure yielded the axial water flow rate. ... 50
Chapter 3
Figure 1: Illustration of D2O transport into a root that is partially immersed in
D2O………………………………………………………………………………….………67
Figure 2: Neutron radiographs of one sample before and after injection of 4 ml D2O during
daytime ……………………………………………………………………………..……….72
Figure 3: Neutron radiographs of one sample before D2O injection and after injection at
nighttime……………………………………………………………………………………...74
Figure 4: Increase of D2O concentration inside roots (a), and volume of D2O passing beyond
the barrier (b). .......................................................................................................................... 76
Figure 5: Scheme of the root system showing the distribution of the radial fluxes, jr, [m s-1]
calculated with Eq. (3.5).. ........................................................................................................ 79
Figure 6: Axial fluxes, [m s-1], in long and medium roots calculated from the model (Eq. 3.5,
solid arrows above roots) and directly obtained from radiographs (Eq. 3.7, dashed thin arrows
below roots). ............................................................................................................................ 80
Figure 7: Measured D2O concentration inside the roots and the best-fit lines using a single
and double exponential equation.. ........................................................................................... 86
Chapter 4
Figure 1: Hypothetical water distribution in the rhizosphere during drying and wetting
including mucilage dynamics .................................................................................................. 94
Figure 1: Neutron radiograph of a sample one hour after irrigation with normal water.. ....... 95
Figure 1: Schematic cross-section of root (black), rhizosphere (dark gray) and bulk soil (light
gray).. ..................................................................................................................................... 121
Figure 2: Neutron radiographs of sample after a drying period and after rewetting at time t
during nighttime. .................................................................................................................... 124
Figure 3: The profile of water content as a function of distance to roots after irrigation in
different roots. ........................................................................................................................ 126
Figure 4: Average water content in the rhizosphere and in the bulk soil after infiltration.. .. 127
Figure 5: a) Change in volume of roots after irrigation. (b) Volume-pressure curve of the
Lupine roots parameterized according to Eq. (5.7). ............................................................... 128
Figure 6: Effective hydraulic conductivity of the rhizosphere as a function of time after
irrigation (a), and as a function of water content in the rhizosphere (b). ............................... 128
Figure 7: Neutron radiographs of a sample after rewetting at time t ..................................... 131

List of Tables
Chapter 2
Table 1: Properties of the segmented roots and D2O transport parameters fitted by an
exponential function for night measurement. .......................................................................... 47
Table 2: Properties of the segmented roots and D2O transport parameters fitted for day
measurement. ........................................................................................................................... 49
Chapter 3
Table 1: Diffusional permeability of cortical cells, PD,c, [m s-1], and endodermis, PD,e, [m s-1],
along lateral roots.. ................................................................................................................... 75
Chapter 5
Table 1: Mualem–van Genuchten parameters for the bulk soil. ............................................ 119


Introduction


Chapter 1 1
Why we need to study root water uptake
All organisms, including plants, require water for their survival. Water has numerous vital
functions in plant life such as major constituent of living cells, maintaining cell turgidity,
providing a transport medium, serving as a raw material for various chemical processes, heat
dissipater through transpiration, and buffering plants against temperature changes (Kudrev,
1988; Kirkham, 2005). Plants as a big water mover on the earth return approximately, 40 %
of the terrestrial precipitation to atmosphere via transpiration (Bengough, 2012). Root water
uptake is the gateway to replace water lost by transpiration.
Inadequate supply of water from soil is a worldwide constraint to plant yield and food
production. Increasing population and periodic droughts due to reduced rainfall frequency
(Gallagher et al., 1976; Laraus, 2004; Oki & Kanae, 2006; Miraglia et al., 2009) are expected
to increase the alarm of water scarcity. Due to the high water consumption in agriculture,
improved water use efficiency has been recommended as a needed management practice
(Laraus, 2004; Oki & Kanae, 2006). Water use efficiency is the ability of plants to convert
water into biomass (Stanhill, 1986; Howell, 2001). Besides improving the productivity of
plant species, an irrigation practice that is capable of increasing the soil water content in the
regions where roots are more active in root water uptake, while reducing water loss by
evaporation and deep infiltration, will improve the water use efficiency in agriculture. To this
end, we need to know where roots take up water in soil.
Root water uptake
Water moves from soil to plants and then to the atmosphere following an increasingly
negative water potential in the process called transpiration. Water moves into and within
plants in liquid form and it leaves the plant as vapor through the leaf stomata. Stomata are
cavities open to atmosphere during the daytime to facilitate the entry of CO2 for
photosynthesis. When stomata are open, water evaporates from the leaf tissue to the
atmosphere. According to the cohesion–tension theory, water lost from leaves generates a
tension in water that is transmitted along the xylem down to the roots. The resulting gradient
in water potential between roots and soil drives water into the roots. Water supply to leaves
depends on maintenance of a continuing column of water in the xylem from roots to shoots
(Holbrook et al., 1995; Walker et al., 2003; Koch et al., 2004). When transpiration is low,
Introduction 2
osmotic adjustment in plants by accumulation or removal of solutes in the xylem can move
water into and within the roots (Steudle & Peterson, 1998). Water flow from the soil into the
roots must continuously compensate the water lost from leaves. A non-sufficient root water
uptake will gradually decrease water potential in the xylem. An imbalance between root
water uptake and water lost from the leaves may cause dehydration of the root tissues
(Zimmermann et al., 1992; Holbrook et al., 1995; Koch et al., 2004). To avoid dehydration,
plants may reduce the rate of water loss from leaves by regulation of the stomata conductance
(Schulze, 1986; Saliendra et al., 1995; Chaves et al., 2003) and/or increase water uptake from
the roots. The increase of water uptake may occur by increasing the permeability of roots
(Moshelion et al., 2004; Knipfer et al., 2011), and/or enhancing the growth rate of the roots to
explore new sources of water (Dale & Causton, 1992; Dias-Filho, 1995).
The concept of water movement in plants is often described analogous to electricity flux
(Ohm’s and Kirchhoff’s laws). Applying these laws to plants, the flux of water into plants
depends on the difference in water potential between soil and roots as driving force and the
resistivity of the soil-root-atmosphere continuum. The hydraulic resistance is a parameter that
describes how difficult it is for water to pass a certain cross section. It is the inverse of
conductance. The flow of water from the soil into plants and then to the atmosphere occurs
through different pathways in series with different resistances. When the pathways are in the
series, the resistances of the pathways are additive, while when they are in parallel the inverse
of their resistances is additive. In whole plant level, flow of water from soil to plant and then
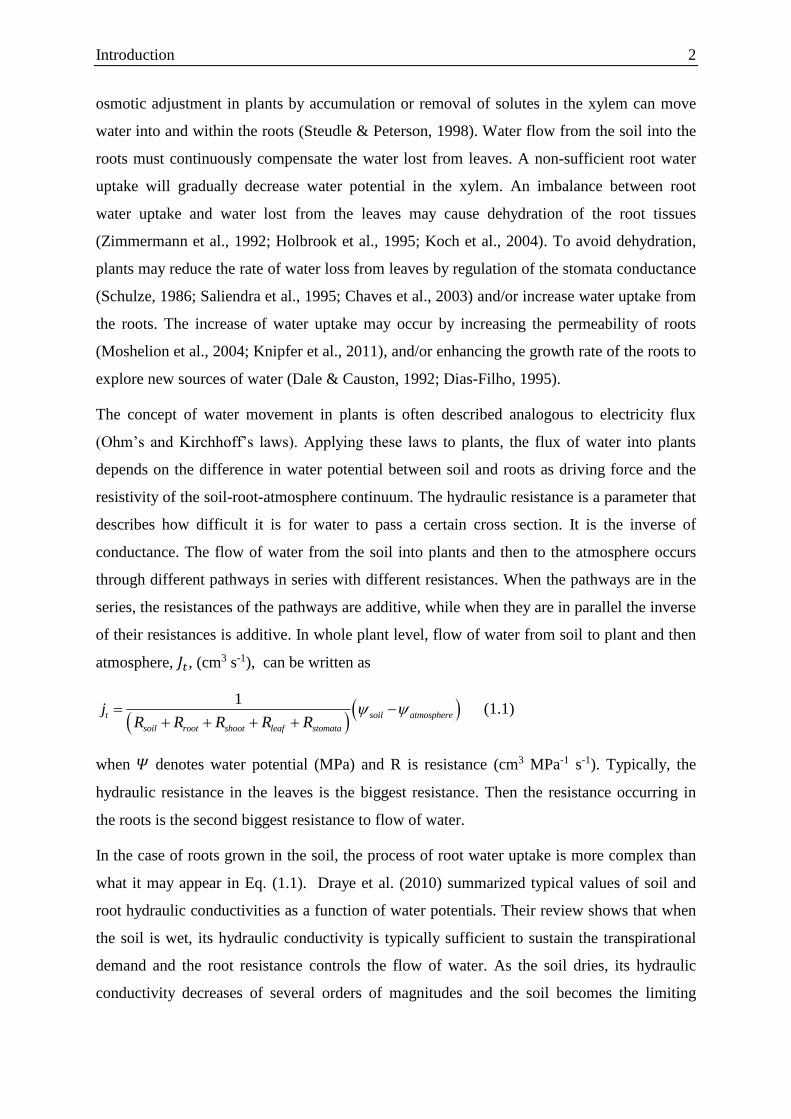
atmosphere, 𝐽𝑡, (cm3 s-1), can be written as
1t soil atmosphere
soil root shoot leaf stomata
jR R R R R
(1.1)
when 𝛹 denotes water potential (MPa) and R is resistance (cm3 MPa-1 s-1). Typically, the
hydraulic resistance in the leaves is the biggest resistance. Then the resistance occurring in
the roots is the second biggest resistance to flow of water.
In the case of roots grown in the soil, the process of root water uptake is more complex than
what it may appear in Eq. (1.1). Draye et al. (2010) summarized typical values of soil and
root hydraulic conductivities as a function of water potentials. Their review shows that when
the soil is wet, its hydraulic conductivity is typically sufficient to sustain the transpirational
demand and the root resistance controls the flow of water. As the soil dries, its hydraulic
conductivity decreases of several orders of magnitudes and the soil becomes the limiting

Chapter 1 3
factor in the water flow into roots (Gardner, 1960; Passioura, 1988; Garrigues et al., 2006;
Draye et al., 2010).
Acquiring a proper knowledge on root water uptake requires good understanding of the root
structure, the pathways of water into the roots, and functioning of roots in response to their
environments. In the following sections, we briefly review the basic structure of roots with
regard to water transport, the pathways of water into the roots, and the effects of soil on root
water uptake.
Root anatomy
The hydraulic properties of roots are related to the anatomy of roots, and there is no way to
understand the transport of water into roots and root functioning in response to external
factors without sufficient knowledge of their structure and its dynamics (Huang & Eissenstat,
2000; Steudle, 2000). Water taken up from soil has to cross a series of cell layers before
reaching the xylem vessels where it is transported towards the shoots. These cell layers (from
outside to inside) are epidermis, cortex, endodermis and the root stele (Enstone et al., 2003).
In many plants if not all, the root endodermis is considered as a major resistance to flow of
water and solute into the roots (Perumalla & Peterson, 1986; Peterson et al., 1993; Steudle,
2000). The endodermis separates the root cross section into two compartments: the root
cortex and the root stele. The outermost compartment is the root cortex and consists of many
parenchyma cells called cortical cells. The innermost compartment is the root stele and
consists of conducting vessels (xylem and phloem) surrounded by parenchyma cells.
The outermost layer of the cortex is the epidermis, which is a single layer of elongated and
tightly packed cells from which originates root hairs and cluster roots. The overall quantity
and longevity of root hairs and cluster roots varies among plant species and depends also on
the interaction with the soil environment. In some plants, a second layer of cells may
originate from the epidermal cells called the hypodermis. The exodermis is a special type of
hypodermic cells that are subjected to different cell modifications such as formation of
casparian bands in the anticlinal walls or deposition of suberin lamella at the surface of cells.
These modifications usually occur in the late developmental stages of roots. External adverse
conditions such as water stress may stimulate these modifications (Perumalla & Peterson,
1986; Reinhardt & Rost, 1995; Enstone et al., 2003).
Introduction 4
The innermost layer of the cortex enclosing the stele is called endodermis. Endodermis is a
single layer of elongated and tightly packed cells that develop casparian bands in the
anticlinal walls and suberin lamella (deposition of hydrophobic covering around the cell as a
secondary wall). In most plants, casparian bands form within 1 cm from the root tip. The
effectiveness of casparian bands in the water flow is highly variable among different plants
and depends on the growth conditions. Enstone et al. (2003), speculated that casparian bands
block the passive transport of ions from soil into the roots and prevent the back diffusion of
ions and water into the soil. In addition to formation of casparian bands, the surface of the
endodermis is characterized by deposition of hydrophobic components (suberin lamellae).
Unlike casparian bands, suberin lamellae only reduce permeability of cell-to-cell pathways of
roots.
Strong modification of the endodermis cells, formation of casparian bands and suberin
lamellae have been often observed when roots suffered of harsh external conditions such as
water stress. These evidences confirmed positive adaptive functions of these formations in
improving the water status of the plant. Water and nutrient shortage, salinity stress and
pathogenic attack cause an earlier and denser formation of casparian band and suberin
lamella (Nobel & Cui, 1992; McCully, 1995; Enstone et al., 2003; Hu et al., 2011). However,
both casparian bands and suberin lamella do not occupy the endodermal and exodermal cells
completely. Casparian bands rarely occupy more than 1/3–1/2 of the anticlinal walls (Enstone
et al., 2003). Lack of presence of casparian bands even in some portion of the root
endodermis may be enough to facilitate the flow of water through apoplastic pathways.
Although, presence of casparian bands and suberin lamella are easily detectable by
microscopic investigation of root cross section, the quantitative effect of them on the flow of
water into roots is not resolvable.
Water flow in root
Root water uptake is often described in terms of radial and/or axial flow. The axial flow
refers to the movement of water along the xylem. The axial flow, 𝐽𝑥, (cm3 s-1), can be
described as
( )1
( ) . xx
x
d xJ x
R dx
(1.2)
Chapter 1 5
where 𝑅𝑥is the xylem axial resistance (bar s cm-4), 𝛹𝑥is water potential in the xylem (bar) and
𝑥 is location along the xylem. Axial flow of water can be calculated by Poiseuille's law where
the xylem vessels of roots are considered as continuous conduits. According to this law, the
size and abundance of the xylem vessels determine the axial resistance of root (Frensch &
Steudle, 1989; McCully, 1995; Bramley et al., 2009). However, the measurement of the axial
resistance showed that actual axial resistance (flow rate) occurring along roots differed from
the one calculated by Poiseuille's law (Frensch & Steudle, 1989). The axial resistances along
roots are commonly measured by root pressure probe and high-pressure flow meter
technique.
Typically, axial resistance in the apical parts of the root is high, resulting in hydraulic
isolation of the root apex. As root matures, the axial resistance in xylem decreases due to the
increasing size and abundance of the xylem vessels (Frensch & Steudle, 1989; McCully,
1995; Bramley et al., 2009). Additionally, as root elongates the axial resistance increases due
to a longer pathway of water (Landsberg & Fowkes, 1978; Zwieniecki et al., 2003).
The radial flow, 𝐽𝑟, (cm3 s-1) is defined as flow of water from soil into the xylem crossing a
set of concentric layers in the root tissue. The water potential difference between xylem and
root is the driving force of water. The radial flow can be written as
s x
r
x
JR
(1.3)
where 𝑅𝑟 is the radial resistance (bar s cm-3), 𝛹𝑥 is water potential in the xylem (bar) and 𝛹𝑥
is water potential in soil (bar). The radial resistance of roots varies along root system during
root development and responses to external conditions such as drought stress. The measure of
radial resistance and radial flow of water into root depends on the pathways of water into the
roots (Frensch & Steudle, 1989; Steudle & Peterson, 1998; Knipfer & Fricke, 2010b).
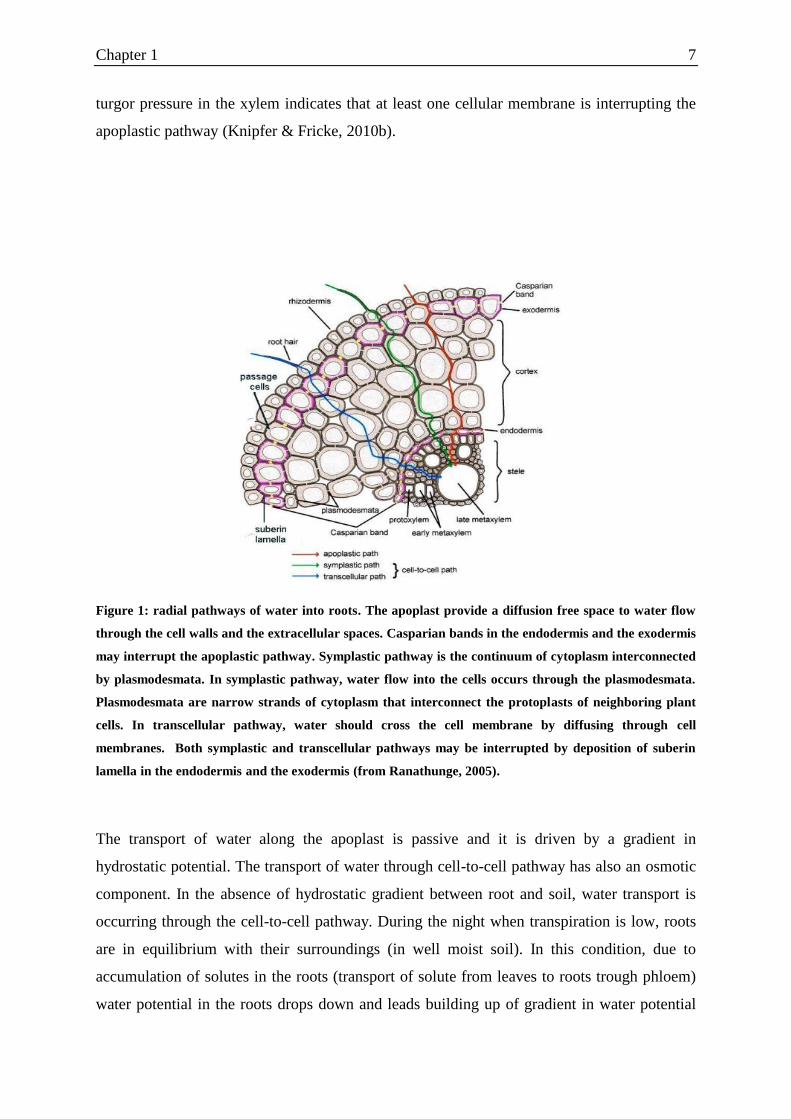
Radial pathways of water into roots
Water has to cross root tissue before reaching the xylem vessels. The structure of root tissue
results in composite pathways of water flow into the roots (McCully & Canny, 1988; Steudle,
2000). The main pathways of water into roots are apoplastic pathway, symplastic pathway
and transcellular pathway (Fig. 1). The apoplastic pathway occurs through the cell walls and
the extracellular spaces. Apoplast is a free diffusional space. The symplastic pathway occurs
Introduction 6
across the cytoplasm interconnected by plasmodesmata. Plasmodesmata are narrow strands of
cytoplasm that interconnect the protoplasts of neighboring plant cells. In the transcellular
pathway, water crosses the cell membrane by diffusing through cell membranes. In the
symplastic pathway, water flow between cells is facilitated by the presence of
plasmodesmata, whereas in the transcellular pathway water has to cross the cellular
membranes. To date, it has been difficult to separate symplastic and transcellular pathways
experimentally and therefore they are commonly referred to as cell-to cell pathway.
Besides difficulties in separating two components of cell-to-cell pathway, the relative
importance of the apoplastic pathway and cell-to-cell pathway in transport of water into roots
has also been matter of big debates for decades (McCully & Canny, 1988; Canny, 1995;
Magnani et al., 1996; Steudle, 2000; Fritz & Ehwald, 2011). The relative importance of these
two pathways depends on plant species, developmental stage of the plant, growth condition,
and nature of water flow (osmotic or hydrostatic). Casparian bands in the endodermis and the
exodermis influence the contribution of the apoplastic pathway in transport of water. These
structures play an important role in reducing the hydraulic conductance of apoplastic
pathways and, depending on the relative importance of apoplastic pathway in transport of
water, on the hydraulic conductance of te root system (Peterson et al., 1981, 1993; Enstone et
al., 2003). The contribution of the cell-to-cell path to the overall hydraulic conductivity of the
root is influenced by changes in the hydraulic conductivity of cell membranes. Suberization
of the cell membranes following root maturation and/or in response to external conditions
reduces the permeability of the root tissue (Peterson et al., 1981; McCully & Canny, 1988;
Knipfer & Fricke, 2010a). Aquaporins in cell membrane also actively controls permeability
of the cell-to-cell pathways and their regulation may reduce or increase the root permeability
(Henzler & Steudle, 1995; Maurel & Chrispeels, 2001; Knipfer et al., 2011; McLean et al.,
2011).
In the cell-to-cell transport, water has to cross several cell layers and two plasma membranes
per cell layer, which results in a high hydraulic resistance. The transport of water can occur in
a combination of pathways, in which water may travel through the apoplast for some distance
and then cross the cell membrane and flow via the cell-to-cell pathway. Typically, apoplast is
interrupted at the root endodermis. In the purely apoplastic pathway, water flows into the
roots without involvement of any cell membranes. The possibility of a purely apoplastic
pathway along root tissue up to the xylem is questionable. The fact that the roots can build up
Chapter 1 7
turgor pressure in the xylem indicates that at least one cellular membrane is interrupting the
apoplastic pathway (Knipfer & Fricke, 2010b).
Figure 1: radial pathways of water into roots. The apoplast provide a diffusion free space to water flow
through the cell walls and the extracellular spaces. Casparian bands in the endodermis and the exodermis
may interrupt the apoplastic pathway. Symplastic pathway is the continuum of cytoplasm interconnected
by plasmodesmata. In symplastic pathway, water flow into the cells occurs through the plasmodesmata.
Plasmodesmata are narrow strands of cytoplasm that interconnect the protoplasts of neighboring plant
cells. In transcellular pathway, water should cross the cell membrane by diffusing through cell
membranes. Both symplastic and transcellular pathways may be interrupted by deposition of suberin
lamella in the endodermis and the exodermis (from Ranathunge, 2005).
The transport of water along the apoplast is passive and it is driven by a gradient in
hydrostatic potential. The transport of water through cell-to-cell pathway has also an osmotic
component. In the absence of hydrostatic gradient between root and soil, water transport is
occurring through the cell-to-cell pathway. During the night when transpiration is low, roots
are in equilibrium with their surroundings (in well moist soil). In this condition, due to
accumulation of solutes in the roots (transport of solute from leaves to roots trough phloem)
water potential in the roots drops down and leads building up of gradient in water potential
Introduction 8
between roots and soil. This gradient pulls water into the roots via cell-to-cell pathway. This
results in a high turgor pressure. The relative contribution of the apoplastic pathway to cell-
to-cell pathway may depend on the transpiration demand of plants. Switching between
pathways is well described by Steudle (2000) who introduced a composite transport model to
describe the transport of water into roots based on composite structure of roots. The volume
of the apoplast is reported to contribute to 3-7% and the cell-to-cell pathway to more than
90% of the total root volume.
Effect of soil on root water uptake
The transport of water into roots is highly influenced by the radial permeability of the root
tissue. Besides root maturation, plants may regulate their radial permeability in response to
adverse external conditions such as water and nutrient shortage, salinity stress , physical
stress, and extreme temperature in the soil (Peterson et al., 1981; Reinhardt & Rost, 1995;
Zimmermann & Steudle, 1998; Enstone et al., 2003). It is well known that formation and
density of casparian bands, suberin lamellae, and aquaporins are influenced by soil water
content (Perumalla & Peterson, 1986; Reinhardt & Rost, 1995; Enstone et al., 2003).
Besides the effect of soil water content on the permeability of roots, supply of water to roots
becomes limited when soil dries and its hydraulic conductivity decreases (Gardner, 1960;
Landsberg & Fowkes, 1978; Dousssan et al., 1998; Draye et al., 2010). Model calculations
showed that as the soil becomes dry, significant gradients in water potential and water
content develop near the root surface. The drop in water potential near the roots in the soil
occurs because of the radial geometry of the flow to the roots and the nonlinearity of the
unsaturated soil conductivity (Gardner, 1960; Dousssan et al., 1998; Carminati et al., 2011).
Under this condition, the hydraulic conductivity of the soil near roots becomes the main
resistance to flow of water into the roots. Model calculations showed that the reduction in
hydraulic conductivity of soil occurs in the immediate vicinity of soil. Plants may regulate
their resistance in response to the low water potential developed at their surface. To date, it
has been very difficult to measure the water potential gradients near roots and most of the
high temporal and spatial measurements relied on monitoring water content in soil. Under
drying condition, a big drop in water potential may occur with only a tiny change in water
content, which is not detectable with our devices. This is particularly true in sandy soil.

Chapter 1 9
In addition, the physical and biochemical properties of the immediate soil near the root, the
so called rhizosphere is influenced by root exudation (Or et al., 2007b; Carminati et al., 2010;
Moradi et al., 2012a). Recent observations on redistribution of water during the drying cycle
of transpiring plant grown in soil showed that the rhizosphere was wetter than the bulk soil.
During the rewetting phase, the rhizosphere stayed temporarily dry (Carminati et al., 2010).
The first observation was explained by modification of the soil hydraulic properties by root
exudation. The second observation was explained by the presence of lipid components in the
root exudates. Lipids reduce wettability of the soil. How a hydrophobic rhizosphere may
affect the flow of water into roots is still an open question. Answering to this question
requires in situ measurement of water flux into roots.
Rhizosphere
Rhizosphere is defined as the soil in the immediate vicinity of the roots. Its physical and
biochemical properties are actively modified by roots as well as by microorganisms living in
symbiosis with the roots. Plants actively and constantly release various photosynthetic
compounds into the soil. (Chenu & Roberson, 1996; Gregory & Hinsinger, 1999; Hinsinger
et al., 2005; Gregory, 2006). One of the substances exuded from the roots is mucilage.
Mucilage released by the peripheral cells of the root cap (both root tip and cluster roots) and
is left behind following root maturation (Iijima et al., 2003; Nakaji et al., 2007).
There have been many speculations on the role of mucilage in relation to water status of
plants. Mucilage exuded by the roots, with its high water holding capacity, may increase the
water holding capacity of the rhizosphere (McCully & Boyer, 2006). Mucilage contains many
organic components in particular polysaccharides that stabilize soil aggregates. In addition to
improving soil aggregation, the polysaccharides in mucilage form a continuous network that
acts as a sponge and has a considerable capacity to absorb water. Water is absorbed and
maintained in the network by osmotic, and capillary forces resulting in swelling of the matrix
and increasing the water content (Gessa & Deiana, 1990; Chenu, 1993; Chenu & Roberson,
1996; Or et al., 2007). On the other hand, mucilage also contains lipids that can act as
surfactants and alter the surface tension of water in soil. Change in surface tension will affect
on water holding capacity of the soil, unsaturated hydraulic conductivities, and solute
diffusion near to the root surface at any given soil matric potential. (Read & Gregory, 1997;
Czarnes et al., 2000; Hallett et al., 2003; Read et al., 2003; Whalley et al., 2005; Carminati et
al., 2010; Moradi et al., 2012). The significance of rhizosphere hydrophobicity upon
Introduction 10
rewetting may vary with plant species, root age, growth conditions, soil water content, and
number of wetting/drying cycles (Watt et al., 1994; Moradi et al., 2012).
Taking the advantage of new imaging techniques, experimental evidence of distribution of
water content in the rhizosphere became recently more available. Currently, there are two
different views on redistribution of water content around transpiring roots. MacFall et al.
(1990) observed lower water content occurring first in the rhizosphere of the taproot and then
extended to the laterals. Segal et al. (2008) also reported that the rhizosphere of two-week-old
barley had lower water content than the bulk soil. In contrast to these findings, a higher water
content in the rhizosphere has also been observed (Nakashi, 2005; Tumlinson et al., 2007;
Carminati et al., 2010; Moradi et al., 2011). Carminati et al. (2010) investigated the
redistribution of water in rhizosphere and bulk soil during a drying and wetting cycles. They
observed higher water content in the rhizosphere than in the bulk soil during drying. They
also observed a temporarily hydrophobic behavior of rhizosphere after rewetting.
Hydrophobicity of rhizosphere recovered during the following days and water content of the
rhizosphere increased and finally exceeded that of the bulk. However, literature information
on profile of water content in the rhizosphere of roots is puzzling. Carminati, (2012) believed
that two different views on the distribution of water around roots are not in contradiction and
they rather reflect the dynamic and hysteretic hydraulic behavior of the rhizosphere.
Depending on the history of the rhizosphere (state of hydration) and chemical composition of
the mucilage exuded into soil, the rhizosphere may turn hydrophobic or hydrophilic.
At first glance, the effect of mucilage on increasing water holding capacity of the rhizosphere
may seem insignificant due to the small size of rhizosphere (around 1-2 mm) and the high
water demand of plants. However, mucilage may have an important role in controlling the
flux of water into the roots, in particular as soil dries. Increase the water-holding capacity of
the rhizosphere may increase the hydraulic conductivity by avoiding the formation of deep-
water depletion in the immediate vicinity of the roots as soil dries. Modeling calculations by
Carminati et al. (2011) showed that the presence of mucilage in the rhizosphere reduced the
water potential gradients around the roots, helping plants to extract more water from the soil.
Although hydrophobicity of the rhizosphere has been reported by direct observation of water
redistribution in the soil (Carminati et al., 2010), measurements of contact angle between
water and soil particles in the rhizosphere (Moradi et al., 2012), and measurement of water
infiltration into the rhizosphere (Hallett et al., 2003; Read et al., 2003), its significance in root
water uptake is still unclear. The important questions to be answered are: what water
Chapter 1 11
potential does plants feel when the rhizosphere becomes hydrophobic? How may distribution
of water uptake zone along roots change when the rhizosphere becomes hydrophobic?
One may see hydrophobicity of the rhizosphere as a negative factor due to limitation of water
flow into roots, or a positive factor by preventing the back flow of water from the roots into
the dry soil. This may be important for root system with deep roots in contact with wet soil
and upper roots in a dry soil. These speculations should be tested in systematic experiments.
The lack of answer to these questions is due to lack of a technique that allows us to measure
the local flux of water into the roots.
Location of water uptake along roots
Where and how fast do roots take up water from soil is an important question in both soil and
plant science. Many efforts have been made to answer these questions. There are two
different views on the location of water uptake along the roots. Studies on root anatomy
variations along root have lead scientists to conclude that young parts of roots (apical parts)
are more involved in water uptake. Primarily measurements of radial hydraulic conductivity
of roots also confirmed this view. This view is still commonly cited in textbooks.
Recently, our understanding of water uptake and its transport in roots has been substantially
improved by new experimental techniques. Advanced modeling approaches combined with
detailed measurements of root hydraulic conductivities showed that depending on the relative
importance of radial and axial hydraulic conductivities the water uptake zone could be
variable along the root system (Landsberg & Fowkes, 1978; Frensch & Steudle, 1989;
Zwieniecki et al., 2003). These studies showed that the proximal parts of roots were more
involved in delivering water into roots than the distal parts. These studies also pointed out the
dynamic variation of the water uptake zone along root following root maturation and/or the
reduction of hydraulic conductance at the root surface in the soil. However, these results were
obtained from excised roots grown in hydroponic culture. The properties of these roots may
largely differ from those grown in soils.
Taking the advantage of new imaging techniques, researchers have been able to study water
uptake by roots grown in soil. Imaging techniques were used to monitor the distribution of
root and water content in soil. These observations revealed that greater changes in soil water
content appeared in the regions where root density was higher(Garrigues et al., 2006;
Pohlmeier et al., 2008). They also found that the location of root water uptake moved
Introduction 12
downwards along the soil profile starting from the upper soil layers when soil was initially
wet. Although these techniques allowed us to in situ observations of root growth in soil, they
could not reveal directly the fluxes of water into roots and need to be coupled with models of
root water uptake in soils. A review of the methods to measure root water uptake is given in
the following paragraphs.
Review of root water uptake measurements
Locations of water uptake along roots can be determined by measuring radial flux or axial
flux of water into and along roots, respectively. The radial flux of water into roots is defined
as the local speed of water crossing the root tissue [cm s-1]. The axial flux of water is defined
as the average velocity of water along the xylem vessels. The radial flux is a local measure of
the speed of water into roots and its distribution along roots tells us about the relative
importance of each segment of the root in water uptake. While the axial flux, its measure is
cumulative along roots toward the proximal parts and it does directly give information about
the location of water uptake.In the following section the main method of measuring fluxes are
reviewed:
1-Measurements of fluxes into and along single roots.
In these methods, the distribution of the fluxes is derived by measuring the radial and axial
resistances along the root. The main methods are: pressure probe, pressure chamber, and
high-pressure flow meter (Passioura, 1980; Frensch & Steudle, 1989; Tyree et al., 1995;
Zwieniecki et al., 2003; Knipfer & Fricke, 2010b). The principle of these techniques is rather
similar. An excised root is sealed into devices and then water flow in or out of the root is
measured as a function of the pressure gradient applied. The water flow can be induced by a
hydrostatic and/or somatic pressure gradient. The water flow is given by (House, 1974)
1
2 ext xJ rLR
(1.4)
Where J is the volumetric flow rate (cm3 s-1), r is the radius (cm), L is the length of root, R is
the root resistance (cm s-1 MPa-1), Ψext is thewater potential in the surrounding medium of the
root (MPa), and Ψx is the water potential at the cut end of the root. The calculated resistance
is the total resistance that water should overcome to flow in or out of the cut end of a root
with a length of L. The total resistance depends on the local radial and axial resistances. To
Chapter 1 13
assess the distribution of radial and axial resistance along the root, the root should be
successively cut into smaller segments from the apical parts toward the basal end of the root.
Due to the porous nature of roots, the pressure gradient applied to the cut end of the root may
dissipate along the root and, consequently, the apical parts of root are less involved in water
uptake (Frensch & Steudle, 1989; Zwieniecki et al., 2003). To assess the distribution of radial
and axial resistances along roots, the results have to be coupled with a model of water flow in
the root (Landsberg & Fowkes, 1978).
However, most of the measurement data available in literatures have not undertaken the
efforts to calculate the distribution of resistances along the root and they just reported the
total resistance. Frensch & Steudle (1989) using a root pressure probe apparatus measured
hydraulic resistance along a 14 cm excised root of maize. They showed that the flow of
water into the root was mainly restricted by the radial resistance of the root, except in the
apical parts (1-2cm) that were hydraulically isolated from the rest of the root due to high axial
resistance. They showed that axial resistance was high at the distal parts of the roots and it
decreased towards the more proximal parts of the roots. They showed that the radial
resistance depended on the nature of pressure gradient applied to move water: the measured
radial resistance by inducing hydrostatic flow was approximately 4 times bigger than that of
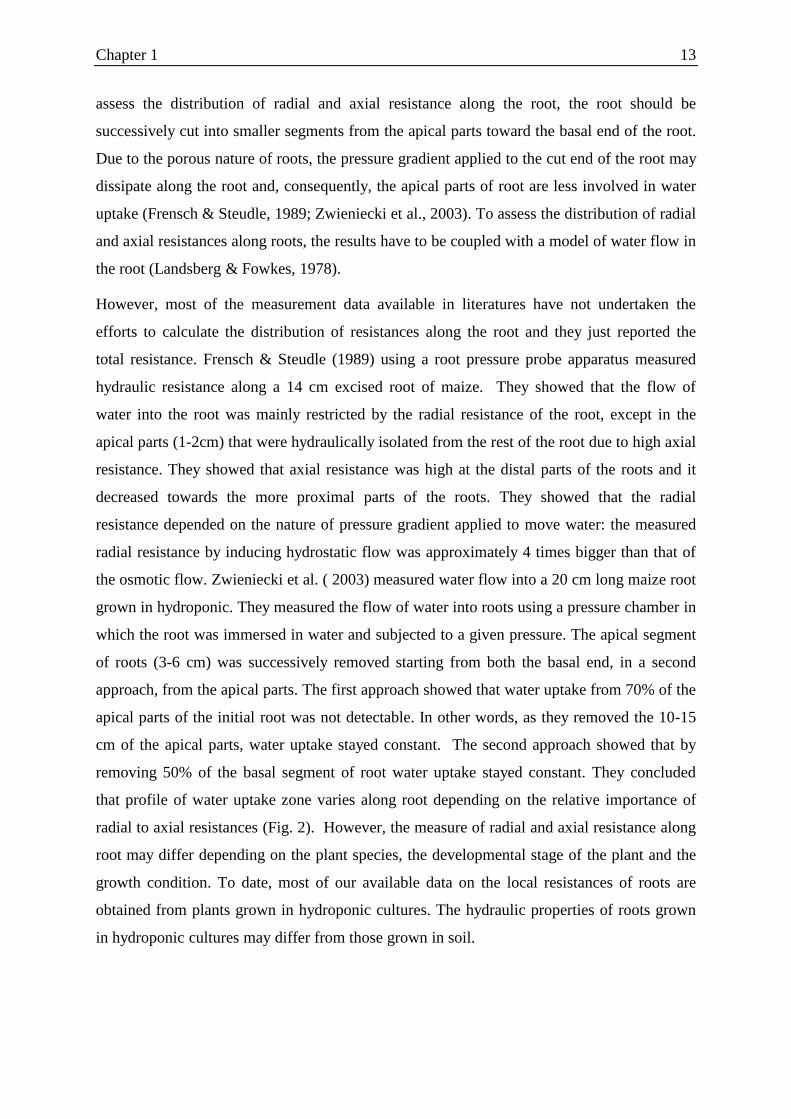
the osmotic flow. Zwieniecki et al. ( 2003) measured water flow into a 20 cm long maize root
grown in hydroponic. They measured the flow of water into roots using a pressure chamber in
which the root was immersed in water and subjected to a given pressure. The apical segment
of roots (3-6 cm) was successively removed starting from both the basal end, in a second
approach, from the apical parts. The first approach showed that water uptake from 70% of the
apical parts of the initial root was not detectable. In other words, as they removed the 10-15
cm of the apical parts, water uptake stayed constant. The second approach showed that by
removing 50% of the basal segment of root water uptake stayed constant. They concluded
that profile of water uptake zone varies along root depending on the relative importance of
radial to axial resistances (Fig. 2). However, the measure of radial and axial resistance along
root may differ depending on the plant species, the developmental stage of the plant and the
growth condition. To date, most of our available data on the local resistances of roots are
obtained from plants grown in hydroponic cultures. The hydraulic properties of roots grown
in hydroponic cultures may differ from those grown in soil.
Introduction 14
2-Measurement root water using potometer
A potometer directly measures the rate of water into different locations of the root of an
intake plant grown in hydroponic. Different locations of the roots are sealed into a tube filled
with water and then the rate of water uptake is monitored by the change in volume of water in
each tube. The potometer and roots should be immersed in water during the measurements.
There have been many different potometer designed to measure the water uptake rate by
roots.
Figure 2: Measured (point) and calculated (lines) value of water uptake along a 20 cm excised root of
Maize. Length of root is percent of unsuberized root length and water uptake is percent of total root
water uptake. The shaded area represents the suberized portion of the root. Lines represent the profile of
water uptake along root modeled for different ratios between axial and radial resistance (from Zwieniecki
et al., 2003).
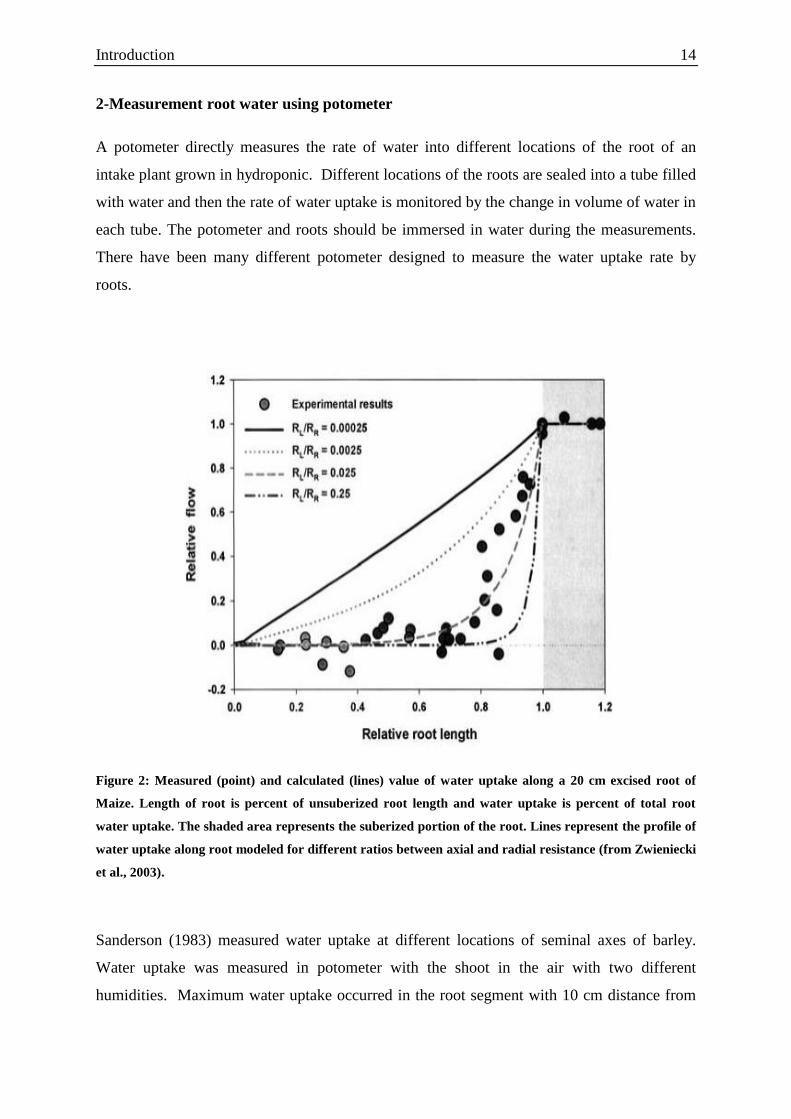
Sanderson (1983) measured water uptake at different locations of seminal axes of barley.
Water uptake was measured in potometer with the shoot in the air with two different
humidities. Maximum water uptake occurred in the root segment with 10 cm distance from
Chapter 1 15
the root tip and it decreased towards the distal and the proximal parts (Fig. 3). He found that
the increasing transpiration rate was accompanied by a more marked increase in the water
uptake rate at the proximal parts of roots.
Although application of this technique to answer the question which parts of roots are more
involved in water uptake is straightforward, its application is limited to roots grown in a
hydroponic system.
Figure 3: Water uptake of different location of roots along the seminal axes of barley, at two air humidity
regimes, in relation to the development of the endodermis (. From Sanderson 1983).
3- Experiment with dye tracers
In these techniques, water uptake is quantified based on accumulation rate of a dye inside the
root tissue or at the root surface. The concept is that when a dye is added to the solution in the
root medium, it accumulates faster in the parts where the water uptake rate is higher. The dye
may accumulate in the apoplast where water passes the cell membrane or at the root surface if
transport of water is purely cell to cell.
The dye accumulation inside the root tissue depends on the critical assumption that the
apoplastic pathway is fully interrupted at the root endodermis. However, when the apoplastic
pathway is not fully interrupted at the root endodermis, there will some apoplastic transport
Introduction 16
of the dye into the root stele followed by an axial flow along xylem, which results in a
uniform distribution of the dye or in the accumulation of dye at the more proximal parts of
roots near to shoots. In this case, radial flux cannot be derived from the dye concentration
solely.
In the case of monitoring the accumulation rate of the dye at the root surface, the critical
assumption is that the dye does not diffuse through the membrane of root cells, and the
transport of water into roots is purely cell-to-cell. If the solute penetrates the membrane of the
root cell or it is transported through apoplastic pathway, the rate of water uptake is
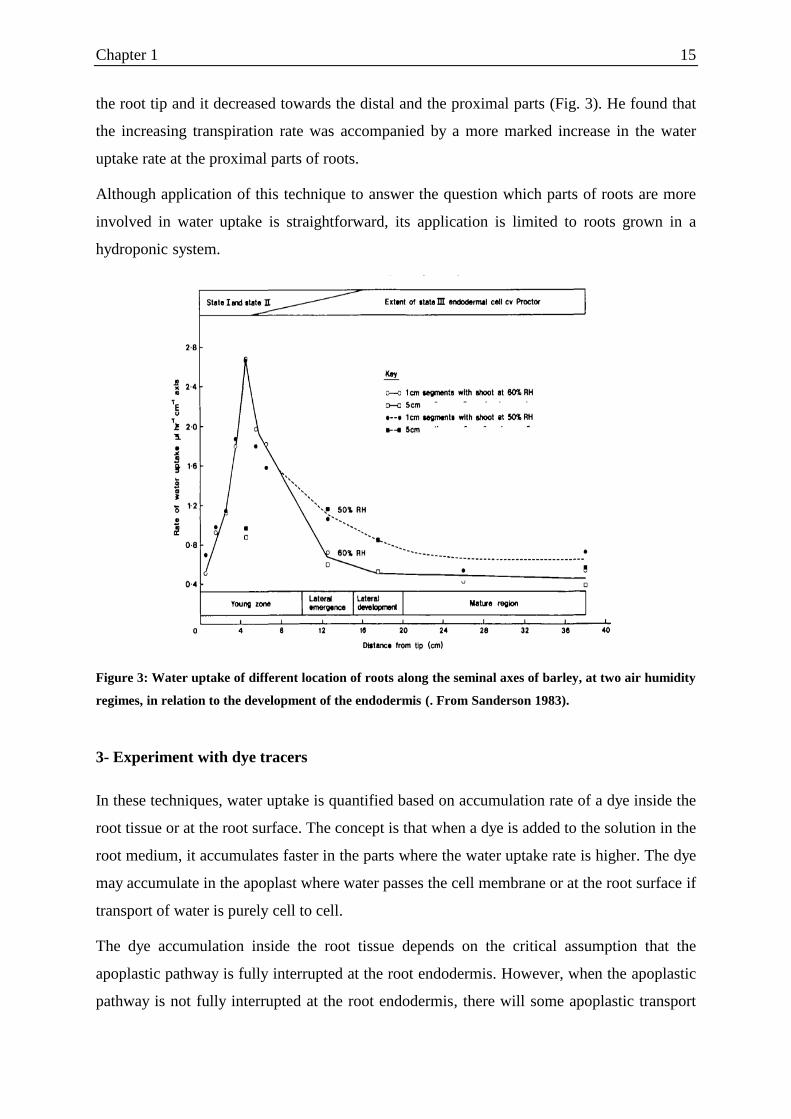
underestimated. Varney & Canny (1993) introduced a new dye based method of measuring
water uptake by roots, which was applied to whole root systems of large maize plants
growing in aeroponic culture. The method depends on the buildup of concentration of dye
(sulphorhodamine G) on the root surface. The local rate of accumulation of dye was related to
flux of water into the roots. They observed that maximum uptake from laterals occurred at
30-60 cm from the root tip of the main axes, and it decreased towards the tip and the
proximal parts (Fig. 4). Although this technique could be used to measure the rate of water
uptake along mature roots and branch roots, its application is limited to roots grown in
aeroponic system.

Chapter 1 17
Figure 4: Water flux into different locations of roots along the axes and branches of mature maize grown
in aeroponic culture (from Varney & Canny, 1993).
4- Measurement of root water uptake in soil
Recently, advanced imaging methods like x-ray computed tomography, light transmission
imaging, magnetic resonance imaging, and neutron radiography have been applied to monitor
the spatial distribution of root and soil water contents (Pierret et al., 2003; Garrigues et al.,
2006; Pohlmeier et al., 2008; Moradi et al., 2011). Garrigues et al. (2006) used light
transmission imaging to observe root and water content distributions in an artificial soil. They
found that water uptake zone was initially at the upper layer of soil and it moved downwards
as the upper soil dried. Pohlmeier et al. (2008) used magnetic resonance imaging (MRI) to
study water content changes in soil caused by root water uptake. They found that greater
changes in soil water content appeared in the regions where root density was higher.
These imaging techniques qualitatively showed the location of water uptake along the roots.
To quantify the water uptake, in particular along each individual roots, the changes in soil
water content should be coupled with simulation of water redistribution in the soil profile.
This requires accurate knowledge of the soil hydraulic properties in the root zone, which are
difficult to experimentally characterize. For instance, Carminati et al. (2010) reported that the
hydraulic properties of the rhizosphere were different from those of the bulk soil. Such
heterogeneity of soil properties in the root zone may complicate the interpretation of soil
water content changes in relation to root water uptake.
Besides that, the application of these techniques is often limited to dry soil. In wet soil, in the
soil hydraulic conductivity is much higher than that of the roots resulting in a very fast
redistribution of water in the soil. Additionally, these methods are not able to differentiate the
water uptake of two or more neighboring roots due to the redistribution of water in the soil.
Introduction 18
5- Measurement root water using heat-based sap flow gauges
Heat-based sap flow gauges were initially developed for plant stems and have been recently
modified for application to roots (Coners & Leuschner, 2002). The principle of this
measurement is that a heat pulse is released either on the surface of root through a probe
attached to the surface or inside the root tissue through an implanted probe into the xylem
tissue. The probes and the root tissues at the place of measurement are carefully isolated from
the sounding soil to reduce heat dissipation. The intensity and/or redistribution of the applied
pulse at a certain distance are recorded and related to the rate of sap flow in xylem. Different
types of these devices have been developed and tested (Howard et al., 1996; Lott et al., 1996;
Smith & Allen, 1996; Coners & Leuschner, 2002). These techniques quantify root water
uptake by measuring the axial flux of water in xylem. Axial flux of water in the xylem is a
local measure of the speed of water along root and it is a cumulative parameter along the
roots. Application of this technique is limited to roots with diameters larger than 3 mm.
Chapter 1 19
Aim of this study
In the last decades, fundamental advances have been made in the conceptual understanding
and modeling of root water uptake. Despite the modeling advances, there is still a lack of
experimental data on basic questions such as: where do roots take up water from soil? Are
taproot and laterals equally involved in water uptake? What segments of individual roots are
more active in water uptake, the proximal or the distal segments? Experiments with roots
grown in a hydroponic system showed that 10 to 30% of the total root length are sufficient to
fulfill the transpirational demand (Frensch & Steudle, 1989; Zwieniecki et al., 2003). This
finding was also confirmed by monitoring and modeling water uptake by roots growing in
soil (Passioura, 1980; Doussan et al., 2006; Garrigues et al., 2006). However, an important
question is which of the 10-30% of the roots are actively involved in water uptake.
Answering all of these questions need in situ measurement of local flow of water into the
roots of transpiring plants grown in soil.
The aims of this study were to develop, and apply a new technique to measure local fluxes of
water into the roots of plants growing in soil and investigate on the effects of rhizosphere on
root water uptake. The specific objectives were:
To develop a new method to measure the local flux of water into the roots of plants
growing in soil.
To apply the technique to different locations of roots and to map the flux of water
along the roots. The finding will answer the questions about what parts of the roots
are more involved in water uptake.
To assess the effect of rhizosphere on flow of water into the roots.
Introduction 20
Outlooks
The study proceeded in four steps, each of which is described in one of the main chapters of
this dissertation:
1-We introduce a new technique to measure the local flux of water into the roots of plants
growing in soil by combining neutron radiography with local injection of deuterated water
(D2O) into the soil next to roots. The spatial and temporal distribution of D2O in both soil and
plants was monitored using time series neutron radiography. The transport of water into roots
was quantified using a convection-diffusion model of D2O transport into roots. As the first
attempt, the model was developed to describe the transport of D2O into root segments that
were entirely immersed in D2O.
2- We further modified the description of the proposed model to describe the transport of
D2O into roots that were partly immersed in D2O. We have also generalized the description of
the model to allow a varying importance of apoplastic and cell-to-cell flow across the root
tissue. We measured and modeled D2O transport into different locations of the roots.
3- We applied the technique to determine the water fluxes across dry and wet rhizosphere.
Our goal was to verify whether and to what extent the rhizosphere conductivity limits the
water fluxes to roots during rewetting.
4- We investigated a new method to estimate the effective hydraulic conductivity of the
rhizosphere following of a rewetting cycle. We used a time series neutron radiography to
monitor redistribution of water in soil and roots after a rewatting cycle. We used the swelling
rate of roots as an indication of water flow into the roots to estimate the effective hydraulic
conductivity of the rhizoshere.
Chapter 1 21
References
Bengough, A.G. 2012. Water Dynamics of the Root Zone: Rhizosphere Biophysics and Its
Control on Soil Hydrology. Vadose Zone Journal 11, 0.
Bramley, H., Turner, N.C., Turner, D.W., & Tyerman, S.D. 2009. Roles of morphology,
anatomy, and aquaporins in determining contrasting hydraulic behavior of roots. Plant
Physiol. 150, 348–364.
Canny, M.J. 1995. Apoplastic water and solute movement: new rules for an old space. Annu.
Rev. Plant Biol. 46, 215–236.
Carminati, A. 2012. A Model of Root Water Uptake Coupled with Rhizosphere Dynamics.
Vadose Zone J. 11
Carminati, A., Moradi, A.B., Vetterlein, D., Vontobel, P., Lehmann, E., Weller, U., Vogel,
H.-J., & Oswald, S.E. 2010. Dynamics of soil water content in the rhizosphere. Plant
Soil 332, 163–176.
Carminati, A., Schneider, C.L., Moradi, A.B., Zarebanadkouki, M., Vetterlein, D., Vogel,
H.J., Hildebrandt, A., Weller, U., Schüler, L., & Oswald, S.E. 2011. How the
Rhizosphere May Favor Water Availability to Roots. Vadose Zone J. 10, 988–998.
Chaves, M.M., Maroco, J.P., & Pereira, J.S. 2003. Understanding plant responses to drought
— from genes to the whole plant. Functional Plant Biol. 30, 239–264.
Chenu, C. 1993. Clay-or sand-polysaccharide associations as models for the interface
between micro-organisms and soil: water related properties and microstructure.
Geoderma 56, 143–156.
Chenu, C., & Roberson, E.B. 1996. Diffusion of glucose in microbial extracellular
polysaccharide as affected by water potential. Soil Biol. Biochem. 28, 877–884.
Coners, H., & Leuschner, C. 2002. In situ water absorption by tree fine roots measured in real
time using miniature sap-flow gauges. Funct. Ecol. 16, 696–703.
Czarnes, S., Hallett, P.D., Bengough, A.G., & Young, I.M. 2000. Root-and microbial-derived
mucilages affect soil structure and water transport. Eur. J. Soil. Sci. 51, 435–443.
Dale, M.P., & Causton, D.R. 1992. The ecophysiology of Veronica chamaedrys, V. montana
and V. officinalis. I. Light quality and light quantity. J. Ecol., 483–492.
Dias-Filho, M.B. 1995. Root and shoot growth in response to soil drying in four Amazonian
weedy species. Revista Brasileira de Fisiologia Vegetal 7, 53–59.
Doussan, C., Pierret, A., Garrigues, E., & Pagès, L. 2006. Water Uptake by Plant Roots: II –
Modelling of Water Transfer in the Soil Root-system with Explicit Account of Flow
within the Root System – Comparison with Experiments. Plant Soil 283, 99–117.
Introduction 22
Dousssan, C., Vercambre, G., & Page, L. 1998. Modelling of the hydraulic architecture of
root systems: An integrated approach to water absorption—distribution of axial and
radial conductances in maize. Ann. Bot-London 81, 225–232.
Draye, X., Kim, Y., Lobet, G., & Javaux, M. 2010. Model-assisted integration of
physiological and environmental constraints affecting the dynamic and spatial
patterns of root water uptake from soils. J. Exp. Bot. 61, 2145–2155.
Enstone, D.E., Peterson, C.A., & Ma, F. 2003. Root Endodermis and Exodermis: Structure,
Function, and Responses to the Environment. J. Plant Growth Regul. 21, 335–351.
Frensch, J., & Steudle, E. 1989. Axial and radial hydraulic resistance to roots of maize (Zea
mays L.). Plant Physiol. 91, 719–726.
Fritz, M., & Ehwald, R. 2011. Mannitol permeation and radial flow of water in maize roots.
New Phytol. 189, 210–217.
Gallagher, J.N., Biscoe, P.V., & Hunter, B. 1976. Effects of drought on grain growth. Nature
264, 541–542.
Gardner, W.R. 1960. Dynamic aspects of water availability to plants. Soil Sci. 89, 63–73.
Garrigues, E., Doussan, C., & Pierret, A. 2006. Water Uptake by Plant Roots: I – Formation
and Propagation of a Water Extraction Front in Mature Root Systems as Evidenced by
2D Light Transmission Imaging. Plant Soil 283, 83–98.
Gessa, C., & Deiana, S. 1990. Fibrillar structure of Ca polygalacturonate as a model for a
soil-root interface. Plant Soil 129, 211–217.
Gregory, P.J. 2006. Roots, rhizosphere and soil: the route to a better understanding of soil
science? Eur. J. Soil. Sci. 57, 2–12.
Gregory, P.J., & Hinsinger, P. 1999. New approaches to studying chemical and physical
changes in the rhizosphere: an overview. Plant Soil 211, 1–9.
Hallett, P.D., Gordon, D.C., & Bengough, A.G. 2003. Plant influence on rhizosphere
hydraulic properties: direct measurements using a miniaturized infiltrometer. New
Phytol. 157, 597–603.
Henzler, T., & Steudle, E. 1995. Reversible closing of water channels in Chara internodes
provides evidence for a composite transport model of the plasma membrane. J. Exp.
Bot. 46, 199–209.
Hinsinger, P., Gobran, G.R., Gregory, P.J., & Wenzel, W.W. 2005. Rhizosphere geometry
and heterogeneity arising from root-mediated physical and chemical processes. New
Phytol. 168, 293–303.
Holbrook, N.M., Burns, M.J., & Field, B. 1995. Negative xylem pressures in plants: a test of
the balancing pressure technique. Science v. 270(5239), 1193-1194
House, C.R. 1974. Water transport in cells and tissues. London, E. Arnold.

Chapter 1 23
Howard, S.B., Ong, C.K., Black, C.R., & Khan, A.A. 1996. Using sap flow gauges to
quantify water uptake by tree roots from beneath the crop rooting zone in agroforestry
systems. Agroforestry Systems 35, 15–29.
Howell, T.A. 2001. Enhancing Water Use Efficiency in Irrigated Agriculture. Agronomy
Journal 93, 281.
Hu, T., Kang, S., Li, F., & Zhang, J. 2011. Effects of partial root-zone irrigation on hydraulic
conductivity in the soil-root system of maize plants. J. Exp. Bot. 62, 4163–4172.
Huang, B., & Eissenstat, D.M. 2000. Linking hydraulic conductivity to anatomy in plants that
vary in specific root length. J. Am. Soc. Hortic. Sci. 125, 260–264.
Iijima, M., Sako, Y., & Rao, T.P. 2003. A new approach for the quantification of root-cap
mucilage exudation in the soil. Plant Soil 255, 399–407.
Kirkham, M.B. 2005. Principles of soil and plant water relations. Academic Press.
Knipfer, T., Besse, M., Verdeil, J.-L., & Fricke, W. 2011. Aquaporin-facilitated water uptake
in barley (Hordeum vulgare L.) roots. J. Exp. Bot. 62, 4115–4126.
Knipfer, T., & Fricke, W. 2010a. Root pressure and a solute reflection coefficient close to
unity exclude a purely apoplastic pathway of radial water transport in barley
(Hordeum vulgare). New Phytol. 187, 159–170.
Knipfer, T., & Fricke, W. 2010b. Water uptake by seminal and adventitious roots in relation
to whole-plant water flow in barley (Hordeum vulgare L.). J. Exp. Bot. 62, 717–733.
Koch, G.W., Sillett, S.C., Jennings, G.M., & Davis, S.D. 2004. The limits to tree height.
Nature 428, 851–854.
Kudrev, T.G. 1988. Water and plant productivity. , 190 pp.
Landsberg, J.J., & Fowkes, N.D. 1978. Water movement through plant roots. Ann. Bot-
London 42, 493–508.
Laraus, J. 2004. The problems of sustainable water use in the Mediterranean and research
requirements for agriculture. Ann. Bot-London 144, 259–272.
Lott, J.E., Khan, A.A.H., Ong, C.K., & Black, C.R. 1996. Sap flow measurements of lateral
tree roots in agroforestry systems. Tree Physiol. 16, 995–1001.
MacFall, J.S., Johnson, G.A., & Kramer, P.J. 1990. Observation of a water-depletion region
surrounding loblolly pine roots by magnetic resonance imaging. Proc. Natl. Acad. Sci.
USA 87, 1203.
Magnani, F., Centritto, M., & Grace, J. 1996. Measurement of apoplasmic and cell-to-cell
components of root hydraulic conductance by a pressure-clamp technique. Planta
199, 296–306.
Maurel, C., & Chrispeels, M.J. 2001. Aquaporins. A molecular entry into plant water
relations. Plant Physiol. 125, 135–138.

Introduction 24
McCully, M. 1995. How Do Real Roots Work?(Some New Views of Root Structure). Plant
Physiol. 109, 1–6.
McCully, M.E., & Boyer, J.S. 2006. The expansion of maize root-cap mucilage during
hydration. 3. Changes in water potential and water content. Physiol. Plantarum 99,
169–177.
McCully, M.E., & Canny, M.J. 1988. Pathways and processes of water and nutrient
movement in roots. Plant Soil 111, 159–170.
McLean, E.H., Ludwig, M., & Grierson, P.F. 2011. Root hydraulic conductance and
aquaporin abundance respond rapidly to partial root-zone drying events in a riparian
Melaleuca species. New Phytol. 192, 664–675.
Miraglia, M., Marvin, H.J.P., Kleter, G.A., Battilani, P., Brera, C., Coni, E., Cubadda, F.,
Croci, L., De Santis, B., Dekkers, S., Filippi, L., Hutjes, R.W.A., Noordam, M.Y.,
Pisante, M., Piva, G., Prandini, A., Toti, L., Van den Born, G.J., & Vespermann, A.
2009. Climate change and food safety: An emerging issue with special focus on
Europe. Food Chem. Toxicol. 47, 1009–1021.
Moradi, A.B., Carminati, A., Lamparter, A., Woche, S.K., Bachmann, J., Vetterlein, D.,
Vogel, H.J., & Oswald, S.E. 2012. Is the rhizosphere temporarily water repellent?
Vadose Zone J. 11.
Moradi, A.B., Carminati, A., Vetterlein, D., Vontobel, P., Lehmann, E., Weller, U.,
Hopmans, J.W., Vogel, H.-J., & Oswald, S.E. 2011. Three-dimensional visualization
and quantification of water content in the rhizosphere. New Phytol. 192, 653–663.
Moshelion, M., Moran, N., & Chaumont, F. 2004. Dynamic changes in the osmotic water
permeability of protoplast plasma membrane. Plant Physiol. 135, 2301–2317.
Nakaji, T., Noguchi, K., & Oguma, H. 2007. Classification of rhizosphere components using
visible–near infrared spectral images. Plant Soil 310, 245–261.
Nakashi, T.M. 2005. Water gradient profiles at bean plant roots determined by neutron beam
analysis. J. Radioanal. Nucl. Chem. 264, 313–317.
Nobel, P.S., & Cui, M. 1992. Hydraulic conductances of the soil, the root-soil air gap, and the
root: changes for desert succulents in drying soil. J. Exp. Bot. 43, 319–326.
Oki, T., & Kanae, S. 2006. Global hydrological cycles and world water resources. Science
313, 1068–1072.
Or, D., Phutane, S., & Dechesne, A. 2007. Extracellular polymeric substances affecting pore-
scale hydrologic conditions for bacterial activity in unsaturated soils. Vadose Zone J.
6, 298–305.
Passioura, J.B. 1980. The Transport of Water from Soil to Shoot in Wheat Seedlings. J. Exp.
Bot. 31, 333–345.
Passioura, J.B. 1988. Water transport in and to roots. 39, 245–265.
Chapter 1 25
Perumalla, C.J., & Peterson, C.A. 1986. Deposition of Casparian bands and suberin lamellae
in the exodermis and endodermis of young corn and onion roots. Botany 64, 1873–
1878.
Peterson, C.A., Emanuel, M.E., & Humphreys, G.B. 1981. Pathway of movement of
apoplastic fluorescent dye tracers through the endodermis at the site of secondary root
formation in corn (Zea mays) and broad bean (Vicia faba). Can. J. Bot 59, 618–625.
Peterson, C.A., Murrmann, M., & Steudle, E. 1993. Location of the major barriers to water
and ion movement in young roots of Zea mays L. Planta 190, 127–136.
Pohlmeier, A., Oros-Peusquens, A., Javaux, M., Menzel, M.I., Vanderborght, J., Kaffanke, J.,
Romanzetti, S., Lindenmair, J., Vereecken, H., & Shah, N.J. 2008. Changes in soil
water content resulting from Ricinus root uptake monitored by magnetic resonance
imaging. Vadose Zone J. 7, 1010–1017.
Ranathunge, K.M. 2005. The role of the apoplastic transport barriers for radial water and ion
uptake in rice (Oryza sativa L.) and corn (Zea mays L.) roots.
Read, D.B., Bengough, A.G., Gregory, P.J., Crawford, J.W., Robinson, D., Scrimgeour,
C.M., Young, I.M., Zhang, K., & Zhang, X. 2003. Plant roots release phospholipid
surfactants that modify the physical and chemical properties of soil. New Phytol. 157,
315–326.
Read, D.B., & Gregory, P.J. 1997. Surface tension and viscosity of axenic maize and Lupine
root mucilages. New Phytol., 623–628.
Reinhardt, D.H., & Rost, T.L. 1995. Salinity accelerates endodermal development and
induces an exodermis in cotton seedling roots. Environ.Exp. Bot. 35, 563–574.
Saliendra, N.Z., Sperry, J.S., & Comstock, J.P. 1995. Influence of leaf water status on
stomatal response to humidity, hydraulic conductance, and soil drought in Betula
occidentalis. Planta 196, 357–366.
Sanderson, J. 1983. Water uptake by different regions of the barley root. Pathways of radial
flow in relation to development of the endodermis. J. Exp. Bot. 34, 240–253.
Schulze, E. 1986. Whole-Plant Responses to Drought. Functional Plant Biol. 13, 127–141.
Segal, E., Kushnir, T., Mualem, Y., & Shani, U. 2008. Microsensing of water dynamics and
root distributions in sandy soils. Vadose Zone J. 7, 1018–1026.
Smith, D.M., & Allen, S.J. 1996. Measurement of sap flow in plant stems. J. Exp. Bot. 47,
1833–1844.
Stanhill, G. 1986. Water Use Efficiency. p. 53–85. In N.C. Brady (ed.), Advan. Agron.
Academic Press.
Steudle, E. 2000. Water uptake by plant roots: an integration of views. Plant Soil 226, 45–56.
Steudle, E., & Peterson, C.A. 1998. How does water get through roots? J. Exp. Bot. 49, 775–
788.

Introduction 26
Tumlinson, L.G., Liu, H., Silk, W.K., & Hopmans, J.W. 2007. Thermal Neutron Computed
Tomography of Soil Water and Plant Roots. Soil Sci. Soc. Am. J. 72, 1234–1242.
Tyree, M.T., Patiño, S., Bennink, J., & Alexander, J. 1995. Dynamic measurements of roots
hydraulic conductance using a high-pressure flowmeter in the laboratory and field. J.
Exp. Bot. 46, 83–94.
Varney, G.T., & Canny, M.J. 1993. Rates of water uptake into the mature root system of
maize plants. New Phytol. 123, 775–786.
Walker, T.S., Bais, H.P., Grotewold, E., & Vivanco, J.M. 2003. Root exudation and
rhizosphere biology. Plant Physiol. 132, 44–51.
Watt, M., McCully, M.E., & Canny, M.J. 1994. Formation and stabilization of rhizosheaths
of Zea mays L.(Effect of soil water content). Plant Physiol. 106, 179–186.
Whalley, W.R., Riseley, B., Leeds-Harrison, P.B., Bird, N.R.A., Leech, P.K., & Adderley,
W.P. 2005. Structural differences between bulk and rhizosphere soil. Eur. J. Soil. Sci.
56, 353–360.
Zimmermann, U., Rygol, J., Balling, A., Klöck, G., Metzler, A., & Haase, A. 1992. Radial
turgor and osmotic pressure profiles in intact and excised roots of Aster tripolium:
pressure probe measurements and nuclear magnetic resonance-imaging analysis.
Plant Physiol. 99, 186-196.
Zimmermann, H.M., & Steudle, E. 1998. Apoplastic transport across young maize roots:
effect of the exodermis. Planta 206, 7–19.
Zwieniecki, M.A., Thompson, M.V., & Holbrook, N.M. 2003. Understanding the Hydraulics
of Porous Pipes: Tradeoffs Between Water Uptake and Root Length Utilization. J.
Plant Growth Regul. 21, 315–323.
Chapter 2 27
Quantification and modeling of local root water uptake
using neutron radiography and deuterated water
M. Zarebanadkouki, Y.X. Kim, A. B. Moradi, H-J. Vogel, A. Kaestner, A. Carminati
Published in Vadose Zone Journal (2012), Vol. 11 No. 3
Quantification and modeling of local root water uptake 28
Abstract
Knowledge of local water fluxes across the soil-root interface is essential to understand and
model root water uptake. Despite its importance, there is a lack of direct methods to measure
the location of water uptake along the roots. The aim of this study is to develop a technique to
quantify local fluxe of water from the soil to the roots of living plants. To this end, we used
neutron radiography to trace the transport of deuterated water (D2O) into individual roots. We
grew Lupines in 30×25×1 cm containers filled with a sandy soil, which was partitioned into
different compartments using 1cm-thick layers of coarse sand. We locally injected D2O in a
selected soil compartment near the roots of eighteen-day old Lupines during the day
(transpiring) and night (non-transpiring). The transport of D2O into roots was then monitored
using time-series neutron radiography. The results show that: 1) The transport of D2O into
roots was faster during the day than during the night; 2) during day D2O was quickly
transported along the roots towards the shoots, while at night this transport was insignificant.
The differences between day and night measurements were explained by convective transport
of D2O into the roots driven by transpiration. To quantify the local transport of D2O into
roots, we developed a simple convection-diffusion model that assumed the endodermis as the
main resistance to water transport. The D2O uptake predicted by the model was in agreement
with the axial flow within the roots as derived from the transport of D2O behind the capillary
barrier. This new method allows for quantification of local water uptake in different parts of
the root system.
Introduction
In the last decades, fundamental advances have been made in the conceptual understanding
and modeling of root water uptake. Many models of root water uptake are available with
various degrees of complexity (Landsberg and Fowkes, 1978; Somma et al., 1998; Roose
and Fowler, 2004; Doussan et al., 2006; De Jong Van Lier et al., 2006; Javaux et al., 2008).
Although recent architectural models are capable of taking into account local root water
uptake and can predict the water uptake pattern across the root length, there is a lack of
experimental data on their parameterizations and validations.
Root water uptake is a dynamic process that involves complex interactions between roots and
the surrounding soil (Passioura, 1980; Steudle, 2000; Draye et al., 2010). It is assumed that
Chapter 2 29
root resistance controls water uptake in relatively wet soils. As soil dries, soil hydraulic
resistance increases and may restrict the flow of water to roots. Detailed measurements of
root hydraulic properties along individual roots have mainly been performed on excised roots
growing in hydroponic culture (Frensch and Steudle, 1989; Huang and Nobel, 1993; Frensch
et al., 1996; Barrowclough et al., 2000; Zwieniecki et al., 2003; McLean et al., 2011).
Frensch and Steudle, (1989) and Zwieniecki et al. (2003) demonstrated experimentally and
theoretically that the distributed nature of water uptake zone depends on the relative
importance of radial and axial resistance. These two resistances change with root maturation
and soil water content.
So far, it has been difficult to experimentally measure local water uptake along an individual
soil-grown root and most of existing data are obtained from excised root grown in hydroponic
systems. However, dynamics of root water uptake in the soil may be more complex than in
hydroponic cultures. A complexity is that roots growing in the soil may have different
hydraulic properties than those in hydroponics (Peterson et al., 1993; Enstone et al., 2002;
Meyer et al., 2009). Additionally, root water uptake is influenced by the heterogeneous
distribution of water in the soil and the presence of rhizosphere with distinct hydraulic
properties (Carminati et al., 2010; Moradi et al., 2011).
Recently, advanced experimental methods including X-ray computer tomography, light
transmission imaging, magnetic resonance imaging and neutron tomography have been
applied to monitor the spatial distribution of root and soil water content (Pierret et al., 2003;
Garrigues et al., 2006; Pohlmeier et al., 2008; Moradi et al., 2011). Pierret et al. (2003) used
X-ray transmission to monitor root distribution and soil water content around living roots in
two dimensions. Pohlmeier et al. (2008) used magnetic resonace imaging (MRI) to study
water content change in the soil caused by root water uptake. They found that greater changes
in soil water content appeared in the regions where root density was higher. Changes in soil
water content were also observed in regions where no root was observed in MRI images.
Therefore, they called for a higher spatially-resolved observation of fine roots, and coupling
the experimental measurements with an advanced modeling approach for better
understanding of water flow along the distance in the soil. Using neutron tomography,
Moradi et al. (2011) demonstrated that there was more water in the rhizosphere of lupins,
maizes and chick peas than in the bulk soil during a drying cycle caused by root water
uptake. Garrigues et al. (2006) used light transmission imaging to observe root and water
content distribution in thin samples filled with an artificial translucent medium (mixture of
Quantification and modeling of local root water uptake 30
98.5% Fontainebleau sand and 1.5% Hectorite clay). In a follow up study, Doussan et al.
(2006) modelled the observed water content distribution by coupling the water flow in soils
and roots. They found that the location of root water uptake moved downwards along the soil
profile starting from the upper soil layers when soil was initially wet. The above mentioned
studies indirectly estimated root water uptake from the changes in soil water content after
stimulation of the water redistribution in the soil profile. The method requires accurate
knowledge of the soil hydraulic properties in the root zone, which is difficult to
experimentally characterize. For instance, Carminati et al. (2010) reported that the hydraulic
properties of the rhizosphere were different than those of the bulk soil. Such heterogeneity of
soil properties in the root zone may complicate the interpretation of the soil water content
changes in relation to root water uptake. Additionally, these methods are not able to
differentiate the water uptake of two or more neighboring roots due to the redistribution of
water in soil. An alternative method is miniature sap-flow gauges (Coners and Leuschner,
2002). They measured water flow along fine roots of trees. This technique can be applied to
the roots with diameters down to 3 mm, but it does not explicitly measure the radial flow
across the root-soil interface and it only measures the axial flow of water in xylem after a
certain length of root without giving information on the location of the uptake.
A direct measurement of local water uptake along individual roots growing in soil is highly
desirable for better understanding of root function, particularly in response to various
environmental conditions. The objective of this study was to introduce an in-situ technique
for quantification of radial and axial flow of water into and within the roots. The method
consists of monitoring the transport of deuterated water (D2O) into roots by means of neutron
radiography. Neutron radiography was chosen because of the high sensitivity to water, which
makes roots more visible than in X-ray radiography, and because of the high contrast
between D2O and H2O. The use of neutron radiography and D2O was first proposed by
Matsushima et al. (2008). They used D2O to image water fluxes in roots and shoot of living
plants. However, they did not localize and quantify the flow of water into the roots. Our
intention was to derive the quantitative the local water flow to the roots from the observed
D2O transport. The results are expected to provide a better understanding of root water uptake
and provide a database to evaluate and improve existing models.
Chapter 2 31
Materials and methods
Preparation of the soil and plants
Experiments were carried out on 18-day-old Lupines (Lupine Albus) grown in aluminum
containers (25 cm wide, 30 cm high and 1 cm thick) filled with a sandy soil. The sandy soil
was collected from the artificial catchment Chicken Creek located near Cottbus, Germany.
The soil (sieved to < 2 mm) consisted of approximately 92% sand, 5% silt, 3% clay and had a
bulk density of 1.4 g cm-3. The soil hydraulic properties are given in Carminati et al. (2010).
The containers were filled with soil while they were laid horizontally. A grid was placed into
the containers to separate the sample into 16 compartments (4 rows × 4 columns). The sandy
soil was poured into each compartment through one sieve to favor a homogeneous soil
deposition and to reduce soil layering. The space between the compartments was 1 cm wide
and was filled with a coarse sand (grain diameter of 1.2-1.7 mm), which acted as capillary
barriers to hydraulically disconnect the adjacent compartments. The containers were then
closed and the samples were gently placed vertically. The average bulk density of the packed
soil in each compartment was 1.4 g cm-3. One face of each container was perforated using a
1-mm thick drill forming a network of holes each 3 cm apart. A fine-needle syringe was used
for injecting D2O into the desired regions through the holes.
Lupine seeds (Lupine Albus) were soaked in 10% H2O2 solution for 10 min and subsequently
in 10 mM CaSO4 solution for another 10 min. Then they were germinated for one day on
moist filter paper in the dark. Germinated seeds were then sown on the soil at the center of
the containers. The samples were kept under controlled conditions in a growth chamber with
a photoperiod of 14 hours, light intensity of 300 μmol m2 s-1, day/night temperature of
25°C/19°C, and relative humidity of 60 %. Plants were irrigated with nutrient solution every
third day by slowly immersing the samples in water until the water table reached the bottom
of the upper compartments. Then the water table was sequentially lowered to the top of the
lower compartment letting each compartment to drain freely. This resulted in an average
water content of 0.2 cm3 cm-3 with a gradient in water potential due to gravity. The plants
were eighteen days old when the neutron radiography experiment started. At this stage plants
had six leaves with a total leaf area of approximately 63±4.7 cm2 (n=3). During the daily
photoperiod, the transpiration rate of individual plants averaged 1.20±0.23 g h-1 (n=6), as
measured gravimetrically. The night transpiration was insignificant.
Quantification and modeling of local root water uptake 32
Neutron radiography
Neutron radiography is a noninvasive imaging technique with high sensitivity to water. This
makes it suitable to monitor soil water dynamics and root distributions (Moradi et al., 2009).
The Beer-Lambert law describes the attenuation of neutrons across a sample
1
0
exp
i n
i i
i
dI
I
(2.1)
where I is the intensity of the attenuated neutron beam (cm−2 s−1), I0 is the intensity of the
incident neutron beam, di (cm) is the thickness of the sample, and μi (cm−1) is the
macroscopic neutron attenuation coefficient of material i composing the sample. The neutron
attenuation coefficient defines the probability of neutron interaction per unit thickness of
material. The attenuated neutron flux is converted to visible light by a scintillator plate and
digital images are acquired by a cooled CCD camera.
The experiments were carried out at the ICON beam-line at Paul Scherrer Institute (PSI),
Switzerland (Kaestner et al. 2011). We used a CCD camera detector with an array of
1260×1260 pixels, a field of view of 15.75×15.75 cm, and effective spatial resolution of 0.2
mm. In this field of view, four radiographs with marginal overlaps were needed to scan one
sample. For measurements during the day, a lamp identical to those in the growth chamber
was installed in the imaging station above the plant. The transpiration rates in the imaging
station stayed the same as in the climate chamber.
Tracing the flow of water into roots by deuterated water
Because of its similarity to water, deuterated water (D2O) has been used to study the water
flow processes in plants (Bacic and Ratkovic, 1987; Matsushima et al, 2008). Deuterated
water has a much lower neutron attenuation coefficient compared to H2O, which makes it an
ideal tracer for neutron radiography experiments. We locally injected 3 ml D2O (purity of
99.97 %) in a selected soil compartment using a syringe. D2O redistribution in soil and its
transport into roots were monitored with a time interval of 10 seconds for a period of 1 hour.
The measurements were performed during the day and night on 10 replicates. The objective
of this study is to introduce this new method, therefore we focus on the results obtained from
two samples; one measured during the day and one at night, where D2O was injected at the
same location.

Chapter 2 33
Image processing
The radiographs were corrected for the flat field and dark current according to
( , ) ( , )( , )
( , ) ( , )
DCnorm
FF DC
I x y I x yI x y
I x y I x y
(2.2)
where Inorm(x,y) is the corrected image, I(x,y) is the recorded image on camera, IFF(x,y) is the
flat field (radiography without sample), and IDC(x,y) is the dark current (signal recorded by
the camera when there was no beam). The Beer-Lambert law for our samples is
2 2 2 2log ( , ) (1 )norm Al Al s tot H O H O D O D OI x y d d d d (2.3)
where the subscripts Al, S, H2O and D2O refer to aluminium container, solid phase of the soil,
normal and deuterated water, respectively, ∅ is the soil porosity (cm3 cm-3), and dtot is the
inner thickness of the container (1cm). The contribution of container and soil were derived
from the radiograph of a dry sample, Idry (x,y). The attenuation of dry soil and aluminium
were μs= 0.13 cm-1 and μAl=0.02 cm-1, respectively. The attenuation coefficients of water
(μH2O=3.65 cm-1) and D2O (μD2O=0.61 cm-1) were measured using control samples with
known normal and deuterated water content. Assuming that the contribution of the container
and soil was uniform across the sample, the contribution of H2O and D2O is given by
2 2 2 2
( , )log
( , )
normH O H O D O D O
dry
I x yd d
I x y
(2.4)
Eq. (2.4) gives the average neutron attenuations across the sample thickness (1 cm). For our
convenience, we define
2 2 2 2( )H O H O D O D Osoil
tot
d d
d
(2.5)
which gives the neutron attenuation coefficient of the liquid phase over the total sample cross
section (dtot). In soil where the liquid phase consists of pure H2O, 𝜇𝑠𝑜𝑖𝑙 = 𝜇𝐻2𝑂𝜃, where θ is
the soil volumetric water content. In the pixels containing roots at a 2D projection through the
1 cm thick sample, the signal is composed of the attenuation coefficients of the root and of
the soil in front of and behind the root in the beam direction. The actual contributions of H2O
and D2O in root can be calculated assuming that the contributions of H2O and D2O in the soil
in front of and behind the root are equal to those of the soil at the sides of the roots as
quantified by Eq. (2.5). The sharp contrast between the roots and the surrounding soil, due to
Quantification and modeling of local root water uptake 34
their difference in water contents, allowed us to segment roots from the soil. Roots were
segmented using the algorithm roottracker2D as described in Menon et al. (2007). The
segmented roots were skeletonized and their length and diameter were calculated using the
Euclidean distance mapping functions in MATLAB. The pixel-wise neutron attenuation
coefficient in roots μroot is calculated as
log (1 )roots root soil root
soil
root
root
Id d
I
d
(2.6)
where Iroot is the value of Inorm in the most center pixel in the roots, Isoil is the average values
of Inorm in soil near to the roots and droot is the root diameter. The attenuation coefficient of
root (μroot) depends on the volumetric content of H2O and D2O in the root.
To calculate the D2O content in roots we assumed that root swelling after D2O injection was
negligible. This means that the total liquid content (H2O plus D2O) in roots were constant
over time. It follows that
2
2 2
( ) ( 0)D O root rootroot root
D O H O
t td d
(2.7)
Where (𝑑𝑟𝑜𝑜𝑡𝐷2𝑂 ) is the thickness of D2O in roots, and t=0 refers to the radiograph before D2O
injection. The thickness of D2O in soil (𝑑𝑠𝑜𝑖𝑙𝐷2𝑂)
is given by
2 2
2 2
liqD O soil H Osoil soil
D O H O
d d
(2.8)
where (𝑑𝑠𝑜𝑖𝑙𝑙𝑖𝑞 ) is the total liquid content in soil. To calculate (𝑑𝑠𝑜𝑖𝑙
𝑙𝑖𝑞 ), we assumed that liquid
content (H2O+D2O) inside the compartment quickly reaches to a uniform distribution after
injection. It follows that
2 2liq D O H Osoil
V Vd
A
(2.9)
where VD2O and VH2O are respectively the total volume of D2O and H2O in each compartment,
and A is the total area of the isolated compartment (cm2). To calculate VD2O and VH2O we
assumed that VH2O in the compartment was constant over time and it could be calculated from
the first radiograph before injection (t=0)

Chapter 2 35
2
1 1
2
2
( 0)j ni n
soil tot
i j
H O
H O
t d
V
(2.10)
2
1 1 1 1
2
2
( ) ( 0)
( )
j n j ni n i n
soil soil tot
i j i j
D O
D O
t t d
V t
(2.11)
where i and j are the x and y coordinates of the compartment, λ is the pixel size and t is the
time after injection. We used the volumetric definition of D2O concentration in the root (Croot)
and soil (Csoil) as the thickness of D2O divided by the total liquid thickness in root and soil,
respectively:
2
root
D O
root
liq
root
dC
d (2.12)
2
soil
D O
soil
liq
soil
dC
d
(2.13)
The total liquid thickness in root (𝑑𝑟𝑜𝑜𝑡𝑙𝑖𝑞 ) is calculated as H2O thickness in the first radiograph
before D2O was injected.
Model of D2O transport into root
To quantify the transport of D2O into roots, a simple mathematical model was developed. The
model calculated the local radial water flux from the penetration rate of D2O into roots.
Deuterated water enters the roots by diffusion and convection. Thus, transport of D2O is
described by a diffusion-convection equation, where the rate of D2O entering the root
depends on: 1) the convective flow resulting from transpiration (net water uptake), and 2) the
diffusional permeability of roots to D2O. It is known that root resistance is composite; it has
an apoplastic pathway around the protoplasts, and a cell-to-cell pathway crossing cell
membranes and plasmodesmata (Steudle, 2000). The relative importance of the pathways is
still a matter of debate. To simplify the process, we assumed that endodermis is the main
resistance to D2O transport with a reflection coefficient of close to zero (Henzler and Steudle,
1995; Dainty and Ginzburg, 1964), and D2O transport in the apoplast is much quicker than in
the cell-to-cell pathway. This means that D2O quickly passed through apoplast and reached
the endodermis shortly after it was injected at the root surface. Subsequently D2O passes the

Quantification and modeling of local root water uptake 36
endodermis and the cell membrane of cortical cells in the cortex (Fig. 1). From the
assumption of quick apoplastic transport in the cortex, the concentration of D2O in the
apoplast of cortex was assumed to be identical to that at the root surface in soil. Additionally,
we assumed that there is no considerable resistance to D2O transport inside the root stele and
concentration of D2O inside the root stele is uniform. According to House (1974) the
transport rate of D2O (cm3 s-1) across the endodermis is the sum of the convective part (𝐽𝑟𝑆,𝐶
)
, 2S C
r s r oJ R Lj C (2.14)
and a diffusive part (𝐽𝑟𝑆,𝐷
)
,
02 ( )S D
r s D sJ R LP C C (2.15)
where jr (cm3 cm-2 s-1) is the radial flux of liquid driven by convection into the root stele, PD
is the diffusional permeability coefficient of the root endodermis (cm s-1), Rs is the radius of
root stele including the endodermis (cm), L is the length of root immersed in D2O (cm), Co is
D2O concentration in the apoplast of root cortex (cm3 cm-3), where according to our
assumption, quick apoplastic transport, it is equal to the that of the soil at root surface and Cs
is D2O concentration in the root stele (cm3 cm-3). Here, the flux of D2O from the soil into the
root across the membrane is taken as positive. In our equations, superscripts r and x refer to
radial and axial flow, respectively, and superscripts D and C refer to diffusion and
convection, respectively.
Besides the radial component of D2O transport, there is also an axial component inside the
root. Once D2O passed the endodermis, it moves up inside the xylem axially (Fig. 1). Such
axial transport is dominated by the hydrostatic gradient along xylem set by transpiration. The
volumetric solute transport in the xylem, 𝐽𝑥𝑆,𝐶
(cm3 s-1), is
, 2S C
x s x sJ R j C
(2.16)
where jx is the axial flux (cm3 cm-2 s-1) and Rs is the radius of the root stele including
endodermis. Note, we defined the axial flux (jx) referring to the stele cross section (πRs2).
Therefore, the actual water velocity in the xylem referring to the xylem cross section will be
higher than defined axial flux. From a mass conservation, it follows that
2 2s x s rR j R Lj (2.17)
Chapter 2 37
The right hand side of Eq. (2.17) is the radial volumetric flow of H2O entering the root
segment in the injected compartment and the left hand side is the axial volumetric flow
leaving the root segment towards the shoot. Assuming that entire root including the root tip is
immersed in D2O; Eq. (2.17) can be rewritten for D2O transport as
, 2 2S C
x s x s s r sJ R j C R Lj C (2.18)
Finally, the increase of D2O concentration inside the root stele can be described as:
2
0
0
2
2
ss s D s
s sr
CR L R LP C C
t
R Lj C C
(2.19)
Under the following boundary conditions
0 0(
0
0)
0s
t
C t
C C for t
(2.20)
the solution of Eq. (2.19) is
(2 )
0 1 exp
D r
s
P jt
R
sC C
(2.21)
Eq. (2.21) shows that the D2O concentration in the root stele (Cs) increases exponentially to
the D2O concentration in the root surface (Co). The rate constant (2(PD + jr,)/Rs) contains the
contribution of convection (jr) and diffusion (PD). We assumed that D2O enters the root only
by diffusion at night when transpiration is nearly zero and by both convection and diffusion
during the day. Assuming that PD does not change with transpiration rate, it is possible to
calculate the local flux of D2O into root (jr) during the day. The latter assumption needs
further experimental evidence (see Discussion).
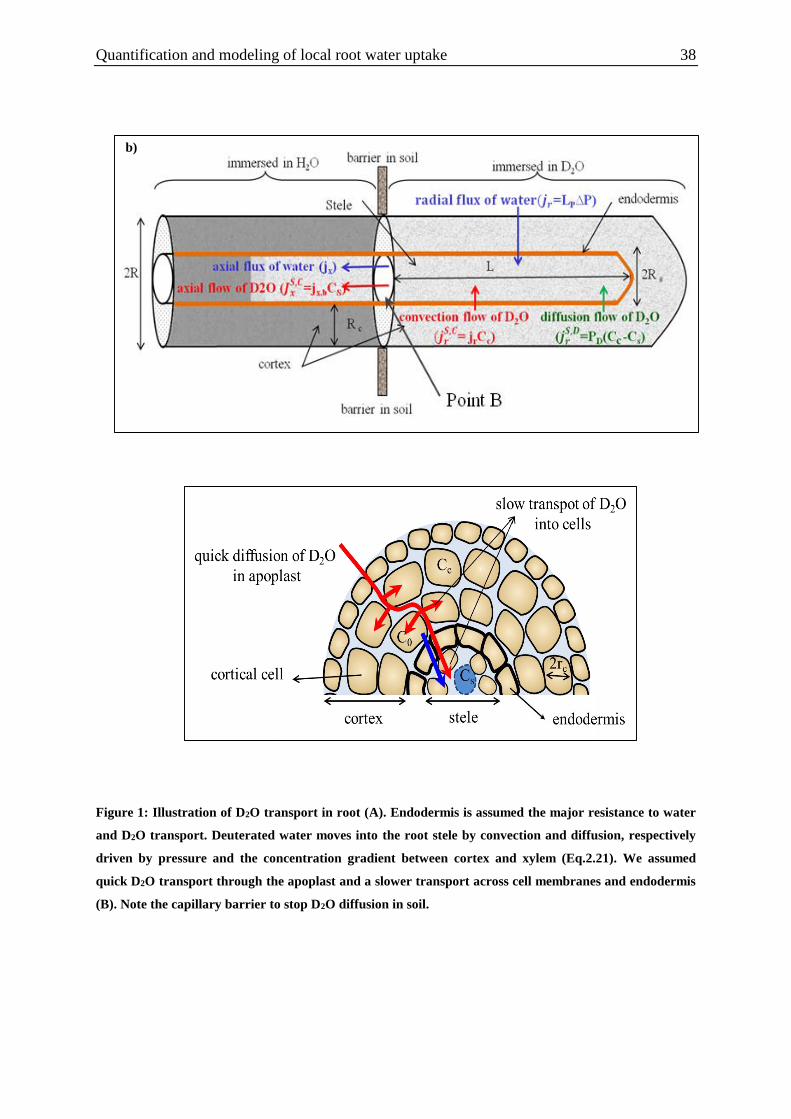
Quantification and modeling of local root water uptake 38
Figure 1: Illustration of D2O transport in root (A). Endodermis is assumed the major resistance to water
and D2O transport. Deuterated water moves into the root stele by convection and diffusion, respectively
driven by pressure and the concentration gradient between cortex and xylem (Eq.2.21). We assumed
quick D2O transport through the apoplast and a slower transport across cell membranes and endodermis
(B). Note the capillary barrier to stop D2O diffusion in soil.
b)
Chapter 2 39
Calculation of Cs
The calculated neutron attenuation coefficient for the roots represents the average of CD2O
across the root cortex and the root stele.
c c s sroot
C R C RC
R
(2.22)
where Croot is the average of D2O concentration in the root, Cc is D2O concentration in the
cortex, Cs is D2O concentration in the root stele, R is the root radius, Rc is the cortex
thickness, and Rs is the stele radius. To obtain Cs we need to know the contribution of cortex
Cc. This value was estimated as follows; the cortex is formed by a series of cortical cells
which are hydraulically in local equilibrium with the apoplast. Assuming a quick transport of
D2O in apoplast, all the cortical cell membranes are uniformly immersed in an identical
concentration as that of the root surface in soil. The increase of D2O concentration inside the
cortical cells, neglecting the volume of apoplastic pathway, is then described as
.(2 )
0 1 exp
D C
c
Pt
r
cC C
(2.23)
where PD.C is diffusional permeability across the membrane of cortical cells and rc is the
radius of a single cortical cell. Assuming that endodermis and xylem are not yet developed in
the root tip and it consists of only cortical cells, we took the increase of D2O concentration in
the root tip to represent that of the cortex.
Independent quantification of axial flow rate
Mass conservation imposes that axial flow rate of liquid at the capillary barrier is:
,
2
, , 2s bx b x b s rJ R j R Lj (2.24)
where Rs,b is the radius of root stele including endodermis at the location of the coarse sand
barrier (point B in Fig. 3), Jx,b is the axial flow rate at point B (cm3 s-1), jx,b is the axial flux at
point B (cm s-1) and 𝑅𝑠 is the average radius of stele along the root length up to barrier (L).
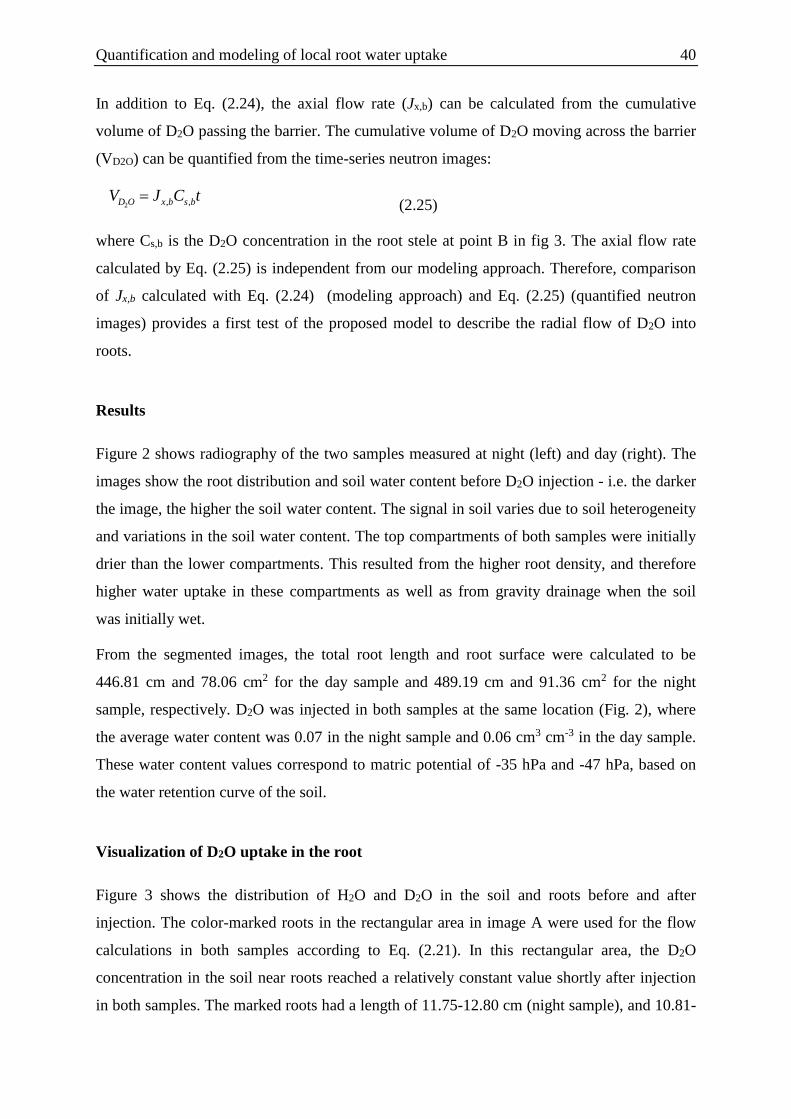
Quantification and modeling of local root water uptake 40
In addition to Eq. (2.24), the axial flow rate (Jx,b) can be calculated from the cumulative
volume of D2O passing the barrier. The cumulative volume of D2O moving across the barrier
(VD2O) can be quantified from the time-series neutron images:
2 , ,D O x b s bV J C t (2.25)
where Cs,b is the D2O concentration in the root stele at point B in fig 3. The axial flow rate
calculated by Eq. (2.25) is independent from our modeling approach. Therefore, comparison
of Jx,b calculated with Eq. (2.24) (modeling approach) and Eq. (2.25) (quantified neutron
images) provides a first test of the proposed model to describe the radial flow of D2O into
roots.
Results
Figure 2 shows radiography of the two samples measured at night (left) and day (right). The
images show the root distribution and soil water content before D2O injection - i.e. the darker
the image, the higher the soil water content. The signal in soil varies due to soil heterogeneity
and variations in the soil water content. The top compartments of both samples were initially
drier than the lower compartments. This resulted from the higher root density, and therefore
higher water uptake in these compartments as well as from gravity drainage when the soil
was initially wet.
From the segmented images, the total root length and root surface were calculated to be
446.81 cm and 78.06 cm2 for the day sample and 489.19 cm and 91.36 cm2 for the night
sample, respectively. D2O was injected in both samples at the same location (Fig. 2), where
the average water content was 0.07 in the night sample and 0.06 cm3 cm-3 in the day sample.
These water content values correspond to matric potential of -35 hPa and -47 hPa, based on
the water retention curve of the soil.
Visualization of D2O uptake in the root
Figure 3 shows the distribution of H2O and D2O in the soil and roots before and after
injection. The color-marked roots in the rectangular area in image A were used for the flow
calculations in both samples according to Eq. (2.21). In this rectangular area, the D2O
concentration in the soil near roots reached a relatively constant value shortly after injection
in both samples. The marked roots had a length of 11.75-12.80 cm (night sample), and 10.81-
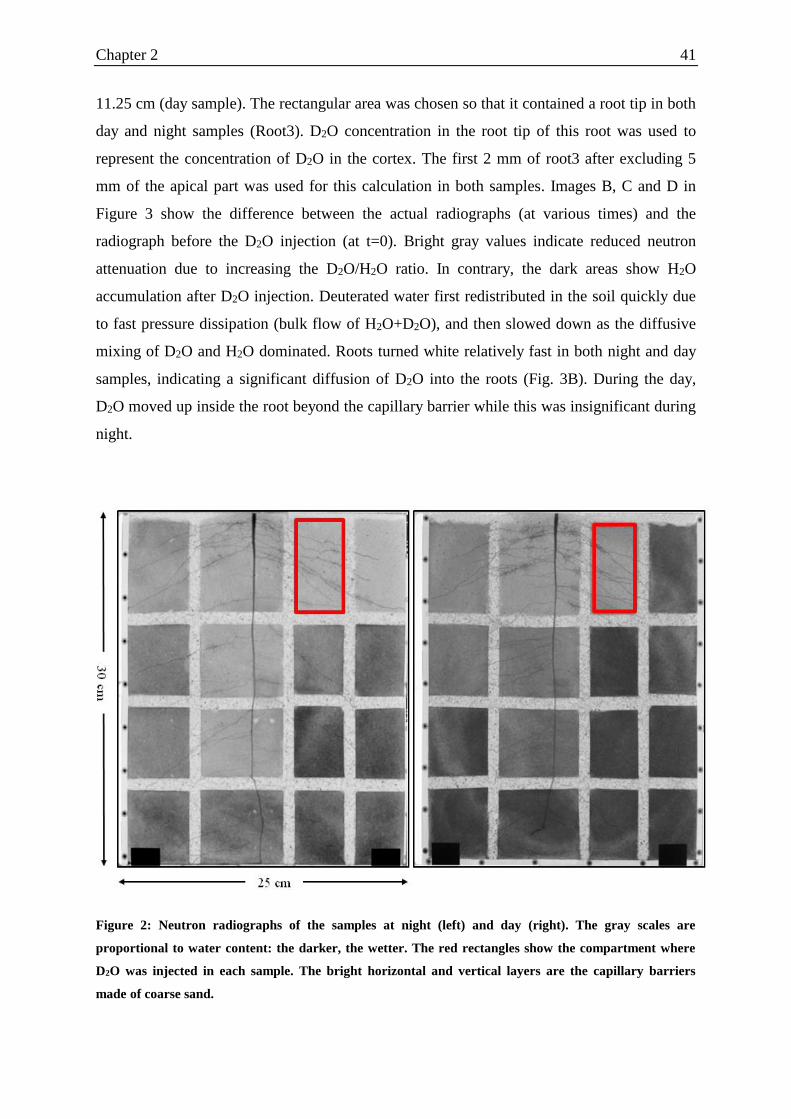
Chapter 2 41
11.25 cm (day sample). The rectangular area was chosen so that it contained a root tip in both
day and night samples (Root3). D2O concentration in the root tip of this root was used to
represent the concentration of D2O in the cortex. The first 2 mm of root3 after excluding 5
mm of the apical part was used for this calculation in both samples. Images B, C and D in
Figure 3 show the difference between the actual radiographs (at various times) and the
radiograph before the D2O injection (at t=0). Bright gray values indicate reduced neutron
attenuation due to increasing the D2O/H2O ratio. In contrary, the dark areas show H2O
accumulation after D2O injection. Deuterated water first redistributed in the soil quickly due
to fast pressure dissipation (bulk flow of H2O+D2O), and then slowed down as the diffusive
mixing of D2O and H2O dominated. Roots turned white relatively fast in both night and day
samples, indicating a significant diffusion of D2O into the roots (Fig. 3B). During the day,
D2O moved up inside the root beyond the capillary barrier while this was insignificant during
night.
Figure 2: Neutron radiographs of the samples at night (left) and day (right). The gray scales are
proportional to water content: the darker, the wetter. The red rectangles show the compartment where
D2O was injected in each sample. The bright horizontal and vertical layers are the capillary barriers
made of coarse sand.
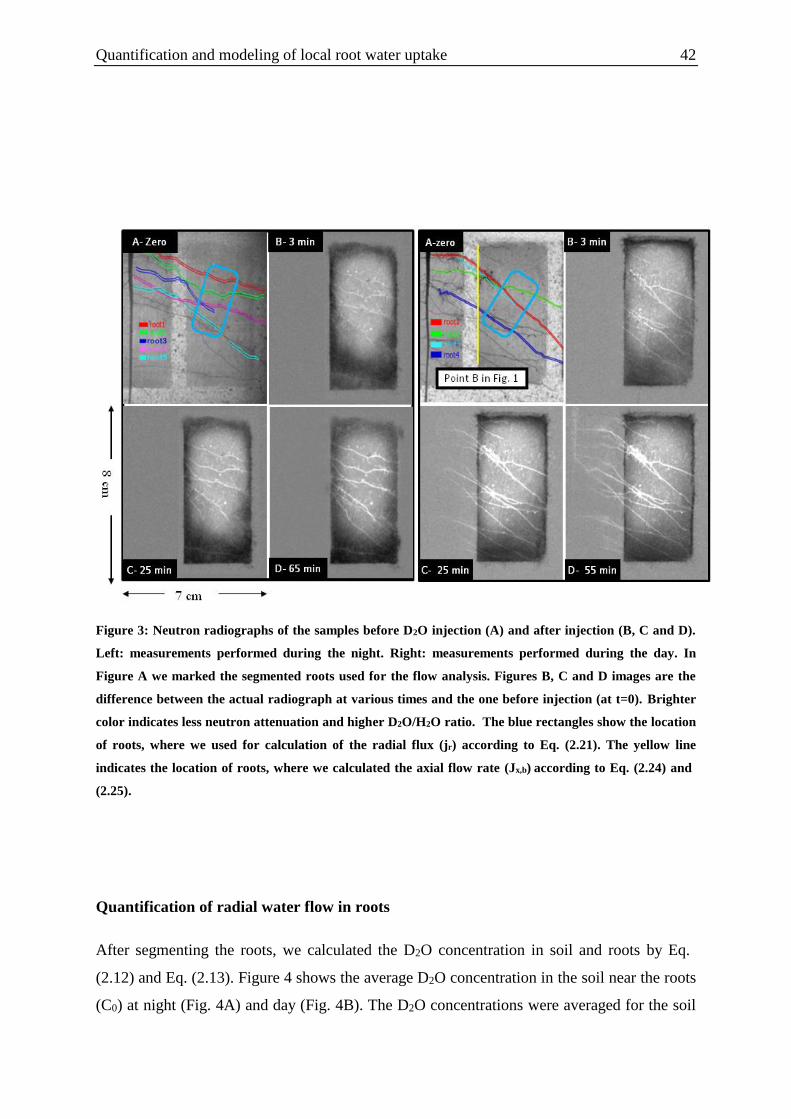
Quantification and modeling of local root water uptake 42
Figure 3: Neutron radiographs of the samples before D2O injection (A) and after injection (B, C and D).
Left: measurements performed during the night. Right: measurements performed during the day. In
Figure A we marked the segmented roots used for the flow analysis. Figures B, C and D images are the
difference between the actual radiograph at various times and the one before injection (at t=0). Brighter
color indicates less neutron attenuation and higher D2O/H2O ratio. The blue rectangles show the location
of roots, where we used for calculation of the radial flux (jr) according to Eq. (2.21). The yellow line
indicates the location of roots, where we calculated the axial flow rate (Jx,b) according to Eq. (2.24) and
(2.25).
Quantification of radial water flow in roots
After segmenting the roots, we calculated the D2O concentration in soil and roots by Eq.
(2.12) and Eq. (2.13). Figure 4 shows the average D2O concentration in the soil near the roots
(C0) at night (Fig. 4A) and day (Fig. 4B). The D2O concentrations were averaged for the soil

Chapter 2 43
within 3 mm distance from the roots inside the rectangular area shown in Fig. 3. The D2O
concentration sharply increased and then stayed relatively constant over the course of the
next hour. The volumetric liquid content (H2O + D2O) increased in both samples to 0.18 cm3
cm-3 after D2O injection. Based on the soil water retention curve, we expect the soil matric
potential to increase from -35to -12 hPa for night sample, and from -47 to -12 hPa for day
sample. Therefore, the changes in the soil matric potentials before and after D2O injection,
compared to the typical gradients in water potential between soil and roots, were insignificant
to induce a flow into the roots.
The increase of D2O concentration in the roots (Croot) is shown in Fig. 5A and 5B for night
and day sample, respectively. This increase was faster in the day sample than in the night
sample with a half time of approximately 150 seconds for the day, and 280 seconds for the
night. The calculated D2O concentration in the root (Croot) is the average concentration across
the cortex and stele (Eq. 2.22). To quantify the radial water flux into roots by Eq. (2.21), we
need to calculate the concentration of D2O in stele (Cs). We used the increase of D2O
concentration in the root tip of root3 in both samples, to represent D2O concentration in
cortical cells. Figure 5C shows that D2O concentration in the root tip increased similarly in
both day and night sample; suggesting that D2O transport into the root tip was driven only by
diffusion. The curves were fitted by Eq. (2.23) and the half time of the concentration increase
in cortical cells was approximately 120 seconds in day and night. Microscopic observation of
the root cross sections (data not shown here) revealed that the radius of the stele was 46% of
the root radius. The cross-sections also showed that the area of 5-6 cm from the root tip had
developed an endodermis with casparian bands. The concentration of D2O in the root stele
(Cs) was calculated according to Eq. (2.22). D2O concentration in the root stele increased
exponentially with time in both day and night samples (Fig. 5 D and E). D2O concentration in
the root stele increased much faster at day than at night, with a half time of approximately
160 s at day and 430 s at night (Eq. 2.21).
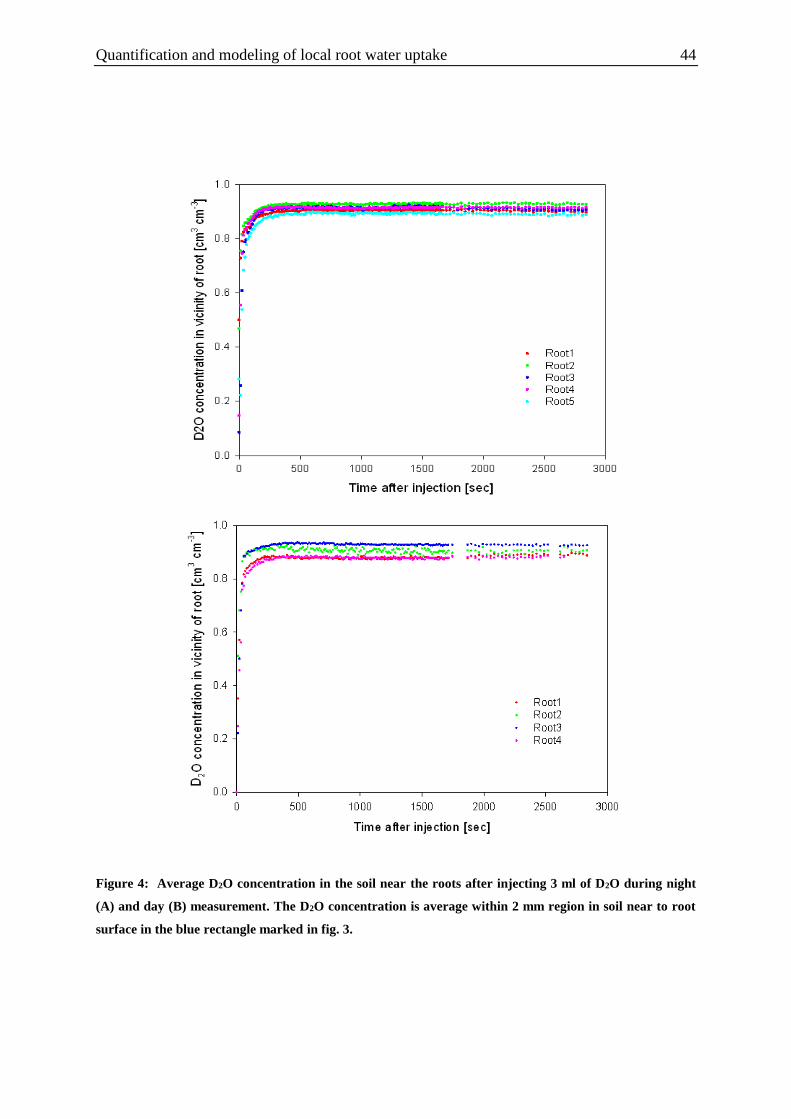
Quantification and modeling of local root water uptake 44
Figure 4: Average D2O concentration in the soil near the roots after injecting 3 ml of D2O during night
(A) and day (B) measurement. The D2O concentration is average within 2 mm region in soil near to root
surface in the blue rectangle marked in fig. 3.
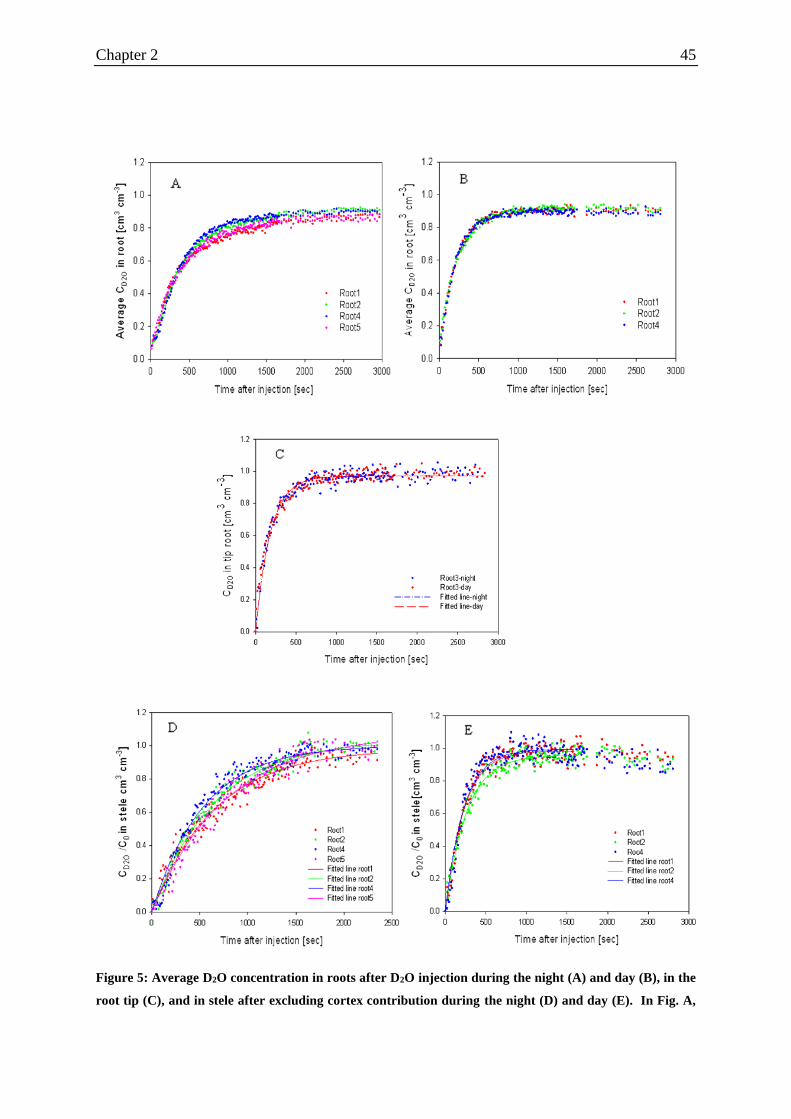
Chapter 2 45
Figure 5: Average D2O concentration in roots after D2O injection during the night (A) and day (B), in the
root tip (C), and in stele after excluding cortex contribution during the night (D) and day (E). In Fig. A,

Quantification and modeling of local root water uptake 46
B, D and E, the average is calculated along the segmented roots in the blue rectangle marked in Fig. 3. In
Fig. C, the data shows the average D2O concentration along 2 mm length of root after excluding 5mm
apical part of the root tip.
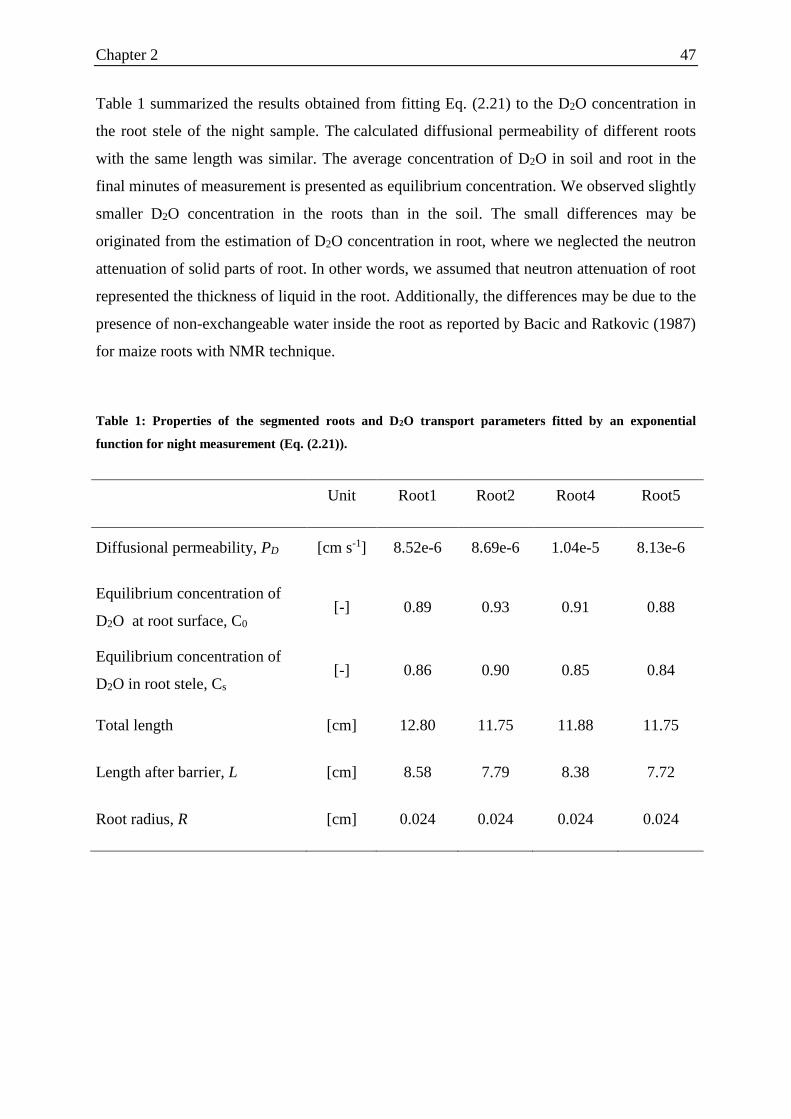
Chapter 2 47
Table 1 summarized the results obtained from fitting Eq. (2.21) to the D2O concentration in
the root stele of the night sample. The calculated diffusional permeability of different roots
with the same length was similar. The average concentration of D2O in soil and root in the
final minutes of measurement is presented as equilibrium concentration. We observed slightly
smaller D2O concentration in the roots than in the soil. The small differences may be
originated from the estimation of D2O concentration in root, where we neglected the neutron
attenuation of solid parts of root. In other words, we assumed that neutron attenuation of root
represented the thickness of liquid in the root. Additionally, the differences may be due to the
presence of non-exchangeable water inside the root as reported by Bacic and Ratkovic (1987)
for maize roots with NMR technique.
Table 1: Properties of the segmented roots and D2O transport parameters fitted by an exponential
function for night measurement (Eq. (2.21)).
Unit Root1 Root2 Root4 Root5
Diffusional permeability, PD [cm s-1] 8.52e-6 8.69e-6 1.04e-5 8.13e-6
Equilibrium concentration of
D2O at root surface, C0 [-] 0.89 0.93 0.91 0.88
Equilibrium concentration of
D2O in root stele, Cs
[-] 0.86 0.90 0.85 0.84
Total length [cm] 12.80 11.75 11.88 11.75
Length after barrier, L [cm] 8.58 7.79 8.38 7.72
Root radius, R [cm] 0.024 0.024 0.024 0.024
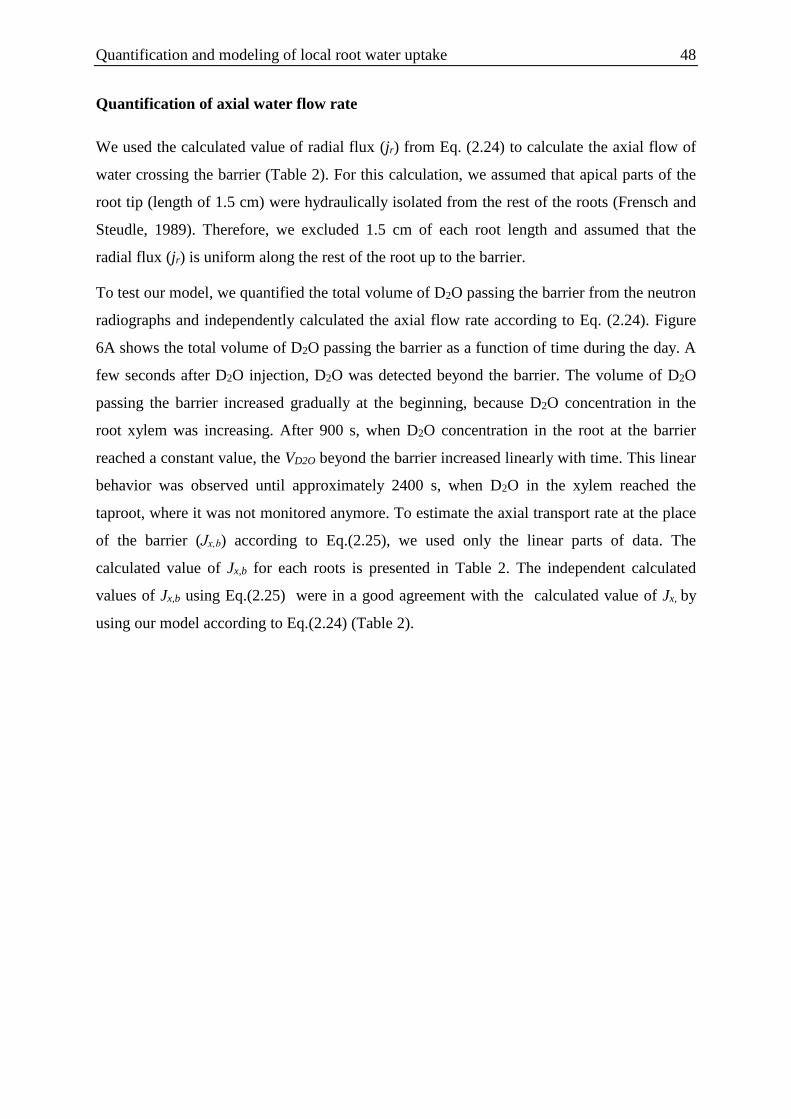
Quantification and modeling of local root water uptake 48
Quantification of axial water flow rate
We used the calculated value of radial flux (jr) from Eq. (2.24) to calculate the axial flow of
water crossing the barrier (Table 2). For this calculation, we assumed that apical parts of the
root tip (length of 1.5 cm) were hydraulically isolated from the rest of the roots (Frensch and
Steudle, 1989). Therefore, we excluded 1.5 cm of each root length and assumed that the
radial flux (jr) is uniform along the rest of the root up to the barrier.
To test our model, we quantified the total volume of D2O passing the barrier from the neutron
radiographs and independently calculated the axial flow rate according to Eq. (2.24). Figure
6A shows the total volume of D2O passing the barrier as a function of time during the day. A
few seconds after D2O injection, D2O was detected beyond the barrier. The volume of D2O
passing the barrier increased gradually at the beginning, because D2O concentration in the
root xylem was increasing. After 900 s, when D2O concentration in the root at the barrier
reached a constant value, the VD2O beyond the barrier increased linearly with time. This linear
behavior was observed until approximately 2400 s, when D2O in the xylem reached the
taproot, where it was not monitored anymore. To estimate the axial transport rate at the place
of the barrier (Jx,b) according to Eq.(2.25), we used only the linear parts of data. The
calculated value of Jx,b for each roots is presented in Table 2. The independent calculated
values of Jx,b using Eq.(2.25) were in a good agreement with the calculated value of Jx, by
using our model according to Eq.(2.24) (Table 2).
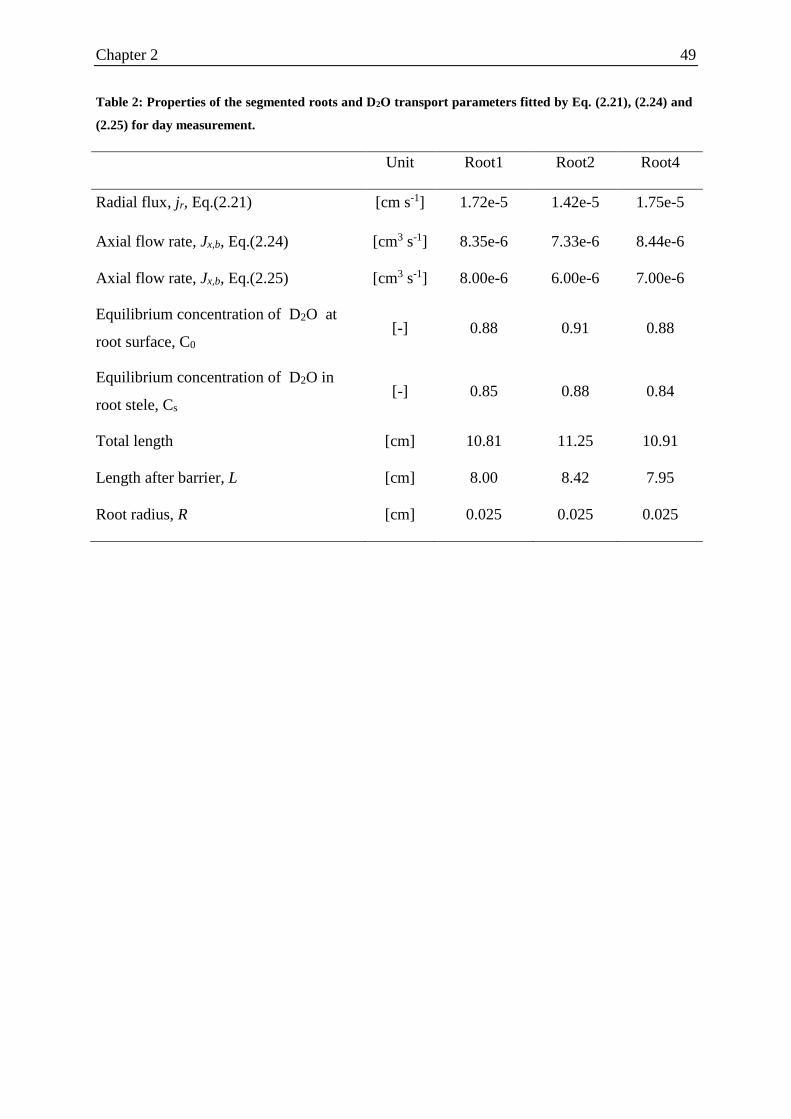
Chapter 2 49
Table 2: Properties of the segmented roots and D2O transport parameters fitted by Eq. (2.21), (2.24) and
(2.25) for day measurement.
Unit Root1 Root2 Root4
Radial flux, jr, Eq.(2.21) [cm s-1] 1.72e-5 1.42e-5 1.75e-5
Axial flow rate, Jx,b, Eq.(2.24) [cm3 s-1] 8.35e-6 7.33e-6 8.44e-6
Axial flow rate, Jx,b, Eq.(2.25) [cm3 s-1] 8.00e-6 6.00e-6 7.00e-6
Equilibrium concentration of D2O at
root surface, C0 [-] 0.88 0.91 0.88
Equilibrium concentration of D2O in
root stele, Cs [-] 0.85 0.88 0.84
Total length [cm] 10.81 11.25 10.91
Length after barrier, L [cm] 8.00 8.42 7.95
Root radius, R [cm] 0.025 0.025 0.025
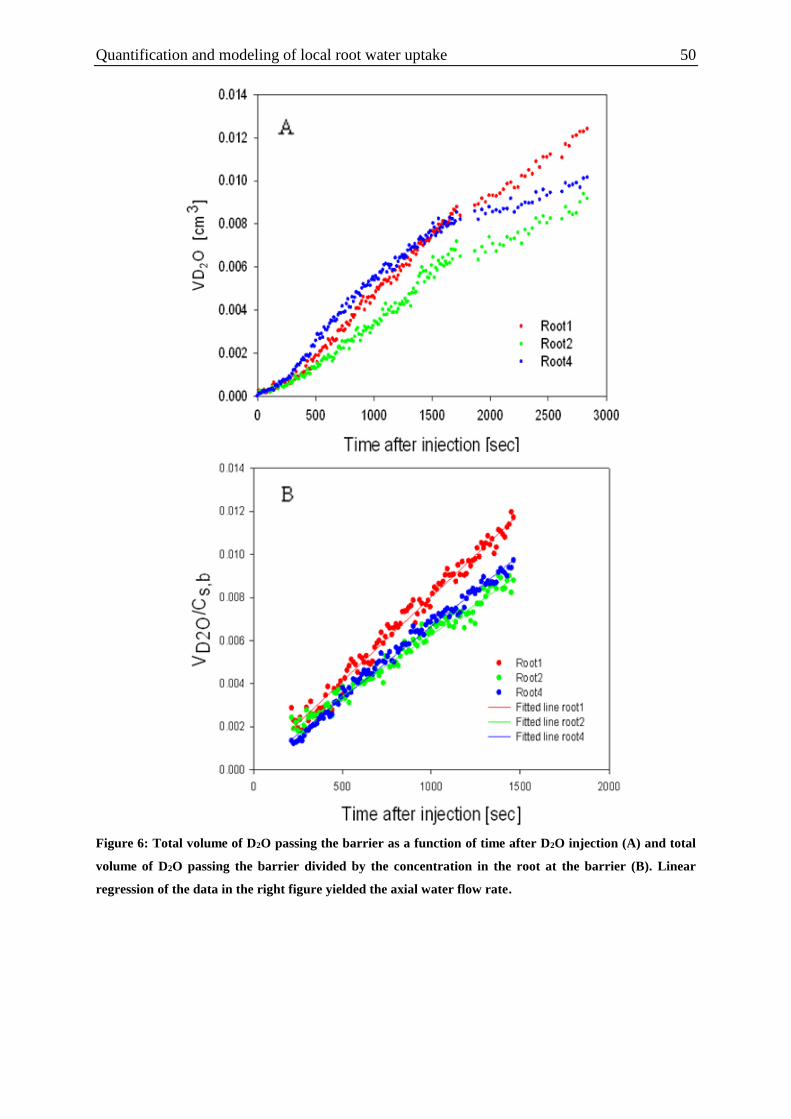
Quantification and modeling of local root water uptake 50
Figure 6: Total volume of D2O passing the barrier as a function of time after D2O injection (A) and total
volume of D2O passing the barrier divided by the concentration in the root at the barrier (B). Linear
regression of the data in the right figure yielded the axial water flow rate.
Chapter 2 51
Discussion
For the first time, local water uptake by individual roots in soil was quantified using
deuterated water and neutron radiography. Deuterated water was injected into the soil near
the roots and its transport in soil and roots was monitored during the day (transpiring plant)
and night (non-transpiring plant) using time-series neutron radiography. The goal was to
determine the radial transport of D2O into the roots as representative of radial water flux (jr)
which is one of the key parameters in understanding and modeling local root water uptake.
We developed a simple model to describe the local transport of D2O into root and the model
suggested valuable hydraulic properties of the root. The model predicted the average
diffusional permeability of cortical cell membrane to be PD,C=3.3×10⁻⁶ ±1.19×10⁻⁸ cm s-1 and
the average diffusional permeability of the endodermis to be PD=9.42×10⁻⁶ ±8.70×10⁻⁷ cm s-
1. Permeability coefficient of endodermis was greater than that of the cortical cell membrane.
This suggests the contribution of apoplastic flow across the endodermis. If there were no
apoplastic pathway in endodermis and cell-to-cell pathway was the only pathway, diffusional
permeability coefficient of endodermis could have been lower than that of cortical cells. Note
that in cell-to-cell transport across the endodermis, D2O passes two membranes. Further
experiments are needed to confirm this hypothesis.
As the first attempt, the model was tested by comparing the axial flow rate (Jx,b) calculated
using our model (Eq. (2.24)) with independent calculation of Jx,b (Eq. (2.25)). We obtained a
good agreement between the calculated Jx,b from the two approaches (Table 2) that may
support the modeling approach. However, there are limitations in the current model because
of assumptions made. To calculate the radial flow rate of water across root, we assumed the
diffusional permeability of endodermis to D2O transport will be similar during the day and
night. This may not be true. The diffusional permeability of endodermis may vary during the
day when cell-to-cell pathway is regulated by aquaporins. Such variability should be verified
in further experiments and eventually included in the calculations. Another assumption of the
model is the quick transport of D2O in the apoplast. Consequence of this assumption is that
cortical cells and endodermis were simultaneously imposed to an identical D2O concentration
to that of the soil at the root surface. In reality, it takes some time for D2O molecules to
diffuse from the root surface to the endodermis. The typical diffusion time is given by t=l 2/
(2De), where l is diffusional length and De is the diffusion coefficient of D2O in H2O. Using
the value of diffusion coefficient of D2O in water (2.272×10⁻⁵ cm2 s-1, Longsworth, 1960),
Quantification and modeling of local root water uptake 52
and l equal to the cortex thickness (0.015cm), we obtain the D2O diffusion time to reach to
the endodermis to be 5 seconds. Although the actual pathway could be longer due to
tortuosity, diffusion in the apoplast seems quick enough to meet our assumption (if
diffusional length was 1.5 times longer, the time would have been 11 sec). It is important to
mention that if this assumption was not valid, the actual D2O concentration imposed to
endodermis would have been overestimated and the diffusional permeability of endodermis
would have been underestimated. Consequently, the values of jr calculated from the model
would have been overestimated. However, similar value of Jx,b calculated by our model and
by the independent calculation may support this assumption. Additionally, immediate
presence of D2O beyond the barrier in day sample (Fig. 6A) suggests that D2O arrived to
endodermis shortly after D2O injection.
The diffusional permeability of the cortical cells was calculated to be PD,C= 3.3×10⁻⁶cm s-1
and this value was comparable to other literature values. Henzler and Steudle (1995)
measured permeability coefficient of deuterated water for intermodal cells of Chara corallina
using a cell pressure probe. Their values ranged from 4×10⁻⁴ to 8×10⁻⁴cm s-1. The water
permeability in this type of cell is known to be higher than in cortical cells of higher plants,
and values could be variable depending on open/closed status of water channels within the
cell membranes. Bacic and Ratkovic (1987) reported the diffusional permeability of D2O in
cortical cell for roots grown in hydroponic cultures to be in the range of 10-6-10-3cm s-1. The
estimation of this value depended on the model used for describing D2O transport. The
average value of diffusional permeability of cortical cell membrane in our study (3.3×10⁻⁶cm
s-1) falls within the reported range.
Using the total water uptake divided by the total root cross section divided by the radial flux,
we estimated that 63% of the total root length would be needed to fulfill the water demand by
the plant. This estimation is larger than the values of 30% reported by Passioura (1980),
Doussan et al. (2003), and Zwieniecki et al. (2003). The difference between our estimation
and the literature could be explained by the errors in the assumption of uniform radial flux of
water along the active parts of the root system. This uncertainty in the measurements of local
water fluxes into and along roots is an important source of error in existing methods.
The significance of this study is the description of a new method to locally quantify water
flow into individual roots of living plants. Quantification of the radial flux (jr) requires a
model of water and D2O transport inside the roots. The model results were tested by
comparing them with an independent measurement of the axial flow rate (Jx,b). This method
Chapter 2 53
makes it possible to quantitatively address the question of where roots take up water in soils.
The answer to this question would open wide ranges of agronomy applications aimed at
understanding root development and root functioning in response to various environmental
conditions. Additionally, the data can be used to calibrate and test the existing models of root
water uptake. Future experiments with D2O injected at different locations will give
information on the variation of root properties and root water uptake along the root systems.
Acknowledgments
The corresponding author is financially supported by “IPSWaT” scholarship (under
stipendium IPS 11/Q04) from the Germany Federal Ministry of Education and Research
(BMBF). Dr. Yangmin Kim is financially supported by the Alexander von Humboldt
Foundation, Germany. We thank the late Prof. Ernst Steudle from Bayreuth University,
Germany for discussions. Dr. Kosala Ranathunge from Guelph University, Canada is
acknowledged for helping with the cross sections of roots. We appreciate the support from
Mr. Abbas Dara, University of Potsdam, Germany during the experiments. We thank on the
anonymous reviewer for the detailed comments that significantly improved the
understandability and the quality of this smanuscript.
Quantification and modeling of local root water uptake 54
References
Bacic,G., and S.Ratkovic. 1987. NMR-Studies of Radial Exchange and Distribution of Water
in Maize Roots - the Relevance of Modeling of Exchange Kinetics. Journal of
Experimental Botany. 38:1284-1297.
Barrowclough,D.E., C.A.Peterson, and E. Steudle. 2000. Radial hydraulic conductivity along
developing onion roots. Journal of Experimental Botany. 51:547-557.
Carminati,A., A.B.Moradi, D.Vetterlein, P.Vontobel, E.Lehmann, U.Weller, H.J.Vogel, and
S.E.Oswald. 2010. Dynamics of soil water content in the rhizosphere. Plant and Soil.
332:163-176.
Coners,H., and C.Leuschner. 2002. In situ water absorption by tree fine roots measured in
real time using miniature sap-flow gauges. Functional Ecology. 16:696-703.
Dainty, J. and Ginzburg, B. Z. 1964.The reflection coefficient of plant cell membranes for
certain solutes. Biochim.Biophys.Acta. 79:129:137.
De Jong Van Lier,Q., K.Metselaar, and J.C.Van Dam. 2006. Root water extraction and
limiting soil hydraulic conditions estimated by numerical simulation. Vadose Zone
Journal. 5:1264-1277.
Doussan,C., L.Pages, and A.Pierret. 2003. Soil exploration and resource acquisition by plant
roots: an architectural and modelling point of view. Agronomie. 23:419-431.
Doussan,C., A.Pierret, E.Garrigues, and L.Pages. 2006. Water uptake by plant roots: II -
Modelling of water transfer in the soil root-system with explicit account of flow
within the root system - Comparison with experiments. Plant and Soil. 283:99-117.
Draye,X., Y.Kim, G.Lobet, and M.Javaux. 2010. Model-assisted integration of physiological
and environmental constraints affecting the dynamic and spatial patterns of root water
uptake from soils. Journal of Experimental Botany. 61:2145-2155.
Enstone, D.E, C.A. Peterson and F.S. Ma. 2002 Root endodermis and exodermis: structure,
function, and responses to the environment. Journal of Plant Growth Regulation.
21:335–351.
Chapter 2 55
Frensch,J., and E.Steudle. 1989. Axial and Radial Hydraulic Resistance to Roots of Maize
(Zea-Mays-L). Plant Physiology. 91:719-726.
Frensch, J., T.C.Hsiao, and E.Steudle. 1996. Water and solute transport along developing
maize roots. Planta. 198:348-355.
Garrigues,E., C.Doussan, and A.Pierret. 2006. Water uptake by plant roots: I - Formation and
propagation of a water extraction front in mature root systems as evidenced by 2D
light transmission imaging. Plant and Soil. 283:83-98.
Henzler,T., and E.Steudle. 1995. Reversible closing of water channels in Chara internodes
provides evidence for a composite transport model of the plasma-membrane. Journal
of Experimental Botany. 46:199-209.
House,C.R. 1974. Water transport in cells and tissues. Edward Arnold, London.
Huang,B., and P.S.Nobel. 1993. Hydraulic conductivity and anatomy along lateral roots of
cacti - changes with soil-water status. New Phytologist. 123:499-507.
Javaux,M., T.Schroder, J.Vanderborght, and H.Vereecken. 2008. Use of a three-dimensional
detailed modeling approach for predicting root water uptake. Vadose Zone Journal.
7:1079-1088.
Kaestner, A.P., S.Hartmann, G.Kuehne, G.Frei, C.Gruenzweig, L.Josic, F.Schmid,
E.H.Lehmann. 2011. The ICON beamline - A facility for cold neutron imaging at
SINQ. Nuclear Instruments and Methods in Physics Research Section A:
Accelerators, Spectrometers, Detectors and Associated Equipment. 659:387-393.
Landsberg,J.J., and N.D.Fowkes. 1978. Water-movement through plant roots. Journal of the
Science of Food and Agriculture .29:831-832.
Longsworth,L. 1960. The Mutual diffusion of light and heavy water. Journal of Physical
Chemistry 64:1914-1917.
McLean,E.H., M.Ludwig, and P.F.Grierson. 2011. Root hydraulic conductance and
aquaporin abundance respond rapidly to partial root-zone drying events in a riparian
Melaleuca species. New Phytologist .192:664-675.
Quantification and modeling of local root water uptake 56
Matsushima,U., N.Kardjilov, A.Hilger, W.Graf, and W.B.Herppich. 2008. Application
potential of cold neutron radiography in plant science research. Journal of Applied
Botany and Food Quality-Angewandte Botanik. 82:90-98.
Meyer,C.J., J.L.Seago, and C.A.Peterson. 2009. Environmental effects on the maturation of
the endodermis and multiseriate exodermis of Iris germanica roots. Annals of Botany.
103:687-702.
Menon, B., M. Menon, B. Robinson, S.E. Oswald, A. Kaestner, K.C. Abbaspour, E.
Lehmann, and R. Schulin, 2007. Visualization of root growth in heterogeneously
contaminated soil using neutron radiography. European Journal of Soil Science. 58:
802-810.
Moradi,A.B., H.M.Conesa, B.Robinson, E.Lehmann, G.Kuehne, A.Kaestner, S.Oswald, and
R.Schulin. 2009. Neutron radiography as a tool for revealing root development in soil:
capabilities and limitations. Plant and Soil. 318:243-255.
Moradi,A.B., A.Carminati, D.Vetterlein, P.Vontobel, E.Lehmann, U.Weller, J.W.Hopmans,
H.J.Vogel, and S.E.Oswald. 2011. Three-dimensional visualization and quantification
of water content in the rhizosphere. The New phytologist. 192:653-663.
Passioura,J.B. 1980. The Transport of water from soil to shoot in wheat seedlings. Journal of
Experimental Botany. 31:333-345.
Peterson, C. A., M. Murrmann and E. Steudle. 1993. Location of major barriers to water and
ion movement in young roots of Zea mays L. Planta. 190:127–136.
Pierret,A., M.Kirby, and C.Moran. 2003. Simultaneous X-ray imaging of plant root growth
and water uptake in thin-slab systems. Plant and Soil. 255:361-373.
Pohlmeier,A., A.Oros-Peusquens, M.Javaux, M.I.Menzel, J.Vanderborght, J.Kaffanke,
S.Romanzetti, J.Lindenmair, H.Vereecken, and N.J.Shah. 2008. Changes in soil water
content resulting from Ricinus root uptake monitored by magnetic resonance Imaging.
Vadose Zone Journal. 7:1010-1017.
Roose,T., and A.C.Fowler. 2004. A model for water uptake by plant roots. Journal of
Theoretical Biology. 228:155-171.
Chapter 2 57
Somma,F., J.W.Hopmans, and V.Clausnitzer. 1998. Transient three-dimensional modeling of
soil water and solute transport with simultaneous root growth, root water and nutrient
uptake. Plant and Soil. 202:281-293.
Steudle,E. 2000. Water uptake by plant roots: an integration of views. Plant and Soil. 226:45-
56.
Zwieniecki,M.A., M.V.Thompson, and N.M.Holbrook. 2003. Understanding the hydraulics
of porous pipes: Tradeoffs between water uptake and root length utilization. Journal
of Plant Growth Regulation. 21:315-323.

Chapter 3 59
Where do roots take up water? Neutron radiography of
water flow into roots of transpiring plants growing in soil
Mohsen Zarebanadkouki, Yangmin X. Kim, Andrea Carminati
New Phytologisit Journal (2013), doi: 10.1111/nph.12330
Quantification and modeling of local root water uptake 60
Summary
Where and how fast does water flow from soil into roots? Answer to this question
requires direct and in-situ measurement of local flow of water into roots of transpiring
plants growing in soil.
We used neutron radiography to trace the transport of deuterated water (D2O) in
Lupine roots. Lupines were grown in aluminum containers (30×25×1cm) filled with
sandy soil. D2O was injected in different soil regions and its transport in soil and roots
was monitored by neutron radiography. The transport of water into roots was then
quantified using a convection-diffusion model of D2O transport into roots.
The results showed that water uptake was not uniform along root. Water uptake was
higher in the upper soil layers than in the lower ones. Along an individual roots, the
radial flux was higher into the proximal segments than into the distal segments.
In Lupines most of the water uptake occurred in lateral roots. The function of the
taproot was to collect water from laterals and transport it to the shoot. This function is
ensured by a low radial conductivity and a high axial conductivity. Lupine root
architecture seems favorable to take up water from deep soil layers.
Chapter 3 61
Introduction
Where and how fast do roots take up water? Despite its importance in plant and soil sciences,
there is limited experimental information on the location of water uptake along roots of
transpiring plants growing in soil. Root water uptake is a dynamic process that involves
complex interactions between atmosphere, plants and soil. Location of water flow into roots
depends on the relative importance of the hydraulic conductivities of the root-soil interface,
of the radial path across roots, and of the axial path along the xylem (Landsberg & Fowkes,
1978; Steudle & Peterson, 1998; Draye et al., 2010).
Due to the porous nature of the roots, the relative importance of radial and axial conductances
determines the profile of water uptake along roots (Landsberg & Fowkes, 1978; Frensch et
al., 1996; Hsiao & Xu, 2000; Zwieniecki et al., 2003). During transpiration, the initiating low
water potential at the proximal end of a root dissipates along the root and a lower tension
transmittes to the distal parts. A combination of high radial conductivity and low axial
conductivity results in a big pressure dissipation along xylem, and in a reduced uptake from
the distal parts. Conversely, low radial conductivity and high axial conductivity result in
uniform water uptake along the root.
Root hydraulic conductivities vary along the root system during root maturation as well as in
response to external conditions. As roots mature, their radial hydraulic conductivities
decrease as a consequence of anatomical modification of the root tissue (Steudle & Peterson,
1998; Enstone et al., 2003; Bramley et al., 2009; Knipfer & Fricke, 2010). Decrease of the
radial hydraulic conductivity with age shifts the water uptake zone to the distal root
segments. The axial conductivity varies along root length as a consequence of the
differentiation of early metaxylem vessels during the developmental stage of plants and the
formation of secondary xylem during secondary growth (Varney & Canny, 1993; McCully,
1995; Vercambre et al., 2002; Bramley et al., 2009). Increase of axial hydraulic conductivity
through root maturation helps to redistribute the water uptake zone more evenly along roots.
As the soil dries, the soil hydraulic conductivity may further limit root water uptake. As the
soil typically dries up quicker in the upper layers (due to evaporation, gravity and higher root
length density), the water uptake zone is expected to move downwards along the soil profile.

Where do roots take up water? 62
To date, it has been difficult to directly measure where roots take up water in soil. Thanks to
recent advances in imaging methods, it is now possible to monitor the spatiotemporal
distribution of roots and water content in soil (Pierret et al., 2003; Garrigues et al., 2006;
Pohlmeier et al., 2008; Moradi et al., 2011). In these studies, root water uptake was indirectly
estimated from the decrease in soil water content near the roots. However, simulations of
water flow in soil demonstrated that water uptake is not equal to the change in water content
because of soil water redistribution. Therefore, observations of water content change must be
coupled with models of water flow in roots and soil (Javaux et al., 2008). Such methods
require accurate knowledge of root and soil hydraulic properties and cannot differentiate
between uptake rates of neighboring roots.
In this study, we tested a new method to measure the local fluxes of water into and along the
root system of transpiring plant growing in soil. The method consists of monitoring the
transport of deuterated water (D2O) into roots by means of time-series neutron radiography.
Neutron radiography is an imaging technique that has high sensitivity to normal water (H2O).
Compared to normal water, D2O is almost transparent in neutron radiography and its
transport into roots can be monitored at high temporal and spatial resolution. The method was
introduced by Zarebanadkouki et al.( 2012), who applied it to lateral roots of Lupines at a
specific location of the root system. The objective of the present study was to apply the
technique to different locations along the roots of lupins. The model introduced by
Zarebanadkouki et al.( 2012) has been extended to the case of roots partly immersed in H2O
and partly in D2O. Additionally, the description of the radial pathway of water into roots has
been generalized to allow a varying importance of apoplastic and cell-to-cell flow. The
questions we addressed are: where does water enter the roots of lupins? Is the water uptake
higher in the taproot or in the laterals, and in the proximal or in the distal segments? In these
experiments, the soil was kept wet. In further studies, we will investigate how the uptake
patterns change as the soil dries.

Chapter 3 63
Materials and methods
Plant and soil preparation
Lupines (Lupinus albus L.cv. Feodora) were grown in aluminum containers (25 cm wide, 30
cm high and 1 cm thick) filled with sandy soil. The soil was collected from the artificial
catchment of Chicken Creek located near Cottbus, Germany. The soil (sieved to a particle
size smaller than 2 mm) consisted of 92% sand, 5% silt and 3% clay. The aluminum faces of
the containers were detachable to allow filling of the soil. Three vertical sticks (1×30×1 cm)
and three horizontal ones (1 ×25×1 cm) made of plastic were placed inside the containers
dividing the internal space of the containers into sixteen compartments (4 rows × 4 columns).
The sandy soil was poured into each compartment through a 2 mm sieve to favor a
homogeneous soil deposition and to reduce soil layering while the containers were laid
horizontally. Dry weight of the soil was approximately 1 kg in each container. The soil was
wetted and the sticks were removed from the containers. The space between the
compartments was filled with coarse sand (grain diameter of 1.2-1.7 mm). The layers of
coarse sand acted as capillary barriers to hydraulically disconnect the adjacent compartments
without hindering root penetration. We refer to these layers as capillary barriers. The
detachable faces of the containers were then closed, and the samples were gently turned
vertically. This procedure resulted in an average bulk density of 1.4 g cm-3. The detachable
face of the containers had holes of 1 mm in diameter at intervals of 3 cm. A fine-needle
syringe was used for injecting D2O through the holes into the soil. The top of the samples
was covered with 1 cm layer of quartz gravel with grain size of 3 mm to minimize
evaporation.
Lupines (Lupinus albus L.cv. Feodora) were grown in aluminum containers (25 cm wide, 30
cm high and 1 cm thick) filled with sandy soil. The soil was collected from the artificial
catchment of Chicken Creek located near Cottbus, Germany. The soil (sieved to a particle
size smaller than 2 mm) consisted of 92% sand, 5% silt and 3% clay. The aluminum faces of
the containers were detachable to allow filling of the soil. Three vertical sticks (1×30×1 cm)
and three horizontal ones (1 ×25×1 cm) made of plastic were placed inside the containers
dividing the internal space of the containers into sixteen compartments (4 rows × 4 columns).
The sandy soil was poured into each compartment through a 2 mm sieve to favor a
Where do roots take up water? 64
homogeneous soil deposition and to reduce soil layering while the containers were laid
horizontally. Dry weight of the soil was approximately 1 kg in each container. The soil was
wetted and the sticks were removed from the containers. The space between the
compartments was filled with coarse sand (grain diameter of 1.2-1.7 mm). The layers of
coarse sand acted as capillary barriers to hydraulically disconnect the adjacent compartments
without hindering root penetration. We refer to these layers as capillary barriers. The
detachable faces of the containers were then closed, and the samples were gently turned
vertically. This procedure resulted in an average bulk density of 1.4 g cm-3. The detachable
face of the containers had holes of 1 mm in diameter at intervals of 3 cm. A fine-needle
syringe was used for injecting D2O through the holes into the soil. The top of the samples was
covered with 1 cm layer of quartz gravel with grain size of 3 mm to minimize evaporation.
Lupine seeds were germinated on moist filter paper in the dark for 24 hours. The seedlings
were then planted in the containers at 1 cm depth. The plants were grown for 18 to 21 days
with photoperiod of 14 hours, light intensity of 300 μmol m2 s-1, day/night temperature of
24°C/19°C, and relative humidity of 60%. Plants were irrigated every third day by slowly
immersing the samples in a nutrient solution until the water table reached the bottom of the
upper compartments. The bottom of containers had holes to allow infiltration from the
bottom. The samples were then slowly lifted letting each compartment to drain freely. This
resulted in an average water content of 0.20 cm3 cm-3 in each compartment. The nutrient
solution was composed of (in mM): K2SO4, 3.5; KCl, 1; KH2PO4, 1; Ca(NO3)2, 1; MgSO4, 5;
and (in µM) H3BO3, 100; MnSO4, 5; ZnSO4, 5; CuSO4, 2; (NH4)Mo7O24, 0.1; Fe-EDTA, 200.
The plants were 18 to 21day-old when the neutron radiography experiment started.
Transpiration rates were calculated by weighing samples at intervals of six hours during day
and night. The average of daytime transpiration of 18 to 21-day-old plants was 1.23±0.18 g h-
1 (n=10) and it was negligible at night. At this stage, plants had six leaves with a total leaf
area of approximately 63±5 cm2 (n=3). After the measurement, we opened the containers and
washed the roots. We did not observe any evidence of arbuscular mycorrhizas and rhizobial
nodules.
Chapter 3 65
Neutron radiography
Neutron radiography is an imaging technique that, due to its high sensitivity to hydrous
materials, has been widely used to image water and root distribution in soil (Tumlinson et al.,
2007; Oswald et al., 2008; Moradi et al., 2008; Carminati et al., 2010). Neutron radiography
consists in guiding a neutron beam across the sample. The transmitted beam carries the
information about sample composition and thickness. The Beer-Lambert law describes the
attenuation of the neutron beam through a sample
1
0
exp
i n
i i
i
dI
I
(3.1)
where I is the intensity of the attenuated neutron beam [number of neutrons m−2 s−1], I0 is the
intensity of the incident neutron beam [number of neutrons m−2 s−1], di (m) is the thickness of
the i-material composing the sample, and μi [m−1] is the macroscopic neutron attenuation
coefficient, which describes the probability of neutron interactions with the materials per unit
of thickness.
Our experiments were carried out at the ICON beam-line of the Paul Scherrer Institute (PSI),
Switzerland. We used a CCD camera detector with an array of 1260×1260 pixels, resulting in
a field of view of 15.75×15.75 cm and an effective spatial resolution of 0.125 mm. Four
radiographs with marginal overlaps were needed to scan a whole sample. For the
measurements during daytime, a lamp that was identical to those in the growth chamber was
installed in the imaging station above the plants. Plants were kept in the imaging station for
one hour before starting the measurement. The measurements lasted approximately two
hours. Transpiration rate was measured from the weight of samples before and after neutron
radiography. During daytime measurements, the average transpiration was 1.43±0.25 g h-1
(n=4).
Deuterated water
Deuterated water (D2O) was used as a contrast agent to trace the flow of water into the roots.
In contrast to normal water, D2O has a much lower neutron attenuation coefficient, which
makes it well distinguishable in neutron radiographs. Because of its similarity to water, D2O
has been used since long time to study water flow in plants (Ordin & Kramer, 1956;
Where do roots take up water? 66
Matsushima et al., 2008; Da-Ines et al., 2010). We locally injected 3-4 ml of D2O (purity of
99.97 %) in selected soil compartments using a syringe. Spatiotemporal distribution of D2O
in soil and its transport into and along roots were monitored by time-series neutron
radiography at time intervals of 10 seconds for a period of two hours. The measurements
were performed during daytime and nighttime at different locations of 10 samples.
Image processing
Neutron radiographs were referenced to flat field (radiography without sample) and dark
current (signal recorded by the camera when there was no beam). The neutron attenuations of
aluminum and dry soil were determined by the neutron radiographs of a slab filled with dry
soil. After subtraction of the contribution of aluminum and dry soil, the remaining values
gave the water content in the sample. Due to their high water content, roots could be clearly
distinguished from the soil. Roots were segmented from soil using the roottracker2D
algorithm developed by Anders Kaestner (Menon et al., 2007). Root segmentation was
performed on the radiographs obtained before the injection of D2O. The segmented roots
were skeletonized and their length and diameter were calculated using the Euclidean distance.
In 2D radiographs, the signal in the pixels containing the roots was composed of attenuation
coefficients of the root and of the soil in front of and behind of the root in the beam direction
(across soil thickness). The actual contributions of H2O and D2O in the root were calculated
assuming that the amount of H2O and D2O in soil in front of and behind of the root was equal
to that of the soil at the sides of the root (i.e. it we assumed a radial symmetry around the
roots). We calculate the volumetric concentration of D2O in root (Cr) and soil (C0) as the
thickness of D2O divided by the total liquid thickness in root and soil, respectively. Cr and C0
were averaged along the segment of roots immersed in D2O.
The volume of D2O transported beyond the capillary barrier was calculated by subtracting the
radiographs at time t from the radiograph before D2O injection. This image processing is
described in details in the supplementary information (Method S1) and Zarebanadkouki et
al. (2012).

Chapter 3 67
Model of D2O transport in roots
To quantify the radial flux of water into roots, Zarebanadkouki et al. ( 2012) introduced a
simple model of D2O transport into and along roots. The transport of D2O into roots was
described by a diffusion-convection model, where the transport rate of D2O into the roots
depended on the convective transport (net root water uptake) and on the diffusion of D2O
(Fig. 1). Zarebanadkouki et al. (2012) assumed that the entire root segment, including the
root tip, was immersed in D2O and the radial flow of water across the cortex was primarily
apoplastic. In the present paper, the model is extended to the case when a portion of the root
is immersed in D2O, while the rest is immersed in normal water. Additionally, the description
of the water flow across the cortex has been generalized to allow a variable importance of the
apoplast and cell-to-cell pathways. The model is explained in the next sections. Derivation of
the equations is given in the Appendix A.
Figure 1: Illustration of D2O transport into a root that is partially immersed in D2O. The radial transport
of D2O into the root is driven by the concentration gradients between soil and root (diffusion, red arrows)
and by convection following the transpiration stream (blue arrows). As D2O reaches the xylem, it mixes
with the incoming water flow and it flows axially along the root. The capillary barriers were used to limit
D2O diffusion in soil.
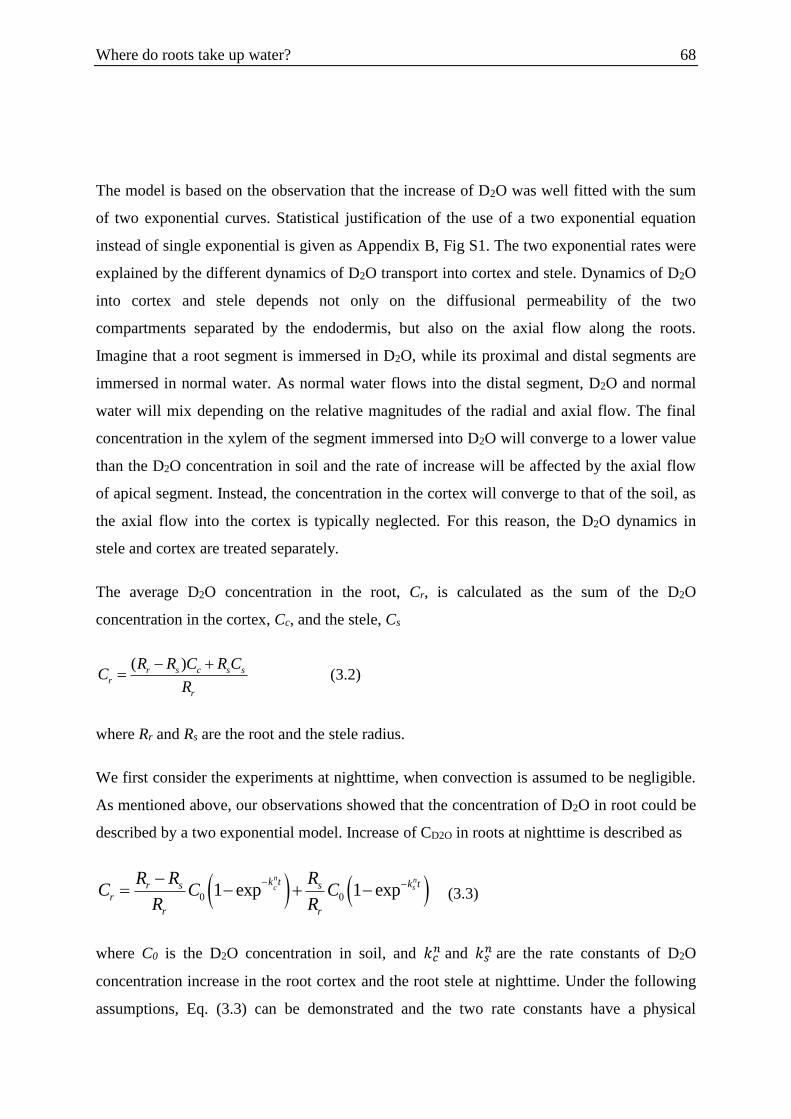
Where do roots take up water? 68
The model is based on the observation that the increase of D2O was well fitted with the sum
of two exponential curves. Statistical justification of the use of a two exponential equation
instead of single exponential is given as Appendix B, Fig S1. The two exponential rates were
explained by the different dynamics of D2O transport into cortex and stele. Dynamics of D2O
into cortex and stele depends not only on the diffusional permeability of the two
compartments separated by the endodermis, but also on the axial flow along the roots.
Imagine that a root segment is immersed in D2O, while its proximal and distal segments are
immersed in normal water. As normal water flows into the distal segment, D2O and normal
water will mix depending on the relative magnitudes of the radial and axial flow. The final
concentration in the xylem of the segment immersed into D2O will converge to a lower value
than the D2O concentration in soil and the rate of increase will be affected by the axial flow
of apical segment. Instead, the concentration in the cortex will converge to that of the soil, as
the axial flow into the cortex is typically neglected. For this reason, the D2O dynamics in
stele and cortex are treated separately.
The average D2O concentration in the root, Cr, is calculated as the sum of the D2O
concentration in the cortex, Cc, and the stele, Cs
( )r s c s sr
r
R R C R CC
R
(3.2)
where Rr and Rs are the root and the stele radius.
We first consider the experiments at nighttime, when convection is assumed to be negligible.
As mentioned above, our observations showed that the concentration of D2O in root could be
described by a two exponential model. Increase of CD2O in roots at nighttime is described as
0 01 exp 1 expn nc s
k t k tr s sr
r r
R R RC C C
R R
(3.3)
where C0 is the D2O concentration in soil, and 𝑘𝑐𝑛 and 𝑘𝑠
𝑛 are the rate constants of D2O
concentration increase in the root cortex and the root stele at nighttime. Under the following
assumptions, Eq. (3.3) can be demonstrated and the two rate constants have a physical
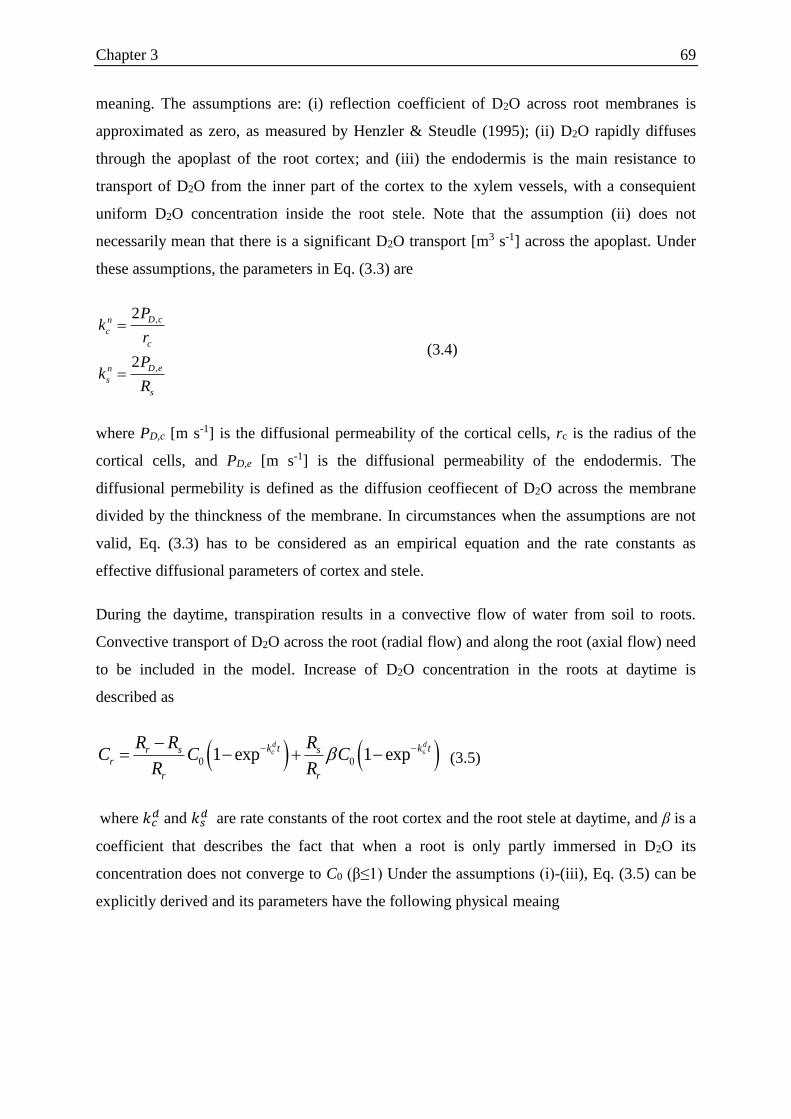
Chapter 3 69
meaning. The assumptions are: (i) reflection coefficient of D2O across root membranes is
approximated as zero, as measured by Henzler & Steudle (1995); (ii) D2O rapidly diffuses
through the apoplast of the root cortex; and (iii) the endodermis is the main resistance to
transport of D2O from the inner part of the cortex to the xylem vessels, with a consequient
uniform D2O concentration inside the root stele. Note that the assumption (ii) does not
necessarily mean that there is a significant D2O transport [m3 s-1] across the apoplast. Under
these assumptions, the parameters in Eq. (3.3) are
,
,
2
2
D cn
c
c
D en
s
s
Pk
r
Pk
R
(3.4)
where PD,c [m s-1] is the diffusional permeability of the cortical cells, rc is the radius of the
cortical cells, and PD,e [m s-1] is the diffusional permeability of the endodermis. The
diffusional permebility is defined as the diffusion ceoffiecent of D2O across the membrane
divided by the thinckness of the membrane. In circumstances when the assumptions are not
valid, Eq. (3.3) has to be considered as an empirical equation and the rate constants as
effective diffusional parameters of cortex and stele.
During the daytime, transpiration results in a convective flow of water from soil to roots.
Convective transport of D2O across the root (radial flow) and along the root (axial flow) need
to be included in the model. Increase of D2O concentration in the roots at daytime is
described as
0 01 exp 1 expd dc sk t k tr s s
r
r r
R R RC C C
R R
(3.5)
where 𝑘𝑐𝑑 and 𝑘𝑠
𝑑 are rate constants of the root cortex and the root stele at daytime, and β is a
coefficient that describes the fact that when a root is only partly immersed in D2O its
concentration does not converge to C0 (β≤1) Under the assumptions (i)-(iii), Eq. (3.5) can be
explicitly derived and its parameters have the following physical meaing
Where do roots take up water? 70
,
,
,
,
22
2
2 2
2
rD c
d
c
c
outD ed x
s
s
D e r
s
outD e x
s
jP
kr
P jk
R L
P j
R
P j
R L
(3.6)
where jr [m s-1] is the radial flux of water into the root endodermis , 𝑗𝑥𝑜𝑢𝑡 [m s-1] is the axial
flux of water through the root stele from the root segment immersed in D2O, L is the length of
the root segment immersed in D2O, and λ is a coefficient vairing between zero and unity and
describing the relative importance of the apoplastic and cell-to-cell flow across the cortex. If
the flow through the cortex is purely apoplectic, λ=0 and the model corrensponds to that of
Zarebanadkouki et al. (2102). If the flow though the cortex is purely cell-to-cell, λ=1.
If the root segment including the root tip is entirely immersed in D2O, the outflow of liquid
from the root segment is equal to the radial flow into the segment (𝜋𝑅𝑠2𝑗𝑥
𝑜𝑢𝑡 = 2𝜋𝑅𝑠𝐿𝑗𝑟).
From Eq. (3.6) it follows that β=1 and 𝑘𝑠𝑑 = 2(𝑃𝐷,𝑒 + 𝑗𝑟)/𝑅𝑠. This case corresponds to the
model of Zarebanadkouki et al . (2012). For the roots that are partly immersed in D2O, the
outflow of liquid from the root segment is equal to the radial convective flow into the
segment plus the axial inflow of liquid into the root segment (𝜋𝑅𝑠2𝑗𝑥
𝑜𝑢𝑡 = 2𝜋𝑅𝑠𝐿𝑗𝑟 +
𝜋𝑅𝑠2𝑗𝑥
𝑖𝑛). In this case, β<1.
Eq. (3.3) and Eq. (3.5) were fitted to the data of the D2O concentration increase in roots
during nighttime and daytime that were obtained from neutron radiographs. From the
nighttime measurements, we calculated the diffusional permeabilities, PD,c and PD,e. To
calculate the net transport of D2O into roots, we assumed that the diffusional permeability
coefficients were identical at daytime and nighttime. The validity of this assumption is
discussed later in the text.

Chapter 3 71
Quantification of axial flux along the root
The axial fluxes, 𝑗𝑥𝑜𝑢𝑡, were directly calculated from the volume of D2O that passed the
capillary barrier, VD2O [m3]. VD2O is related to the axial flow according to
2 2
, ( )D O out
s x s b
dVR j C t
dt
(3.7)
where Cs,b is the D2O concentration in the root stele at the place of capillary barrier . VD2O
was quantified from the time-series neutron images. Note that the values obtained with Eq.
(3.7) are independent from our modeling approach.
Results
We measured the transport of D2O into the roots of ten plants. D2O was injected into selected
compartments of each sample during daytime and nighttime. To illustrate the results, we
show the radiographs of one sample in which D2O was injected during the daytime in two
compartments (Figure 2). Figure 2a shows radiography of the sample before injection of 4 ml
of D2O into each compartment. The image was obtained by overlapping four radiographs
taken at different locations. A close-up of the regions where D2O was injected is shown in
Figure 2b. In Figure 2a and 2b the gray values are proportional to water content: the darker
was the image the higher was the soil water content. Before D2O injection, the average soil
water content in all compartments of the 10 sampels was between 0.08 and 0.15 [cm3 cm-3],
which in our soil corresponds to soil matric potentials of -70 hPa and -20 hPa, respectively
(Carminati et al., 2010). After injection of D2O, the water content increased from 0.08-0.15 to
0.18-0.25. The corresponding change in pressure is expected to be of approximately 50 hPa,
which is small compared to the difference in water potential between soil and root.
The sharp contrast between roots and the surrounding soil resulting from the higher
volumetric water content in roots allowed us to segment roots from soil. The average root
length of the ten plants was 470±36 cm (n=10). The marked rectangles in Figure 2a show the
compartments where D2O was injected. The roots that were selected for the analysis of D2O
transport are marked as roots 1-7 (Figure 2b). Root 1, 2 and 4 had a length of 12-14 cm, and
roots 3 and 7 had a length of 8-10 cm.
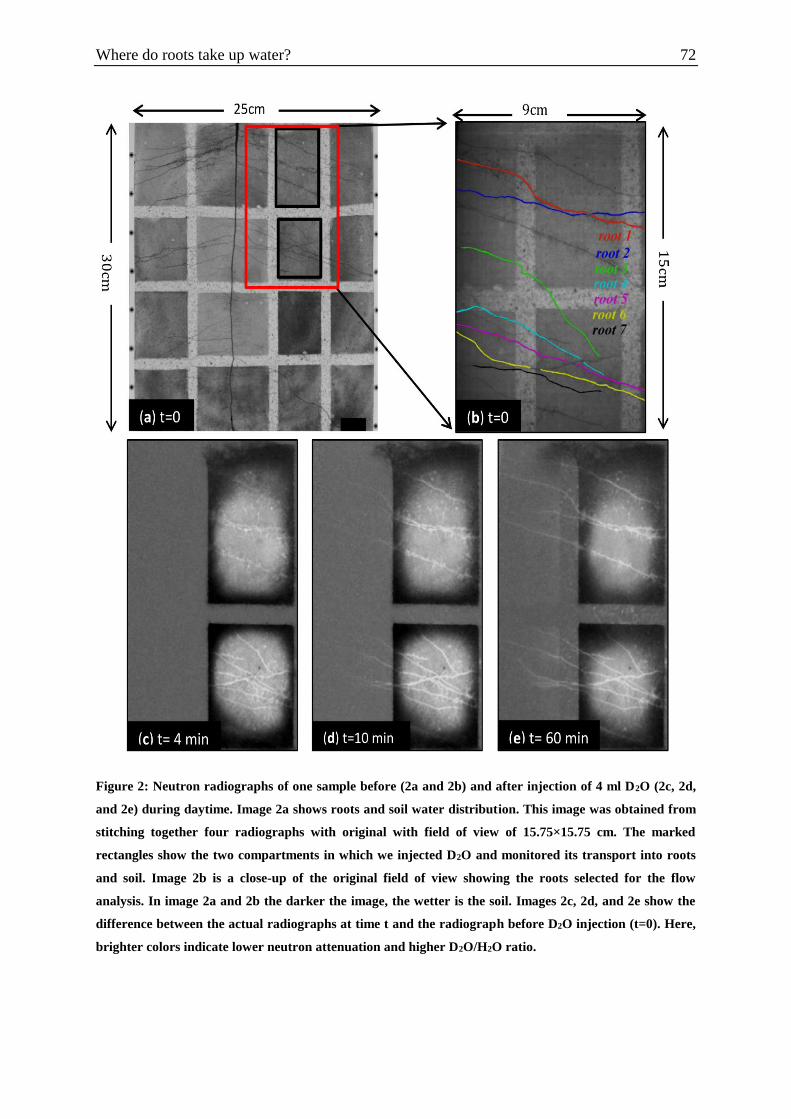
Where do roots take up water? 72
Figure 2: Neutron radiographs of one sample before (2a and 2b) and after injection of 4 ml D2O (2c, 2d,
and 2e) during daytime. Image 2a shows roots and soil water distribution. This image was obtained from
stitching together four radiographs with original with field of view of 15.75×15.75 cm. The marked
rectangles show the two compartments in which we injected D2O and monitored its transport into roots
and soil. Image 2b is a close-up of the original field of view showing the roots selected for the flow
analysis. In image 2a and 2b the darker the image, the wetter is the soil. Images 2c, 2d, and 2e show the
difference between the actual radiographs at time t and the radiograph before D2O injection (t=0). Here,
brighter colors indicate lower neutron attenuation and higher D2O/H2O ratio.
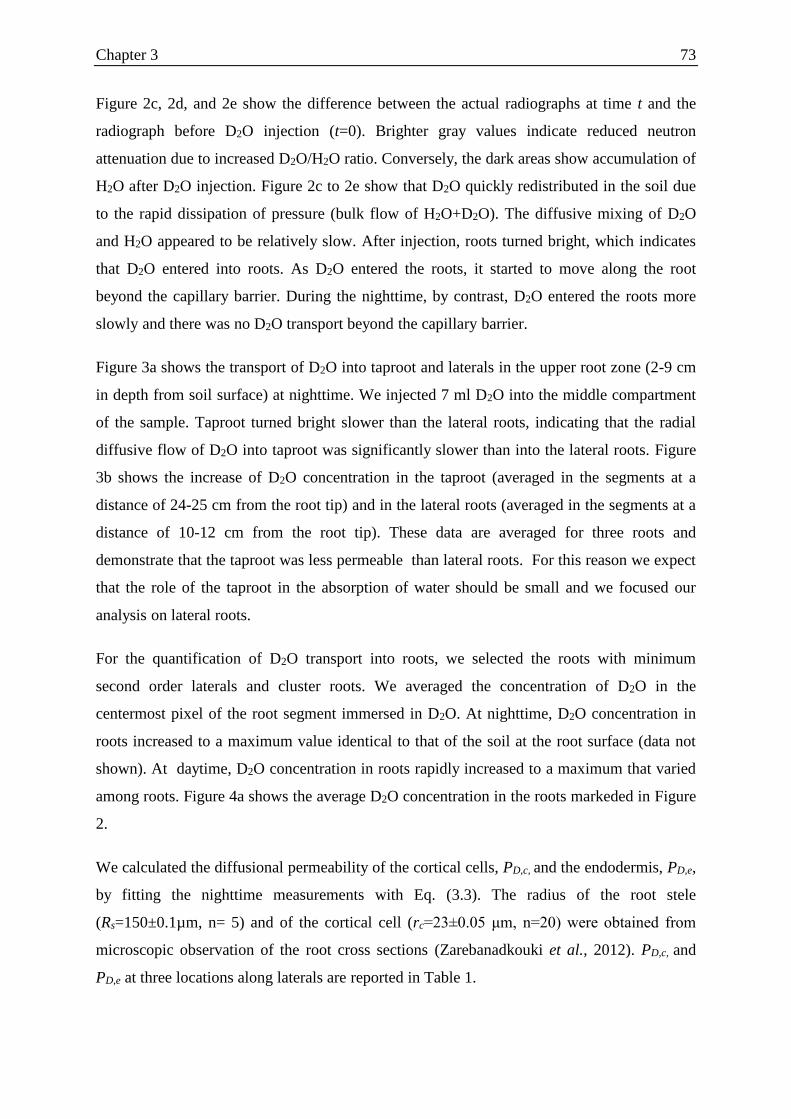
Chapter 3 73
Figure 2c, 2d, and 2e show the difference between the actual radiographs at time t and the
radiograph before D2O injection (t=0). Brighter gray values indicate reduced neutron
attenuation due to increased D2O/H2O ratio. Conversely, the dark areas show accumulation of
H2O after D2O injection. Figure 2c to 2e show that D2O quickly redistributed in the soil due
to the rapid dissipation of pressure (bulk flow of H2O+D2O). The diffusive mixing of D2O
and H2O appeared to be relatively slow. After injection, roots turned bright, which indicates
that D2O entered into roots. As D2O entered the roots, it started to move along the root
beyond the capillary barrier. During the nighttime, by contrast, D2O entered the roots more
slowly and there was no D2O transport beyond the capillary barrier.
Figure 3a shows the transport of D2O into taproot and laterals in the upper root zone (2-9 cm
in depth from soil surface) at nighttime. We injected 7 ml D2O into the middle compartment
of the sample. Taproot turned bright slower than the lateral roots, indicating that the radial
diffusive flow of D2O into taproot was significantly slower than into the lateral roots. Figure
3b shows the increase of D2O concentration in the taproot (averaged in the segments at a
distance of 24-25 cm from the root tip) and in the lateral roots (averaged in the segments at a
distance of 10-12 cm from the root tip). These data are averaged for three roots and
demonstrate that the taproot was less permeable than lateral roots. For this reason we expect
that the role of the taproot in the absorption of water should be small and we focused our
analysis on lateral roots.
For the quantification of D2O transport into roots, we selected the roots with minimum
second order laterals and cluster roots. We averaged the concentration of D2O in the
centermost pixel of the root segment immersed in D2O. At nighttime, D2O concentration in
roots increased to a maximum value identical to that of the soil at the root surface (data not
shown). At daytime, D2O concentration in roots rapidly increased to a maximum that varied
among roots. Figure 4a shows the average D2O concentration in the roots markeded in Figure
2.
We calculated the diffusional permeability of the cortical cells, PD,c, and the endodermis, PD,e,
by fitting the nighttime measurements with Eq. (3.3). The radius of the root stele
(Rs=150±0.1µm, n= 5) and of the cortical cell (rc=23±0.05 μm, n=20) were obtained from
microscopic observation of the root cross sections (Zarebanadkouki et al., 2012). PD,c, and
PD,e at three locations along laterals are reported in Table 1.
Where do roots take up water? 74
Figure 3: Neutron radiographs of one sample before D2O injection (3a) and after injection (3b-d) at
nighttime. Images 3b-dare the difference between the actual radiograph at various times and the one
before injection (at t=0). Images 3a-d show radial transport of D2O into the proximal parts of the taproot
(3-8 cm depth) and the lateral roots. Brighter colors in images 3b-3d indicate higher D2O/H2O ratio.
Figure 3e shows the average concentration of D2O in the taproot and in the laterals. The data are

Chapter 3 75
averaged for three plants. These results show that the taproot of Lupines is less permeable than the
laterals.
The diffusional permeability of cortical cells showed no variation along roots and had an
average value of 4.8±0.3×10⁻⁸m s-1. In contrast, the diffusional permeability of the
endodermis decreased from 1.4±0.2×0.210-7 m s-1 in the most distal parts of roots (2-3 cm
from the root tip) to 5.6±0.3×10⁻⁸ m s-1 in the most proximal parts (10-12 cm from the root
tip).
Table 1: Diffusional permeability of cortical cells, PD,c, [m s-1], and endodermis, PD,e, [m s-1], along lateral
roots. Diffusional permeabilities were measured at various distances from the root tip using the data of
D2O transport into the roots at nighttime, when transpiration was nearly zero. The values are average of
six roots.
By fitting the increase of D2O concentration in roots using Eq. (3.5), we obtained the radial
flux, jr, the axial flux, 𝑗𝑥𝑜𝑢𝑡, and the parameter λ. To summarize the results, we grouped the
roots of ten plants into an upper zone (roots at 2-9 cm in depth from soil surface) and into a
lower zone (18-27 cm in depth). Additionally we grouped the roots according to their length:
(i) long roots with length of 12-14 cm, (ii) medium roots with length of 8-10 cm, (iii) and
short roots with length of 3-4 cm. These groups yield a picture of the distribution of root
water uptake along the root system as presented in Figure 5.
Distance
from tip
Diffusional permeability
of cortical cells, PD,C [m s-1]
Diffusional permeability
of endodermis, PD,e [m s-1]
2-3 cm 5.0±0.4×10⁻⁸ 1.4±0.2×10⁻⁷
7-8 cm 4.6±0.2×10⁻⁸ 1.0±0.1×10⁻⁷
10-12 cm 4.6±0.3×10⁻⁸ 5.6±0.3×10⁻⁸
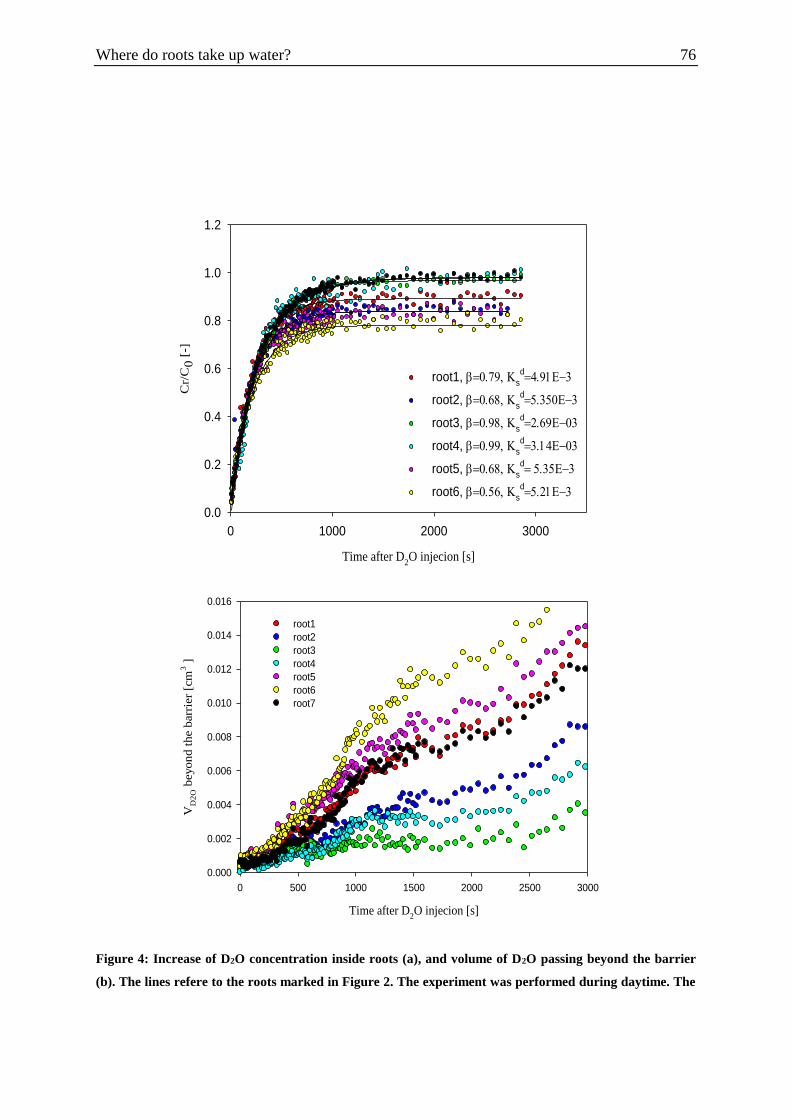
Where do roots take up water? 76
Figure 4: Increase of D2O concentration inside roots (a), and volume of D2O passing beyond the barrier
(b). The lines refere to the roots marked in Figure 2. The experiment was performed during daytime. The
i
j
Time after D2O injecion [s]
0 500 1000 1500 2000 2500 3000
VD
2O b
eyond t
he b
arr
ier
[cm
3 ]
0.000
0.002
0.004
0.006
0.008
0.010
0.012
0.014
0.016
root1
root2
root3
root4
root5
root6
root7
Time after D2O injecion [s]
0 1000 2000 3000
Cr/
C0 [
-]
0.0
0.2
0.4
0.6
0.8
1.0
1.2
root1, s
d
root2, s
d
root3, s
d
root4, s
d
root5, s
d
root6, s
d
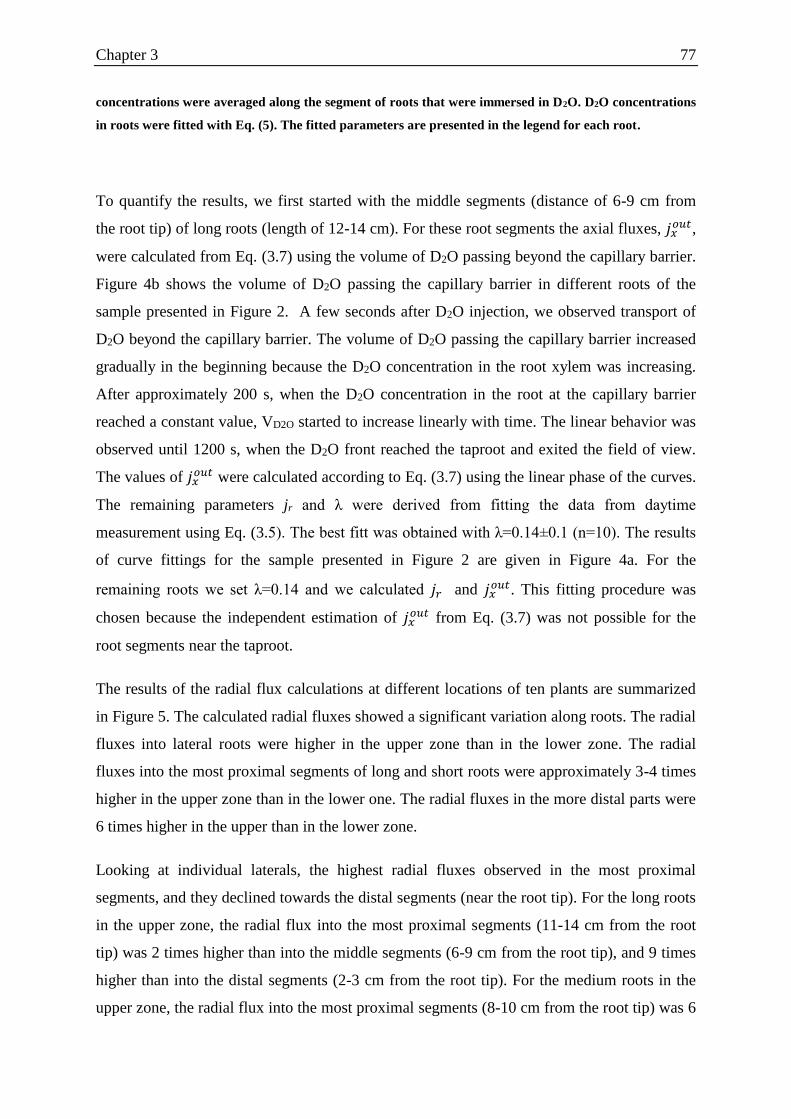
Chapter 3 77
concentrations were averaged along the segment of roots that were immersed in D2O. D2O concentrations
in roots were fitted with Eq. (5). The fitted parameters are presented in the legend for each root.
To quantify the results, we first started with the middle segments (distance of 6-9 cm from
the root tip) of long roots (length of 12-14 cm). For these root segments the axial fluxes, 𝑗𝑥𝑜𝑢𝑡,
were calculated from Eq. (3.7) using the volume of D2O passing beyond the capillary barrier.
Figure 4b shows the volume of D2O passing the capillary barrier in different roots of the
sample presented in Figure 2. A few seconds after D2O injection, we observed transport of
D2O beyond the capillary barrier. The volume of D2O passing the capillary barrier increased
gradually in the beginning because the D2O concentration in the root xylem was increasing.
After approximately 200 s, when the D2O concentration in the root at the capillary barrier
reached a constant value, VD2O started to increase linearly with time. The linear behavior was
observed until 1200 s, when the D2O front reached the taproot and exited the field of view.
The values of 𝑗𝑥𝑜𝑢𝑡 were calculated according to Eq. (3.7) using the linear phase of the curves.
The remaining parameters jr and λ were derived from fitting the data from daytime
measurement using Eq. (3.5). The best fitt was obtained with λ=0.14±0.1 (n=10). The results
of curve fittings for the sample presented in Figure 2 are given in Figure 4a. For the
remaining roots we set λ=0.14 and we calculated 𝑗𝑟 and 𝑗𝑥𝑜𝑢𝑡. This fitting procedure was
chosen because the independent estimation of 𝑗𝑥𝑜𝑢𝑡 from Eq. (3.7) was not possible for the
root segments near the taproot.
The results of the radial flux calculations at different locations of ten plants are summarized
in Figure 5. The calculated radial fluxes showed a significant variation along roots. The radial
fluxes into lateral roots were higher in the upper zone than in the lower zone. The radial
fluxes into the most proximal segments of long and short roots were approximately 3-4 times
higher in the upper zone than in the lower one. The radial fluxes in the more distal parts were
6 times higher in the upper than in the lower zone.
Looking at individual laterals, the highest radial fluxes observed in the most proximal
segments, and they declined towards the distal segments (near the root tip). For the long roots
in the upper zone, the radial flux into the most proximal segments (11-14 cm from the root
tip) was 2 times higher than into the middle segments (6-9 cm from the root tip), and 9 times
higher than into the distal segments (2-3 cm from the root tip). For the medium roots in the
upper zone, the radial flux into the most proximal segments (8-10 cm from the root tip) was 6
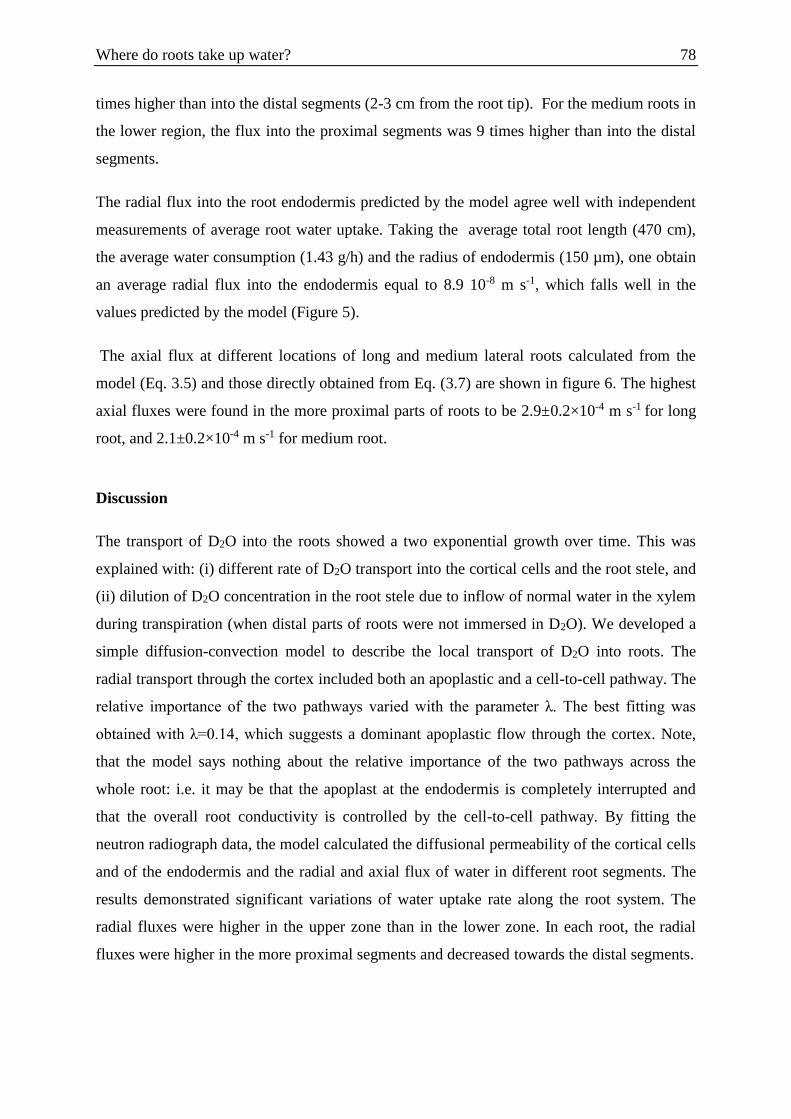
Where do roots take up water? 78
times higher than into the distal segments (2-3 cm from the root tip). For the medium roots in
the lower region, the flux into the proximal segments was 9 times higher than into the distal
segments.
The radial flux into the root endodermis predicted by the model agree well with independent
measurements of average root water uptake. Taking the average total root length (470 cm),
the average water consumption (1.43 g/h) and the radius of endodermis (150 µm), one obtain
an average radial flux into the endodermis equal to 8.9 10-8 m s-1, which falls well in the
values predicted by the model (Figure 5).
The axial flux at different locations of long and medium lateral roots calculated from the
model (Eq. 3.5) and those directly obtained from Eq. (3.7) are shown in figure 6. The highest
axial fluxes were found in the more proximal parts of roots to be 2.9±0.2×10⁻⁴ m s-1 for long
root, and 2.1±0.2×10⁻⁴ m s-1 for medium root.
Discussion
The transport of D2O into the roots showed a two exponential growth over time. This was
explained with: (i) different rate of D2O transport into the cortical cells and the root stele, and
(ii) dilution of D2O concentration in the root stele due to inflow of normal water in the xylem
during transpiration (when distal parts of roots were not immersed in D2O). We developed a
simple diffusion-convection model to describe the local transport of D2O into roots. The
radial transport through the cortex included both an apoplastic and a cell-to-cell pathway. The
relative importance of the two pathways varied with the parameter λ. The best fitting was
obtained with λ=0.14, which suggests a dominant apoplastic flow through the cortex. Note,
that the model says nothing about the relative importance of the two pathways across the
whole root: i.e. it may be that the apoplast at the endodermis is completely interrupted and
that the overall root conductivity is controlled by the cell-to-cell pathway. By fitting the
neutron radiograph data, the model calculated the diffusional permeability of the cortical cells
and of the endodermis and the radial and axial flux of water in different root segments. The
results demonstrated significant variations of water uptake rate along the root system. The
radial fluxes were higher in the upper zone than in the lower zone. In each root, the radial
fluxes were higher in the more proximal segments and decreased towards the distal segments.
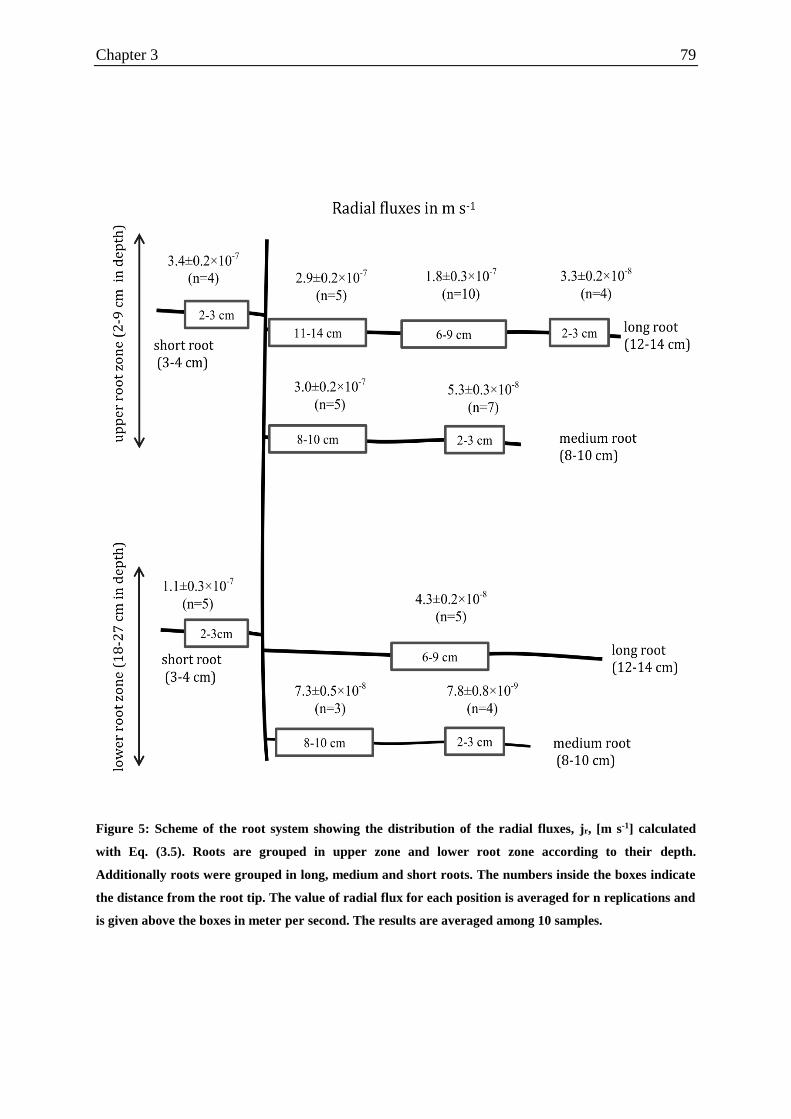
Chapter 3 79
Figure 5: Scheme of the root system showing the distribution of the radial fluxes, jr, [m s-1] calculated
with Eq. (3.5). Roots are grouped in upper zone and lower root zone according to their depth.
Additionally roots were grouped in long, medium and short roots. The numbers inside the boxes indicate
the distance from the root tip. The value of radial flux for each position is averaged for n replications and
is given above the boxes in meter per second. The results are averaged among 10 samples.
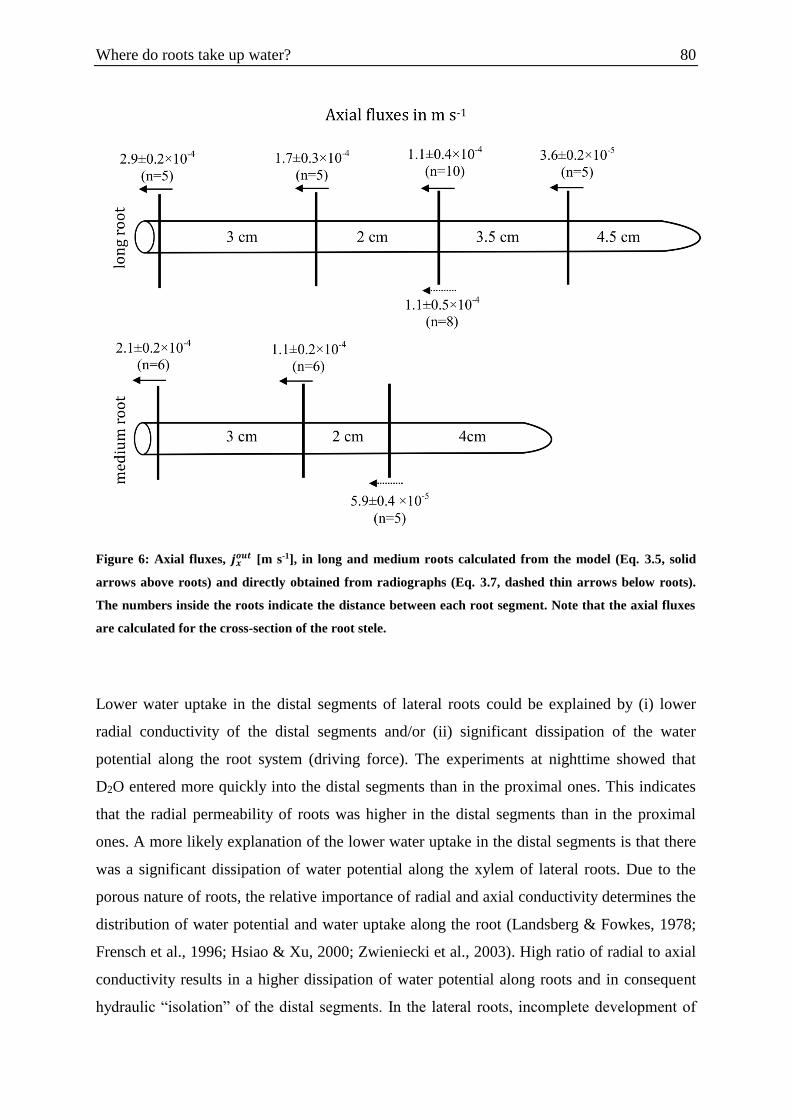
Where do roots take up water? 80
Figure 6: Axial fluxes, 𝒋𝒙𝒐𝒖𝒕 [m s-1], in long and medium roots calculated from the model (Eq. 3.5, solid
arrows above roots) and directly obtained from radiographs (Eq. 3.7, dashed thin arrows below roots).
The numbers inside the roots indicate the distance between each root segment. Note that the axial fluxes
are calculated for the cross-section of the root stele.
Lower water uptake in the distal segments of lateral roots could be explained by (i) lower
radial conductivity of the distal segments and/or (ii) significant dissipation of the water
potential along the root system (driving force). The experiments at nighttime showed that
D2O entered more quickly into the distal segments than in the proximal ones. This indicates
that the radial permeability of roots was higher in the distal segments than in the proximal
ones. A more likely explanation of the lower water uptake in the distal segments is that there
was a significant dissipation of water potential along the xylem of lateral roots. Due to the
porous nature of roots, the relative importance of radial and axial conductivity determines the
distribution of water potential and water uptake along the root (Landsberg & Fowkes, 1978;
Frensch et al., 1996; Hsiao & Xu, 2000; Zwieniecki et al., 2003). High ratio of radial to axial
conductivity results in a higher dissipation of water potential along roots and in consequent
hydraulic “isolation” of the distal segments. In the lateral roots, incomplete development of
Chapter 3 81
the xylem vessels towards distal segments would produce lower axial conductivity and may
have further decreased the water uptake in the most apical parts (McCully & Canny, 1988;
Huang & Nobel, 1993; McCully, 1995; Bramley et al., 2009).
The decrease in water uptake with distance in depth was smaller than with distance in
laterals. In laterals, water uptake decreased 9 times over a distance of 10 cm from the
proximal segments to the distal ones (2-3 cm from the tips). Instead, water uptake into the
proximal segments of roots decreased of 3 to 4 times over a depth of 15 cm (Fig. 5). This
indicates that the dissipation of water potential for the same unit of the root length along the
taproot is less significant than along lateral roots. The low dissipation of water potential along
the taproot is explained by the low ratio of radial to axial conductivity. Indeed, the
microscopic observation of the root cross sections revealed that xylem vessels were larger
and more abundant in the taproot compare to the lateral roots (data not shown). Additionally,
experiments at nighttime showed the radial transport of D2O into the taproot was significantly
slower than into the lateral roots (Fig. 3). This indicates that in comparison to lateral roots,
the taproot is significantly more resistant to radial flow of water into roots. The function of
the taproot is to collect water from laterals and transport to shoot. The combination of high
axial conductivity and low radial conductivity is beneficial for collecting water from deep
soil and increasing the portion of roots involved in water uptake. The tap-rooted architecture
seems optimal for plant survival in soils where water is mainly stored in the deep profiles.
Our observations of higher radial fluxes at the more proximal segment of roots are in
agreement with modeling studies (Landsberg & Fowkes, 1978; and Doussan et al., 1998),
experiment studies with excised roots (Frensch & Steudle, 1989; Zwieniecki et al,. 2003),
and those with roots in soils (Doussan et al., 2006). Location of root water uptake is expected
to change with root maturation. Decrease of radial hydraulic conductivity and increase of
axial conductivity due to root maturation might move the location of water uptake to more
distal zones. Sanderson, (1983) measured the profile of water uptake along roots of barley
grown in hydroponics culture using a potometer apparatus. He found that the peak of water
uptake was at a distance of 4-5 cm from the tip. Varney & Canny, (1993) measured water
uptake of lateral and axile roots for aeroponically grown maize. They observed that
maximum uptake from laterals occurred at 30-60 cm from the root tip of the main axes, and it
decreased towards the tip and the proximal parts. The axile roots were approximately 100 cm
long. Variations in root architecture, maturation of xylem vessels, changes of root

Where do roots take up water? 82
permeability by root maturation, and different growth condition account for the discrepancy
in the proximal parts.
As discussed above, the ratio of axial to radial conductivities determines the profile of water
uptake along a root. In order to maintain large area of roots involved in water uptake, root
elongation needs to be coupled with a decrease of radial conductivity and an increase of axial
conductivity. In addition to irreversible modification of roots during maturation, the ratio of
radial to axial resistance might be regulated by aquaporins and also by the resistance of the
root-soil interface. Recent studies on water dynamics in the rhizosphere showed that when the
soil dries, the rhizosphere becomes temporarily hydrophobic (Carminati et al., 2010). Such a
temporary hydrophobicity may help plants to isolate the roots from the top dry soil and favor
the uptake from the deep wet soil (Carminati, 2012). A similar mechanism will happen when
roots shrink and lose contact with the soil (Nobel & Cui, 1992; Nye, 1994; North & Nobel,
1997; Carminati et al., 2012). Carminati et al. (2012) used X-ray CT to monitor the formation
of air-filled gaps between soil and roots of lupins. They found that gap occurred mainly
around the taproot. As we showed that the taproot is not so important for water uptake, gaps
seem not to represent a limit for water uptake. Such rhizosphere dynamics and gaps
formation are reversible and their role on plant adaptation to drought needs further
investigation.
Some assumptions of the model of D2O transport in soil and root need to be further
investigated, with consequent improvement of the model. We assumed that after D2O
injection, D2O rapidly moved by diffusion and convection in the apoplast of the root cortex.
With this assumption, our model can be explicitely derived and the parameters have a
physical meaning. Diffusion time of D2O in the apoplast of the cortex is given by t = l2/(2D),
where l is the diffusional length and D is the diffusion coefficient of D2O in H2O through the
apoplast of the cortex. The diffusional length is given by the thickness of the cortex,
l=1.5×10⁻⁴ m. The diffusion coefficient of D2O in pure water is D=2.27×10⁻⁹ m2 s−1
(Longsworth, 1960). This value would give a diffusional time t=5 s, which is consistent with
our hypothesis. However, the diffusion of D2O is slower in the apoplast than in pure water.
Richter & Ehwald, (1983) observed that diffusivity of sucrose (molecular weight of 342 gr
mol-1) in extracellular space of sugar beet was 5-10 times lower than in water. Aikman et
al., (1980) reported a decrease of 10 times for Rb+ diffusion. The diffusivity of charged and
large molecules is expected to be reduced more significantly than that of a neutral and low

Chapter 3 83
molecular weight molecule like D2O (Aikman et al., 1980; Richter & Ehwald, 1983;
Fleischer & Ehwald, 1995; Fritz & Ehwald, 2011). A reduction of 10 times in D seems
therefore a safe assumption and would give a diffusional time of 50 seconds. This value is
still smaller than the half time measured at nighttime, which was around 300 seconds
(Zarebanadkouki et al., 2012). A second assumption that needs further investigation is
whether or not diffusional permeability of cortical cells and endodermis is constant during
daytime and nighttime. It is known that aquaporin activity is function of transpiration and
therefore it would affect the diffusional permeabilities (Maurel et al., 2008). Bramley et al.
(2009) showed that the radial flow of water in Lupine roots occurred primarily through the
apoplast, with a negligible involvement of aquaporins, while in wheat the water flow mainly
occurred in the cell-to-cell. Our assumption of constant diffusional permeability of the
endodermis during daytime and nighttime may therefore be justified for Lupine roots, but it
should be improved before application to other plant species. Future improvements of the
model should include: the diffusion of D2O though the apoplast of the cortex, which is now
assumed to be instantaneous, and a variable Pd during daytime and nighttime. Further
experiments with plant species that are known to have a dominant cell-to-cell pathway would
be greatly beneficial to test the model.
Appendix A: Derivation of the model of D2O transport into roots
We assume that when roots are immersed in D2O, the apoplastic free space of the root cortex
rapidly saturates with D2O diffusion. This results in an identical D2O concentration in the
apoplast of the root cortex to that of the soil at the root surface, C0. The reflection coefficient
of membrane to D2O transport is assumed to be zero (Henzler & Steudle 1995). During night,
under these assumptions, the total flow of D2O into the cortical cells, 𝐽𝑟,𝑐𝑛 [m3 s-1], is
described by a diffusion equation as
, , 02 ( )n
r c c D c cJ r LP C C (AP.1)
where rc [m] is radius of the cortical cells, L [m] is the length of the root immersed in D2O,
PD,c [m s-1] is diffusional permeability of the cortical cell and Cc [-] is the D2O concentration
inside the cortical cell. From mass conservation it follows that
2
, 02 ( )cc c D c c
Cr L r LP C C
t
(AP.2)
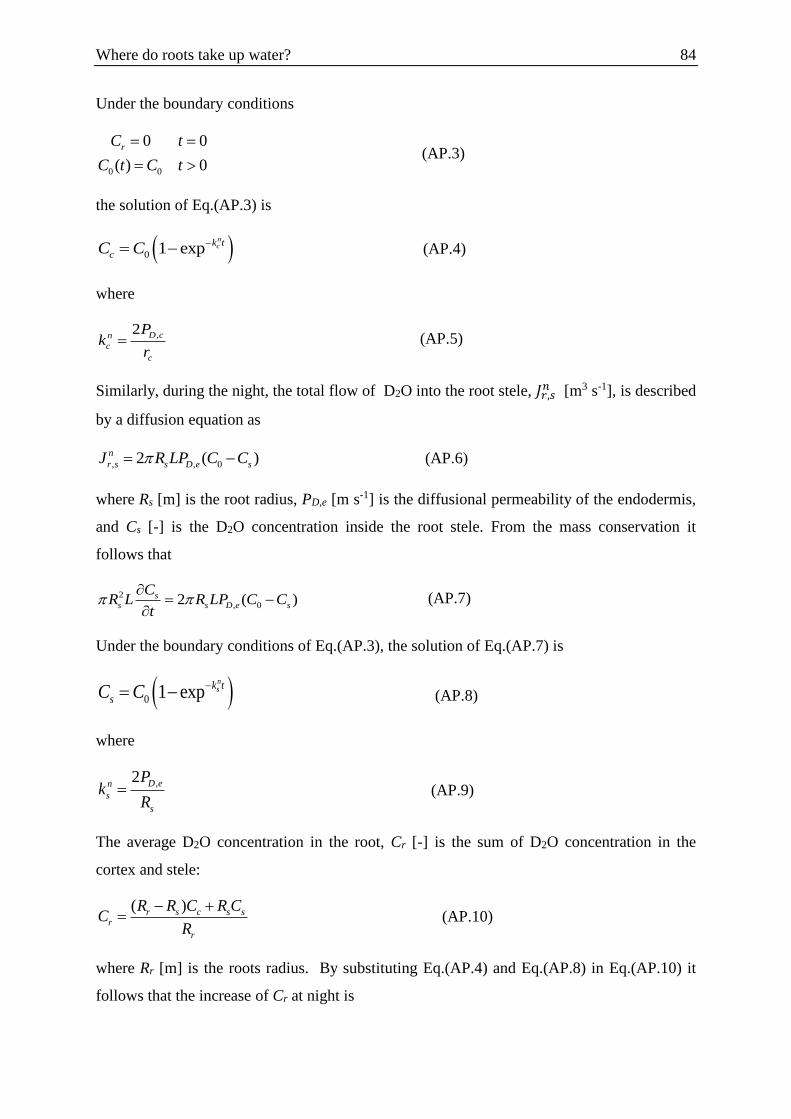
Where do roots take up water? 84
Under the boundary conditions
0 0
0 0
( ) 0
rC t
C t C t
(AP.3)
the solution of Eq.(AP.3) is
0 1 expnck t
cC C
(AP.4)
where
,2 D cn
c
c
Pk
r (AP.5)
Similarly, during the night, the total flow of D2O into the root stele, 𝐽𝑟,𝑠𝑛 [m3 s-1], is described
by a diffusion equation as
, , 02 ( )n
r s s D e sJ R LP C C (AP.6)
where Rs [m] is the root radius, PD,e [m s-1] is the diffusional permeability of the endodermis,
and Cs [-] is the D2O concentration inside the root stele. From the mass conservation it
follows that
2
, 02 ( )ss s D e s
CR L R LP C C
t
(AP.7)
Under the boundary conditions of Eq.(AP.3), the solution of Eq.(AP.7) is
0 1 expnsk t
sC C
(AP.8)
where
,2 D en
s
s
Pk
R (AP.9)
The average D2O concentration in the root, Cr [-] is the sum of D2O concentration in the
cortex and stele:
( )r s c s sr
r
R R C R CC
R
(AP.10)
where Rr [m] is the roots radius. By substituting Eq.(AP.4) and Eq.(AP.8) in Eq.(AP.10) it
follows that the increase of Cr at night is
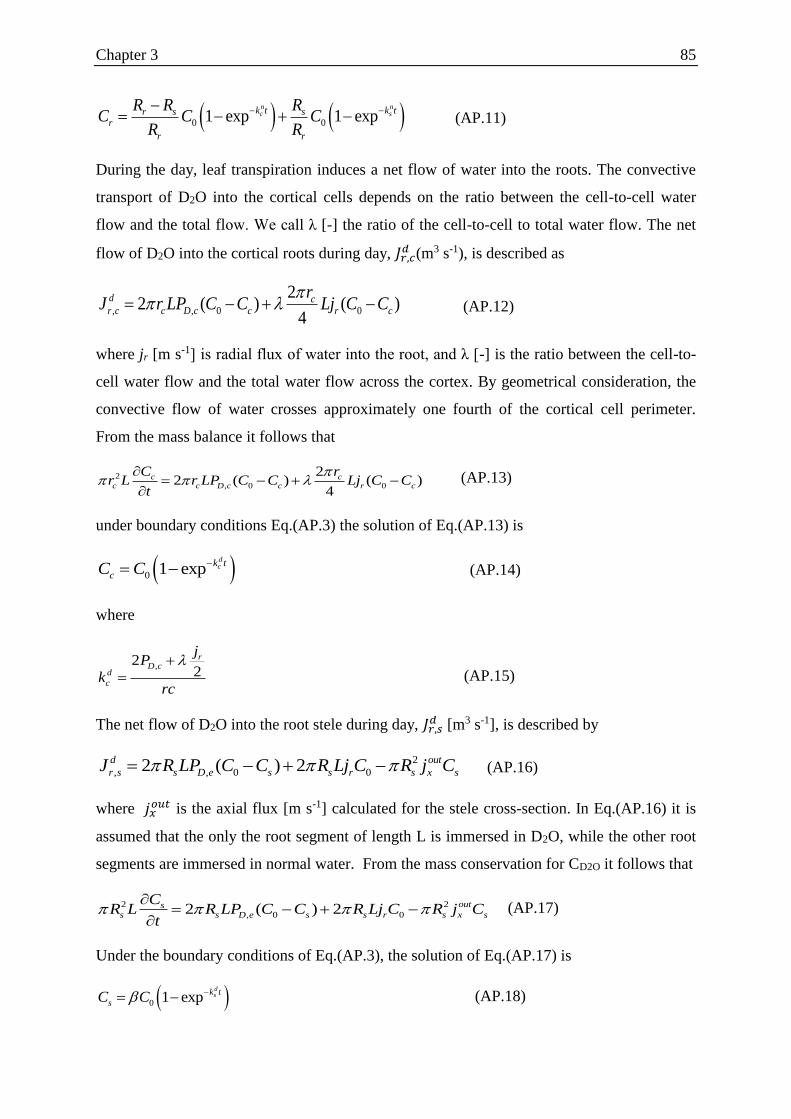
Chapter 3 85
0 01 exp 1 expn nc sk t k tr s s
r
r r
R R RC C C
R R
(AP.11)
During the day, leaf transpiration induces a net flow of water into the roots. The convective
transport of D2O into the cortical cells depends on the ratio between the cell-to-cell water
flow and the total flow. We call λ [-] the ratio of the cell-to-cell to total water flow. The net
flow of D2O into the cortical roots during day, 𝐽𝑟,𝑐𝑑 (m3 s-1), is described as
, , 0 0
22 ( ) ( )
4
d cr c c D c c r c
rJ r LP C C Lj C C
(AP.12)
where jr [m s-1] is radial flux of water into the root, and λ [-] is the ratio between the cell-to-
cell water flow and the total water flow across the cortex. By geometrical consideration, the
convective flow of water crosses approximately one fourth of the cortical cell perimeter.
From the mass balance it follows that
2
, 0 0
22 ( ) ( )
4
c cc c D c c r c
C rr L r LP C C Lj C C
t
(AP.13)
under boundary conditions Eq.(AP.3) the solution of Eq.(AP.13) is
0 1 expdck t
cC C
(AP.14)
where
,22
rD c
d
c
jP
krc
(AP.15)
The net flow of D2O into the root stele during day, 𝐽𝑟,𝑠𝑑 [m3 s-1], is described by
2
, , 0 02 ( ) 2d out
r s s D e s s r s x sJ R LP C C R Lj C R j C (AP.16)
where 𝑗𝑥𝑜𝑢𝑡 is the axial flux [m s-1] calculated for the stele cross-section. In Eq.(AP.16) it is
assumed that the only the root segment of length L is immersed in D2O, while the other root
segments are immersed in normal water. From the mass conservation for CD2O it follows that
2 2
, 0 02 ( ) 2 outss s D e s s r s x s
CR L R LP C C R Lj C R j C
t
(AP.17)
Under the boundary conditions of Eq.(AP.3), the solution of Eq.(AP.17) is
0 1 expdsk t
sC C (AP.18)

Where do roots take up water? 86
where
,
,
,
2
2 2
2
outD ed x
s
s
D e r
s
outD e x
s
P jk
R L
P j
R
P j
R L
(AP.19)
By substituting Eq.(AP.14 and AP.18) in Eq.(AP.10) it follows that the increase of Cr at the
day
0 01 exp 1 expd dc sk t k tr s s
r
r r
R R RC C C
R R
(AP.20)
Appendix B: D2O concentration in the roots: experimental results and best fits with
single and double exponential curves
Figure 7: Measured D2O concentration inside the roots and the best-fit lines using a single and double
exponential equation. The experimental points are obtained from D2O injection at nighttime and are
averaged along a lateral root segment that was 9-12 cm distant from the root tip.
Chapter 3 87
References
Aikman, D.P., Harmer, R., & Rust, T.S.O. 1980. Electrical resistance and ion movement
through excised discs of sugar beet root tissue. Physiol. Plant. 48, 395–402.
Bramley, H., Turner, N.C., Turner, D.W., & Tyerman, S.D. 2009. Roles of morphology,
anatomy, and aquaporins in determining contrasting hydraulic behavior of roots. Plant
Physiol. 150, 348–364.
Carminati, A. 2012. A Model of Root Water Uptake Coupled with Rhizosphere Dynamics.
Vadose Zone J.
Carminati, A., Moradi, A.B., Vetterlein, D., Vontobel, P., Lehmann, E., Weller, U., Vogel,
H.-J., & Oswald, S.E. 2010. Dynamics of soil water content in the rhizosphere. Plant
Soil 332, 163–176.
Carminati, A., Vetterlein, D., Koebernick, N., Blaser, S., Weller, U., & Vogel, H.-J. 2012. Do
roots mind the gap? Plant Soil doi:10.1007/s11104-012-1496-
Da-Ines, O., Graf, W., Franck, K.I., Albert, A., Winkler, J.B., Scherb, H., Stichler, W., &
Schäffner, A.R. 2010. Kinetic analyses of plant water relocation using deuterium as
tracer–reduced water flux of Arabidopsis pip2 aquaporin knockout mutants. Plant
Biology 12, 129–139.
Doussan, C., Pierret, A., Garrigues, E., & Pagès, L. 2006. Water Uptake by Plant Roots: II –
Modelling of Water Transfer in the Soil Root-system with Explicit Account of Flow
within the Root System – Comparison with Experiments. Plant Soil 283, 99–117.
Doussan, C., Page, L.., Vercambre, G. 1998. Modelling of the Hydraulic Architecture of Root
Systems: An Integrated Approach to Water AbsorptionÐModel Description. Annal. Bot.
Vol(81): 213-223
Draye, X., Kim, Y., Lobet, G., & Javaux, M. 2010. Model-assisted integration of
physiological and environmental constraints affecting the dynamic and spatial
patterns of root water uptake from soils. J. Exp. Bot. 61, 2145–2155.

Where do roots take up water? 88
Enstone, D.E., Peterson, C.A., & Ma, F. 2003. Root Endodermis and Exodermis: Structure,
Function, and Responses to the Environment. J. Plant Growth Regul. 21, 335–351.
Fleischer, A., & Ehwald, R. 1995. The free space of sugars in plant tissues6. J. Exp. Bot. 46,
647–654.
Frensch, J., & Steudle, E. 1989. Axial and radial hydraulic resistance to roots of maize (Zea
mays L.). Plant Physiol. 91, 719–726.
Frensch, J., T.C. Hsiao, and E. Steudle. 1996. Water and solute transport along developing
maize roots. Planta. 198:348–355. doi:10.1007/BF0062005
Fritz, M., & Ehwald, R. 2011. Mannitol permeation and radial flow of water in maize roots.
New Phytol. 189, 210–217.
Garrigues, E., Doussan, C., & Pierret, A. 2006. Water Uptake by Plant Roots: I – Formation
and Propagation of a Water Extraction Front in Mature Root Systems as Evidenced by
2D Light Transmission Imaging. Plant Soil 283, 83–98.
Henzler, T., and E. Steudle. 1995. Reversible closing of water channels in Chara internodes
provides evidence for a composite transport model of the plasma membrane. J. Exp. Bot.
46:199–209.
Hsiao TC, Xu LK (2000) Sensitivity of growth of roots versus leaves to water stress:
biophysical analysis and relation to water transport. J Exp. Bot, 51: 1595–1616
Huang, B., & Nobel, P.S. 1993. Hydraulic conductivity and anatomy along lateral roots of
cacti: changes with soil water status. New Phytol. 123, 499–507.
Javaux, M., Schröder, T., Vanderborght, J., & Vereecken, H. 2008. Use of a three-
dimensional detailed modeling approach for predicting root water uptake. Vadose
Zone J. 7, 1079–1088.
Knipfer, T., & Fricke, W. 2010. Water uptake by seminal and adventitious roots in relation to
whole-plant water flow in barley (Hordeum vulgare L.). J. Exp. Bot. 62, 717–733.
Landsberg, J.J., & Fowkes, N.D. 1978. Water movement through plant roots. Ann. Bot-
London 42, 493–508.
Chapter 3 89
Longsworth, L. 1960. The mutual diffusion of light and heavy water. J. Phys.Chem. 64:1914–
1917.
Matsushima, U., Kardjilov, N., Hilger, A., Graf, W., & Herppich, W.B. 2008. Application
potential of cold neutron radiography in plant science research. J. Appl. Bot. Food
Qual. 82, 90–98.
Maurel, C., Verdoucq, L., Luu, D.-T., & Santoni, V. 2008. Plant aquaporins: membrane
channels with multiple integrated functions. Annu. Rev. Plant Biol. 59, 595–624.
McCully, M. 1995. How Do Real Roots Work?(Some New Views of Root Structure). Plant
Physiol. 109, 1–6.
McCully, M.E., & Canny, M.J. 1988. Pathways and processes of water and nutrient
movement in roots. Plant Soil 111, 159–170.
Menon, M., Robinson, B., Oswald, S.E., Kaestner, A., Abbaspour, K.C., Lehmann, E., &
Schulin, R. 2007. Visualization of root growth in heterogeneously contaminated soil
using neutron radiography. Eur. J. Soil. Sci. 58, 802–810.
Moradi, A.B., Carminati, A., Vetterlein, D., Vontobel, P., Lehmann, E., Weller, U.,
Hopmans, J.W., Vogel, H.-J., & Oswald, S.E. 2011. Three-dimensional visualization
and quantification of water content in the rhizosphere. New Phytol. 192, 653–663.
Moradi, A.B., Conesa, H.M., Robinson, B., Lehmann, E., Kuehne, G., Kaestner, A., Oswald,
S., & Schulin, R. 2008. Neutron radiography as a tool for revealing root development
in soil: capabilities and limitations. Plant Soil 318, 243–255.
Ordin, L., & Kramer, P.J. 1956. Permeability of Vicia Faba Root Segments to Water as
Measured by Diffusion of Deuterium Hydroxide. Plant Physiol. 31, 468–471.
Oswald, S.E., Menon, M., Carminati, A., Vontobel, P., Lehmann, E., & Schulin, R. 2008.
Quantitative imaging of infiltration, root growth, and root water uptake via neutron
radiography. Vadose Zone J. 7, 1035–1047.
Pierret, A., Kirby, M., & Moran, C. 2003. Simultaneous X-ray imaging of plant root growth
and water uptake in thin-slab systems. Plant Soil 255, 361–373.
Where do roots take up water? 90
Pohlmeier, A., Oros-Peusquens, A., Javaux, M., Menzel, M.I., Vanderborght, J., Kaffanke, J.,
Romanzetti, S., Lindenmair, J., Vereecken, H., & Shah, N.J. 2008. Changes in soil
water content resulting from Ricinus root uptake monitored by magnetic resonance
imaging. Vadose Zone J. 7, 1010–1017.
Richter, E., & Ehwald, R. 1983. Apoplastic mobility of sucrose in storage parenchyma of
sugar beet. Physiologia Plantarum 58, 263–268.
Sanderson, J. 1983. Water uptake by different regions of the barley root. Pathways of radial
flow in relation to development of the endodermis. J. Exp. Bot. 34, 240–253.
Steudle, E., & Peterson, C.A. 1998. How does water get through roots? J. Exp. Bot. 49, 775–
788.
Tumlinson, L.G., Liu, H., Silk, W.K., & Hopmans, J.W. 2007. Thermal Neutron Computed
Tomography of Soil Water and Plant Roots. Soil Sci. Soc. Am. J. 72, 1234–1242.
Chapter 4 91
Reduced root water uptake after drying and rewetting
Mohsen Zarebanadkouki and Andrea Carminati
Published in J. Plant Nutr. Soil Sci. (2013)
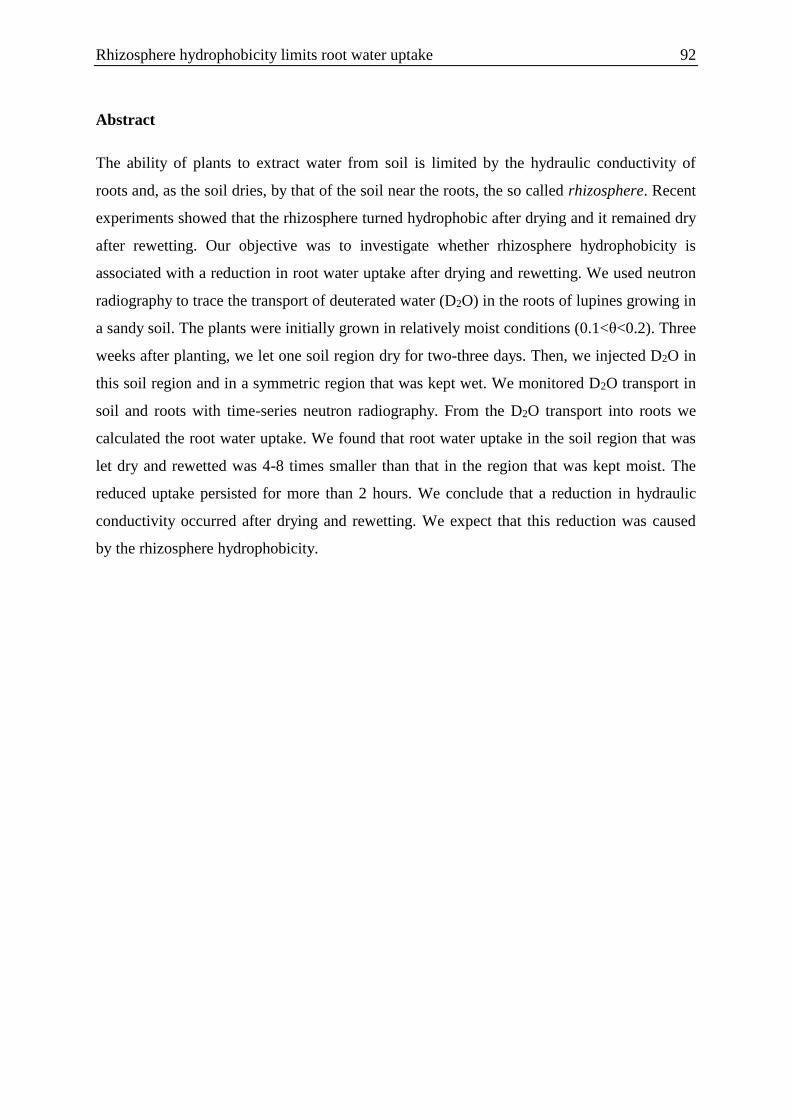
Rhizosphere hydrophobicity limits root water uptake 92
Abstract
The ability of plants to extract water from soil is limited by the hydraulic conductivity of
roots and, as the soil dries, by that of the soil near the roots, the so called rhizosphere. Recent
experiments showed that the rhizosphere turned hydrophobic after drying and it remained dry
after rewetting. Our objective was to investigate whether rhizosphere hydrophobicity is
associated with a reduction in root water uptake after drying and rewetting. We used neutron
radiography to trace the transport of deuterated water (D2O) in the roots of lupines growing in
a sandy soil. The plants were initially grown in relatively moist conditions (0.1<θ<0.2). Three
weeks after planting, we let one soil region dry for two-three days. Then, we injected D2O in
this soil region and in a symmetric region that was kept wet. We monitored D2O transport in
soil and roots with time-series neutron radiography. From the D2O transport into roots we
calculated the root water uptake. We found that root water uptake in the soil region that was
let dry and rewetted was 4-8 times smaller than that in the region that was kept moist. The
reduced uptake persisted for more than 2 hours. We conclude that a reduction in hydraulic
conductivity occurred after drying and rewetting. We expect that this reduction was caused
by the rhizosphere hydrophobicity.
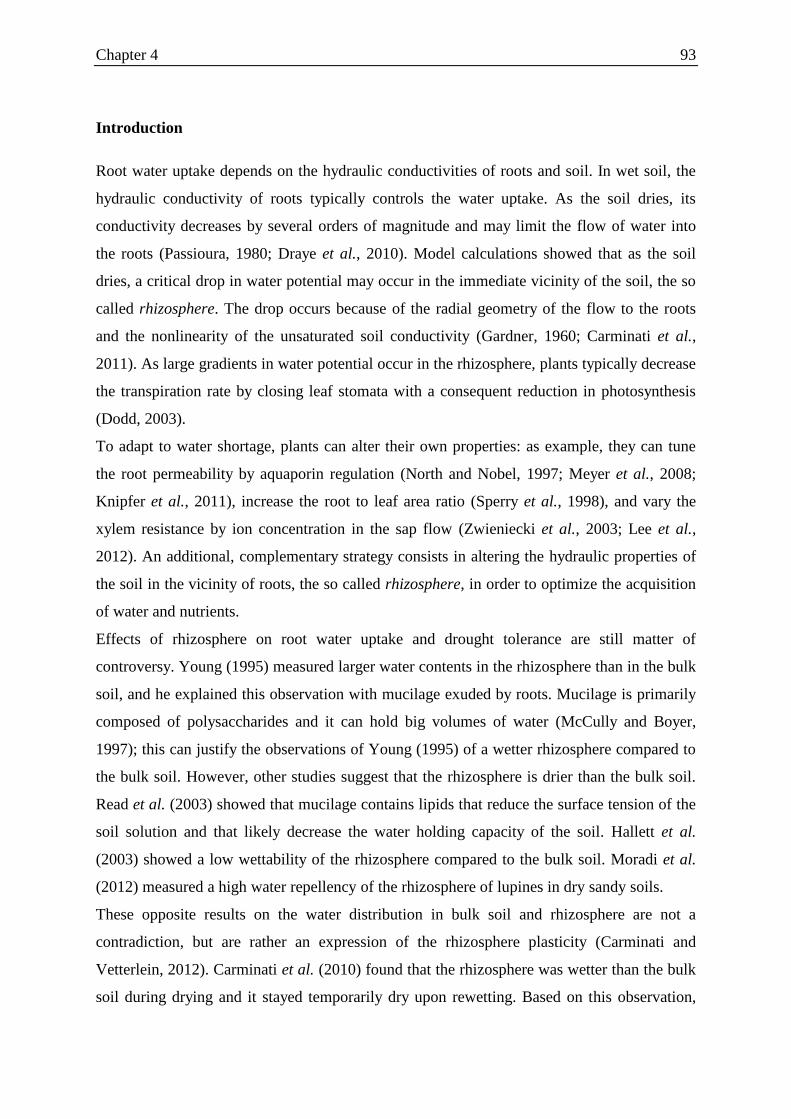
Chapter 4 93
Introduction
Root water uptake depends on the hydraulic conductivities of roots and soil. In wet soil, the
hydraulic conductivity of roots typically controls the water uptake. As the soil dries, its
conductivity decreases by several orders of magnitude and may limit the flow of water into
the roots (Passioura, 1980; Draye et al., 2010). Model calculations showed that as the soil
dries, a critical drop in water potential may occur in the immediate vicinity of the soil, the so
called rhizosphere. The drop occurs because of the radial geometry of the flow to the roots
and the nonlinearity of the unsaturated soil conductivity (Gardner, 1960; Carminati et al.,
2011). As large gradients in water potential occur in the rhizosphere, plants typically decrease
the transpiration rate by closing leaf stomata with a consequent reduction in photosynthesis
(Dodd, 2003).
To adapt to water shortage, plants can alter their own properties: as example, they can tune
the root permeability by aquaporin regulation (North and Nobel, 1997; Meyer et al., 2008;
Knipfer et al., 2011), increase the root to leaf area ratio (Sperry et al., 1998), and vary the
xylem resistance by ion concentration in the sap flow (Zwieniecki et al., 2003; Lee et al.,
2012). An additional, complementary strategy consists in altering the hydraulic properties of
the soil in the vicinity of roots, the so called rhizosphere, in order to optimize the acquisition
of water and nutrients.
Effects of rhizosphere on root water uptake and drought tolerance are still matter of
controversy. Young (1995) measured larger water contents in the rhizosphere than in the bulk
soil, and he explained this observation with mucilage exuded by roots. Mucilage is primarily
composed of polysaccharides and it can hold big volumes of water (McCully and Boyer,
1997); this can justify the observations of Young (1995) of a wetter rhizosphere compared to
the bulk soil. However, other studies suggest that the rhizosphere is drier than the bulk soil.
Read et al. (2003) showed that mucilage contains lipids that reduce the surface tension of the
soil solution and that likely decrease the water holding capacity of the soil. Hallett et al.
(2003) showed a low wettability of the rhizosphere compared to the bulk soil. Moradi et al.
(2012) measured a high water repellency of the rhizosphere of lupines in dry sandy soils.
These opposite results on the water distribution in bulk soil and rhizosphere are not a
contradiction, but are rather an expression of the rhizosphere plasticity (Carminati and
Vetterlein, 2012). Carminati et al. (2010) found that the rhizosphere was wetter than the bulk
soil during drying and it stayed temporarily dry upon rewetting. Based on this observation,
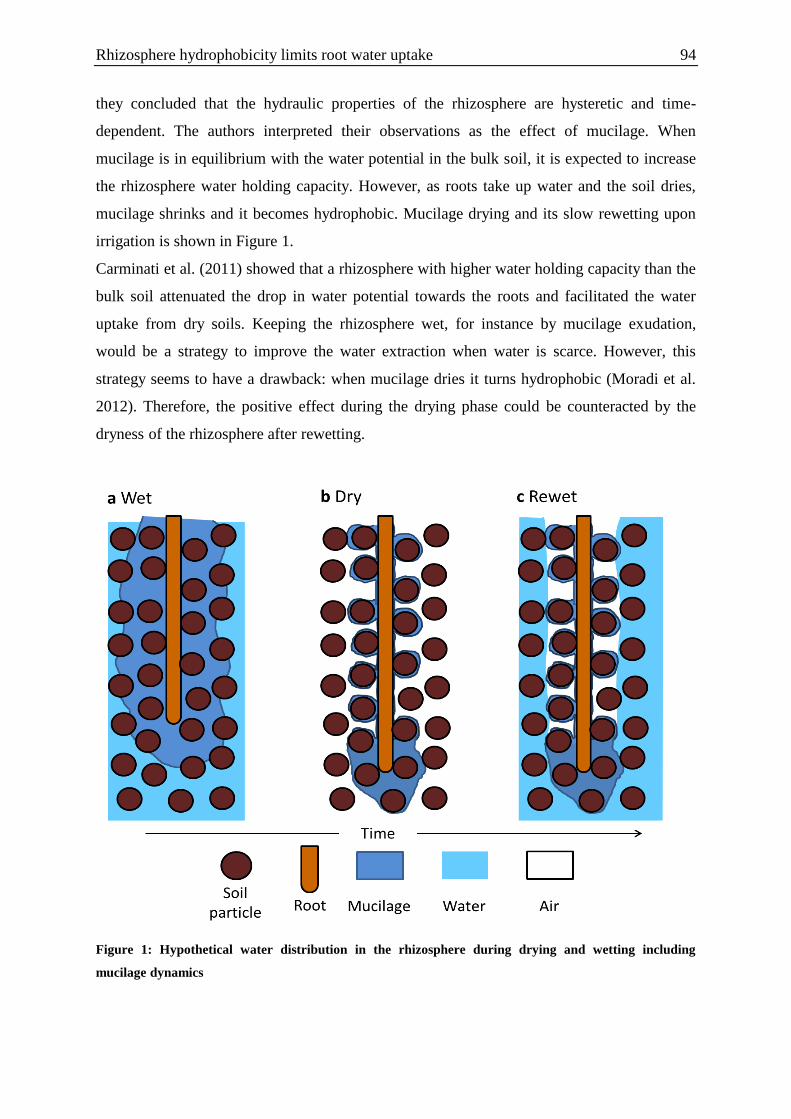
Rhizosphere hydrophobicity limits root water uptake 94
they concluded that the hydraulic properties of the rhizosphere are hysteretic and time-
dependent. The authors interpreted their observations as the effect of mucilage. When
mucilage is in equilibrium with the water potential in the bulk soil, it is expected to increase
the rhizosphere water holding capacity. However, as roots take up water and the soil dries,
mucilage shrinks and it becomes hydrophobic. Mucilage drying and its slow rewetting upon
irrigation is shown in Figure 1.
Carminati et al. (2011) showed that a rhizosphere with higher water holding capacity than the
bulk soil attenuated the drop in water potential towards the roots and facilitated the water
uptake from dry soils. Keeping the rhizosphere wet, for instance by mucilage exudation,
would be a strategy to improve the water extraction when water is scarce. However, this
strategy seems to have a drawback: when mucilage dries it turns hydrophobic (Moradi et al.
2012). Therefore, the positive effect during the drying phase could be counteracted by the
dryness of the rhizosphere after rewetting.
Figure 1: Hypothetical water distribution in the rhizosphere during drying and wetting including
mucilage dynamics
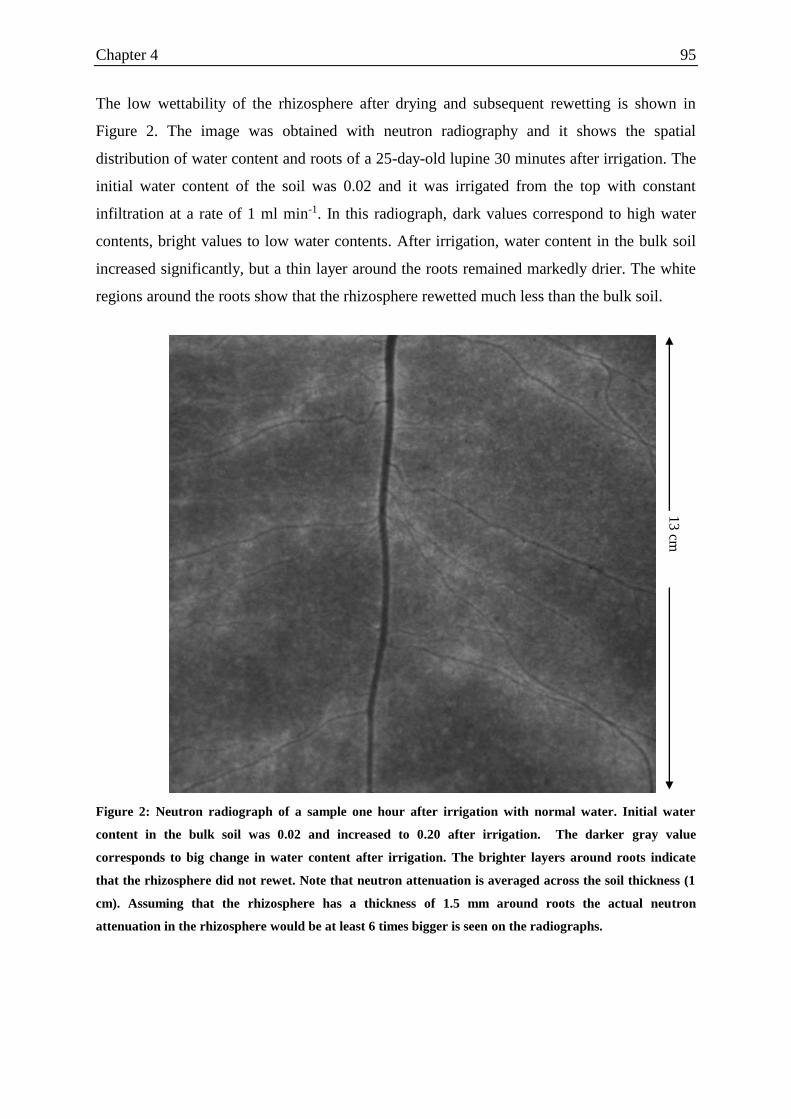
Chapter 4 95
The low wettability of the rhizosphere after drying and subsequent rewetting is shown in
Figure 2. The image was obtained with neutron radiography and it shows the spatial
distribution of water content and roots of a 25-day-old lupine 30 minutes after irrigation. The
initial water content of the soil was 0.02 and it was irrigated from the top with constant
infiltration at a rate of 1 ml min-1. In this radiograph, dark values correspond to high water
contents, bright values to low water contents. After irrigation, water content in the bulk soil
increased significantly, but a thin layer around the roots remained markedly drier. The white
regions around the roots show that the rhizosphere rewetted much less than the bulk soil.
Figure 2: Neutron radiograph of a sample one hour after irrigation with normal water. Initial water
content in the bulk soil was 0.02 and increased to 0.20 after irrigation. The darker gray value
corresponds to big change in water content after irrigation. The brighter layers around roots indicate
that the rhizosphere did not rewet. Note that neutron attenuation is averaged across the soil thickness (1
cm). Assuming that the rhizosphere has a thickness of 1.5 mm around roots the actual neutron
attenuation in the rhizosphere would be at least 6 times bigger is seen on the radiographs.
13 cm
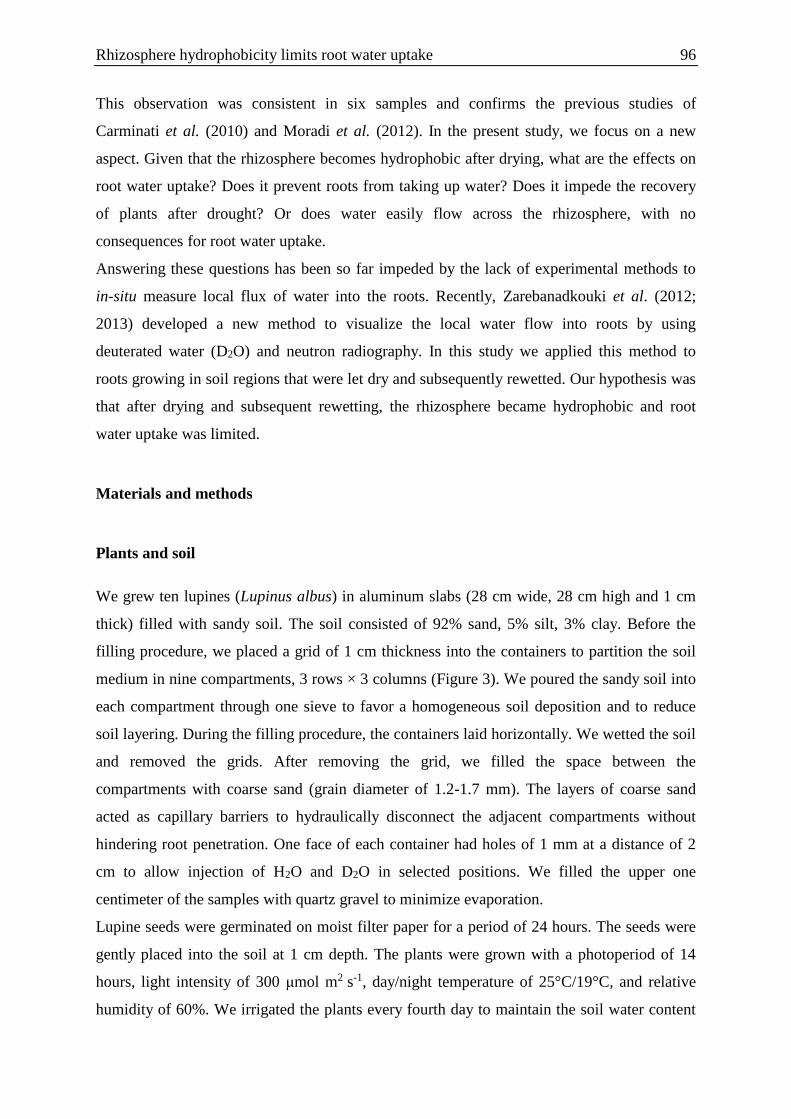
Rhizosphere hydrophobicity limits root water uptake 96
This observation was consistent in six samples and confirms the previous studies of
Carminati et al. (2010) and Moradi et al. (2012). In the present study, we focus on a new
aspect. Given that the rhizosphere becomes hydrophobic after drying, what are the effects on
root water uptake? Does it prevent roots from taking up water? Does it impede the recovery
of plants after drought? Or does water easily flow across the rhizosphere, with no
consequences for root water uptake.
Answering these questions has been so far impeded by the lack of experimental methods to
in-situ measure local flux of water into the roots. Recently, Zarebanadkouki et al. (2012;
2013) developed a new method to visualize the local water flow into roots by using
deuterated water (D2O) and neutron radiography. In this study we applied this method to
roots growing in soil regions that were let dry and subsequently rewetted. Our hypothesis was
that after drying and subsequent rewetting, the rhizosphere became hydrophobic and root
water uptake was limited.
Materials and methods
Plants and soil
We grew ten lupines (Lupinus albus) in aluminum slabs (28 cm wide, 28 cm high and 1 cm
thick) filled with sandy soil. The soil consisted of 92% sand, 5% silt, 3% clay. Before the
filling procedure, we placed a grid of 1 cm thickness into the containers to partition the soil
medium in nine compartments, 3 rows × 3 columns (Figure 3). We poured the sandy soil into
each compartment through one sieve to favor a homogeneous soil deposition and to reduce
soil layering. During the filling procedure, the containers laid horizontally. We wetted the soil
and removed the grids. After removing the grid, we filled the space between the
compartments with coarse sand (grain diameter of 1.2-1.7 mm). The layers of coarse sand
acted as capillary barriers to hydraulically disconnect the adjacent compartments without
hindering root penetration. One face of each container had holes of 1 mm at a distance of 2
cm to allow injection of H2O and D2O in selected positions. We filled the upper one
centimeter of the samples with quartz gravel to minimize evaporation.
Lupine seeds were germinated on moist filter paper for a period of 24 hours. The seeds were
gently placed into the soil at 1 cm depth. The plants were grown with a photoperiod of 14
hours, light intensity of 300 μmol m2 s-1, day/night temperature of 25°C/19°C, and relative
humidity of 60%. We irrigated the plants every fourth day to maintain the soil water content
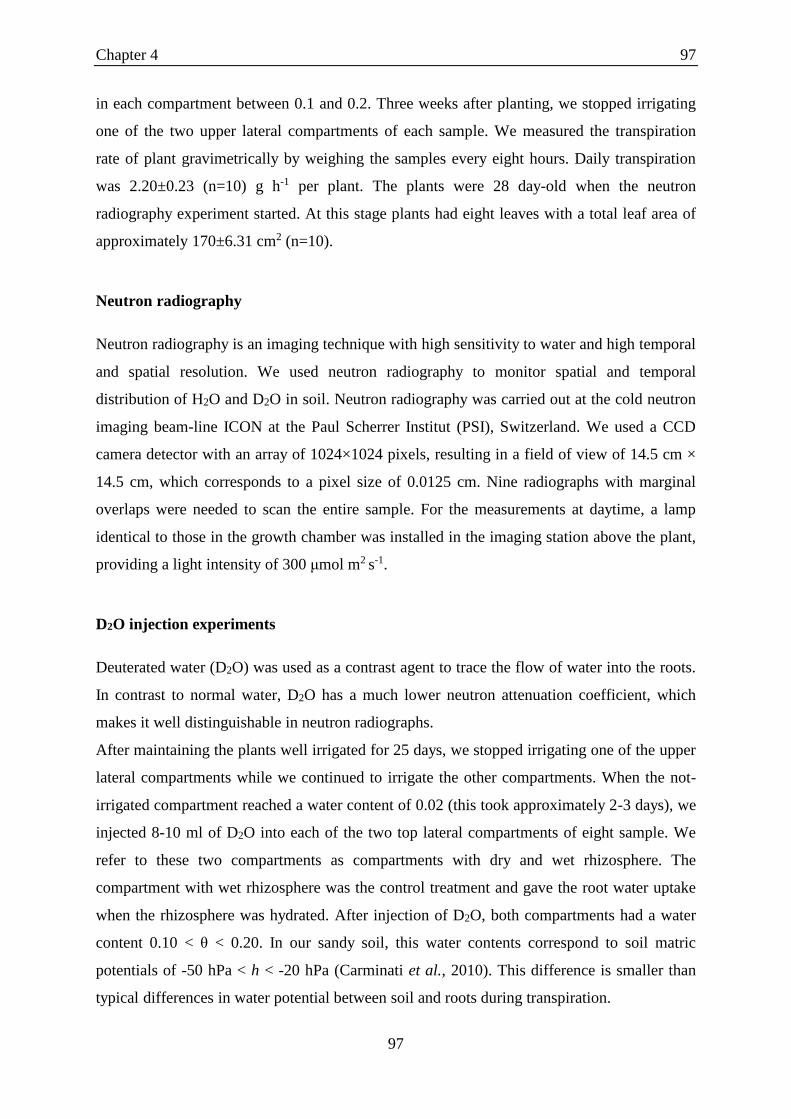
Chapter 4 97
97
in each compartment between 0.1 and 0.2. Three weeks after planting, we stopped irrigating
one of the two upper lateral compartments of each sample. We measured the transpiration
rate of plant gravimetrically by weighing the samples every eight hours. Daily transpiration
was 2.20±0.23 (n=10) g h-1 per plant. The plants were 28 day-old when the neutron
radiography experiment started. At this stage plants had eight leaves with a total leaf area of
approximately 170±6.31 cm2 (n=10).
Neutron radiography
Neutron radiography is an imaging technique with high sensitivity to water and high temporal
and spatial resolution. We used neutron radiography to monitor spatial and temporal
distribution of H2O and D2O in soil. Neutron radiography was carried out at the cold neutron
imaging beam-line ICON at the Paul Scherrer Institut (PSI), Switzerland. We used a CCD
camera detector with an array of 1024×1024 pixels, resulting in a field of view of 14.5 cm ×
14.5 cm, which corresponds to a pixel size of 0.0125 cm. Nine radiographs with marginal
overlaps were needed to scan the entire sample. For the measurements at daytime, a lamp
identical to those in the growth chamber was installed in the imaging station above the plant,
providing a light intensity of 300 μmol m2 s-1.
D2O injection experiments
Deuterated water (D2O) was used as a contrast agent to trace the flow of water into the roots.
In contrast to normal water, D2O has a much lower neutron attenuation coefficient, which
makes it well distinguishable in neutron radiographs.
After maintaining the plants well irrigated for 25 days, we stopped irrigating one of the upper
lateral compartments while we continued to irrigate the other compartments. When the not-
irrigated compartment reached a water content of 0.02 (this took approximately 2-3 days), we
injected 8-10 ml of D2O into each of the two top lateral compartments of eight sample. We
refer to these two compartments as compartments with dry and wet rhizosphere. The
compartment with wet rhizosphere was the control treatment and gave the root water uptake
when the rhizosphere was hydrated. After injection of D2O, both compartments had a water
content 0.10 < θ < 0.20. In our sandy soil, this water contents correspond to soil matric
potentials of -50 hPa < h < -20 hPa (Carminati et al., 2010). This difference is smaller than
typical differences in water potential between soil and roots during transpiration.
Rhizosphere hydrophobicity limits root water uptake 98
The water potential in the roots of the two compartments was expected to be similar because
all roots were connected to the same tap root. Therefore, the difference in water fluxes into
the roots of the two compartments mostly depended on the hydraulic conductivity of the
rhizosphere-root continuum.
Redistribution of D2O in soil and roots was monitored with time series neutron radiography
with time interval of 10 seconds for a period of three hours. In four samples, D2O was
injected at daytime, when a lamp identical to that of the growth chamber was mounted inside
the imaging station. Transpiration was measured gravimetrically by weighing the samples
before and after measurements. In other four samples, D2O was injected at nighttime when
transpiration was negligible. The experiments at nighttime were made to determine the effect
of convection (net water transport) and diffusion on the D2O transport along roots (axial
transport) and from soil to roots (radial transport).
Image processing
The individual radiographs were referenced using a flat field (radiography without sample)
and dark current (image recorded by the camera when there was no beam). The sharp contrast
between roots and surrounding soil facilitated the visual separation (segmentation) of the
roots from the surrounding soil. The segmented roots were skeletonized and their length and
diameter were calculated. In the pixels containing roots, the signal was the sum of the
attenuation coefficients of the root and the soil in front of and behind the root in the beam
direction. The actual contributions of H2O and D2O in the root were calculated assuming that
the contribution of H2O and D2O in soil in front of and behind the root was equal to those of
the soil at the sides of the roots. We calculated the pixel-wise D2O content in the centermost
pixels of the roots from the measured neutron attenuation coefficients in the radiographs. The
volumetric concentration of D2O in the roots was calculated as the thickness of D2O divided
by the total liquid thickness in roots. The image processing is described in details in
Zarebanadkouki et al. (2012).
Quantification of the water fluxes
Transport of D2O in roots is driven by two processes: 1) diffusion following the gradient of
D2O concentration, and 2) net volume of water driven by the transpiration stream
(convection). Zarebanadkouki et al. (2012) showed that diffusion and convection are equally
Chapter 4 99
99
important in the transport of D2O from soil to roots across the root-soil interface and root
tissue (radial transport). In contrast, D2O transport in the xylem along the root (axial
transport) is primarily driven by convection. Comparison of experiments at nighttime, when
convection is negligible, with experiments at daytime, when both convection and diffusion
take place, gives information on the convective fluxes and, consequently on root water
uptake.
Quantitative estimation of root water uptake by comparing daytime and nighttime
radiographs is not straightforward and requires a modeling approach. Crucial is how the
pathway of water across cortex, endodermis and stele, as well as the relative importance of
the apoplastic and cell-to-cell pathways, are modeled (Zarebanadkouki et al. 2013). The
results are therefore affected by the validity of the model and its assumptions.
Conversely, estimation of root water uptake from the axial transport in the roots does not
need a modeling approach. Since D2O diffusion along the xylem is negligible compared to
the convective transport, the volume of D2O passing the barrier, VD2O, is related to the axial
flux according to:
𝑑𝑉𝐷2𝑂
𝑑𝑡= 𝜋𝑟2𝑗𝑥𝐶(𝑡) (4.1)
where C [-] is the D2O concentration in the root stele at the place of the barrier, t is time, r is
the radius of the root stele and 𝑗𝑥 [cm s-1] is the axial flux of water across the stele at the place
of the barrier. Eq. (4.1) is valid until the D2O front reaches the taproot and then moves out
from the field of view. When concentration of D2O reaches a constant value, the slope of
𝑉𝐷2𝑂(𝑡) is a straight line and is used to calculate 𝑗𝑥. The relation between 𝑗𝑥 and the radial
flow into the root, 𝑗𝑟 [cm s-1] is given by:
𝜋𝑟2𝑗𝑥 = 2𝜋r𝐿𝑗𝑟 (4.2)
where L [cm] is the length of the root and jr is the flux into the endodermis averaged along L.
In this study, we used the axial transport of D2O to calculate the water uptake of the roots
immersed in D2O.
Results
Neutron radiography of one sample before injection of D2O is shown in Figure 3. The
radiograph is obtained from stitching nine radiographs with marginal overlaps. It shows the
distribution of water and roots. The gray values are proportional to the water contents
(darker=wetter). The two compartments selected for the D2O injection are marked with a
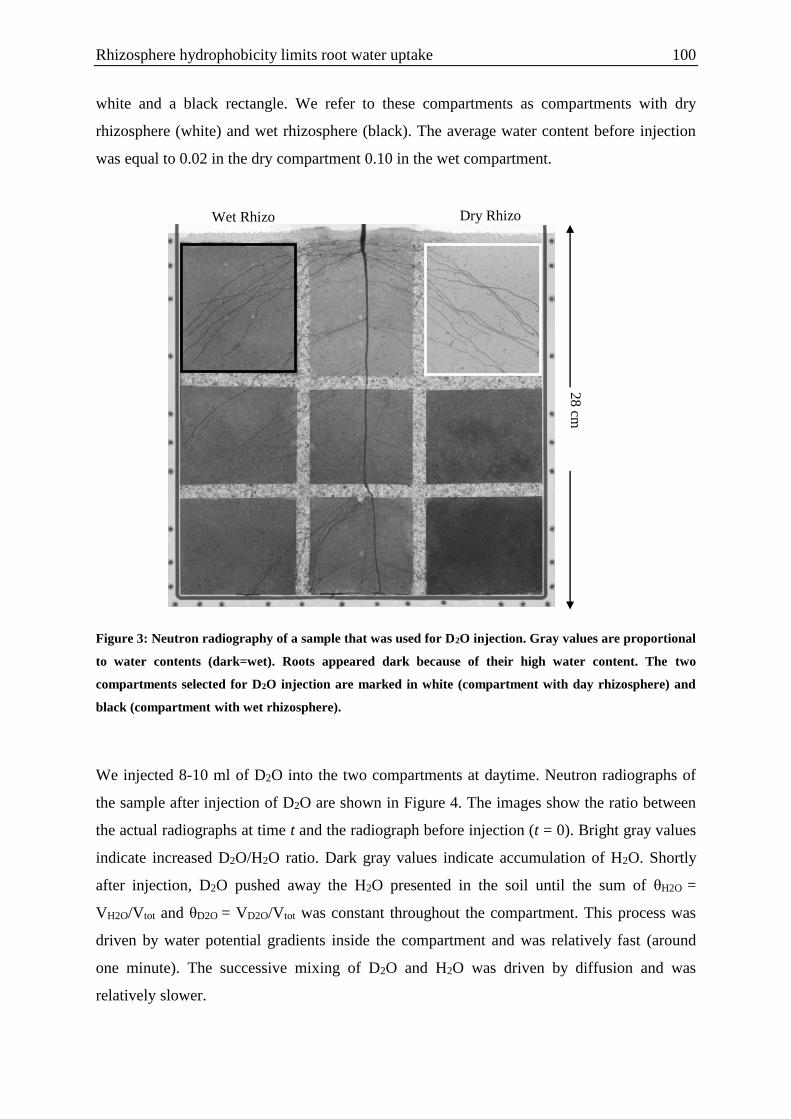
Rhizosphere hydrophobicity limits root water uptake 100
white and a black rectangle. We refer to these compartments as compartments with dry
rhizosphere (white) and wet rhizosphere (black). The average water content before injection
was equal to 0.02 in the dry compartment 0.10 in the wet compartment.
Figure 3: Neutron radiography of a sample that was used for D2O injection. Gray values are proportional
to water contents (dark=wet). Roots appeared dark because of their high water content. The two
compartments selected for D2O injection are marked in white (compartment with day rhizosphere) and
black (compartment with wet rhizosphere).
We injected 8-10 ml of D2O into the two compartments at daytime. Neutron radiographs of
the sample after injection of D2O are shown in Figure 4. The images show the ratio between
the actual radiographs at time t and the radiograph before injection (t = 0). Bright gray values
indicate increased D2O/H2O ratio. Dark gray values indicate accumulation of H2O. Shortly
after injection, D2O pushed away the H2O presented in the soil until the sum of θH2O =
VH2O/Vtot and θD2O = VD2O/Vtot was constant throughout the compartment. This process was
driven by water potential gradients inside the compartment and was relatively fast (around
one minute). The successive mixing of D2O and H2O was driven by diffusion and was
relatively slower.
Wet Rhizo Dry Rhizo 2
8 cm
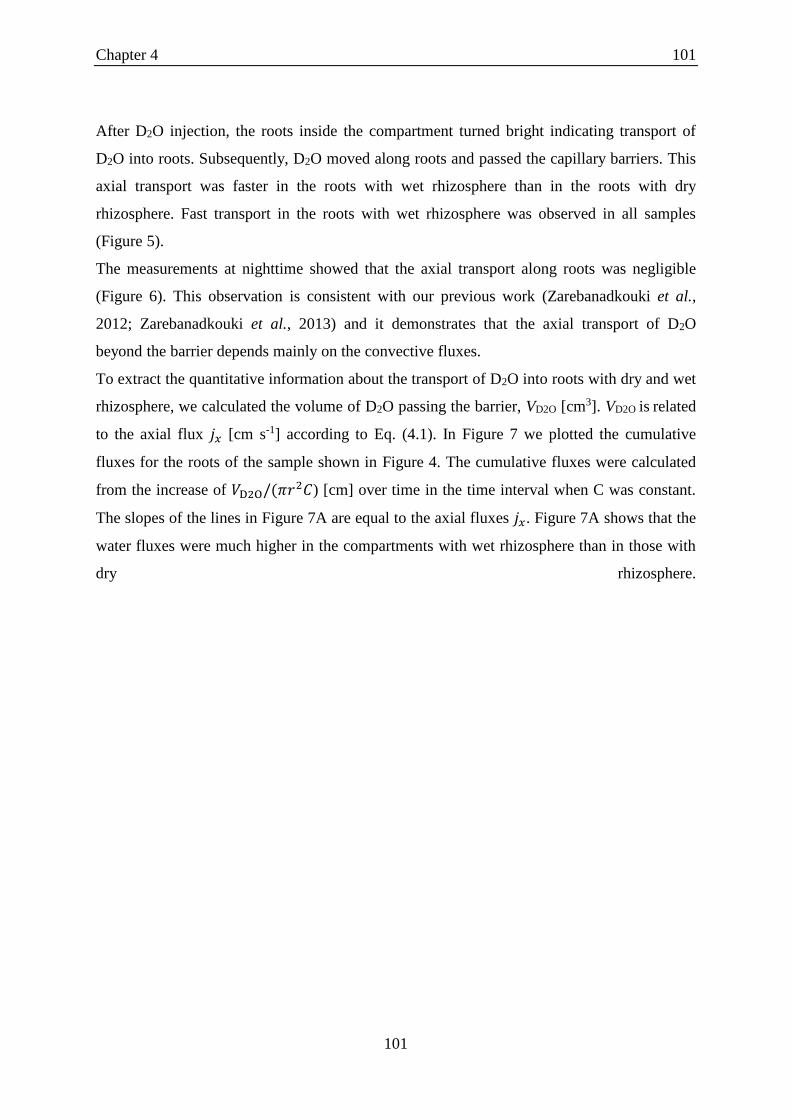
Chapter 4 101
101
After D2O injection, the roots inside the compartment turned bright indicating transport of
D2O into roots. Subsequently, D2O moved along roots and passed the capillary barriers. This
axial transport was faster in the roots with wet rhizosphere than in the roots with dry
rhizosphere. Fast transport in the roots with wet rhizosphere was observed in all samples
(Figure 5).
The measurements at nighttime showed that the axial transport along roots was negligible
(Figure 6). This observation is consistent with our previous work (Zarebanadkouki et al.,
2012; Zarebanadkouki et al., 2013) and it demonstrates that the axial transport of D2O
beyond the barrier depends mainly on the convective fluxes.
To extract the quantitative information about the transport of D2O into roots with dry and wet
rhizosphere, we calculated the volume of D2O passing the barrier, VD2O [cm3]. VD2O is related
to the axial flux 𝑗𝑥 [cm s-1] according to Eq. (4.1). In Figure 7 we plotted the cumulative
fluxes for the roots of the sample shown in Figure 4. The cumulative fluxes were calculated
from the increase of 𝑉D2O/(𝜋𝑟2𝐶) [cm] over time in the time interval when C was constant.
The slopes of the lines in Figure 7A are equal to the axial fluxes 𝑗𝑥. Figure 7A shows that the
water fluxes were much higher in the compartments with wet rhizosphere than in those with
dry rhizosphere.
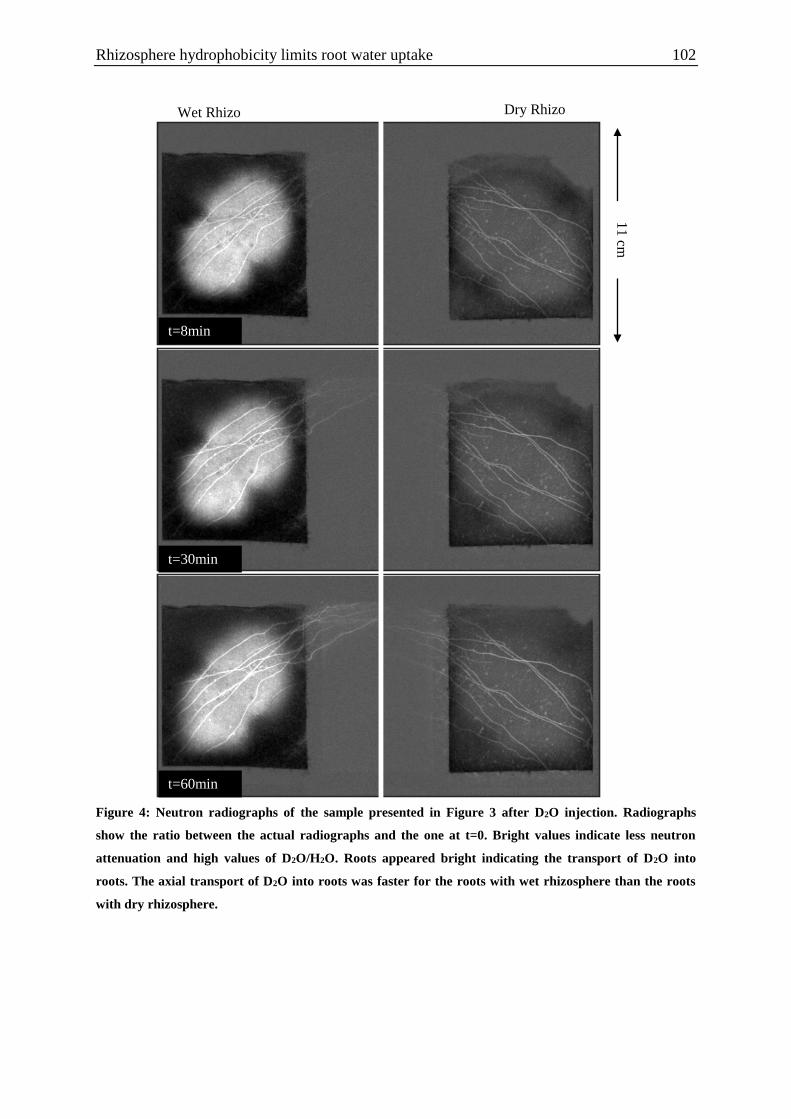
Rhizosphere hydrophobicity limits root water uptake 102
Figure 4: Neutron radiographs of the sample presented in Figure 3 after D2O injection. Radiographs
show the ratio between the actual radiographs and the one at t=0. Bright values indicate less neutron
attenuation and high values of D2O/H2O. Roots appeared bright indicating the transport of D2O into
roots. The axial transport of D2O into roots was faster for the roots with wet rhizosphere than the roots
with dry rhizosphere.
Wet Rhizo Dry Rhizo
t=8min
t=30min
t=60min
11
cm
Chapter 4 103
103
Figure 5: Neutron radiographs of two additional samples one hour after D2O injection. Radiographs show
the ratio between the actual radiographs and the one at t=0. Bright values indicate less neutron
attenuation and high values of D2O/H2O. D2O was injected into each compartment separately.
t=60min
t=60min
Wet Rhizo Dry Rhizo
11
cm
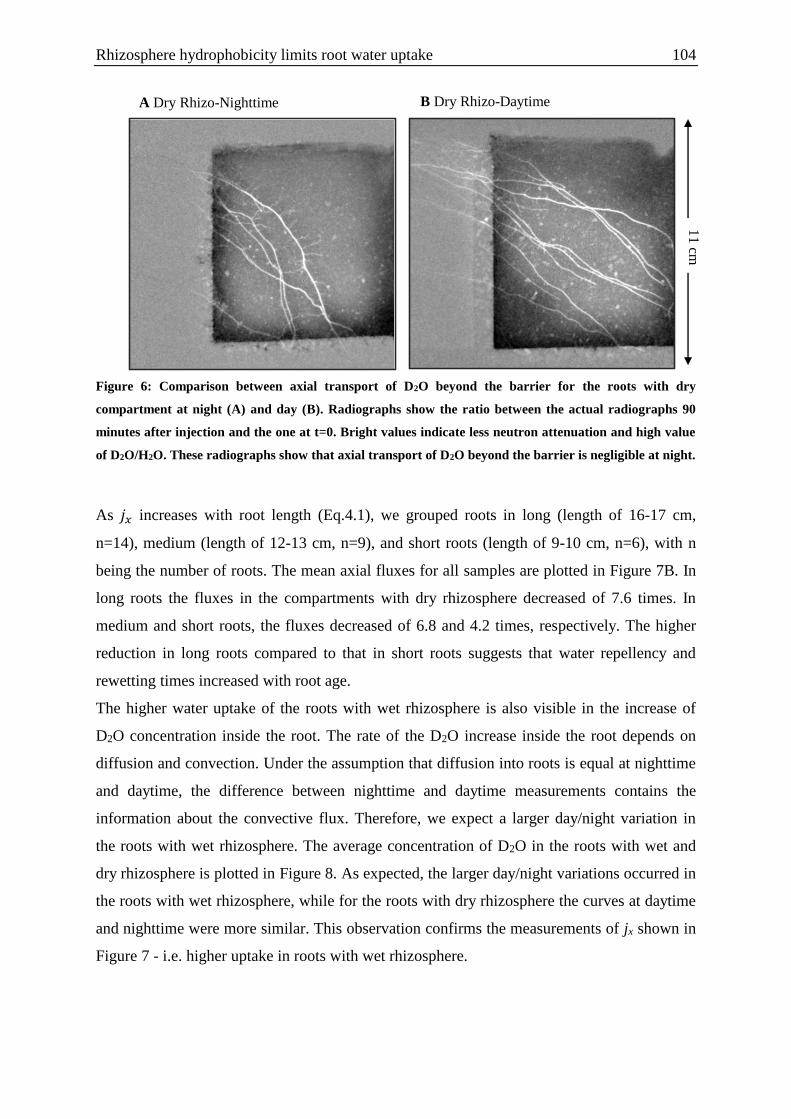
Rhizosphere hydrophobicity limits root water uptake 104
Figure 6: Comparison between axial transport of D2O beyond the barrier for the roots with dry
compartment at night (A) and day (B). Radiographs show the ratio between the actual radiographs 90
minutes after injection and the one at t=0. Bright values indicate less neutron attenuation and high value
of D2O/H2O. These radiographs show that axial transport of D2O beyond the barrier is negligible at night.
As 𝑗𝑥 increases with root length (Eq.4.1), we grouped roots in long (length of 16-17 cm,
n=14), medium (length of 12-13 cm, n=9), and short roots (length of 9-10 cm, n=6), with n
being the number of roots. The mean axial fluxes for all samples are plotted in Figure 7B. In
long roots the fluxes in the compartments with dry rhizosphere decreased of 7.6 times. In
medium and short roots, the fluxes decreased of 6.8 and 4.2 times, respectively. The higher
reduction in long roots compared to that in short roots suggests that water repellency and
rewetting times increased with root age.
The higher water uptake of the roots with wet rhizosphere is also visible in the increase of
D2O concentration inside the root. The rate of the D2O increase inside the root depends on
diffusion and convection. Under the assumption that diffusion into roots is equal at nighttime
and daytime, the difference between nighttime and daytime measurements contains the
information about the convective flux. Therefore, we expect a larger day/night variation in
the roots with wet rhizosphere. The average concentration of D2O in the roots with wet and
dry rhizosphere is plotted in Figure 8. As expected, the larger day/night variations occurred in
the roots with wet rhizosphere, while for the roots with dry rhizosphere the curves at daytime
and nighttime were more similar. This observation confirms the measurements of jx shown in
Figure 7 - i.e. higher uptake in roots with wet rhizosphere.
A Dry Rhizo-Nighttime B Dry Rhizo-Daytime 1
1 cm
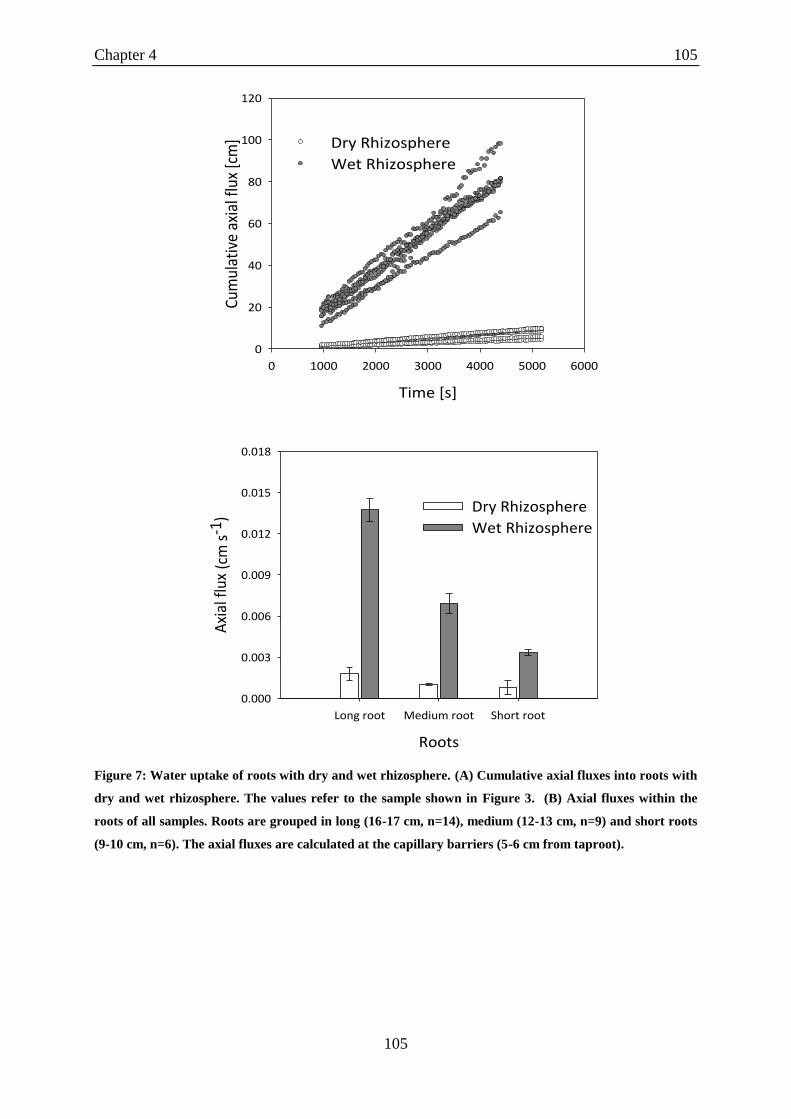
Chapter 4 105
105
Figure 7: Water uptake of roots with dry and wet rhizosphere. (A) Cumulative axial fluxes into roots with
dry and wet rhizosphere. The values refer to the sample shown in Figure 3. (B) Axial fluxes within the
roots of all samples. Roots are grouped in long (16-17 cm, n=14), medium (12-13 cm, n=9) and short roots
(9-10 cm, n=6). The axial fluxes are calculated at the capillary barriers (5-6 cm from taproot).
b)
a) A
B
Time [s]
0 1000 2000 3000 4000 5000 6000
Cum
ulat
ive
axia
l flu
x [c
m]
0
20
40
60
80
100
120
Dry Rhizosphere
Wet Rhizosphere
Roots
Long root Medium root Short root
Axi
al fl
ux (
cm s
-1)
0.000
0.003
0.006
0.009
0.012
0.015
0.018
Dry Rhizosphere
Wet Rhizosphere
Rhizosphere hydrophobicity limits root water uptake 106
Discussion
The axial D2O transport into roots (Figure 7) and the radial one (Figure 8) show a lower root
water uptake in the soil compartments that were let dry and subsequently rewetted. Root water
uptake in these compartments was reduced of 4-8 times. This reduction persisted for at least
one-two hours after rewetting. Such observations are in line with former observations of high
water repellency in the rhizosphere (Moradi et al. 2012; Carminati et al. 2010).
Figure 8B shows also an unexpected result. During daytime, the increase of D2O into the roots
with dry rhizosphere is as fast as in the roots with wet rhizosphere; and during nighttime, the
increase of D2O into root with dry rhizosphere is even faster than in the roots with wet
rhizosphere. How can we explain these observations? Is there a contradiction with our
hypothesis that after drying the rhizosphere becomes a limiting factor for water transport into
roots?
One explanation is that in the roots with dry rhizosphere there is an additional force that
drives water into the root after D2O injection. This force originates from the sudden increase
of water potential in the soil compartment that was let dry. Based on the water retention curve
of our sandy soil, we expect an increase of water potential up to 1 MPa. Let us consider the
experiment at nighttime. Let us assume that when transpiration was null roots and soil were in
equilibrium. After irrigation, the soil water potential suddenly increased and initiated a water
flow into the roots. As water entered the roots, the roots swoll, their tissue rehydrated and
their water potential increased until it equaled that of the soil. During D2O injection, this
initial flow into the root increased the rate of D2O transport into the root and could explain our
observations. Obviously, hydraulic equilibration between soil and roots is more complex and
depends on the hydraulic redistribution between roots. However, this simple picture illustrates
the effect of the abrupt change of water potential in the dry compartment. A similar process
will occur at day.
A second explanation is that the increase of D2O that we attribute to the roots with dry
rhizosphere did not come only from the roots themselves, but it partly came from the
rhizosphere. The reason is illustrated in Figure 9. Before D2O injection, according to
Carminati et al. (2010) and Moradi et al. (2011), we expect that the water content increased
towards the roots. Let us assume that the initial water content of the bulk soil was 0.02 and the
water content in the rhizosphere was 0.06 (Figure 9A). Taking a neutron attenuation
coefficient of normal water ƩH2O=4 cm-1, we obtain a neutron attenuation of 0.24 [-] for the
rhizosphere and of 0.08 [-] for the bulk soil. After injection of 9 ml D2O, the liquid content
(H2O+D2O) in the bulk soil increased to 0.12. If we entirely replaced the H2O present in the

Chapter 4 107
107
bulk soil with D2O and we assume ƩD2O=0.6 cm-1, the neutron attenuation in the radiographs
for the bulk soil would be 0.07 [-]. Since the liquid content (H2O+D2O) in the rhizosphere did
not change instantaneously after injection (Carminati et al. 2010), the neutron attenuation in
the rhizosphere remained constant (Figure 9B). If we take the difference between the
radiograph before and immediately after D2O injection, we cannot expect to see any effect of
rhizosphere water repellency. Indeed, we did not see it in the experiments with D2O.
However, after some time, H2O initially presents in the rhizosphere mixed with D2O of the
bulk soil until the concentration of D2O in the soil solution was uniform. We expect that
H2O/D2O mixing was slower in the rhizosphere than in the bulk soil, due to the presence of
mucilage around the roots. After complete H2O/D2O mixing in the rhizosphere (Figure 9C),
the neutron attenuation in the rhizosphere decreased down to 0.07 (based on the total volumes
of D2O and H2O in the compartment, at equilibrium we can expect H2O/D2O=1/5). Compared
to the initial radiograph, this means that the decrease in the neutron attenuation after D2O
injection was much bigger in the rhizosphere than in the bulk soil. Since our analysis is based
on the two-dimensional picture, we cannot be sure that the signal in the root was not affected
by the signal of the rhizosphere. On the contrary, it is very likely that part of the increase of
D2O in Figure 8B came from the rhizosphere, rather than exclusively from the root.
h
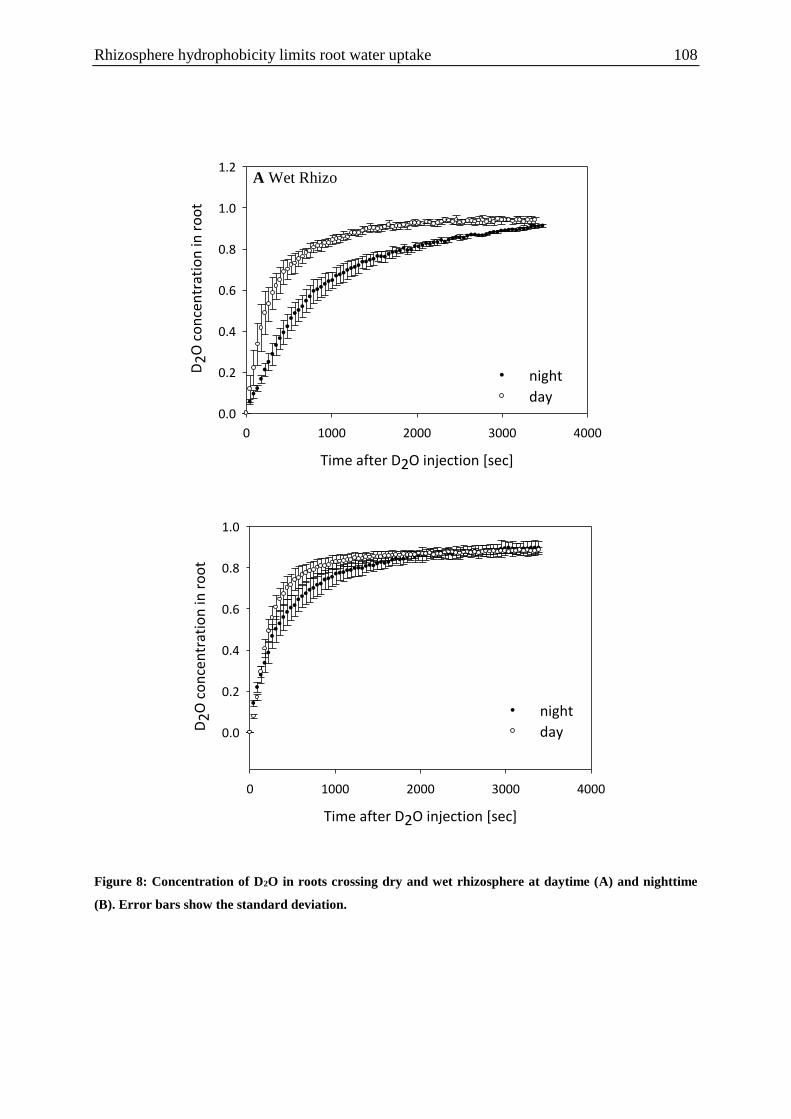
Rhizosphere hydrophobicity limits root water uptake 108
Time after D2O injection [sec]
0 1000 2000 3000 4000
D2
O c
on
cen
trat
ion
in r
oo
t
0.0
0.2
0.4
0.6
0.8
1.0
1.2
night
day
Figure 8: Concentration of D2O in roots crossing dry and wet rhizosphere at daytime (A) and nighttime
(B). Error bars show the standard deviation.
A Wet Rhizo
B Dry Rhizo
Time after D2O injection [sec]
0 1000 2000 3000 4000
D2
O c
on
cen
trat
ion
in r
oo
t
0.0
0.2
0.4
0.6
0.8
1.0
night
day
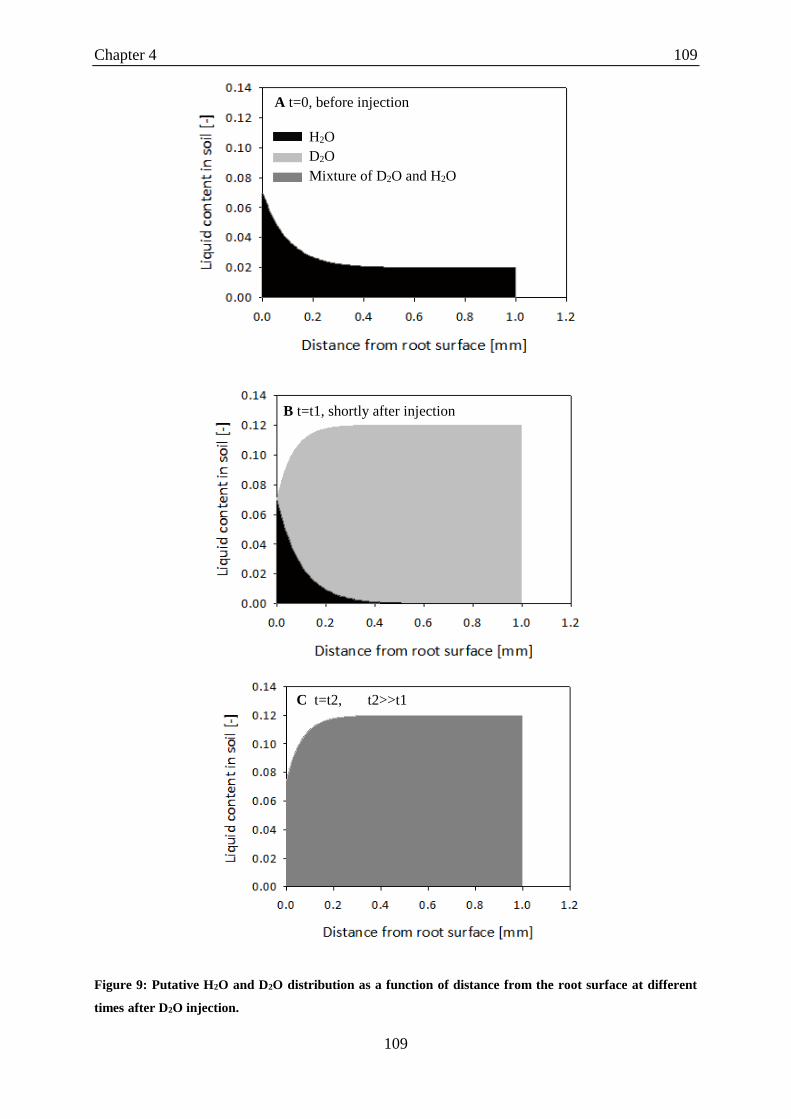
Chapter 4 109
109
Figure 9: Putative H2O and D2O distribution as a function of distance from the root surface at different
times after D2O injection.
B t=t1, shortly after injection
C t=t2, t2>>t1
H2O
D2O
Mixture of D2O and H2O
A t=0, before injection
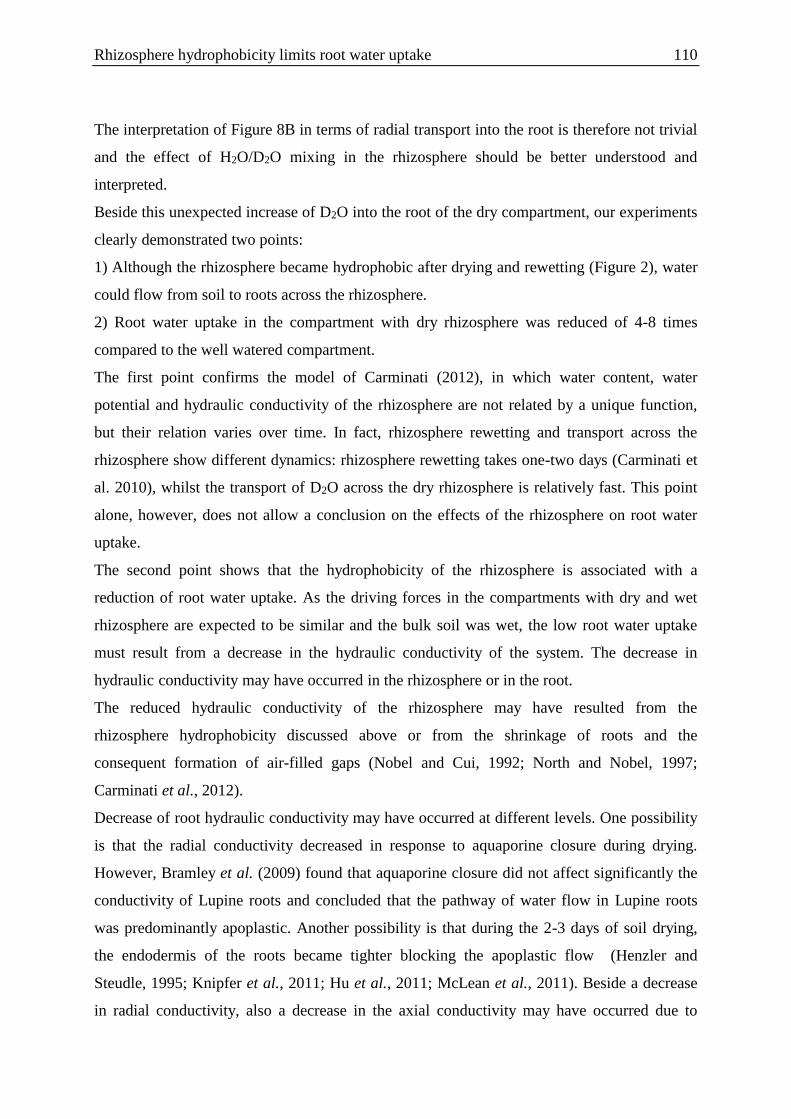
Rhizosphere hydrophobicity limits root water uptake 110
The interpretation of Figure 8B in terms of radial transport into the root is therefore not trivial
and the effect of H2O/D2O mixing in the rhizosphere should be better understood and
interpreted.
Beside this unexpected increase of D2O into the root of the dry compartment, our experiments
clearly demonstrated two points:
1) Although the rhizosphere became hydrophobic after drying and rewetting (Figure 2), water
could flow from soil to roots across the rhizosphere.
2) Root water uptake in the compartment with dry rhizosphere was reduced of 4-8 times
compared to the well watered compartment.
The first point confirms the model of Carminati (2012), in which water content, water
potential and hydraulic conductivity of the rhizosphere are not related by a unique function,
but their relation varies over time. In fact, rhizosphere rewetting and transport across the
rhizosphere show different dynamics: rhizosphere rewetting takes one-two days (Carminati et
al. 2010), whilst the transport of D2O across the dry rhizosphere is relatively fast. This point
alone, however, does not allow a conclusion on the effects of the rhizosphere on root water
uptake.
The second point shows that the hydrophobicity of the rhizosphere is associated with a
reduction of root water uptake. As the driving forces in the compartments with dry and wet
rhizosphere are expected to be similar and the bulk soil was wet, the low root water uptake
must result from a decrease in the hydraulic conductivity of the system. The decrease in
hydraulic conductivity may have occurred in the rhizosphere or in the root.
The reduced hydraulic conductivity of the rhizosphere may have resulted from the
rhizosphere hydrophobicity discussed above or from the shrinkage of roots and the
consequent formation of air-filled gaps (Nobel and Cui, 1992; North and Nobel, 1997;
Carminati et al., 2012).
Decrease of root hydraulic conductivity may have occurred at different levels. One possibility
is that the radial conductivity decreased in response to aquaporine closure during drying.
However, Bramley et al. (2009) found that aquaporine closure did not affect significantly the
conductivity of Lupine roots and concluded that the pathway of water flow in Lupine roots
was predominantly apoplastic. Another possibility is that during the 2-3 days of soil drying,
the endodermis of the roots became tighter blocking the apoplastic flow (Henzler and
Steudle, 1995; Knipfer et al., 2011; Hu et al., 2011; McLean et al., 2011). Beside a decrease
in radial conductivity, also a decrease in the axial conductivity may have occurred due to
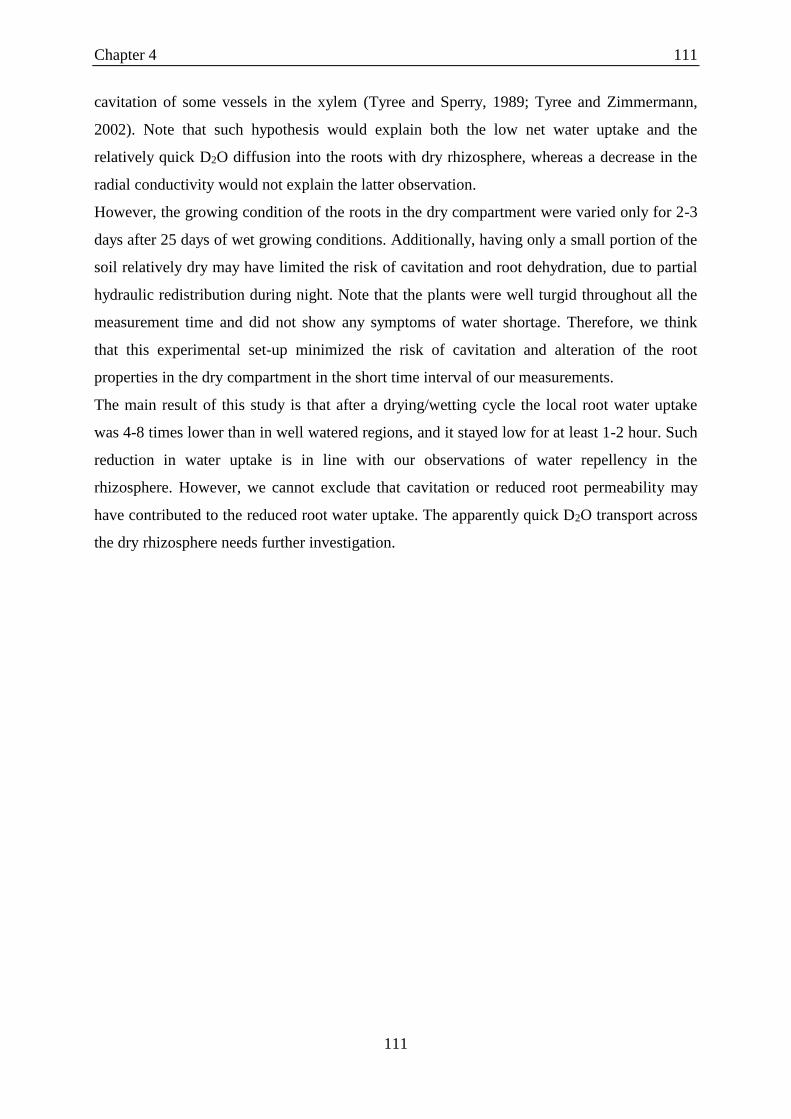
Chapter 4 111
111
cavitation of some vessels in the xylem (Tyree and Sperry, 1989; Tyree and Zimmermann,
2002). Note that such hypothesis would explain both the low net water uptake and the
relatively quick D2O diffusion into the roots with dry rhizosphere, whereas a decrease in the
radial conductivity would not explain the latter observation.
However, the growing condition of the roots in the dry compartment were varied only for 2-3
days after 25 days of wet growing conditions. Additionally, having only a small portion of the
soil relatively dry may have limited the risk of cavitation and root dehydration, due to partial
hydraulic redistribution during night. Note that the plants were well turgid throughout all the
measurement time and did not show any symptoms of water shortage. Therefore, we think
that this experimental set-up minimized the risk of cavitation and alteration of the root
properties in the dry compartment in the short time interval of our measurements.
The main result of this study is that after a drying/wetting cycle the local root water uptake
was 4-8 times lower than in well watered regions, and it stayed low for at least 1-2 hour. Such
reduction in water uptake is in line with our observations of water repellency in the
rhizosphere. However, we cannot exclude that cavitation or reduced root permeability may
have contributed to the reduced root water uptake. The apparently quick D2O transport across
the dry rhizosphere needs further investigation.
Hydraulic conductivity of hydrophobic rhizosphere 112
Acknowledgements
We thank Yangmin Kim for support in the interpretation of the data and for comments to a
previous version of the manuscript. We acknowledge Anders Kaestner and the staff at the
ICON imaging station of the Paul scherrer Institut (PSI) for technical support during the
measurements with neutron radiography. The position of M. Zarebanadkouki was funded by
IPSWaT, BMBF, grant IPS 11/Q04.
References
Bramley, H., N.C. Turner, D.W. Turner, and S.D. Tyerman. (2009). Roles of morphology,
anatomy, and aquaporins in determining contrasting hydraulic behavior of roots. Plant
Physiol 150(1): 348–364.
Carminati, A. (2012). A Model of Root Water Uptake Coupled with Rhizosphere Dynamics.
Vadose Zone J 11(3).
Carminati, A., A.B. Moradi, D. Vetterlein, P. Vontobel, E. Lehmann, U. Weller, H.-J. Vogel,
and S.E. Oswald. (2010) Dynamics of soil water content in the rhizosphere. Plant Soil
332(1-2): 163–176.
Carminati, A., C.L. Schneider, A.B. Moradi, M. Zarebanadkouki, D. Vetterlein, H.J. Vogel,
A. Hildebrandt, U. Weller, L. Schüler, and S.E. Oswald. (2011). How the Rhizosphere
May Favor Water Availability to Roots. Vadose Zone J 10(3): 988–998.
Carminati, A., and D. Vetterlein. (2012). Plasticity of rhizosphere hydraulic properties as a
key for efficient utilization of scarce resources. Ann. Bot.
Carminati, A., D. Vetterlein, N. Koebernick, S. Blaser, U. Weller, and H.-J. Vogel. (2012).
Do roots mind the gap? Plant Soil doi:10.1007/s11104-012-1496-9.
Dodd, I.C. (2003). Hormonal interactions and stomatal responses. J Plant Growth Regul
22(1): 32–46.
Draye, X., Y. Kim, G. Lobet, and M. Javaux. (2010). Model-assisted integration of
physiological and environmental constraints affecting the dynamic and spatial patterns
of root water uptake from soils. J Exp Bot 61(8): 2145–2155.
Gardner, W.R. (1960). Dynamic aspects of water availability to plants. Soil Sci 89(2): 63–73.
Chapter 5 113
113
Hallett, P.D., D.C. Gordon, and A.G. Bengough. (2003). Plant influence on rhizosphere
hydraulic properties: direct measurements using a miniaturized infiltrometer. New
Phytol 157(3): 597–603.
Henzler, T., and E. Steudle. (1995). Reversible closing of water channels in Chara internodes
provides evidence for a composite transport model of the plasma membrane. J Exp
Bot 46(2): 199–209.
Hu, T., S. Kang, F. Li, and J. Zhang. (2011). Effects of partial root-zone irrigation on
hydraulic conductivity in the soil-root system of maize plants. J Exp Bot 62(12):
4163–4172.
Knipfer, T., M. Besse, J.-L. Verdeil, and W. Fricke. (2011). Aquaporin-facilitated water
uptake in barley (Hordeum vulgare L.) roots. J Exp Bot 62(12): 4115–4126.
Lee, J. N.M. Holbrook, and M.A. Zwieniecki. (2012). Ion induced changes in the structure of
bordered pit membranes. Front Plant Sci.
McCully, M.E., and J.S. Boyer. (1997). The expansion of maize root-cap mucilage during
hydration. 3. Changes in water potential and water content. Physiol Plant. 99(1): 169–
177.
McLean, E.H., M. Ludwig, and P.F. Grierson. (2011). Root hydraulic conductance and
aquaporin abundance respond rapidly to partial root-zone drying events in a riparian
Melaleuca species. New Phytol 192(3): 664–675.
Meyer, C.J., J.L. Seago, and C.A. Peterson. (2008). Environmental effects on the maturation
of the endodermis and multiseriate exodermis of Iris germanica roots. Ann Bot-Lond.
103(5): 687–702.
Moradi, A.B., A. Carminati, A. Lamparter, S.K. Woche, J. Bachmann, D. Vetterlein, H.J.
Vogel, and S.E. Oswald. (2012). Is the rhizosphere temporarily water repellent?
Vadose Zone J 11(3).
Moradi, A.B., A. Carminati, D. Vetterlein, P. Vontobel, E. Lehmann, U. Weller, J.W.
Hopmans, H.-J. Vogel, and S.E. Oswald. (2011). Three-dimensional visualization and
quantification of water content in the rhizosphere. New Phytol 192(3): 653–663.
Hydraulic conductivity of hydrophobic rhizosphere 114
Nobel, P.S., and M. Cui. (1992). Hydraulic conductances of the soil, the root-soil air gap, and
the root: changes for desert succulents in drying soil. J Exp Bot 43(3): 319–326.
North, G.B., and P.S. Nobel. (1997). Drought-induced changes in soil contact and hydraulic
conductivity for roots of Opuntia ficus-indica with and without rhizosheaths. Plant
Soil 191(2): 249–258.
Passioura, J.B. (1980). The Transport of Water from Soil to Shoot in Wheat Seedlings. J Exp
Bot 31(1): 333–345.
Read, D.B., A.G. Bengough, P.J. Gregory, J.W. Crawford, D. Robinson, C.M. Scrimgeour,
I.M. Young, K. Zhang, and X. Zhang. (2003). Plant roots release phospholipid
surfactants that modify the physical and chemical properties of soil. New Phytol
157(2): 315–326.
Sperry, J.S., F.R. Adler, G.S. Campbell, and J.P. Comstock. (1998). Limitation of plant water
use by rhizosphere and xylem conductance: results from a model. Plant Cell Env.
21(4): 347–359.
Tyree, M.T., and J.S. Sperry. (1989). Vulnerability of Xylem to Cavitation and Embolism.
Annu Rev Plant Physiol Plant Mol Biol 40(1): 19–36.
Tyree, M.T., and M.H. Zimmermann. (2002). Xylem Structure and the Ascent of Sap.
Springer.
Young, I.M. (1995). Variation in moisture contents between bulk soil and the rhizosheath of
wheat (Triticum aestivum L. cv. Wembley). New Phytol 130(1): 135–139.
Zarebanadkouki, M., Y.X. Kim, A.B. Moradi, H.-J. Vogel, A. Kaestner, and A. Carminati.
(2012). Quantification and Modeling of Local Root Water Uptake Using Neutron
Radiography and Deuterated Water. Vadose Zone J 11(3).
Zarebanadkouki M, Kim YX, A, Carminati A. (2013). Where do roots take up water? Neutron
radiography of water flow into the roots of transpiring plants growing in soil. New Phytol.
DOI: 10.1111/nph.12330.
Zwieniecki, M.A., M.V. Thompson, and N.M. Holbrook. (2003). Understanding the
Hydraulics of Porous Pipes: Tradeoffs Between Water Uptake and Root Length
Utilization. J Plant Growth Regul 21(4): 315–323.
Chapter 5 115
115
A method to measure hydraulic conductivity of the
rhizosphere after drying
Mohsen Zarebanadkouki and Andrea Carminati, (In preparation)
Hydraulic conductivity of hydrophobic rhizosphere 116
Abstract
The ability of plants to take up water from the soil is influenced by the hydraulic behavior of
the soil in the immediate vicinity of the roots, the so called rhizosphere. Hydraulic properties
of the rhizosphere are actively altered by roots and associated microorganisms. In previous
works (Carminati et al 2010; Moradi et al. 2011; Moradi et al. 2012), it has been shown that
the water retention curve of the rhizosphere differs from that of the bulk soil. However, the
hydraulic property that is expected to have a higher impact on soil-plant water relations is the
hydraulic conductivity of the rhizosphere. To data, there is very little experimental
information on the hydraulic conductivity of the rhizosphere.
In this study we attempted to measure the hydraulic conductivity of the rhizosphere after
drying. To this end, we monitored the redistribution of water in the soil and root during a
drying and wetting cycle using time-series neutron radiography.
Lupines were grown in aluminium containers filled with sandy soil. Plants were irrigated
every fourth day for a period of two weeks and then irrigation was stopped. Six days after
stopping irrigation, we rewatered the samples from the top (60 ml water) and simultaneously
monitored redistribution of water in the soil and roots by mean of neutron radiography. The
radiographs showed that the rhizosphere stayed temporarily dry and it slowly rewetted with
time. Over time, we observed that roots swelled.
We used the swelling rate of roots to estimate the effective hydraulic conductivity of the
rhizosphere. To calculate effective hydraulic conductivity of the rhizosphere, we assumed that
roots and soil were at the same water potential before and the end of infiltration. We used a
Darcy type of equation where the flux of water into roots was obtained from the swelling rate
of roots and gradient in water potential between roots and soil was estimated from the
pressure volume curve of the roots. We found that the effective hydraulic conductivity of the
rhizosphere was initially 1×10-11 cm s-1 and it increased to 2×10⁻⁹ cm s-1 in four hours.
Chapter 5 117
117
Introduction
The rhizosphere is defined as the soil in the immediate vicinity of roots that is actively
modified by roots and microorganisms living in symbiosis with the roots (Gregory, 2006).
Many studies reported that the rhizosphere has specific and distinct properties that differ from
those of the bulk soil. How these properties may affect the balance of water between plants
and soil has been subject of many investigations (Young, 1995; Read & Gregory, 1997; Read
et al., 1999; Hallett et al., 2003; Whalley et al., 2004, 2005; Carminati et al., 2010; Moradi et
al., 2012).
Due to the small size of the rhizosphere, its importance as water capacitor is negligible
compared to the big transpiration demand of the plants. However, the hydraulic conductivity
of the rhizosphere may affect the flux of water into the roots. Typically, the ability of plants to
take up water from the soil is controlled by the resistance of roots. But, as the soil dries, the
soil hydraulic conductivity decreases of several orders of magnitudes and may become
dominant (Gardner, 1960; Passioura, 1980; Nobel & Cui, 1992; Doussan et al., 2006;
Carminati et al., 2011). Modelling calculations showed that under dry condition, the flow of
water into roots is limited by the hydraulic properties of the soil in the immediate vicinity of
the roots due to a big drop in water potential and hydraulic conductivity around the roots in
the soil ( Carminati et al., 2011).
It has been known that by exuding mucilage, roots modify the relation between water content
and water potential in the rhizosphere (McCully & Boyer, 1997; Czarnes et al., 2000; Hallett
et al., 2003; Whalley et al., 2004). Carminati et al. (2010) and Moradi et al. (2011) observed
unexpectedly higher water contents in the rhizosphere than in the bulk soil during a drying
cycle. They explained this observation with the presence of mucilage in the rhizosphere.
Mucilage is expected to increase the water-holding capacity of the soil by improving the
absorbing capacity of soil and the soil structure (Chenu, 1993; Watt et al., 1994; McCully &
Boyer, 1997; Or et al., 2007). Higher water content in the rhizosphere has been also reported
by others (Young, 1995; Nakashi, 2005).
Carminati et al. (2010) observed that immediately after rewetting, the rhizosphere remained
markedly dry and it slowly rewatered until it became again wetter than the bulk soil. They
explained this observation with a temporarily hydrophobicity of the rhizosphere caused by the
presence of surfactants in the mucilage. Mucilage contains surfactants that reduce the surface
tension of water in soil. Coating the soil particles in the rhizosphere with surfactants, in
Hydraulic conductivity of hydrophobic rhizosphere 118
particular lipid components, reduces the wettability of the rhizosphere (Read & Gregory,
1997; Read et al., 1999; Czarnes et al., 2000; Hallett et al., 2003; Moradi et al., 2012). Other
authors have also reported low water content in the rhizosphere (MacFall et al., 1990; Segal et
al., 2008). Carminati et (2012) suggests that different observations of a wet and dry
rhizosphere are not in contradiction, but they rather reflect the dynamic and hysteretic
hydraulic behavior of the rhizosphere. These studies show that the rhizosphere has hydraulic
properties than cannot be explained by classical models. According to the classical models,
the hydraulic conductivity of soil is a unique function of water content. Carminati (2012)
proposed a new model in which the rewetting of the rhizosphere does not follow the changes
in water potential in the rhizosphere and it depends on wettability and swelling rate of the
mucilage. This model could simulate the unexpected water distribution around the roots
during drying and rewetting cycles. In the present study, we aimed to measure the hydraulic
conductivity of the rhizosphere during the rewetting cycle. To this end, we used neutron
radiography technique to monitor redistribution of water in the soil and roots of lupines. We
used the swelling rate of roots to estimate the effective hydraulic conductivity of the
rhizosphere. This study will introduce a capable technique to measure the hydraulic
conductivity of the dry rhizopsphere. It will also provide experimental data needed for
understanding and modelling root water uptake in dry condition.
Material and methods
Preparation of the soil and plants
Lupine seeds (Lupine Albus) were grown in aluminium containers (15 cm wide, 30 cm high
and 1 cm thick) filled with a sandy soil. The sandy soil was collected from the artificial
catchment Chicken Creek located near Cottbus, Germany. The soil (sieved to < 2 mm)
consisted of approximately 92% sand, 5% silt and 3% clay. The soil hydraulic properties are
given in Table . The containers were filled with soil while they were laid horizontally. The
sandy soil was poured into the containers through two sieves to favor a homogenous sand
deposition and limit soil layering. The open faces of the containers were then closed, turned
vertically, and gently shaken to achieve a stable packing. The average bulk density of the soil
was 1.4 g cm-3. The top of the samples was covered with a 1 cm-thick layer of quartz gravel
(size of 5 mm grain) to minimize evaporation.
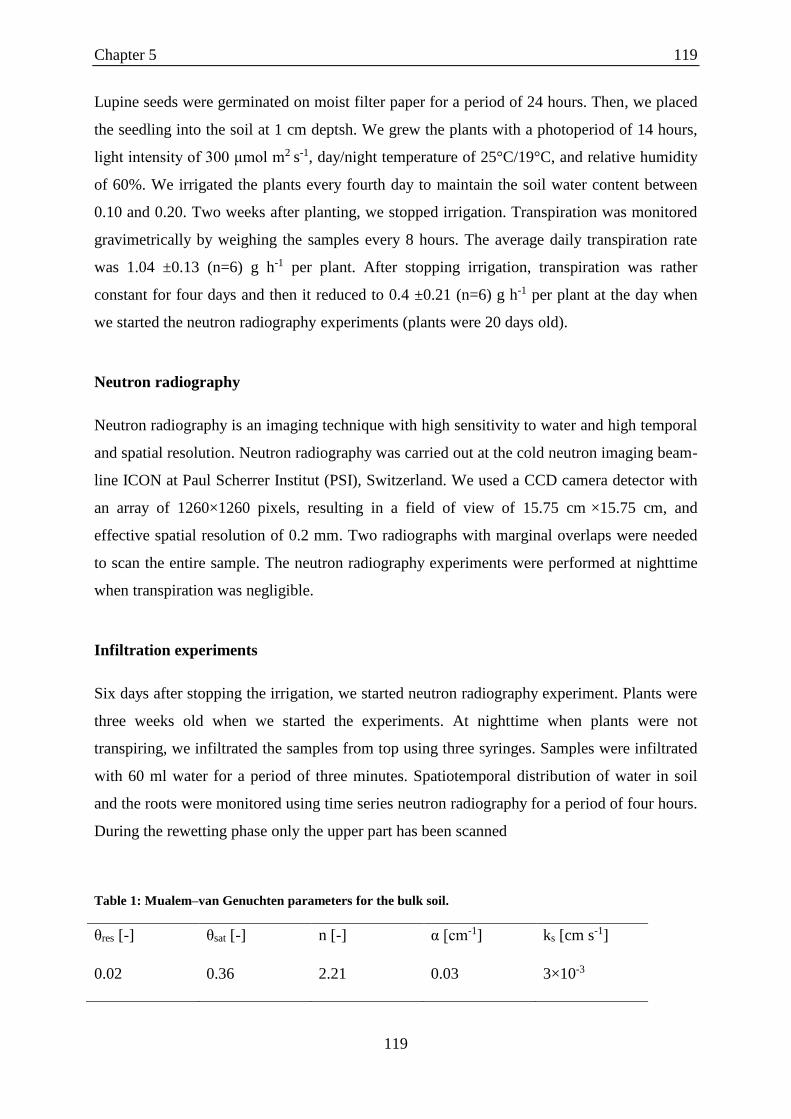
Chapter 5 119
119
Lupine seeds were germinated on moist filter paper for a period of 24 hours. Then, we placed
the seedling into the soil at 1 cm deptsh. We grew the plants with a photoperiod of 14 hours,
light intensity of 300 μmol m2 s-1, day/night temperature of 25°C/19°C, and relative humidity
of 60%. We irrigated the plants every fourth day to maintain the soil water content between
0.10 and 0.20. Two weeks after planting, we stopped irrigation. Transpiration was monitored
gravimetrically by weighing the samples every 8 hours. The average daily transpiration rate
was 1.04 ±0.13 (n=6) g h-1 per plant. After stopping irrigation, transpiration was rather
constant for four days and then it reduced to 0.4 ±0.21 (n=6) g h-1 per plant at the day when
we started the neutron radiography experiments (plants were 20 days old).
Neutron radiography
Neutron radiography is an imaging technique with high sensitivity to water and high temporal
and spatial resolution. Neutron radiography was carried out at the cold neutron imaging beam-
line ICON at Paul Scherrer Institut (PSI), Switzerland. We used a CCD camera detector with
an array of 1260×1260 pixels, resulting in a field of view of 15.75 cm ×15.75 cm, and
effective spatial resolution of 0.2 mm. Two radiographs with marginal overlaps were needed
to scan the entire sample. The neutron radiography experiments were performed at nighttime
when transpiration was negligible.
Infiltration experiments
Six days after stopping the irrigation, we started neutron radiography experiment. Plants were
three weeks old when we started the experiments. At nighttime when plants were not
transpiring, we infiltrated the samples from top using three syringes. Samples were infiltrated
with 60 ml water for a period of three minutes. Spatiotemporal distribution of water in soil
and the roots were monitored using time series neutron radiography for a period of four hours.
During the rewetting phase only the upper part has been scanned
Table 1: Mualem–van Genuchten parameters for the bulk soil.
θres [-] θsat [-] n [-] α [cm-1] ks [cm s-1]
0.02 0.36 2.21 0.03 3×10⁻³
Hydraulic conductivity of hydrophobic rhizosphere 120
Root segmentation
The sharp contrast between roots and surrounding soil, due to the marked difference in their
water contents, allowed us to easily segment roots from the soil. Root thickness calculation
and root segmentation were carried out by image processing using the algorithm
roottracker2D (Menon et al., 2007). We calculated root radius and root length using the
Euclidean distance map and the skeleton of the segmented roots.
Quantification of water content in the bulk soil
The individual radiographs were referenced using a flat field (radiography without sample)
and dark current (image recorded by the camera when there was no beam). The Beer-Lambert
law for our samples can be rewritten as
2 2log ( , ) (1 )norm Al Al s tot H O H OI x y d d d (5.1)
where the subscripts Al, S, and H2O refer to aluminium container, solid phase of the soil, and
normal water, respectively, Inorm (x, y) is the corrected image, μ (cm−1) is the macroscopic
neutron attenuation coefficient, ∅ is the soil porosity (cm3 cm-3), and dtot is the inner thickness
of the container (1cm). The contribution of container and soil were derived from the
radiograph of a dry sample, Idry (x,y). The attenuation coefficients of water (μH2O=3.65 cm-1)
were measured using control samples with known normal water content. Assuming that the
contribution of the container and soil was uniform across the sample, the contribution of H2O
in the sample can be written as
2 2
( , )log
( , )
normH O H O
dry
I x yd
I x y
(5.2)
The average water content, �̅� [-], across the thickness of the sample can be written as
2H O
tot
d
d (5.3)
where dtot is the total thickness of the inner space of the container (1cm). This equation can
be used to calculate water content in the bulk soil, but not in the roots and their rhizosphere.
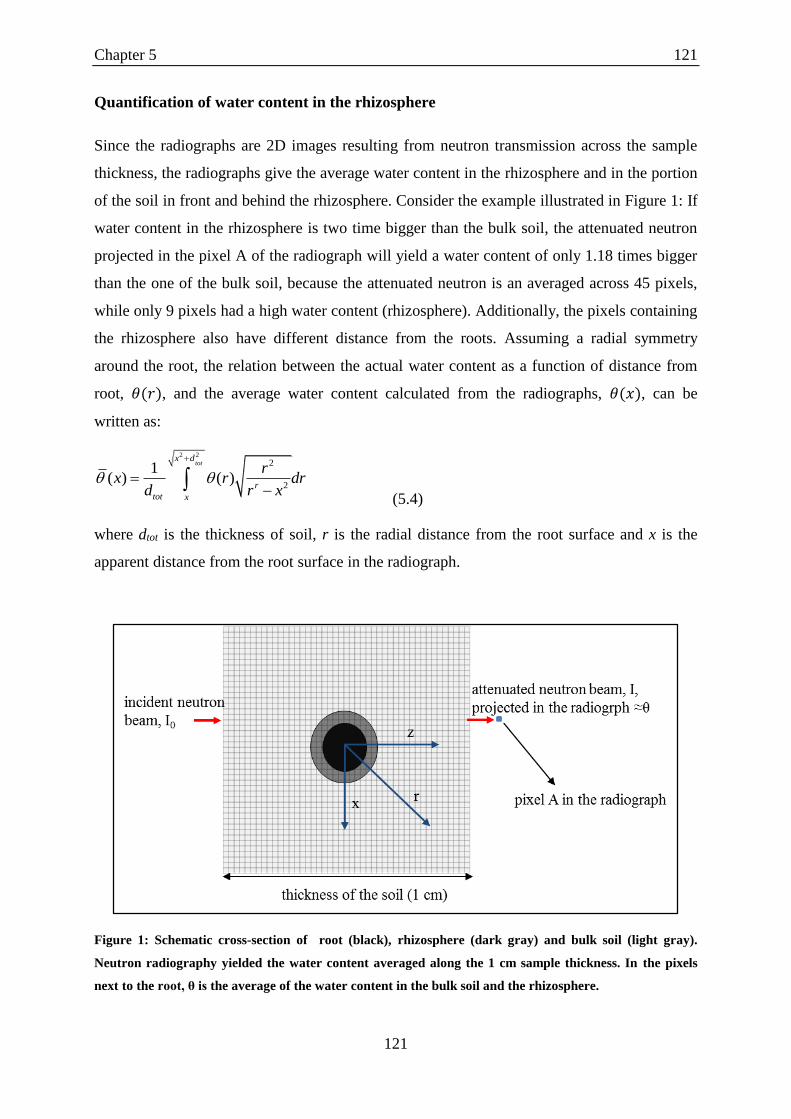
Chapter 5 121
121
Quantification of water content in the rhizosphere
Since the radiographs are 2D images resulting from neutron transmission across the sample
thickness, the radiographs give the average water content in the rhizosphere and in the portion
of the soil in front and behind the rhizosphere. Consider the example illustrated in Figure 1: If
water content in the rhizosphere is two time bigger than the bulk soil, the attenuated neutron
projected in the pixel A of the radiograph will yield a water content of only 1.18 times bigger
than the one of the bulk soil, because the attenuated neutron is an averaged across 45 pixels,
while only 9 pixels had a high water content (rhizosphere). Additionally, the pixels containing
the rhizosphere also have different distance from the roots. Assuming a radial symmetry
around the root, the relation between the actual water content as a function of distance from
root, 𝜃(𝑟), and the average water content calculated from the radiographs, 𝜃(𝑥), can be
written as:
2 2
2
2
1( ) ( )
totx d
r
tot x
rx r dr
d r x
(5.4)
where dtot is the thickness of soil, r is the radial distance from the root surface and x is the
apparent distance from the root surface in the radiograph.
Figure 1: Schematic cross-section of root (black), rhizosphere (dark gray) and bulk soil (light gray).
Neutron radiography yielded the water content averaged along the 1 cm sample thickness. In the pixels
next to the root, θ is the average of the water content in the bulk soil and the rhizosphere.
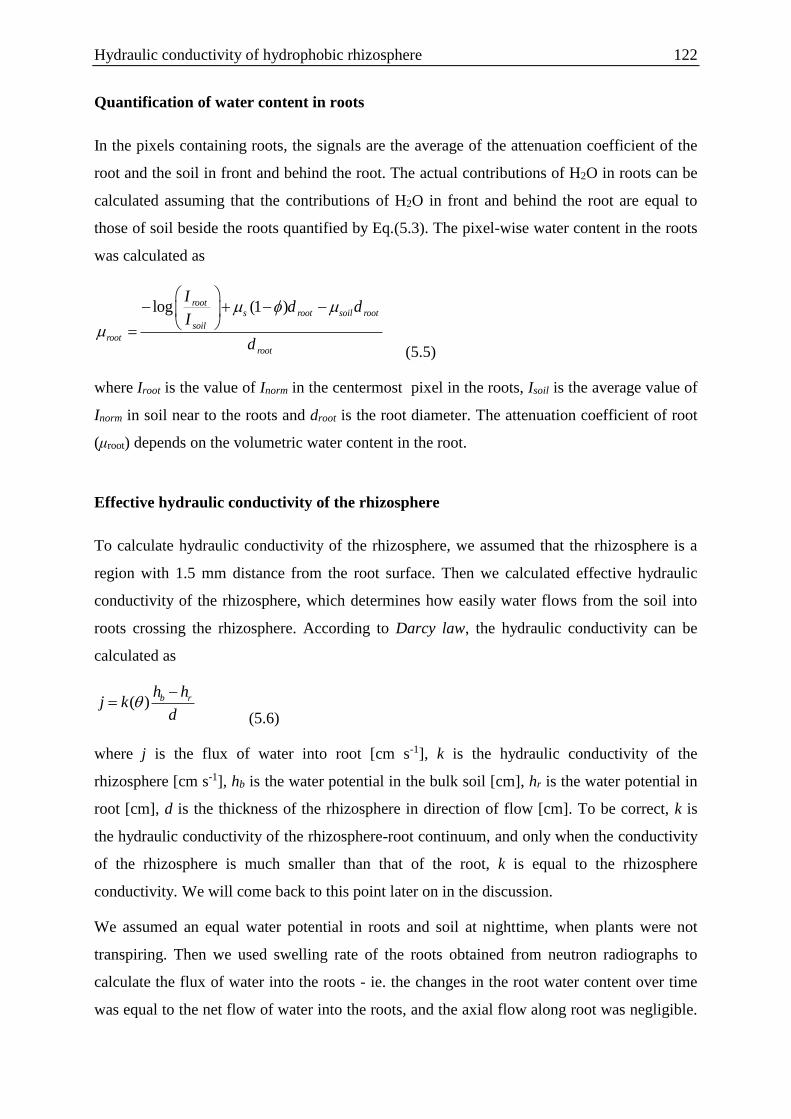
Hydraulic conductivity of hydrophobic rhizosphere 122
Quantification of water content in roots
In the pixels containing roots, the signals are the average of the attenuation coefficient of the
root and the soil in front and behind the root. The actual contributions of H2O in roots can be
calculated assuming that the contributions of H2O in front and behind the root are equal to
those of soil beside the roots quantified by Eq.(5.3). The pixel-wise water content in the roots
was calculated as
log (1 )roots root soil root
soil
root
root
Id d
I
d
(5.5)
where Iroot is the value of Inorm in the centermost pixel in the roots, Isoil is the average value of
Inorm in soil near to the roots and droot is the root diameter. The attenuation coefficient of root
(μroot) depends on the volumetric water content in the root.
Effective hydraulic conductivity of the rhizosphere
To calculate hydraulic conductivity of the rhizosphere, we assumed that the rhizosphere is a
region with 1.5 mm distance from the root surface. Then we calculated effective hydraulic
conductivity of the rhizosphere, which determines how easily water flows from the soil into
roots crossing the rhizosphere. According to Darcy law, the hydraulic conductivity can be
calculated as
( ) b rh hj k
d
(5.6)
where j is the flux of water into root [cm s-1], k is the hydraulic conductivity of the
rhizosphere [cm s-1], hb is the water potential in the bulk soil [cm], hr is the water potential in
root [cm], d is the thickness of the rhizosphere in direction of flow [cm]. To be correct, k is
the hydraulic conductivity of the rhizosphere-root continuum, and only when the conductivity
of the rhizosphere is much smaller than that of the root, k is equal to the rhizosphere
conductivity. We will come back to this point later on in the discussion.
We assumed an equal water potential in roots and soil at nighttime, when plants were not
transpiring. Then we used swelling rate of the roots obtained from neutron radiographs to
calculate the flux of water into the roots - ie. the changes in the root water content over time
was equal to the net flow of water into the roots, and the axial flow along root was negligible.
Chapter 5 123
123
The water potential in soil during infiltration was derived from the water content based on the
measured water retention curve. The relation between water potential, Ψp, [cm], and root
volume was parameterized according to (Stadelmann, 1984)
1.( 1)
(max)
RWC
p p e (5.7)
where Ψp (max) is the maximum water potential in the roots [cm], β is the exponential factor
related to sensitivity the elasticity change with degree of water saturation [-] and RWC is the
relative water content in roots [-]. From this equation it follows that
1
(max)ln ln .( 1)p p RWC (5.8)
To find the value of β for our roots, we assumed that the roots were in equilibrium with the
soil at the beginning and at the end of infiltration experiment. The relative water content of
roots was calculated from the water content of roots divided by the final water content at the
end of the experiment.
Results
We monitored the distribution of water in soil and roots in five samples following a rewetting
cycle. Figure 2 shows the radiographs of one sample in which we infiltrated the sample from
the top with injection of 60 ml H2O. We also presented the results of radiography of one
more samples in the appendix. The radiographs are a close-up of the original field of view of
15.5cm×15.5cm. Images 2a in Figure 2 shows water and roots distribution in the sample
before infiltration. Images 2b-f show the ratio between the actual radiographs at time t and
the radiograph before injection, indicating the changes in water content in both roots and soil
after infiltration. In these images, the dark values correspond to big changes in water content
and bright values to small changes. After infiltration, water content in the bulk soil increased,
but a tiny region in the vicinity of the roots appeared slightly drier (brighter color). This
indicates that the bulk soil was conductive enough to be rewatered quickly while the rewetting
of the rhizosphere was restricted. The slow rewetting of the rhizosphere can be explained by
hydrophobicity of the rhizosphere (Moradi et al., 2012) or formation of air gaps due to
shrinkage of roots (Nobel & Cui, 1992; Nye, 1994; North & Nobel, 1997; Carminati et al.,
2009).
Hydraulic conductivity of hydrophobic rhizosphere 124
Figure 2: Neutron radiographs of sample after a drying period (a) and after rewetting at time t (b-f)
during nighttime. The soil was infiltrated from the top with 60 ml of water. Images 2b-f are differences
between the actual radiographs at time t and the one before infiltration (t=0). In these images the darker
is the image, the wetter is the soil. The bright region around roots indicates a slow rewetting of the
rhizosphere. The images are a close up of the original field of view of (15.5×15.5cm).
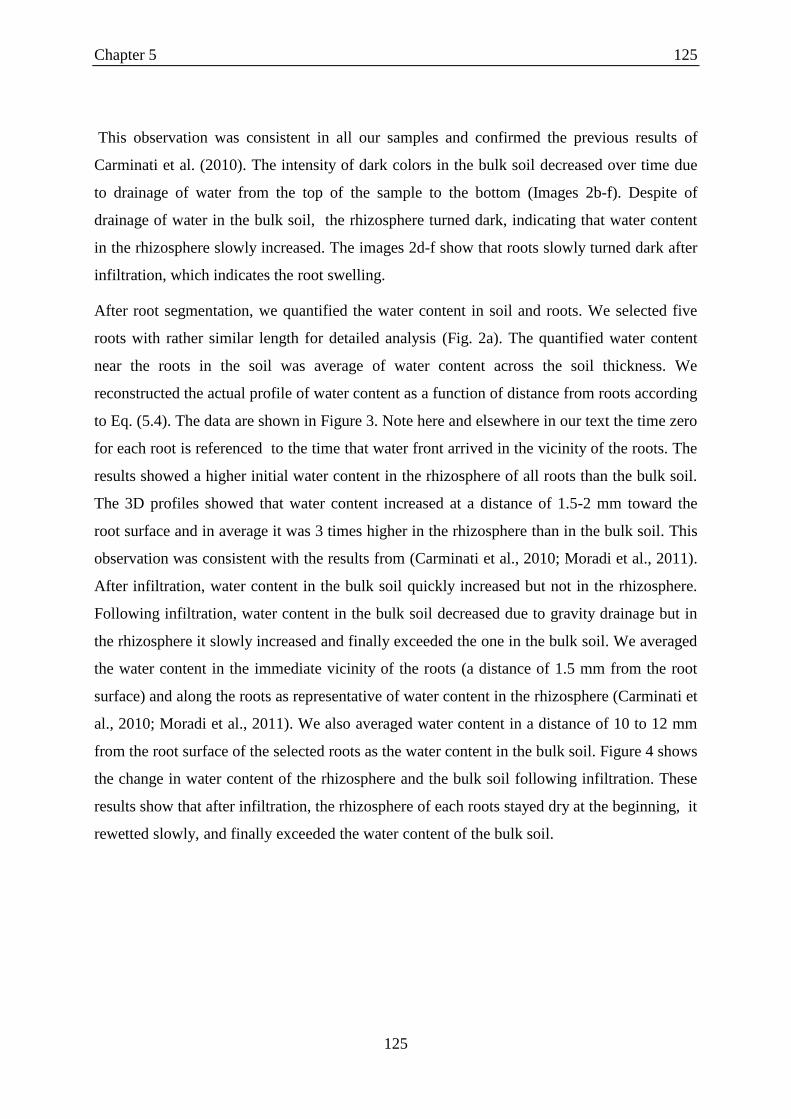
Chapter 5 125
125
This observation was consistent in all our samples and confirmed the previous results of
Carminati et al. (2010). The intensity of dark colors in the bulk soil decreased over time due
to drainage of water from the top of the sample to the bottom (Images 2b-f). Despite of
drainage of water in the bulk soil, the rhizosphere turned dark, indicating that water content
in the rhizosphere slowly increased. The images 2d-f show that roots slowly turned dark after
infiltration, which indicates the root swelling.
After root segmentation, we quantified the water content in soil and roots. We selected five
roots with rather similar length for detailed analysis (Fig. 2a). The quantified water content
near the roots in the soil was average of water content across the soil thickness. We
reconstructed the actual profile of water content as a function of distance from roots according
to Eq. (5.4). The data are shown in Figure 3. Note here and elsewhere in our text the time zero
for each root is referenced to the time that water front arrived in the vicinity of the roots. The
results showed a higher initial water content in the rhizosphere of all roots than the bulk soil.
The 3D profiles showed that water content increased at a distance of 1.5-2 mm toward the
root surface and in average it was 3 times higher in the rhizosphere than in the bulk soil. This
observation was consistent with the results from (Carminati et al., 2010; Moradi et al., 2011).
After infiltration, water content in the bulk soil quickly increased but not in the rhizosphere.
Following infiltration, water content in the bulk soil decreased due to gravity drainage but in
the rhizosphere it slowly increased and finally exceeded the one in the bulk soil. We averaged
the water content in the immediate vicinity of the roots (a distance of 1.5 mm from the root
surface) and along the roots as representative of water content in the rhizosphere (Carminati et
al., 2010; Moradi et al., 2011). We also averaged water content in a distance of 10 to 12 mm
from the root surface of the selected roots as the water content in the bulk soil. Figure 4 shows
the change in water content of the rhizosphere and the bulk soil following infiltration. These
results show that after infiltration, the rhizosphere of each roots stayed dry at the beginning, it
rewetted slowly, and finally exceeded the water content of the bulk soil.
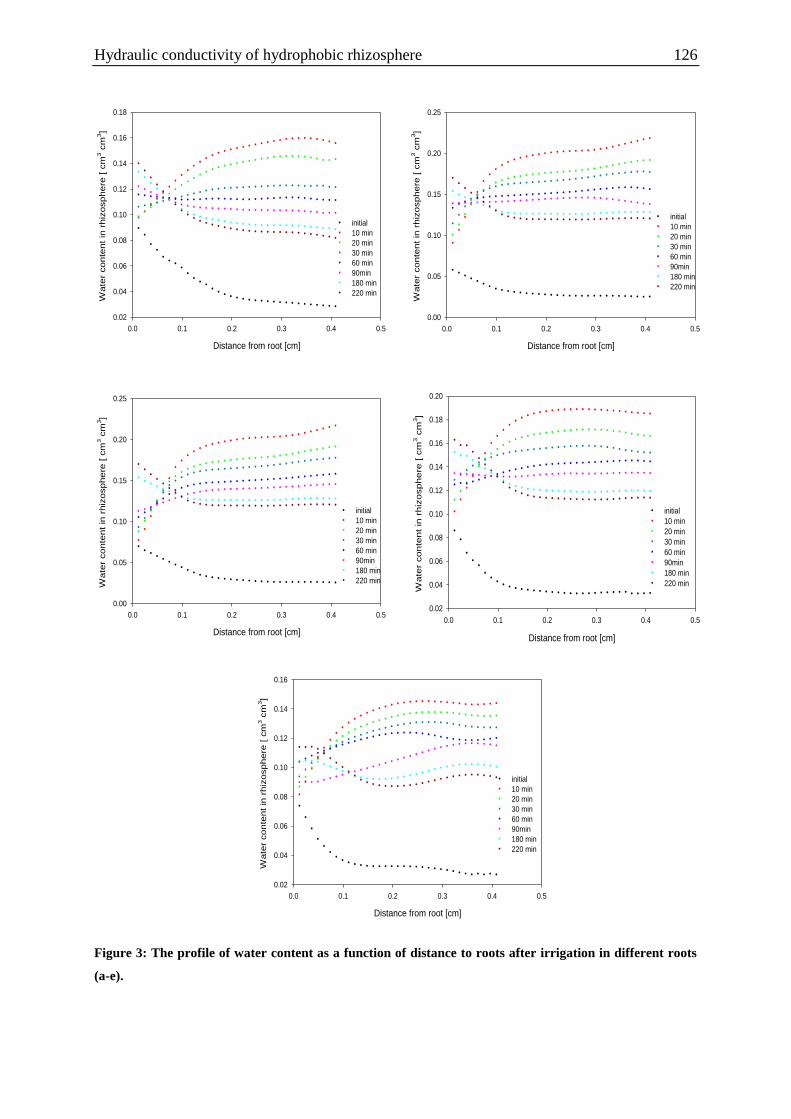
Hydraulic conductivity of hydrophobic rhizosphere 126
Figure 3: The profile of water content as a function of distance to roots after irrigation in different roots
(a-e).
n
otGraphi
Object.1
MBED
a) b)
c) d)
e)
Distance from root [cm]
0.0 0.1 0.2 0.3 0.4 0.5
Wate
r conte
nt
in r
hiz
osphere
[ c
m3 c
m3]
0.02
0.04
0.06
0.08
0.10
0.12
0.14
0.16
0.18
initial
10 min
20 min
30 min
60 min
90min
180 min
220 min
Distance from root [cm]
0.0 0.1 0.2 0.3 0.4 0.5
Wate
r conte
nt
in r
hiz
osphere
[ c
m3 c
m3]
0.00
0.05
0.10
0.15
0.20
0.25
initial
10 min
20 min
30 min
60 min
90min
180 min
220 min
Distance from root [cm]
0.0 0.1 0.2 0.3 0.4 0.5
Wate
r conte
nt
in r
hiz
osphere
[ c
m3 c
m3]
0.00
0.05
0.10
0.15
0.20
0.25
initial
10 min
20 min
30 min
60 min
90min
180 min
220 min
Distance from root [cm]
0.0 0.1 0.2 0.3 0.4 0.5
Wa
ter
co
nte
nt
in r
hiz
osp
he
re [
cm
3 c
m3]
0.02
0.04
0.06
0.08
0.10
0.12
0.14
0.16
0.18
0.20
initial
10 min
20 min
30 min
60 min
90min
180 min
220 min
Distance from root [cm]
0.0 0.1 0.2 0.3 0.4 0.5
Wate
r conte
nt
in r
hiz
osphere
[ c
m3 c
m3]
0.02
0.04
0.06
0.08
0.10
0.12
0.14
0.16
initial
10 min
20 min
30 min
60 min
90min
180 min
220 min
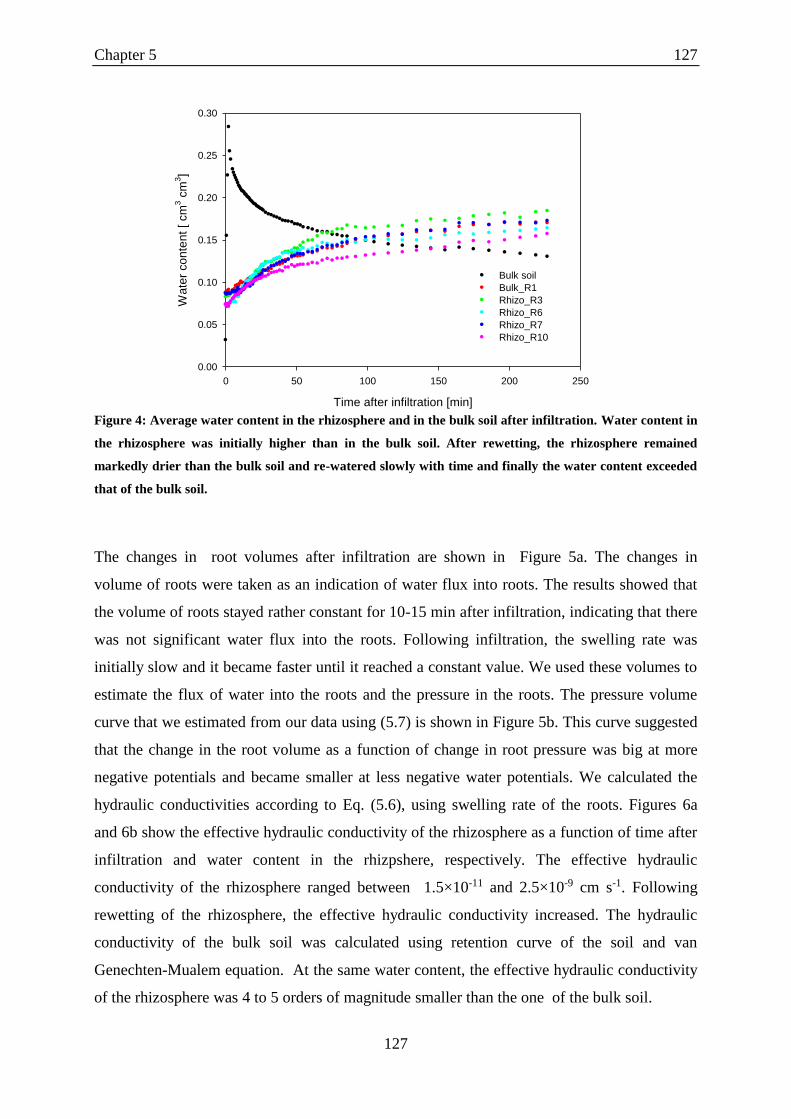
Chapter 5 127
127
Figure 4: Average water content in the rhizosphere and in the bulk soil after infiltration. Water content in
the rhizosphere was initially higher than in the bulk soil. After rewetting, the rhizosphere remained
markedly drier than the bulk soil and re-watered slowly with time and finally the water content exceeded
that of the bulk soil.
The changes in root volumes after infiltration are shown in Figure 5a. The changes in
volume of roots were taken as an indication of water flux into roots. The results showed that
the volume of roots stayed rather constant for 10-15 min after infiltration, indicating that there
was not significant water flux into the roots. Following infiltration, the swelling rate was
initially slow and it became faster until it reached a constant value. We used these volumes to
estimate the flux of water into the roots and the pressure in the roots. The pressure volume
curve that we estimated from our data using (5.7) is shown in Figure 5b. This curve suggested
that the change in the root volume as a function of change in root pressure was big at more
negative potentials and became smaller at less negative water potentials. We calculated the
hydraulic conductivities according to Eq. (5.6), using swelling rate of the roots. Figures 6a
and 6b show the effective hydraulic conductivity of the rhizosphere as a function of time after
infiltration and water content in the rhizpshere, respectively. The effective hydraulic
conductivity of the rhizosphere ranged between 1.5×10⁻¹¹ and 2.5×10⁻⁹ cm s-1. Following
rewetting of the rhizosphere, the effective hydraulic conductivity increased. The hydraulic
conductivity of the bulk soil was calculated using retention curve of the soil and van
Genechten-Mualem equation. At the same water content, the effective hydraulic conductivity
of the rhizosphere was 4 to 5 orders of magnitude smaller than the one of the bulk soil.
Time after infiltration [min]
0 50 100 150 200 250
Wa
ter
co
nte
nt
[ cm
3 c
m3]
0.00
0.05
0.10
0.15
0.20
0.25
0.30
Bulk soil
Bulk_R1
Rhizo_R3
Rhizo_R6
Rhizo_R7
Rhizo_R10
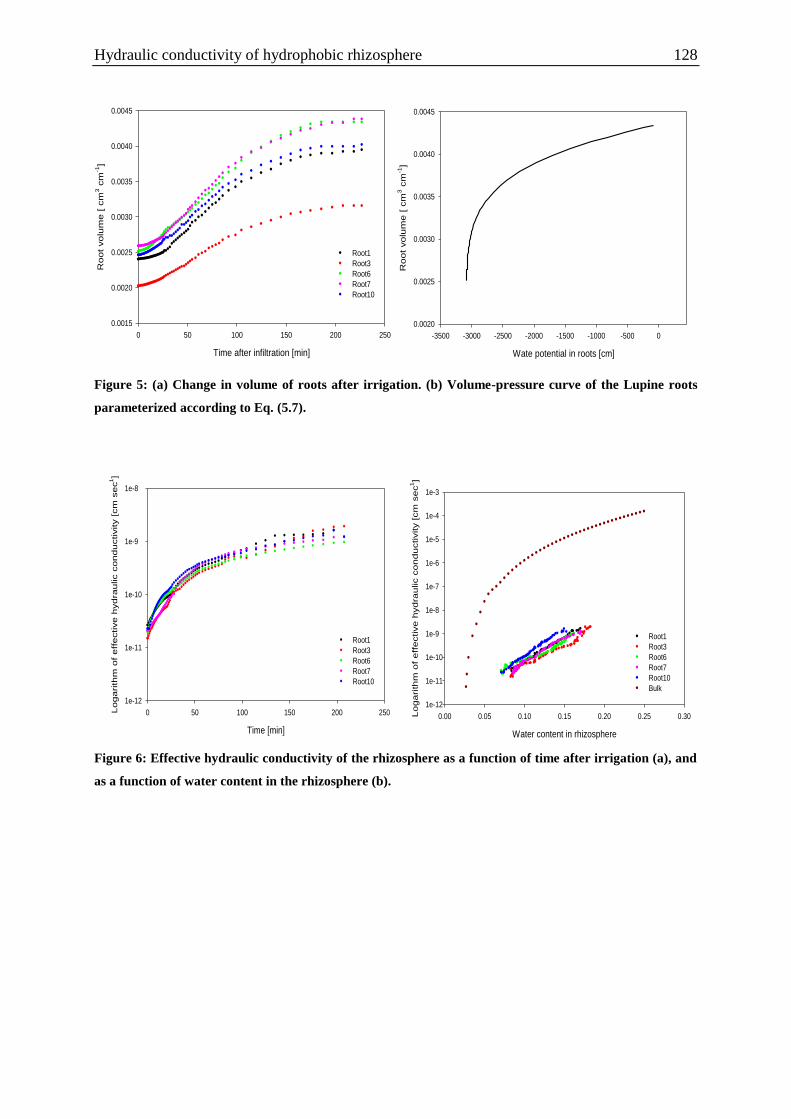
Hydraulic conductivity of hydrophobic rhizosphere 128
Figure 5: (a) Change in volume of roots after irrigation. (b) Volume-pressure curve of the Lupine roots
parameterized according to Eq. (5.7).
Figure 6: Effective hydraulic conductivity of the rhizosphere as a function of time after irrigation (a), and
as a function of water content in the rhizosphere (b).
a) b)
a) b)
Time after infiltration [min]
0 50 100 150 200 250
Ro
ot
vo
lum
e [
cm
3 c
m-1
]
0.0015
0.0020
0.0025
0.0030
0.0035
0.0040
0.0045
Root1
Root3
Root6
Root7
Root10
Time [min]
0 50 100 150 200 250Lo
ga
rith
m o
f e
ffe
ctive
hyd
rau
lic c
on
du
ctivity [
cm
se
c1]
1e-12
1e-11
1e-10
1e-9
1e-8
Root1
Root3
Root6
Root7
Root10
Water content in rhizosphere
0.00 0.05 0.10 0.15 0.20 0.25 0.30Lo
ga
rith
m o
f e
ffe
ctive
hyd
rau
lic c
on
du
ctivity [
cm
se
c1]
1e-12
1e-11
1e-10
1e-9
1e-8
1e-7
1e-6
1e-5
1e-4
1e-3
Root1
Root3
Root6
Root7
Root10
Bulk
Wate potential in roots [cm]
-3500 -3000 -2500 -2000 -1500 -1000 -500 0
Ro
ot
vo
lum
e [
cm
3 c
m-1
]
0.0020
0.0025
0.0030
0.0035
0.0040
0.0045

Chapter 5 129
129
Discussion
Although the ability of plants to take up water from the soil is influenced by the hydraulic
properties of the soil in the immediate vicinity of the root. To date, it has been technically
difficult to quantify the effect of hydrophobicity of the rhizosphere on hydraulic properties of
the soil. This information is urgently required for a better understanding and modelling of
water flow from soil to roots. We previously showed that flux of water into roots was reduced
as the rhizosphere bocame hydrophobic. We explained the reduction of flux by low hydraulic
conductivity of the rhizosphere following a rewetting cycle. To test our hypothesis, we
introduced a technique to estimate effective hydraulic conductivity of the rhizosphere
following a rewetting cycle. To this end, we monitored the distribution of water in soil and
root following a rewetting cycle. Consistent with previous observations (Carminati et al.,
2010; Moradi et al., 2011, 2012), we found that the rhizosphere held more water than the bulk
soil during drying cycle and it stayed temporarily drier than the bulk soil during rewetting
cycle. The hydrophobicity reported by Carminati et al. (2010) and Moradi et al. (2012) stayed
for more than a day following rewetting cycle while in our case the recovery seemed to be
faster. The difference can be due to the different energy state of water in soil. They infiltrated
the samples by capillary rise from bottom while we infiltrated our samples from the top by
applying a positive pressure.
We estimated the effective hydraulic conductivity of the rhizosphere from the swelling rate of
roots. The results showed that the effective hydraulic conductivity of the rhizosphere was 4-5
order of magnitude smaller than one of the bulk soil and it recovered slowly with time. We
explained the low effective hydraulic of rhizosphere due to the temporal hydrophobicity of the
rhizosphere based on the literature evidences which showed a low wettability of the
rhizosphere (Hallett et al., 2003; Read et al., 2003; Moradi et al., 2012). However, one may
also explain this low hydraulic partly by formation of air gaps due to shrinkage of roots in dry
soil (Nobel & Cui, 1992; Nye, 1994; North & Nobel, 1997; Carminati et al., 2009). Degree of
hydrophobicity of the rhizosphere depends on the chemical component of the mucilage, soil
texture, water content, and drying/wetting cycles. Plants exudate vast ranges of chemicals in
soil. There has not been any evidences in the literatures if the quantity and quality of the root
exudate changes in response to environmental conditions such as water stress. We expect a
higher degree of hydrophobicity in the rhizosphere of sandy soil than clay soil, because the
surface area of sand particles for a given volume is smaller and therefore less volume of the
mucilage is needed to cover the soil particles (Ritsema & Dekker, 2003). It is also known that
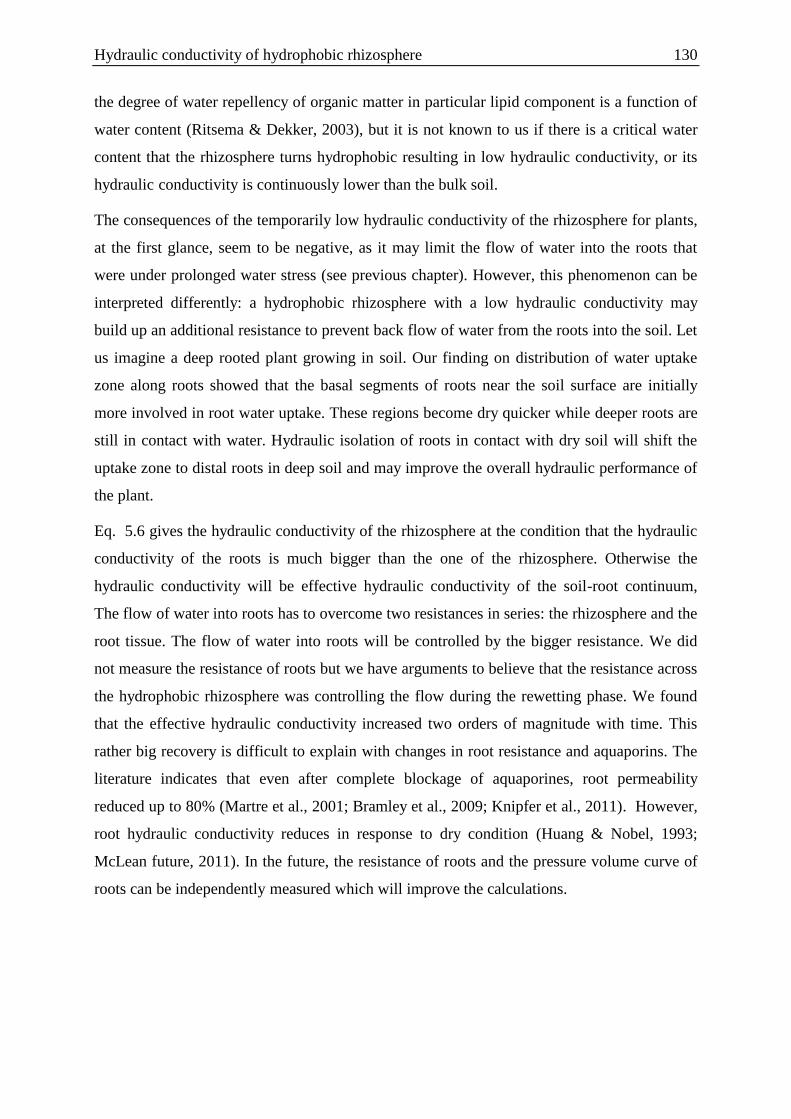
Hydraulic conductivity of hydrophobic rhizosphere 130
the degree of water repellency of organic matter in particular lipid component is a function of
water content (Ritsema & Dekker, 2003), but it is not known to us if there is a critical water
content that the rhizosphere turns hydrophobic resulting in low hydraulic conductivity, or its
hydraulic conductivity is continuously lower than the bulk soil.
The consequences of the temporarily low hydraulic conductivity of the rhizosphere for plants,
at the first glance, seem to be negative, as it may limit the flow of water into the roots that
were under prolonged water stress (see previous chapter). However, this phenomenon can be
interpreted differently: a hydrophobic rhizosphere with a low hydraulic conductivity may
build up an additional resistance to prevent back flow of water from the roots into the soil. Let
us imagine a deep rooted plant growing in soil. Our finding on distribution of water uptake
zone along roots showed that the basal segments of roots near the soil surface are initially
more involved in root water uptake. These regions become dry quicker while deeper roots are
still in contact with water. Hydraulic isolation of roots in contact with dry soil will shift the
uptake zone to distal roots in deep soil and may improve the overall hydraulic performance of
the plant.
Eq. 5.6 gives the hydraulic conductivity of the rhizosphere at the condition that the hydraulic
conductivity of the roots is much bigger than the one of the rhizosphere. Otherwise the
hydraulic conductivity will be effective hydraulic conductivity of the soil-root continuum,
The flow of water into roots has to overcome two resistances in series: the rhizosphere and the
root tissue. The flow of water into roots will be controlled by the bigger resistance. We did
not measure the resistance of roots but we have arguments to believe that the resistance across
the hydrophobic rhizosphere was controlling the flow during the rewetting phase. We found
that the effective hydraulic conductivity increased two orders of magnitude with time. This
rather big recovery is difficult to explain with changes in root resistance and aquaporins. The
literature indicates that even after complete blockage of aquaporines, root permeability
reduced up to 80% (Martre et al., 2001; Bramley et al., 2009; Knipfer et al., 2011). However,
root hydraulic conductivity reduces in response to dry condition (Huang & Nobel, 1993;
McLean future, 2011). In the future, the resistance of roots and the pressure volume curve of
roots can be independently measured which will improve the calculations.
Chapter 5 131
131
Appendix
To reduce the complexity of the measurement, we repeated the same experiment when we
infiltrated the sample from the top with a constant infiltration rate. This helped us to keep the
water content in the bulk soil constant over time. Neutron radiographs of one sample
following of a repeating cycle are shown in Figure 7.
Figure 7: Neutron radiographs of a sample after rewetting at time t (7a and 7b). Images 7b and 7b are a
close up of the original neutron radiographs. In these images the darker color corresponds to a high water
content in the soil. The bright region around roots indicates a slow rewetting of the rhizosphere. Images 7c
and 7d are the differences between actual radiographs at time t and the one 15 minutes after infiltration
when the bulk soil reached to a constant water content. Images 7c and 7d show the changes in water
content in both soil and roots over time. The darker is the image, the bigger is the change in water content
over time. The images are a close up of the original field of view of (15.5×15.5cm)
Hydraulic conductivity of hydrophobic rhizosphere 132
References
Bramley, H., Turner, N.C., Turner, D.W., & Tyerman, S.D. 2009. Roles of morphology,
anatomy, and aquaporins in determining contrasting hydraulic behavior of roots. Plant
Physiol. 150, 348–364.
Carminati, A. 2012. A Model of Root Water Uptake Coupled with Rhizosphere Dynamics.
Vadose Zone J. 11Available
Carminati, A., Moradi, A.B., Vetterlein, D., Vontobel, P., Lehmann, E., Weller, U., Vogel,
H.-J., & Oswald, S.E. 2010. Dynamics of soil water content in the rhizosphere. Plant
Soil 332, 163–176.
Carminati, A., Schneider, C.L., Moradi, A.B., Zarebanadkouki, M., Vetterlein, D., Vogel,
H.J., Hildebrandt, A., Weller, U., Schüler, L., & Oswald, S.E. 2011. How the
Rhizosphere May Favor Water Availability to Roots. Vadose Zone J. 10, 988–998.
Carminati, A., Vetterlein, D., Weller, U., Vogel, H.-J., & Oswald, S.E. 2009. When Roots
Lose Contact. Vadose Zone J. 8, 805.
Chenu, C. 1993. Clay-or sand-polysaccharide associations as models for the interface between
micro-organisms and soil: water related properties and microstructure. Geoderma 56,
143–156.
Czarnes, S., Hallett, P.D., Bengough, A.G., & Young, I.M. 2000. Root-and microbial-derived
mucilages affect soil structure and water transport. Eur. J. Soil. Sci. 51, 435–443.
Gardner, W.R. 1960. Dynamic aspects of water availability to plants. Soil Sci. 89, 63–73.
Gregory, P.J. 2006. Roots, rhizosphere and soil: the route to a better understanding of soil
science? Eur. J. Soil. Sci. 57, 2–12.
Hallett, P.D., Gordon, D.C., & Bengough, A.G. 2003. Plant influence on rhizosphere
hydraulic properties: direct measurements using a miniaturized infiltrometer. New
Phytol. 157, 597–603.
Knipfer, T., Besse, M., Verdeil, J.-L., & Fricke, W. 2011. Aquaporin-facilitated water uptake
in barley (Hordeum vulgare L.) roots. J. Exp. Bot. 62, 4115–4126.
MacFall, J.S., Johnson, G.A., & Kramer, P.J. 1990. Observation of a water-depletion region
surrounding loblolly pine roots by magnetic resonance imaging. Proc. Natl. Acad. Sci.
USA 87, 1203.
Chapter 5 133
133
Martre, P., North, G.B., & Nobel, P.S. 2001. Hydraulic conductance and mercury-sensitive
water transport for roots of Opuntia acanthocarpa in relation to soil drying and
rewetting. Plant Physiol. 126, 352–362.
McCully, M.E., & Boyer, J.S. 1997. The expansion of maize root-cap mucilage during
hydration. 3. Changes in water potential and water content. Physiol. Plantarum 99,
169–177.
Menon, M., Robinson, B., Oswald, S.E., Kaestner, A., Abbaspour, K.C., Lehmann, E., &
Schulin, R. 2007. Visualization of root growth in heterogeneously contaminated soil
using neutron radiography. Eur. J. Soil. Sci. 58, 802–810.
Moradi, A.B., Carminati, A., Lamparter, A., Woche, S.K., Bachmann, J., Vetterlein, D.,
Vogel, H.J., & Oswald, S.E. 2012. Is the rhizosphere temporarily water repellent?
Vadose Zone J. 11.
Moradi, A.B., Carminati, A., Vetterlein, D., Vontobel, P., Lehmann, E., Weller, U., Hopmans,
J.W., Vogel, H.-J., & Oswald, S.E. 2011. Three-dimensional visualization and
quantification of water content in the rhizosphere. New Phytol. 192, 653–663.
Nakashi, T.M. 2005. Water gradient profiles at bean plant roots determined by neutron beam
analysis. J. Radioanal. Nucl. Chem. 264, 313–317.
Nobel, P.S., & Cui, M. 1992. Hydraulic conductances of the soil, the root-soil air gap, and the
root: changes for desert succulents in drying soil. J. Exp. Bot. 43, 319–326.
North, G.B., & Nobel, P.S. 1997. Drought-induced changes in soil contact and hydraulic
conductivity for roots of Opuntia ficus-indica with and without rhizosheaths. Plant
and soil 191, 249–258.
Nye, P.H. 1994. The effect of root shrinkage on soil water inflow. Philos. T. Roy. Soc. B. 345,
395–402.
Or, D., Phutane, S., & Dechesne, A. 2007. Extracellular polymeric substances affecting pore-
scale hydrologic conditions for bacterial activity in unsaturated soils. Vadose Zone J.
6, 298–305.
Read, D.B., Bengough, A.G., Gregory, P.J., Crawford, J.W., Robinson, D., Scrimgeour, C.M.,
Young, I.M., Zhang, K., & Zhang, X. 2003. Plant roots release phospholipid
surfactants that modify the physical and chemical properties of soil. New Phytol. 157,
315–326.
Read, D.B., & Gregory, P.J. 1997. Surface tension and viscosity of axenic maize and Lupine
root mucilages. New Phytol., 623–628.
Read, D.B., Gregory, P.J., & Bell, A.E. 1999. Physical properties of axenic maize root
mucilage. Plant Soil 211, 87–91.
Ritsema, C.J., & Dekker, L.W. 2003. Soil water repellency: Occurrence, consequences, and
amelioration. Elsevier Science.
Segal, E., Kushnir, T., Mualem, Y., & Shani, U. 2008. Microsensing of water dynamics and
root distributions in sandy soils. Vadose Zone J. 7, 1018–1026.
Hydraulic conductivity of hydrophobic rhizosphere 134
Stadelmann, E.J. 1984. The derivation of the cell wall elasticity function from the cell turgor
potential. J. Exp. Bot. 35, 859–868.
Watt, M., McCully, M.E., & Canny, M.J. 1994. Formation and stabilization of rhizosheaths of
Zea mays L.(Effect of soil water content). Plant Physiol. 106, 179–186.
Whalley, W.R., Leeds-Harrison, P.B., Leech, P.K., Riseley, B., & Bird, N.R.A. 2004. The
Hydraulic Properties of Soil At Root-Soil Interface. Soil Sci. 169, 90–99.
Whalley, W.R., Riseley, B., Leeds-Harrison, P.B., Bird, N.R.A., Leech, P.K., & Adderley,
W.P. 2005. Structural differences between bulk and rhizosphere soil. Eur. J. Soil. Sci.
56, 353–360.
Young, I.M. 1995. Variation in moisture contents between bulk soil and the rhizosheath of
wheat (Triticum aestivum L. cv. Wembley). New Phytol. 130, 135–139.

Chapter 6 135
135
Final conclusions


Chapter 6 137
137
Summary
In this thesis, a new method was developed and applied to measure the local flux of water
into the roots of plants growing in soil. The method consists of injecting deuterated water
(D2O) in the soil and tracing its transport into the roots by a time-series neutron radiography.
The experiments were performed at different locations of lupine roots during daytime
(transpiring plants) and nighttime (non-transpiring plants). The objective of the thesis was to
derive the net flow of water into the roots (radial flux). A simple diffusion-convection model
was developed to describe the transport of D2O into the roots. In the model, the increase rate
of D2O concentration in the roots depends on convective (net root water uptake) and diffusive
transport of D2O. The model predicted that the concentration of D2O in roots increases as the
sum of two exponentials. The exponential rates depended on the radial flux of water into the
roots, the axial flux of water along the roots, and the permeability of the root tissue. The
technique was applied to map the fluxes of water into the different locations of roots to
answer the long-standing questions: (i) where roots take up water from soil; and (ii) how the
rhizosphere affects root water uptake.
The measurements showed that root water uptake was not uniform along the root system.
Uptake rate was higher in the upper root zone near the soil surface and it decreased towards
the deep root segments. Along individual roots, water uptake was higher in the proximal parts
and it decreased towards the distal parts. The changes in water uptake with distance along
lateral roots were higher than the changes along the taproot in depth. This suggests a
functional role of the taproot in collecting water from deep root segments and transporting it
to the shoots. Due to the porous nature of roots, the relative importance of radial and axial
resistances determines the profile of water uptake along the roots. A high ratio of the radial to
the axial resistance of the proximal parts of roots, as it was observed along the taproot, will
distribute water uptake zone towards the distal parts. This ratio is expected to change with
root maturation and boundary conditions, such as soil moisture.
The method was applied to assess the effect of the rhizosphere on root water uptake after
drying and consequent rewetting. This experiment rooted from unexpected observations of
water dynamics in the rhizosphere during a drying/wetting cycle. Our results confirmed that
the rhizosphere of roots stayed temporarily dry upon rewetting which was explained with
hydrophobicity of the rhizosphere. The next question was: does such hydrophobicity affect
the rhizosphere conductivity and the fluxes of water into the root? As a first step, a new
method was introduced to estimate the effective hydraulic conductivity of the roots from the
swelling rate of the roots during a rewetting period, which followed a severe drying. The
swelling rates of the roots and rewetting of the rhizosphere were monitored by means of
neutron radiography. After rewetting, the hydraulic conductivity of the rhizosphere remained
markedly lower than that of the bulk soil, and it partly increased as the rhizosphere rewetted.
To answer the question about the effects of hydrophobicity on root water uptake, the
transport of D2O into roots crossing a dry and a wet rhizosphere was monitored. The
experiments showed that flux of water across a hydrophobic rhizosphere were reduced by a
factor of 4 and 8 in short roots (length of 16-17 cm ) and long roots (length of 9-10 cm),
respectively. These results demonstrate for the first time that the rhizosphere affects water
availability to plants. Hydrophobicity of the rhizosphere may have positive or negative
effects on root water uptake. At first glance, the reduction of water into the roots after
rewetting should have a negative impact on the plant water balance. However, it may have
positive effect for plants growing in deep soil with water stored in the subsoil by temporarily
shifting water uptake zone down towards the distal parts of the roots in depth and preventing
the back flow of water from the upper roots in contact with the dry top soil.
Limitations of the method
Calculation of root water uptake based on D2O transport into roots is not trivial and needs the
support of convection-diffusion models. We found that there is no way to interpret this data
without taking into account the structure of the roots. Our model is generalized to the
composite transport of water in the radial direction and it allows a varying importance of the
apoplastic and cell-to-cell pathways. The model was initially thought for roots in which the
apoplastic pathway was the dominant flow path. The model needs to be validated for the case
in which transport of D2O into roots is purely cell-to-cell.
Application of this technique is limited to relatively wet soils. This is due to the increase of
soil water content after injection of D2O. The increase of soil water content after injection
will induce a significant gradient in water potential between soil and roots. In this case, the
flux of water into root will be overestimated. Here, we selected a sandy soil in which the
change in water potential following D2O injection was negligible compared to typical water
potentials in the xylem.
Chapter 6 139
139
To quantify transport of D2O into roots we introduced a simple diffusion-convection model
that assumes: (i) quick diffusion of D2O in the apoplastic pathways of the root cortex; (ii) the
diffusional permeability of cell membranes is constant at the daytime and the nighttime
(independent from transpiration rate). We discussed the validity of these assumptions for
lupine roots in details in chapters 2 and 3. Application of this technique to roots with a
dominant cell-to-cell pathway will probably need an adaptation of the model.
Outlooks
In this study, we developed a new technique to measure the local flux of water into the roots.
The technique was applied to answer the question about where roots take up water from soil
and how rhizosphere affects water uptake.
This technique has a high potential to solve long-standing questions about water relations of
soil and plants under varying and more complex environmental conditions. Future
applications include:
1- Application to other plants than lupines. Comparison between taprooted and fibrous
root systems will reveal the hydraulic functions of different root system.
2- Architectural models of root water uptake are typically lacking of experimental
information on the properties of individual roots. Using the fluxes of water into roots
that are measured with neutron radiography and D2O, is possible to inversely
calculate the distribution of resistances (radial and axial) along the roots.
3- Here, as a first attempt, we averaged transport of D2O along the root length that was
immersed in D2O. In future, it will be possible to numerically solve the diffusion-
convection equations along the root length. The concentration of D2O in the roots will
be fitted locally. This procedure will give information not only about the distribution
of fluxes along the root length immersed in D2O but also the root length beyond that
segment. In this way, the capillary barriers may not be used anymore, as the boundary
conditions do not need to be constant in time.
4- The technique can be applied to the roots growing in soils with heterogeneous water
content. It would be interesting to see how the water uptake zone moves as parts of
the soil become dry. Does water uptake move towards the more distal parts along
laterals or along depth?
5- It was found that water uptake by roots was restricted as the rhizosphere became dry.
Application of the technique to roots grown at different water contents may reveal
whether or not the hydrophobicity can be an adaptive strategy of plants. This would
be possible by comparing the flux of water into roots imposed to different drying
cycle during their growth period. If modifying the rhizosphere is an adaptive strategy
of plants responding to drought stress it should be more pronounced in the samples
with more drying cycle.
6- This technique can be used to investigate the effect of nutrients, salinity, root
maturation, and other external condition on root permeability and root water uptake.
141
Curriculum Vitae
Surname : Zarebanadkouki
First name : Mohsen
Date of birth : 07 Sep 1983
Citizen of : Iran
Education
2002 – 2006 Bachelor’s degree in Soil Science, Department of Soil Science, College
of Agriculture, Vali-e-Asr University of Rafsanjan, Iran
2006 – 2009 Master’s degree in Soil Science with specialization in Soil Physics, Soil
Science Department, College of Agriculture, Isfahan University of
Technology, Isfahan, Iran
2009-2013 Doctoral students in the Soil Hydrology Division of George August
University of Göttigen, Germany