quantitative mapping of active mud volcanism at the...
TRANSCRIPT

ORIGINAL RESEARCH PAPER
Quantitative mapping of active mud volcanism at the westernMediterranean Ridge-backstop contact
Alain Rabaute Æ Nicolas Chamot-Rooke
Received: 30 January 2007 / Accepted: 23 July 2007 / Published online: 6 September 2007
� Springer Science+Business Media B.V. 2007
Abstract Based on a new quantitative analysis of side-
scan sonar data combined with coring, we propose a
revised model for the origin for Mediterranean Ridge mud
volcanism. Image analysis techniques are used to produce a
synthetic and objective map of recent mud flows covering a
640 · 700 km2 area, which represents more than half of
the entire Mediterranean Ridge mud belt. We identify 215
mud flows, extruded during the last 37,000–60,000 years.
This time period corresponds to the limit of penetration of
the sonar, that we evaluate through geoacoustic modeling
of the backscattered signal returned by the mud breccia-
hemipelagites contact, and calibrate by coring. We show
that during this period, at least 96% of the mud volume has
been extruded at the Mediterranean Ridge-Hellenic back-
stop contact, the remaining being scattered over the prism.
We suggest that the source is a Messinian (5–6 Ma) mud
reservoir that remained close to the backstop contact, at
variance with the classical transport-through-the-wedge
model. A revised mud budget indicates that steady-state
input is not needed. We propose that the source layer was
deposited in deep and narrow pre-Messinian basins, sealed
by Messinian evaporites, and finally inverted in post-
Messinian times. Onset of motion of the Anatolia-Aegea
microplate in the Pliocene resulted in change from slow to
fast convergence, triggering shear partitioning at the edges
of the backstop and basin inversion. Mud volcanism initi-
ation is probably coeval with the latest events of this
kinematic re-organization, i.e. opening of the Corinth Gulf
and activation of the Kephalonia fault around 1–2 Ma.
Keywords Mediterranean Ridge � Mud volcanism �Acoustic characterization � Backscatter � Geodynamics �Messinian evaporites � Accretionary prism � Backstop �Strike-slip faults
Introduction
Mud volcanoes have been found in various geological
contexts in the Mediterranean seas, including Tertiary and
Mesozoic basins (Alboran Sea, Black Sea, Levantine
Basin, see Perez Belzuz et al. (1997), Ivanov et al.
(1996b), Netzeband et al. (2006)), Neogene accretionary
prisms (Mediterranean Ridge; Calabrian Prism, see
Ceramicola et al. (2006); Gulf of Cadiz, see Van Rens-
bergen et al. (2005) and Hensen et al. (2007)), and
sedimentary cones (Nile, see Loncke et al. (2004)). In the
Eastern Mediterranean, mud volcanism is present as one
more or less continuous belt along the Mediterranean
Ridge referred to as the Mediterranean Ridge mud diapiric
belt (Limonov et al. 1996). As in other marine accretionary
environments associated with mud volcanism, and in par-
ticular the Barbados prism, the Mediterranean Ridge mud
fields have been related to dewatering of the Mediterranean
sediments incorporated into the prism in the context of
subduction of the African plate beneath the Anatolia plate.
In many accretionary complexes, mud volcanoes are
found close to the frontal thrust—generally within the first
tens of kms of prism—and in several cases seaward of it.
At the eastern end of the Java Trench, mud volcanoes and
mud ridges parallel the thrust front, some 10–15 km
ahead of it (Breen et al. 1986). Mud volcanoes are
reported in the same region ahead of the Flores thrust
(Silver et al. 1986) and Wetar thrust (Breen et al. 1989).
Mud mounds are also described in the proto-thrust zone
A. Rabaute (&) � N. Chamot-Rooke
Laboratoire de Geologie, Ecole normale superieure, CNRS UMR
8538, 24, Rue Lhomond, Paris Cedex 05 75231, France
e-mail: [email protected]
123
Mar Geophys Res (2007) 28:271–295
DOI 10.1007/s11001-007-9031-8

of the eastern Nankai thrust (Kobayashi et al. 1992). Mud
ridges and domes were discovered immediately off the
Burma front in the Bengal plain (Nielsen et al. 2004), as
well as within the prism, in a subduction context. The
best studied example so far is the Barbados accretionary
prism (Brown and Westbrook 1988; Henry et al. 1990; Le
Pichon et al. 1990; Sumner and Westbrook 2001). There,
exhaustive surveys indicate that mud volcanoes are found
evenly scattered in the outer portion of the prism (Brown
and Westbrook 1988).
In contrast with the Barbados accretionary complex,
mud volcanism of the Mediterranean Ridge is not uni-
formly distributed, but concentrates into an inner belt at the
prism-backstop contact (Camerlenghi et al. 1995; Huguen
et al. 2004). This paper addresses the distribution of mud
volcanism with respect to the main geological contacts
(frontal thrust, wedge-backstop backthrust), by use of
multibeam and acoustic data covering the western and
central Mediterranean Ridge. Image analysis techniques
are used to automatically extract mud flows from reflec-
tivity images. The results are validated with available cored
material. We present a map of the mud volcanism that
covers an area of 600 · 740 km, and discuss it in terms of
mud volcanoes distribution within different parts of the
prism. We estimate that 96% of the mud volume is
expelled in the so-called inner belt, the outer belt playing a
marginal role in the overall mud budget. We propose an
alternative to the dewatering wedge model that we call the
‘‘reservoir model’’. In this model, the source for mud
volcanism is assumed to be mud deposited close to the
wedge-backstop contact in deep pre-Messinian forearc
basins, which were later inverted. We test this new scenario
against recent tectonics of the Hellenic arc and Aegean
domain.
Mud volcanism over the western Mediterranean Ridge
Over the last 10 years, the eastern branch of the Mediter-
ranean Ridge has been heavily surveyed and sampled using
side-scan sonar, seismics, submersible, coring, dredging,
and in-situ fluids sampling, with a focus on several
important mud fields: Olimpi, United Nations, Strabo,
Anaximander, Florence Rise, Nile cone (see Fig. 1, labels
f–k). The morphology of the mud volcanoes, their possible
control by tectonic features and the mechanisms of extru-
sion were described (see recent works by Huguen (2001);
Huguen et al. (2004); Zitter (2004); Zitter et al. (2005);
Huguen et al. (2005, 2006)).
0002-
Ionian AbyssalPlain
Sirte Abyssal Plain
LibyanPromontory
Herodotus AbyssalPlain
Nile Cone
Crete
Aegean Sea
LevantineBasin
Cyprus
Greece
Calabria
nPr
ism
Apulian Platform
Me
di
te
rr
a n e a nR
id
ge
Ba
c k s t o p
Hellenic Trenches
Backstop Boundary Thrust Deformation Front
Active Strike-slip
25 mm/yr
Mud volcano fields a. Kephalonia b. Cobblestone c. Médée d. Pan di Zucchero e. Beautemps-Beaupré
f. Olimpi and Prometheus 2 g. United Nations h. Strabo i. Anaximander mountains j. Florence Rise k. Nile cone l. St . Pauli
0002-
0001-
0001-
0001
-
0001-
0004-b
a
de
c
f g
h
i
j
k l
15° 20° 25° 30° 35°30°
35°
40°
Figures 2 and 7
Fig. 1 Geological setting of the Eastern Mediterranean, showing the
Mediterranean Ridge in contact with the Aegean backstop. The empty
stars figure the surveyed mud volcano fields, (a) Kephalonia, (b)
Cobblestone, (c) Pan di Zucchero, (d) Olimpi and Prometheus 2, (e)
United Nations, (f) Strabo, (g) Anaximander Mountains, (h) Nile
Cone, (i) St Pauli. Motion of the backstop with respect to Africa is
taken from Kreemer and Chamot-Rooke (2004). Dashed frame figures
the extent of Figs. 2 and 7
272 Mar Geophys Res (2007) 28:271–295
123

On the other hand, mud fields in the western part of the
Mediterranean Ridge (west of 24� E) remain poorly
known. Two areas were surveyed and cored in this western
portion, mainly by Italian teams:
(1) The Cobblestone area was discovered and investi-
gated during several cruises between 1978 and 1988
(Cita et al. 1981; Ryan et al. 1982; Cita et al. 1982).
It is located southwest of the Peloponnesus, close to
the crest of the Mediterranean Ridge in the Ionian Sea
(Fig. 1, western branch of the Mediterranean Ridge,
label b). Mud volcanism was confirmed by coring and
sonar images (Cita et al. 1981; Ryan et al. 1982;
Limonov et al. 1995).
2) The Pan di Zucchero area is located half-way between
Crete and Libya (Fig. 1, central branch of the Med-
iterranean Ridge, label d), in a broad area that has been
mapped as the highest point of the Mediterranean
Ridge (Camerlenghi et al. 1992, 1995; Hieke et al.
1996). The very top of the Mediterranean Ridge is an
elevation observed west of the Pan di Zucchero 2, and
called Antaeus high (Hieke et al. 1996). Coring and
seismic surveys (Camerlenghi et al. 1992, 1995;
Staffini et al. 1993; Fusi and Kenyon 1996; Hieke
et al. 1996) suggested that the elongated domes that
form the top of the Mediterranean Ridge are actually
mud diapirs, rather than mud volcanoes.
Three new mud fields were identified and named in the
course of this study: the Kephalonia area (Fig. 1, western
branch of the Mediterranean Ridge, label a), the Medee
area (Fig. 1, western branch of the Mediterranean Ridge,
label c), and the Beautemps-Beaupre area (Fig. 1, central
branch of the Mediterranean Ridge, label e). The extension
of the latter was completed during the SIMED-MEDOR cruise
in 2004 (Huguen et al. 2006, not included in this study).
We focus on a large area of 600 · 740 km based on the
MEDEE marine survey of the R/V l’Atalante in the Eastern
Mediterranean. The swath mapping using the Simrad
EM12-D multibeam echo-sounder (operated at 12–13 kHz)
provided a set of detailed bathymetric maps contoured at an
interval of 20 m, and reflectivity images showing the
strength of the sea-floor backscattering of the side-scan
sonar signal. The survey includes the five mud fields
identified in the Mediterranean Ridge west of 24� E,
namely Kephalonia, Cobblestone, Medee, Pan di Zucchero
and Beautemps-Beaupre areas, and was divided into 19
maps at a scale of 1:150,000 (Fig. 2a). Each of them was
analysed in terms of high backscattered intensity patches,
known to indicate fresh mud flows. Marine mammals are
suspected to find these acoustic bright spots by echolocation
and to feed themselves on the abundant associated benthic
fauna (Woodside et al. 2006). The maps were cut so they
overlap each other on their four sides. Finally, we used the
overlapping to check the coherence of the results of the
image analysis between two or more neighbour maps.
Characteristic features extraction from multibeam data
and reflectivity images
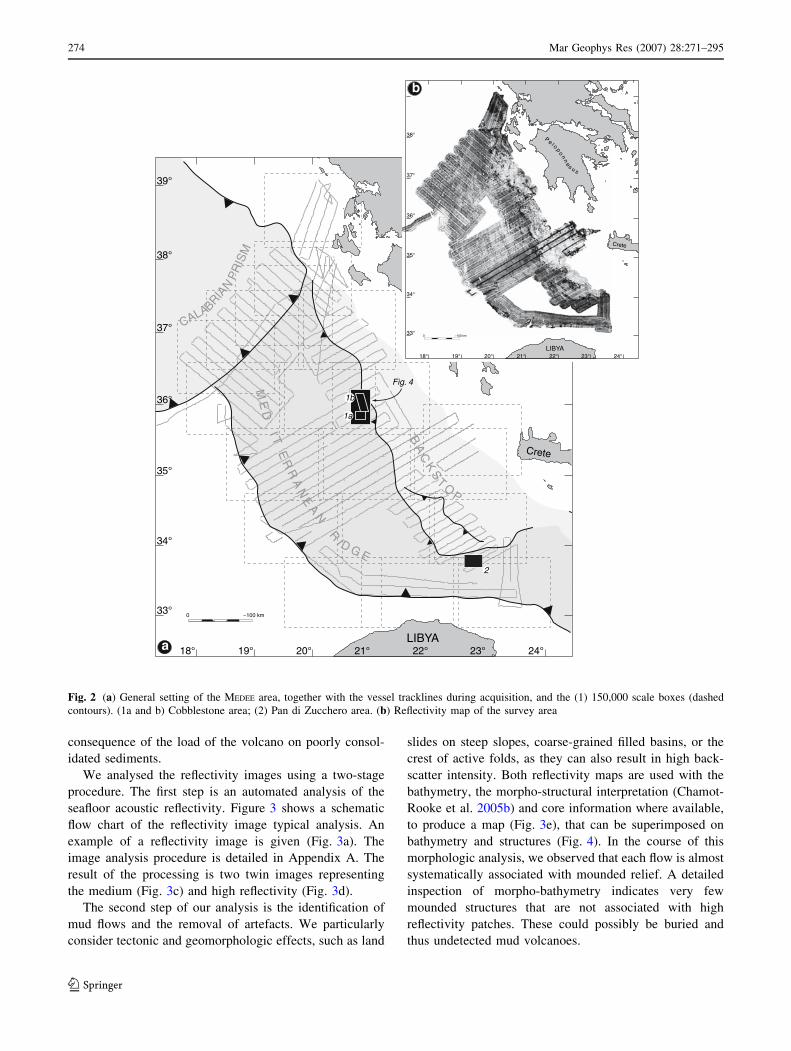
Figure 2b shows an image of the acoustic reflectivity recor-
ded over the Mediterranean Ridge during the MEDEE cruise.
Striking features include the lower backscatter intensity of
the backstop with respect to that of the Mediterranean Ridge,
and the unevenly scattered patches of very high reflectivity
that concentrate at the prism-backstop boundary. This very
strong acoustic backscattering signature and the mound-
shape morphology are two major characteristics of a mud
volcano that we briefly summarize below.
Backscattering of an acoustic wave on a layer of sedi-
ment is the result of two contributions (Hamilton 1980;
Jackson et al. 1986): (1) a surface backscattering at the
interface between water and sediments, and (2) a volume
backscattering, both strongly correlated to the presence of
heterogeneities (e.g. clasts, gas inclusions, carbonate
crusts). The high backscatter intensity on the sea floor
seems to be closely related to the nature of the erupted
material (Cita et al. 1981; Staffini et al. 1993; Zitter et al.
2005). The mud breccia contain clasts and gas which form
the volume scatterers of the acoustic signal (Volgin and
Woodside, 1996). A thorough review of the possible causes
of high backscatter can be found in Zitter et al (2005).
The morphology of a typical mud volcano is charac-
terized by a more or less mounded topography, with a top
culminating between 50 m and 200 m above the regional
sea-floor level (Cita et al. 1981; Ryan et al. 1982;
Camerlenghi et al. 1992). Almost all of the mud volcanoes
investigated and checked in the Mediterranean Ridge have
shown gentle slopes, ranging between 5� and 10�(Camerlenghi et al. 1992; Hieke et al. 1996; Galindo-
Zaldivar et al. 1996). An exception is the Napoli mud
volcano in the Olimpi mud volcano field, which shows
unusual step-like flanks, with slopes up to 16�. Another
characteristic feature of most mud volcanoes is the collapse
ring structure around the principal eruption conduit (Ivanov
et al. 1996b). This rim syncline around the mud dome was
considered to be the result of salt dissolution (Hieke et al.
1996). Other authors consider this explanation as less likely
(Galindo-Zaldivar et al. 1996) as there is no systematic
evidence for salt dissolution (for example depressions
along fault systems, or around smaller mud volcanoes), and
there is ample evidence of collapse structure around mud
volcanoes in areas where salt is not present in the upper
sedimentary section (for example in the Black Sea). These
authors suggest that the ring depressions are probably a
Mar Geophys Res (2007) 28:271–295 273
123
consequence of the load of the volcano on poorly consol-
idated sediments.
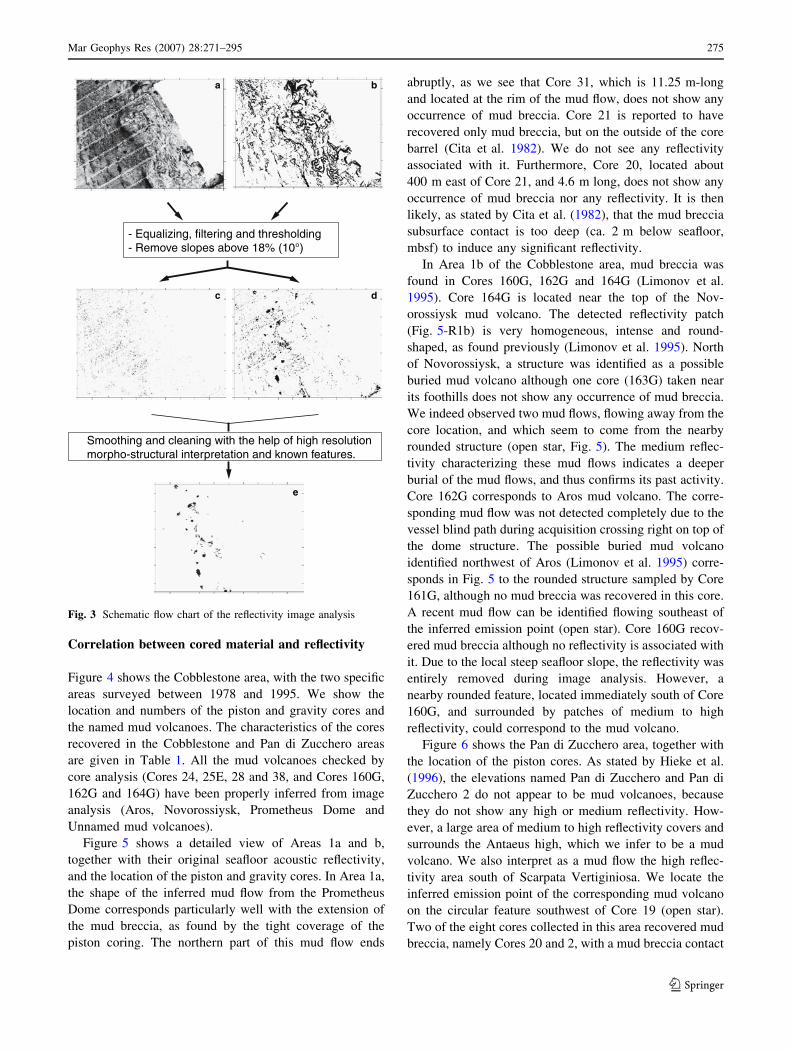
We analysed the reflectivity images using a two-stage
procedure. The first step is an automated analysis of the
seafloor acoustic reflectivity. Figure 3 shows a schematic
flow chart of the reflectivity image typical analysis. An
example of a reflectivity image is given (Fig. 3a). The
image analysis procedure is detailed in Appendix A. The
result of the processing is two twin images representing
the medium (Fig. 3c) and high reflectivity (Fig. 3d).
The second step of our analysis is the identification of
mud flows and the removal of artefacts. We particularly
consider tectonic and geomorphologic effects, such as land
slides on steep slopes, coarse-grained filled basins, or the
crest of active folds, as they can also result in high back-
scatter intensity. Both reflectivity maps are used with the
bathymetry, the morpho-structural interpretation (Chamot-
Rooke et al. 2005b) and core information where available,
to produce a map (Fig. 3e), that can be superimposed on
bathymetry and structures (Fig. 4). In the course of this
morphologic analysis, we observed that each flow is almost
systematically associated with mounded relief. A detailed
inspection of morpho-bathymetry indicates very few
mounded structures that are not associated with high
reflectivity patches. These could possibly be buried and
thus undetected mud volcanoes.
BA
CK
S
TOP
ME
D I T
ER
RA
NE
AN
RI D G E
CALABRIAN P
RIS
M
1a
1b
Fig. 4
2
LIBYA
Crete
Peloponnesus
0 ~100 km
18° 19° 20° 21° 22° 23° 24°
39°
38°
37°
36°
35°
34°
33°
LIBYA
Crete
Pe l o po
nn
e
s u s
0 ~100 km
18° 19° 20° 21° 22° 23° 24°
38°
37°
36°
35°
34°
33°
b
a
Fig. 2 (a) General setting of the MEDEE area, together with the vessel tracklines during acquisition, and the (1) 150,000 scale boxes (dashed
contours). (1a and b) Cobblestone area; (2) Pan di Zucchero area. (b) Reflectivity map of the survey area
274 Mar Geophys Res (2007) 28:271–295
123
Correlation between cored material and reflectivity
Figure 4 shows the Cobblestone area, with the two specific
areas surveyed between 1978 and 1995. We show the
location and numbers of the piston and gravity cores and
the named mud volcanoes. The characteristics of the cores
recovered in the Cobblestone and Pan di Zucchero areas
are given in Table 1. All the mud volcanoes checked by
core analysis (Cores 24, 25E, 28 and 38, and Cores 160G,
162G and 164G) have been properly inferred from image
analysis (Aros, Novorossiysk, Prometheus Dome and
Unnamed mud volcanoes).
Figure 5 shows a detailed view of Areas 1a and b,
together with their original seafloor acoustic reflectivity,
and the location of the piston and gravity cores. In Area 1a,
the shape of the inferred mud flow from the Prometheus
Dome corresponds particularly well with the extension of
the mud breccia, as found by the tight coverage of the
piston coring. The northern part of this mud flow ends
abruptly, as we see that Core 31, which is 11.25 m-long
and located at the rim of the mud flow, does not show any
occurrence of mud breccia. Core 21 is reported to have
recovered only mud breccia, but on the outside of the core
barrel (Cita et al. 1982). We do not see any reflectivity
associated with it. Furthermore, Core 20, located about
400 m east of Core 21, and 4.6 m long, does not show any
occurrence of mud breccia nor any reflectivity. It is then
likely, as stated by Cita et al. (1982), that the mud breccia
subsurface contact is too deep (ca. 2 m below seafloor,
mbsf) to induce any significant reflectivity.
In Area 1b of the Cobblestone area, mud breccia was
found in Cores 160G, 162G and 164G (Limonov et al.
1995). Core 164G is located near the top of the Nov-
orossiysk mud volcano. The detected reflectivity patch
(Fig. 5-R1b) is very homogeneous, intense and round-
shaped, as found previously (Limonov et al. 1995). North
of Novorossiysk, a structure was identified as a possible
buried mud volcano although one core (163G) taken near
its foothills does not show any occurrence of mud breccia.
We indeed observed two mud flows, flowing away from the
core location, and which seem to come from the nearby
rounded structure (open star, Fig. 5). The medium reflec-
tivity characterizing these mud flows indicates a deeper
burial of the mud flows, and thus confirms its past activity.
Core 162G corresponds to Aros mud volcano. The corre-
sponding mud flow was not detected completely due to the
vessel blind path during acquisition crossing right on top of
the dome structure. The possible buried mud volcano
identified northwest of Aros (Limonov et al. 1995) corre-
sponds in Fig. 5 to the rounded structure sampled by Core
161G, although no mud breccia was recovered in this core.
A recent mud flow can be identified flowing southeast of
the inferred emission point (open star). Core 160G recov-
ered mud breccia although no reflectivity is associated with
it. Due to the local steep seafloor slope, the reflectivity was
entirely removed during image analysis. However, a
nearby rounded feature, located immediately south of Core
160G, and surrounded by patches of medium to high
reflectivity, could correspond to the mud volcano.
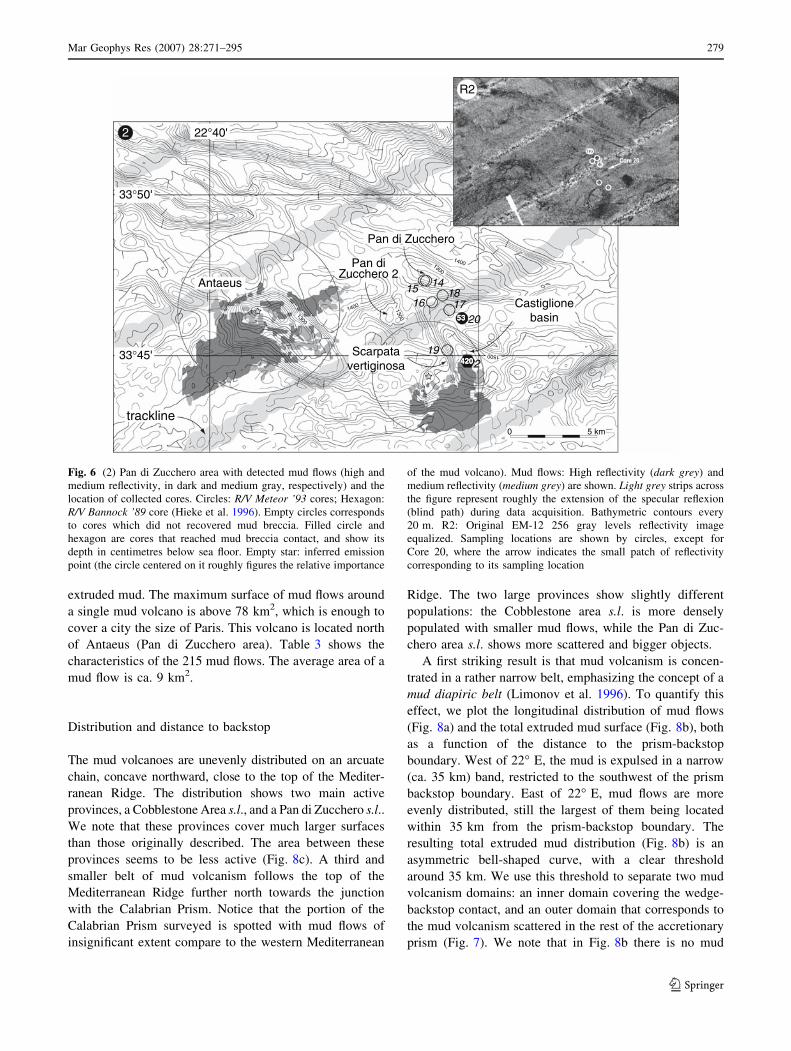
Figure 6 shows the Pan di Zucchero area, together with
the location of the piston cores. As stated by Hieke et al.
(1996), the elevations named Pan di Zucchero and Pan di
Zucchero 2 do not appear to be mud volcanoes, because
they do not show any high or medium reflectivity. How-
ever, a large area of medium to high reflectivity covers and
surrounds the Antaeus high, which we infer to be a mud
volcano. We also interpret as a mud flow the high reflec-
tivity area south of Scarpata Vertiginiosa. We locate the
inferred emission point of the corresponding mud volcano
on the circular feature southwest of Core 19 (open star).
Two of the eight cores collected in this area recovered mud
breccia, namely Cores 20 and 2, with a mud breccia contact
Smoothing and cleaning with the help of high resolution morpho-structural interpretation and known features.
- Equalizing, filtering and thresholding- Remove slopes above 18% (10°)
a b
c d
e
Fig. 3 Schematic flow chart of the reflectivity image analysis
Mar Geophys Res (2007) 28:271–295 275
123

occurring at 0.53 and 4.2 m below the sea floor, respec-
tively. Core 2 is located in Castiglione Basin, at the rim of
the inferred mud flow coming from a nearby local high
(open star). The mud breccia found in this core may be
related to an older, and thus deeper buried, mud flow. Core
20 is located in an intermediate plateau between the Pan di
Zucchero high and the Castiglione Basin. The very small
patch of high reflectivity associated with this core could not
be associated to a closeby rounded structure nor to the
patches of high reflectivity visible nearby (south and
southeast of the core), and was therefore removed. A
general observation about the Pan di Zucchero area is its
higher background reflectivity with respect to Cobblestone
area (compare Figs. 6-R2 with 5-R1a and R1b).
Mud volcanoes statistics and volumetric budget
Size
Figure 7 shows the location and importance of mud vol-
canism in the entire survey area. We individualize 215 mud
flows (Table 2) summing up to a total of 1474.3 km2 of
Prometheusdome
Novorossiyskmud volcano
Arosmud
volcano
0 ~ 5 km
36°
35°50'
36°10'
20°40' 20°50'
1b
1a
29
25B
2120
23B28
2425E
3137
3915
18
16
14
2730
38
3536
33 2632
34
23E
164G
163G
162G
161G
160G
Fig. 4 Detected mud flows and inferred emission points in the
Cobblestone Area. (1a) Area surveyed during R/V Eastward ’78 (cores:
filled circles; (Cita et al. 1981)) and R/V Bannock ’81 (cores: empty
circles; (Cita et al. 1982)) cruises; (1b) Area surveyed during R/VGelendzhik ’94 (cores: filled diamonds; (Limonov et al. 1995)) cruise.
Empty star: inferred emission point (the circle centered on it figures
roughly the relative importance of the mud dome). Mud flows: High
reflectivity (dark grey) and medium reflectivity (medium grey) are shown.
Light grey strips across the figure represent roughly the extension of the
specular reflection (blind path) during data acquisition. Bathymetric
contours every 20 m. On the right is shown the structural interpretation
based on morpho-bathymetry and available seismic profiles
276 Mar Geophys Res (2007) 28:271–295
123

Table 1 Characteristics of the cores recovered in Cobblestone and Pan di Zucchero areas, with corresponding main references
# Lon Lat MBC TCL GL Dev RI GA RL
Bannock ’81 (R/V Bannock), Cobblestone area (Cita et al. 1981, 1982)
21 20�47.430 35�51.170 2 3.10 57.0 3.7 –31.4 53.30 B
23B 20�47.870 35�52.130 9.25 10.59 46.5 3.6 –35.9 39.43 B
18 20�46.780 35�52.030 no br. 3.80 60.4 8.8 –29.9 M (slope)
14 20�44.800 35�52.180 no br. 0.88 57.0 6.6 –31.4 B
15 20�46.620 35�52.320 no br. 4.32 54.9 7.8 –32.3 B
20 20�47.150 35�51.200 no br. 4.65 54.1 4.4 –32.7 B
25B 20�47.870 35�50.130 no br. 0.73 48.9 8.6 –34.9 B
16 20�46.130 35�52.170 no br. 2.85 45.5 3.1 –36.4 B
Cobblestone project ’78 (R/V Eastward), Cobblestone area (Ryan et al. 1982)
24 20�48.370 35�51.080 0.39 1.30 75.2 3.7 –23.5 65.03 H
25E 20�48.580 35�50.900 1.25a 1.84 69.1 3.1 –26.2 72.87 H
28 20�47.630 35�51.430 0.57 1.32 73.9 3.3 –24.1 50.62 H
38 20�48.180 35�50.800 0.81 1.39 65.1 5.0 –27.9 70.14 M
30 20�50.530 35�50.330 no br. 9.31 63.8 4.8 –28.5 M
27 20�49.970 35�50.080 no br. 7.07 56.1 5.7 –31.8 B
32 20�51.300 35�51.450 no br. 11.55 53.6 6.0 –32.9 B
37 20�48.000 35�52.220 no br. 2.00 53.6 3.9 –32.9 B
26 20�50.780 35�51.370 no br. 7.76 52.2 14.2 –33.5 B
39 20�47.670 35�52.370 no br. 1.88 46.5 5.2 –35.9 B
35 20�50.420 35�51.380 no br. 5.57 40.3 9.0 –38.6 B
33 20�50.580 35�51.350 no br. 2.94 30.8 5.3 –42.8 B
36 20�50.400 35�51.550 no br. 3.01 26.8 9.0 –44.5 B
34 20�50.550 35�51.520 no br. 2.01 23.6 11.6 –45.9 B
23E 20�49.650 35�50.830 no data
29 20�48.620 35�49.800 no data
31 20�48.470 35�51.900 no data
Bannock ’89 (R/V Bannock), Pan di Zucchero area (Hieke et al. 1996)
20 22�48.400 33�46.170 0.53 1.95 64.2 4.8 –28 53.52 M
2 22�49.630 33�44.820 4.2 5.01 62.5 4.8 –29 24.86 M
19 22�48.870 33�45.170 no br. 4.61 66.4 4.9 –27.3 H (slope)
18 22�48.680 33�46.870 no br. 5.08 63.5 9.2 –28.6 M
15 22�48.000 33�47.330 no br. 2.37 62.8 4.7 –28.9 M
14 22�48.070 33�47.330 no br. 2.26 61.6 4.3 –29.4 M
16 22�48.280 33�46.670 no br. 0.70 58.2 6.5 –30.9 M
17 22�48.930 33�46.430 no br. 5.03 51.4 5.1 –33.8 B
TTR-4 (R/V Gelendzhik), Cobblestone area (Limonov et al. 1995)
160G 20�48.60 36�08.90 0.15 1.40 74.0 9.5 –24.0 69.96 H
162G 20�51.30 36�00.80 0.2 2.17 72.6b 5.4b –24.6b 70.44 H (specular)
164G 20�53.00 35�55.30 0.2 1.95 81.9 3.9 –20.6 30.47 H
161G 20�50.60 36�02.00 no br. 3.89 55.4 4.4 –32.1 B
163G 20�51.90 35�58.60 no br. 3.73 62.6 4.7 –29.0 M
Columns numbering: #, Core number; Lon, Longitude (d:m:s E); Lat, Latitude (d:m:s N); MBC, Depth of mud breccia contact (mbsf); no br., no
mud breccia; TCL, Total core length (mbsf); GL, Reflectivity (gray level); DEV, Std Dev; RI, Retrodiffusion Index (dB m–2); GA, Grazing angle
hg (degree) for the insonified core location (only for cores with mud breccia); RL, Reflectivity level, B, Background; M, Medium; H, Higha See Ryan et al. (1982, Fig. 4)b Because of specular perturbation, reflectivity was taken on a nearby location on the same mud flow (see text and Fig. 5-1b)
Mar Geophys Res (2007) 28:271–295 277
123

3000
3 0 0 0
3100 3 2 0 0
2 9 0 0
2 9 0 0
2 9 0 0 3 0 0 0
300 0
2900
2 9 0 0
2 9 0 0
1b
1a
35°50'
20°50'
36°
20°50'
29
25B
21 20
23B 28
24 25E
31 37
39 15
18
16
14
27
30 38
35
36
33 26 32
34
23E
164G
162G
160G
80
60
200
125
925
45
20
15
20
R1a
Aphrodite crater
Ares crater
Eros
Poseidon
Prometheus dome
Novorossiysk mud volcano
Aros mud volcano
0 1 2 km
R1b 161G
163G
Fig. 5 Cobblestone area 1a and
1b (see Figs. 2 and 4) with
detected mud flows (high and
medium reflectivity) and the
location of sedimentary cores.
Empty circles and diamonds
correspond to cores which did
not recovered mud breccia.
Filled circles and diamonds are
cores that reached mud breccia
contact, and show its depth in
centimetres below sea floor.
Square pointed by an arrow
indicates the location where the
reflectivity for Core 162G was
taken. (R1a and R1b) Original
EM-12 256 gray levels
reflectivity images equalized for
the corresponding areas.
Sampling locations are shown
by diamonds and circles
278 Mar Geophys Res (2007) 28:271–295
123
extruded mud. The maximum surface of mud flows around
a single mud volcano is above 78 km2, which is enough to
cover a city the size of Paris. This volcano is located north
of Antaeus (Pan di Zucchero area). Table 3 shows the
characteristics of the 215 mud flows. The average area of a
mud flow is ca. 9 km2.
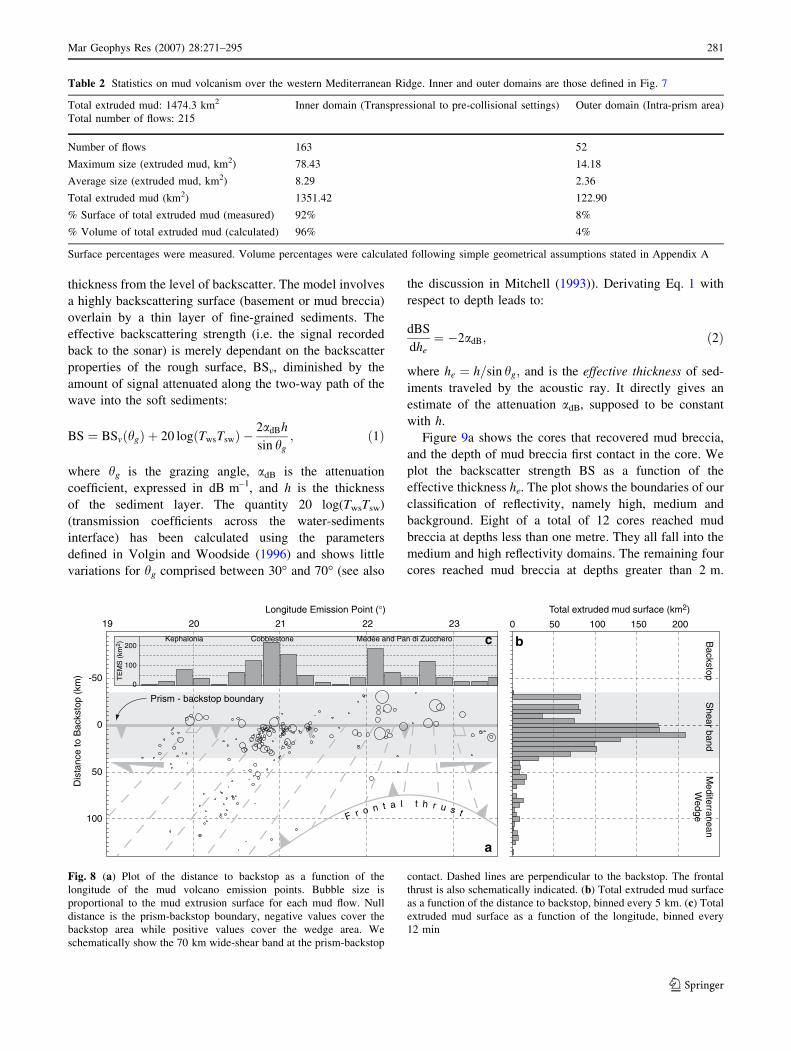
Distribution and distance to backstop
The mud volcanoes are unevenly distributed on an arcuate
chain, concave northward, close to the top of the Mediter-
ranean Ridge. The distribution shows two main active
provinces, a Cobblestone Area s.l., and a Pan di Zucchero s.l..
We note that these provinces cover much larger surfaces
than those originally described. The area between these
provinces seems to be less active (Fig. 8c). A third and
smaller belt of mud volcanism follows the top of the
Mediterranean Ridge further north towards the junction
with the Calabrian Prism. Notice that the portion of the
Calabrian Prism surveyed is spotted with mud flows of
insignificant extent compare to the western Mediterranean
Ridge. The two large provinces show slightly different
populations: the Cobblestone area s.l. is more densely
populated with smaller mud flows, while the Pan di Zuc-
chero area s.l. shows more scattered and bigger objects.
A first striking result is that mud volcanism is concen-
trated in a rather narrow belt, emphasizing the concept of a
mud diapiric belt (Limonov et al. 1996). To quantify this
effect, we plot the longitudinal distribution of mud flows
(Fig. 8a) and the total extruded mud surface (Fig. 8b), both
as a function of the distance to the prism-backstop
boundary. West of 22� E, the mud is expulsed in a narrow
(ca. 35 km) band, restricted to the southwest of the prism
backstop boundary. East of 22� E, mud flows are more
evenly distributed, still the largest of them being located
within 35 km from the prism-backstop boundary. The
resulting total extruded mud distribution (Fig. 8b) is an
asymmetric bell-shaped curve, with a clear threshold
around 35 km. We use this threshold to separate two mud
volcanism domains: an inner domain covering the wedge-
backstop contact, and an outer domain that corresponds to
the mud volcanism scattered in the rest of the accretionary
prism (Fig. 7). We note that in Fig. 8b there is no mud
0 5 km
trackline
Pan di Zucchero
Pan diZucchero 2
Antaeus
Scarpatavertiginosa
Castiglionebasin
0041
0041
0051
0031
0031
0031
33°50'
33°45'
22°40'
1415 1816
2017
192
2
420
53
420
53
R2
Fig. 6 (2) Pan di Zucchero area with detected mud flows (high and
medium reflectivity, in dark and medium gray, respectively) and the
location of collected cores. Circles: R/V Meteor ’93 cores; Hexagon:
R/V Bannock ’89 core (Hieke et al. 1996). Empty circles corresponds
to cores which did not recovered mud breccia. Filled circle and
hexagon are cores that reached mud breccia contact, and show its
depth in centimetres below sea floor. Empty star: inferred emission
point (the circle centered on it roughly figures the relative importance
of the mud volcano). Mud flows: High reflectivity (dark grey) and
medium reflectivity (medium grey) are shown. Light grey strips across
the figure represent roughly the extension of the specular reflexion
(blind path) during data acquisition. Bathymetric contours every
20 m. R2: Original EM-12 256 gray levels reflectivity image
equalized. Sampling locations are shown by circles, except for
Core 20, where the arrow indicates the small patch of reflectivity
corresponding to its sampling location
Mar Geophys Res (2007) 28:271–295 279
123
volcanism farther than 128 km, indicating very little
activity within the post-Messinian wedge.
Table 2 shows the statistics for the two domains. About
76% of the mud flows are located in the inner domain, and
contribute to 92% of the total mud extrusion surface. The
largest mud flows are also located in the inner domain.
Mud flows are significantly smaller in the outer domain
(prism), the size of the volcanoes varying mainly between
0 km2 and 5 km2. The average mud flow area is at least
four times smaller than in the inner domain (2 vs. 9 km2).
Age of the mud flows
The age of the flows detected by sonar imagery is obvi-
ously much younger than the age of the volcanoes. Flows
are rapidly buried beneath a thin layer of hemipelagic
sediments, at a depth greater than the detection limit of the
sonar. This implies that we detect only the latest flows
related to the recent activity of the volcano. A simple
acoustic model was explored by Mitchell (1993), using
GLORIA sidescan sonar data to estimate sediment
Inner domain
Outer domain
atad on
no data
BA
CK
ST
OP
ME
DI
TE
RR
A
NE
AN
R I D EG
CAAL
BAI
RN
DE
WG
E
FK
LIBYA
eterC
P e l o po
nn
e
s u s
0 ~100 km
18° 19° 20° 21° 22° 23° 24°
39°
38°
37°
36°
35°
34°
33°
Fig. 7 Detected mud flows in the western Mediterranean Ridge, in
black. Dashed line: Prism-backstop boundary. KF: Kephalonia fault.
For the Mediterranean Ridge, inner and outer domains encompass
mud volcanism closer than, and farther than 35 km from the prism
backstop boundary, respectively. Black squares represent the total
mud flow surface at true scale, for each domain (Inner domain:
36.8 · 36.8 km2, 92% of the total mud surface; Outer domain:
11.1 · 11.1 km2, 8% of the total mud surface)
280 Mar Geophys Res (2007) 28:271–295
123
thickness from the level of backscatter. The model involves
a highly backscattering surface (basement or mud breccia)
overlain by a thin layer of fine-grained sediments. The
effective backscattering strength (i.e. the signal recorded
back to the sonar) is merely dependant on the backscatter
properties of the rough surface, BSv, diminished by the
amount of signal attenuated along the two-way path of the
wave into the soft sediments:
BS ¼ BSvðhgÞ þ 20 logðTwsTswÞ �2adBh
sin hg; ð1Þ
where hg is the grazing angle, adB is the attenuation
coefficient, expressed in dB m–1, and h is the thickness
of the sediment layer. The quantity 20 log(TwsTsw)
(transmission coefficients across the water-sediments
interface) has been calculated using the parameters
defined in Volgin and Woodside (1996) and shows little
variations for hg comprised between 30� and 70� (see also
the discussion in Mitchell (1993)). Derivating Eq. 1 with
respect to depth leads to:
dBS
dhe¼ �2adB; ð2Þ
where he ¼ h=sin hg; and is the effective thickness of sed-
iments traveled by the acoustic ray. It directly gives an
estimate of the attenuation adB, supposed to be constant
with h.
Figure 9a shows the cores that recovered mud breccia,
and the depth of mud breccia first contact in the core. We
plot the backscatter strength BS as a function of the
effective thickness he. The plot shows the boundaries of our
classification of reflectivity, namely high, medium and
background. Eight of a total of 12 cores reached mud
breccia at depths less than one metre. They all fall into the
medium and high reflectivity domains. The remaining four
cores reached mud breccia at depths greater than 2 m.
-50
0
50
100
19 20 21 22 23
Longitude Emission Point (°)
)mk( potskca
B o t ecnatsiD
0 50 100 150 200
Total extruded mud surface (km2)
naen
arre
t id e
Meg
deW
Prism - backstop boundary
dnab
rae
hS
pots
kca
B
a
b
F r o n t a l t h r u s t
0
100
200
mk( S
ME
T2 ) cKephalonia Cobblestone Médée and Pan di Zucchero
Fig. 8 (a) Plot of the distance to backstop as a function of the
longitude of the mud volcano emission points. Bubble size is
proportional to the mud extrusion surface for each mud flow. Null
distance is the prism-backstop boundary, negative values cover the
backstop area while positive values cover the wedge area. We
schematically show the 70 km wide-shear band at the prism-backstop
contact. Dashed lines are perpendicular to the backstop. The frontal
thrust is also schematically indicated. (b) Total extruded mud surface
as a function of the distance to backstop, binned every 5 km. (c) Total
extruded mud surface as a function of the longitude, binned every
12 min
Table 2 Statistics on mud volcanism over the western Mediterranean Ridge. Inner and outer domains are those defined in Fig. 7
Total extruded mud: 1474.3 km2
Total number of flows: 215
Inner domain (Transpressional to pre-collisional settings) Outer domain (Intra-prism area)
Number of flows 163 52
Maximum size (extruded mud, km2) 78.43 14.18
Average size (extruded mud, km2) 8.29 2.36
Total extruded mud (km2) 1351.42 122.90
% Surface of total extruded mud (measured) 92% 8%
% Volume of total extruded mud (calculated) 96% 4%
Surface percentages were measured. Volume percentages were calculated following simple geometrical assumptions stated in Appendix A
Mar Geophys Res (2007) 28:271–295 281
123

Three of them fall in the background domain. Core 2
(Castiglione Basin) shows a medium backscatter strength
but we still consider it as part of the background noise
because of an overall higher average reflectivity of the Pan
di Zucchero area.
A first-order interpretation is that mud breccias at
sub-seafloor depths of less than 2.25 m do contribute to the
backscattering strength, whereas deeper mud breccia
signal, if any, is lost into the background signal. Unfortu-
nately, the interval 125–200 cm is not sampled. The plot
also shows that in the 0–125 cm interval, reflectivity is
rapidly decreasing with depth. A least-squares fit using
the constant attenuation model (Eq. 1; see Appendix C)
through these data gives an attenuation a of
2.0 ± 0.7 dB m–1 in our data depth interval (20–125 cm).
Converted into dB m–1 kHz–1, equivalent to Hamilton’s
constant k (Hamilton 1972), we find k = 0.16 ± 0.06 dB
m–1 kHz–1. These values are in the range of those quoted
by Gorgas et al. (2002) in superficial unconsolidated fine-
grained sediments.
We note that the maximum depth of detection of the
sonar is different than the depth of penetration: a mud
breccia can eventually be reached at depth below the
detection level, but the corresponding signal is lost in
the background level. We estimate from Fig. 9 that the
maximum depth of detection lies between 100 cm and
225 cm. This plot further suggests that the backscatter
strength is correlated to the depth of burial of the mud
breccia layer (i.e. the thickness of the overlying pelagic
sediments), at least in the Cobblestone area s.l.. The nature
of the pelagic sedimentary cover may account also for
variations in reflectivity intensity, especially for the
00
100
200
300
400
500
600
B32 eroC
50 100 150 200
Sedimentation rate(cm/kyr)
Time (kyr)
3.76 cm/kyr
3.08 cm/kyr
2.32 cm/kyr
)fsb mc( htpe
D
S1
Y5
S3
S4
S5
S7
Fig. 10 Sedimentation rates calculated from the location of sapropels
S1 to S7, and tephra Y5, in Core 23B
-38.8
-34.4
-30.1
-25.8
-21.5
-17.1
40
60
70
80
900 1 2 3 4 5 9 10 14 15
Effective depth (he; mbsf)
( htgnerts rettacskcaB
SB
)Bd ;
muidem
hgihdnuor gkcab y ti
v itc e
lfe r
w a
R
a
3820
25E
28
24
160G162G
164G
2
21
23B
58
66
83
-31
-27.5
-20
-162G
164G
160G 24
28
25E
20 38
-20
-27.5
0-18
-31
1.4 b
-15
-10
-5
0
300 60 90Grazing Angle (°)
)Bd( ssoL
0.25 m
0.50 m
1.25 m
1.50 m
1.75 m
2.00 m
2.25 m
0.75 m
1.00 m
Fig. 9 (a) Backscatter strength of the seafloor plotted against depth
of mud breccia contact. The backscatter strength is averaged over
500 m2 centred on the core location (uncertainty is one standard
deviation). Only the black dots were used for the fit. The shaded dots
are considered to be within the background noise. The limits are the
original medium (128) and high reflectivities (192) limits,
recalculated for the raw (not equalized) image, and their correspond-
ing backscatter strengths (in a 256 gray levels scale). The inset is a
enlargement between he = 0 and 1.4, showing the linear fit. (b) Loss
of sound energy from attenuation in sediments as a function of
grazing angle for different thicknesses of sediment layer, calculated
for a = 2.0 dB m–1
282 Mar Geophys Res (2007) 28:271–295
123
background reflectivity, as we see a striking difference in
the overall reflectivity between the Cobblestone area
(Fig. 5-R1a and R1b) and the Pan di Zucchero area (Fig. 6-
R2). However, we think that this effect is minor in the
interpretation of backscatter intensities. Another cause of
variation in the reflectivity pattern is the nature of the mud
breccia, and particularly the size and shape of the included
clasts, which can increase the roughness of the sediment-
breccia interface. The mud breccia recovered in the cores
used in the present study (see Tables 1 and 2) contains
generally 10–15% of angular to subrounded, millimetric to
centimetric clasts. The maximum size was found to be
7 cm for Cobblestone area, and 5 cm for Pan di Zucchero
area, which is close to the probable maximum size of clasts
which can be recovered by coring. However, it is known
that clasts in mud breccia can reach much bigger sizes.
During ODP Leg 160, Formation MicroScanner downhole
geophysical logs showed clasts of up to 50 cm in size
(Robertson and Shipboard Scientific Party 1996), and
during the fifth cruise of the Training-Through-Research
program, underwater video encountered blocks larger than
5 m across inside a mud volcano crater (Cronin et al.
1997). Although we cannot rule out that these variations
impact the reflectivity level, the depth of burial seems to be
the first order effect (see Fig. 9a).
Figure 10 shows the sedimentation rate for the last
200,000 years calculated from the positions of sapropels
S1 to S7 and tephra Y5 in Core 23B. The ages of the
markers were taken from Kroon et al. (1998). For the last
100,000 years, the sedimentary rate is 38 m/m.y. The
potential maximum depth of detection of the sonar being
225 cm, we suggest that we have detected all mud flows
younger than 60,000 years. The deepest mud breccia
contact observed in the cores is at 125 cm (Core 25E; Ryan
et al. (1982)), immediately overlain by tephra Y5
(37,000 years). Consequently, amongst the 215 identified
mud flows, the age of the last eruption varies between 0
(subactive) and 37,000–60,000 years.
Discussion
Episodicity of mud eruption
Mud volcanoes of the Mediterranean Ridge have been
described as active or inactive on the basis of various
characteristics: age of the mud flows, type of mud breccia,
presence of fluids and gases expulsion, amount of subsi-
dence, strength of acoustic reflectivity. We interpret these
to relate to a wide range of timescales and physical pro-
cesses. The episodicity of eruptions has been proven by
coring (reworking of mud breccia), drilling (long period of
pelagic sedimentation in between mud flows), and
numerical modeling (Kopf and Behrmann 2000). Sche-
matically, a resting period greater than 105 years was found
in Milano volcano between two mud extrusion periods
(Robertson and Shipboard Scientific Party 1996), while
reworking of mud breccia in metres-long cores indicates
episodicity probably shorter than 103 years. Similarly,
mousse-like mud breccia, because of its highly gaseous
nature, may be an even more recent sign of activity. Such
type of mud breccia has been recently found outcropping in
a small number of mud volcanoes, Napoli and Milano
(Robertson and Shipboard Scientific Party 1996), Dublin
and Stoke-on-Trent (Ivanov et al. 1996a) and in our area
Novorossyisk (Limonov et al. 1995). All of them are
characterized by strong reflectivity patterns, except Napoli,
which shows an almost blank pattern, with a marked moat
surrounding a darker center (Kopf et al. 2001, their
Fig. 4A). Significant gas/fluid emission activity has been
detected on this mud volcano during several submersible
dives (Aloisi et al. 2000; MEDINAUT/MEDINETH Sci-
entific Party 2000), and a pure methane content measured
as high as 900,000 ppm in the cores during ODP Leg 160
(Emeis et al. 1996, Site 971). These unique characteristics
strongly suggest that Napoli volcano has been active very
recently (1–102 years ?). Reflectivity data, on the other
hand, span an age interval which is dependent on the
detection depth of the sonar and on the rate of sedimen-
tation above the latest mud flow, and typically gives a
timespan of the order of 104 years.
In our case, a sedimentation rate of 38 m/m.y. causes the
imprint of a mud volcano averaging 50–200 m in height to
disappear in 1.3–5.3 m.y. from the seafloor. We suggest
below that the initiation of mud volcanism may be as
young as 2 Ma. We thus argue that we have detected most
of the population of mud volcanoes, either as high reflec-
tivity patches, or as rounded features not associated with
high backscattering but suspected to be mud volcanoes. In
the following text, we suggest that the latter may represent
5–10% of the entire population. They correspond to the
rare mud volcanoes that did not erupt during the time span
covered by the sonar (0 to 37,000–60,000 years).
To gain insight into the episodicity of mud eruption, let
us assume that the recurrence time for mud volcano erup-
tion is s (in other words, one single eruption for the entire
population of N volcanoes, every s). We further assume
that each volcano has the same equal probability p = 1/N to
erupt. We use a simple binomial distribution law to find
after how many draws in the entire population, we reach a
proportion of negative draws (no eruption) equal to 5% and
10%. We find a number n of 804 and 549 draws, respec-
tively. The time interval is Dt = 37,000–60,000 years. As
s = Dt/n, the recurrence time for a mud volcano eruption
ranges between 60 years and 88 years. Using the same law,
the most probable number of eruptions for one single
Mar Geophys Res (2007) 28:271–295 283
123
volcano during the Dt period is 2–3. The probability to
have more than six eruptions is below 1%. These figures
are compatible with our observation of multiple flows at at
least one mud volcano, based only on reflectivity contrasts.
They suggest that the order of magnitude for the resting
time at one single volcano is 103–104 years. This is com-
patible with the long resting period observed for the Milano
volcano. This recurrence time is significantly larger than
the eruption rates reported for the Azerbaijan mud fields
(Mellors et al. 2007).
Tectonic control on mud volcanism
The Mediterranean Ridge is actively growing in front of a
continental crustal backstop, as a typical accretionary
prism. The present-day convergence rate derived from GPS
is above 30 mm/year (Mcclusky et al. 2003). It is generally
agreed that the present-day kinematic framework was
established during the Plio-Pleistocene (Armijo et al.
1999), in relation with the onset of motion of the Anatolian
microplate and the activation of the North Anatolian fault.
Although the timing of initiation of the Hellenic subduction
is still debated, the Mediterranean wedge is generally
considered not older than Miocene (Kastens 1991). The
frontal portion of the wedge (not more than 80 km wide) is
post-Messinian, implying that the material involved in the
accretion is a mixture of post-Messinian sediments and
Messinian evaporites originally deposited in the trench.
The rest of the wedge (about two thirds) is essentially built
by pre-Messinian sediments. A particularity of the present-
day subduction is the V-shape geometry of the tip of the
resisting backstop, with a NW trending western branch and
NE trending eastern branch (Le Pichon et al. 1995, 2002;
Costa et al. 2004; Kreemer and Chamot-Rooke 2004).
Northward motion of Africa with respect to the backstop
implies high obliquity of the convergence along the entire
Mediterranean Ridge. This oblique convergence is
accommodated by shear partitioning on both branches of
the Mediterranean Ridge (Kreemer and Chamot-Rooke
2004; Costa et al. 2004). Shearing is active preferentially at
the wedge backstop contact, and is respectively dextral and
sinistral over the western and eastern branches of the
Mediterranean Ridge.
The mud volcanic belt closely follows these dextral and
sinistral shear bands. The Cobblestone Area s.l. coincides
with a major NNW-SSE dextral strike-slip fault zone,
while the Pan di Zucchero Area s.l. exactly covers the left-
lateral strike-slip zone and associated en-echelon folds that
form the very top of the Mediterranean Ridge. At the scale
of the Eastern Mediterranean basins, there is thus a clear
link between the main active fault zones and mud expul-
sion. The common interpretation is that the source for the
mud is within the wedge (Robertson and Kopf 1998b; Kopf
2002), and that rapid stacking of high-porosity sediments
ultimately leads to over-pressures and expulsion.
An alternative is that the mud reservoir is located at the
backstop-wedge contact, as discussed below. In both cases,
active faults then act as preferential channels for mud
expulsion.
At a local scale, mud flows of the Mediterranean Ridge
are systematically associated with faults. Detailed struc-
tural mapping shows that mud volcanoes are
preferentially located at the tip of the faults, or more
generally in the zones of fault interactions (restraining or
releasing bends, faults intersections). This is not specific
to the Mediterranean Ridge outflows, as evidenced by the
worldwide compilation of fluid flow outlets under various
tectonic regimes made by Curewitz and Karson (1997).
Simple faults models predict accumulation of stress and
strain at faults tips and/or intersections, leading to local-
ized damaging. Several examples are shown in Fig. 4.
Several volcanoes punctuate a more or less linear strike-
slip fault, each of them associated with small step in the
major trend. One of them coincides with a releasing bend,
leading to the formation of a small pull-apart type basin
(right lateral). The main edifice is conical and located
right in the center of the basin, while the erupted material
fills the depression.
Most of these mud volcanoes were not surveyed by
means of seismic reflection methods. Apart from areas
that have been extensively covered, it is actually quite
rare that a seismic profile runs across a mud volcano, and
even more unlikely that it cuts through the mud extrusion
conduit. The conduit itself is probably small compared to
the overall size of the mud volcano, and it may be
irregular or oblique. Figure 11 shows the IMERSE 01
profile, that crosses a mud volcano immediately south of
the Cobblestone area (Westbrook and Reston 2002).
Several features, often described as typical of a mud
volcano can be seen: the mud dome with the depression
ring around it, the reflectors below interrupted and dip-
ping downward, and the transparent material forming the
core of the volcano. Away from the mud volcano,
reflectors are sub-horizontal and organized into a limited
number of stratigraphic sequences. A thin and very flat
reflector is ubiquitously recognized 200 ms below the
surface. Based on seismic velocities and sedimentation
rates, we estimate that this reflector marks the Miocene–
Pliocene boundary. Immediately below, we find a thick
body of well-stratified sediments above another thick but
poorly stratified sequence. Seismic traces show a polarity
inversion at the base of this latter sequence, around 5s
two-way travel time (TWTT), that we interpret as the
base of the Messinian series. The two large bodies would
thus correspond to the upper evaporites resting on the
284 Mar Geophys Res (2007) 28:271–295
123

main salt body. Our tectonic interpretation is that a small
releasing relay along the major strike-slip fault leads to
normal faulting, with the base of the Messinian salt body
acting as a decollement. In detail, the upper Messinian
sequence shows fanning of the reflectors towards the
fault, indicating that it was active during Messinian time.
The erupted material is quite thick and seems to rest
above the top reflector. The likely scenario is that strike-
slip tectonism induced normal faulting, which in turn
ultimately lead to mud eruption. This suggests that this
mud volcano is post-Pliocene in age. This is compatible
with the inferred age of the Milano (about 1.5 Ma) and
Napoli (older than 1 Ma) domes (Robertson and Kopf
1998b).
Messinian evaporites
Messinian evaporites are generally considered to play a
major role in controlling mud volcanism over the Medi-
terranean Ridge. They also have been proven to be
involved in mud volcanism genesis in contexts other than
subduction (Netzeband et al. 2006). Low permeability
evaporites strata act as seals leading to high pressures in the
sediments below (Reston et al. 2002b; Netzeband et al.
2006). The paradox is two-fold for the Mediterranean
Ridge. First, mud volcanism is most intense in the crestal
portion of the ridge, where the Messinian should be absent
considering that the ridge (i.e. topographic relief) formed in
Miocene times and perhaps even before (Kastens 1991).
1a
1b
IM01
0 10 20km
Plio-Pleist. 1.8 - 2.0
3.0 - 3.3
4.3 - 4.5
3.0 - 3.7
Stratigraphy
Location of IM01
Velocities(km/s)
Upperevaporites
Main saltbody
PreMessinianseries
2
1
0
3
)s( T
WT
8 10 12 14 km3.5
4.0
4.5
5.0
5.5
0 50 100 150Distance (m)
0 50 100 150 200 250Distance (m)
0
3
0
1
2
3
polarityinversion
polarityinversion
A B
IM01
A B
Fig. 11 Top: Extract of IMERSE profile IM01 (migrated section)
across one mud volcano located south of Cobblestone area 1a along
one of the main strike-slip faults. A and B: polarity inversion at the
boundary between the Messinian salt and the pre-Messinian series.
Bottom: tentative geological interpretation; dotted line: base of the
salt body inferred from mapping of the polarity inversion
Mar Geophys Res (2007) 28:271–295 285
123
Second, maximum mud output occurs at a great distance from
the toe of the prism where dewatering is almost completed
(Chamot-Rooke et al. 2005a). The Messinian wedge itself,
i.e. the portion of the wedge that formed in post-Messinian
times and contains thrusted Messinian evaporites and Plio-
Quaternary, is restricted to the outer 80 km of the accretion-
ary prism (Chaumillon et al. 1996). However, Messinian
evaporites are not restricted to the outer post-Messinian
wedge. Salt basins have also been found further up-slope,
including the crestal area of the Mediterranean Ridge (Reston
et al. 2002a). The base of the Messinian was actually recog-
nized at several places based on the polarity inversion
generated by the inverse velocity gradient at this boundary
(Fruehn et al. 2002). The Messinian thickness reaches locally
several kilometers. Figure 11, which is a section obtained
close to the top of the ridge, shows a total thickness of the
main body salt plus the Upper Messinian evaporites of about
2,000 m. During the Messinian salinity crisis, deep basins
existed in a fore-arc position, probably at the southern edge of
the continental Hellenic margin. Relief was thus inverted in
post-Messinian times. Our data indicate that mud volcanism
is indeed closely related to these Messinian evaporites
basins: mud escapes are preferentially located at the edges
of these basins, where the salt layer was either thinner or
broken, the latter being the result of extension (Costa et al.
2004) or strike-slip (Chamot-Rooke et al. 2005a), or both.
Our conclusion is that the Messinian seals do not relate
to the post-Messinian incorporation of evaporites into the
wedge, but to in-situ sedimented Messinian sediments in
small and deep basins that have been uplifted rather than
accreted and transported.
Source of mud and clasts
A full discussion on the provenance and age of clasts and
matrix is found in Akhmanov (1996), Robertson and
Shipboard Scientific Party (1996), Robertson and Kopf
(1998a) and Akhmanov et al. (2003). Drilling undisputedly
brought important new data. ODP Leg 160 (Sites 970 and
971) drilled into two contrasting mud volcanoes: the
Milano volcano, which is conical, and the Napoli volcano,
which is flat-topped. The deepest holes reached 200 mbsf.
Both volcanoes were active prior to at least 1.5–1.75 Ma.
Napoli is still active, but Milano is considered to be dor-
mant. The matrix includes dominantly Middle Miocene age
nannofossils and foraminifer assemblages, but Eocene and
Oligocene ages are also found. Clasts in both volcanoes
contain (1) Burdigalian to Langhian biota and (2) assem-
blages of Middle Miocene, Oligocene and Eocene ages,
together with Cretaceous nannofossils. Sandstone clasts are
mainly of plutonic and metamorphic origin, derived
dominantly from the North African margin, but also from
Crete and adjacent reliefs (Akhmanov 1996; Akhmanov
and Woodside 1998; Robertson and Kopf 1998b; Kopf
et al. 2000; Akhmanov et al. 2003). Drilling did not totally
rule out the possibility that clasts and matrix were derived
from the same stratigraphic unit. However, the favored
interpretation is that the matrix is dominantly Messinian in
age (mud from the early stages of the salinity crisis) and
clasts are older Miocene clastic and carbonate units
(Robertson and Kopf 1998b). Our interpretation is that the
clasts represent reworked material. Detrital units have been
described above the main Messinian salt body (Sage et al.
2005), as products of the subaerial erosion of nearby con-
tinental rocks of the backstop during lowstands of the
Messinian crisis, including the extension at sea of the
cretean metamorphic units (Le Pichon et al. 2002). Cam-
erlenghi et al. (2007) recently raised the possibility that the
origin of mud volcano clasts in the entire Mediterranean
region is the exhumation of olistostromes.
A key point of the discussion is whether the source has
been traveling into the wedge or not, either along the
decollement (?) (e.g. Kopf and Behrmann 2000, p. 198) or
by progressive incorporation into the prism. If the decoll-
ement is taken as the plate boundary, then material below
has little chance to be accreted into the wedge. The
implication is that traveling, if any, can only occur within
the wedge itself. The horizontal velocity, then, is only a
small fraction of the total convergence rate. A clear dem-
onstration is that the width of the Messinian wedge does
not exceed 80 km, which is thus the maximum distance
traveled by Messinian material originally deposited in the
trench. A second line of reasoning leads to a similar con-
clusion. Taking the present-day velocity field as steady-
state through time (Kreemer and Chamot-Rooke 2004), we
can calculate the traveling time, i.e. the time it would take
for one sequence deposited into the trench (and later
incorporated into the wedge) to enter the area of maximum
mud production. The steady-state model is obviously an
over simplification. We think however that this model is
much closer to reality (for the last few million years) than
the kinematics that has been used so far (unrealistic con-
vergence rate of 6 cm/year in Kopf (1999), probably
misprinted as 5–6 mm/year in Kopf (2002), definitely
misused as 6 km/m.y.—instead of 60 km/m.y.—in Kopf
(1999)). The traveling time is 19 m.y. at longitude 20� E,
11 m.y. at longitude 21� E, and 4 m.y. at longitude 22� E.
These numbers are probably overestimated, since we do
not take into account the outward growth rate of the prism.
However, based on the limited width of the post-Messinian
wedge, we still find it very unlikely that the source for
volcanism is a Messinian mud unit transported from the
trench, the traveling time being too long for a sizeable
portion of the prism.
286 Mar Geophys Res (2007) 28:271–295
123
That clasts and matrix have not been deeply buried is
further demonstrated by petrographic and mineralogical
studies. Drilling did not indicate deep-burial diagenesis nor
metamorphism of either clasts or matrix, and derivation
from relatively shallow levels (less than 7 km) was thus
suggested (Robertson and Kopf 1998b). This result con-
flicts with earlier interpretation that one of the potential
sources for the matrix could be Aptian–Albian shales (Cita
et al. 1981), but was in good agreement with the estimated
depth of the decollement level (Camerlenghi et al. 1995).
Thermal maturity data initially gave a mobilization depth
between 4.9 km and 7.5 km (Schulz et al. 1997), but
re-evaluation points to an even shallower depth of only
about 2 km (Kopf and Behrmann 2000; Kopf et al. 2000).
The latter study is based on low vitrinite reflectance,
indicating that the material—both clasts and matrix—was
not subjected to elevated temperature. To summarize, a
Messinian source for mud implies in-situ production close
to the wedge-backstop contact rather than transportation
through the wedge. The deep Messinian basins that existed
close to this boundary prior to the salinity crisis were filled
by Messinian evaporites during dessication, the latter
providing the necessary seals (Netzeband et al. 2006). The
thickness of evaporites compares well with the inferred
depth of mobilization (about 2 km).
Mud budget for the reservoir hypothesis
In the previous section, we suggest that the source for the
mud is a reservoir that remained close to the backstop
contact through time. If we are correct, then convergence
has little to do with the overall mud mass budget. The
reservoir model implies a ‘‘closed’’ system (the source
cannot be renewed), which is at variance with the sub-
duction model in which the input is steady-state. We thus
re-examine this budget. Following the simple geometric
scheme devised in Appendix B, we estimated the total
volume of extruded mud at 657 km3. As mentioned pre-
viously, we may have missed some of the volcanoes.
However, morphological arguments indicate that at least
80–90% of them have been discovered. Since we only seek
orders of magnitude here, we ignore this potential error.
Evenly distributed over the considered 589 km-long of the
prism-backstop boundary, this leads to an average rate of
1.1 km3 of mud per kilometer. The thickness of the source
layer in the hypothetical mud reservoir can be calculated
by dividing this number by the estimated width of the
reservoir, that is, the width of the inner domain. The latter
varies between 20 km and 75 km, leading to thicknesses of
between 56 m and 15 m, respectively. In other words, the
western Mediterranean mud belt can be explained by
depleting an in-situ reservoir of a few tens of meters thick.
The total thickness of the reservoir is unknown, but we
conclude that the amount of mud to be mobilized is modest
and refilling is not required. The limited thickness of
mobilized mud layer is compatible with the limited amount
of subsidence, only reported, to date, to happen around
each individual mud volcano.
Initiation of mud volcanism
There are now growing evidence that Eastern Mediterra-
nean tectonics has been affected by significant changes in
recent times. Comparisons between global kinematic
models based on geology (Nuvel-1A type) and geodetic
models (mainly GPS-based) indicate that the convergence
of Africa with respect to Eurasia has changed between
3.6 Ma and Present (Calais et al. 2003). The Nubia
(Africa)/Eurasia pole of rotation has migrated southward,
implying a more westerly oriented motion at slower
velocity for the present-day (4–6 mm/year). Whether this
change was progressive or sudden has not yet been docu-
mented. A significant kinematic change is the onset of
motion of the Anatolia–Aegea microplate, pushed laterally
in the wake of Arabia northward motion and collision
(Mckenzie 1972; Le Pichon et al. 1995). The post-Miocene
period is marked by the westward propagation of the North
Anatolian Fault towards the Aegean domain (Armijo et al.
1999; Hubert-Ferrari et al. 2002). Propagation may have
started in the east at about 10 Ma, and by 5 Ma the fault
was in the Marmara Sea region (Armijo et al. 1999).
Concomitant with the activation of the North Anatolian
Fault and the cessation of opening of the Aegean Basin,
rapid motion of the Anatolian–Aegean region has resulted
in high convergence rate in the Eastern Mediterranean
([3 cm/year), the maximum convergence being reached
precisely along the western branch of the Mediterranean
Ridge (Le Pichon et al. 1995). The implication for the
recent growth of the Mediterranean Ridge is drastic: prior
to Anatolia–Aegea escape, the convergence rate did not
exceed Nubia/Eurasia motion, and was thus 4–5 times
slower than the present-day rate (Kreemer and Chamot-
Rooke 2004). The exact link with the tectonics of the
Hellenic Arc is still in debate. The Corinth Gulf, which is
presently actively opening at a [1 cm/year rate, started
opening around 1.0–1.7 m.y. (Sorel 2000; Flotte et al.
2001). At the western end of the Hellenic Arc, the right-
lateral Kephalonia Fault may have been activated at about
the same time (Nielsen et al. 2001). These recent tectonic
changes have been recorded in the field from Peloponnesus
to Rhodes. The stress pattern derived from striations
measurements on fault planes shows important changes in
the Pleistocene (Mercier et al. 1987; Piper and Perissoratis
2003). In the Pliocene and Early Pleistocene extension was
Mar Geophys Res (2007) 28:271–295 287
123

roughly NE–SW oriented, switching to more or less NS
extension in post Middle Pleistocene. A short but intense
phase of compression was found in between those two
extensional regimes, bracketed between 1 m.y. and
0.7 m.y. (Sorel et al. 1992).
The latest kinematic re-organization thus probably
occurred between 1.7 m.y. and 0.7 m.y. If we take the
regional events as indicative of the tectonics of the Medi-
terranean Ridge backstop, then the opening of the Corinth
Gulf, the activation of the Kephalonia Fault and the re-
organization of the stress pattern along the Hellenic Arc
may date the switch from low (\1 cm/year) to high con-
vergence rate ([3 cm/year). The result of this change was
the activation of strain partitioning at the wedge backstop
contact, and the correlative initiation of mud volcanism
along this contact. In our model, the major changes thus
occurred in the kinematics of the upper plate (motion of the
Hellenic backstop), rather than in the lower plate (collision
of blocks from Africa). Triggering of mud volcanism
would thus relate to the initiation of large-scale transcur-
rent motion along the Western and Eastern branches of the
Mediterranean Ridge in the very recent time, rather than
the on-going process of subduction. The proposed age of
initiation (younger than 2 Ma) is compatible with the
estimated ages of Milano and Napoli mud volcanoes.
Conclusion
The seafloor acoustic reflectivity of an area of
600 · 740 km in the Eastern Mediterranean that includes
590 km of the prism-backstop boundary has been analysed
to identify the mud flows and their associated mud volca-
noes. A total of 215 mud flows were found, covering a total
surface of extruded mud of almost 1,500 km2. The inner
domain (prism-backstop boundary) represents 92% of this
surface. Using a simple geometric transformation cali-
brated on a known mud volcano, we convert surface to
volume of extruded mud and find that 96% of the mud is
expelled at the wedge-backstop contact.
We calibrate a geoacoustic model modified from
Mitchell (1993) using all available cores that recovered
mud breccia. The model shows that the maximum depth of
mud breccia detection by the sonar is comprised between
125 cm and 200 cm below the seafloor. We find an atten-
uation ranging between 1 dB m–1 and 3 dB m–1 in our data
depth interval (20–125 cm). This value is consistent with
the type of sediments overlying the mud breccia deposits.
Using chronostratigraphic markers and sedimentation rate,
all detected mud flows are younger than 37,000–
60,000 years. We tentatively constrain the episodicity of
mud eruption between 50 years and 100 years.
At regional and local scales, there is a clear link between
the main active faults and mud expulsion. Shear partitioning
activates dextral strike-slip faults at the wedge backstop
contact. Whatever the mechanism of expulsion, these faults
act as preferential pathways for mud expulsion, especially at
fault tips and intersections, or more generally in the zones of
fault interactions (releasing and restraining bends).
Based on the kinematics of the wedge, we find it very
unlikely that the source of mud volcanism is a layer
transported from the trench. We rather suggest in situ
production close to the wedge-backstop contact. We show
that deep Messinian basins existed close to this boundary
prior to the salinity crisis as forearc basins. Messinian mud
was deposited in these basins and sealed by the Messinian
evaporites. These basins were later inverted in post-Mes-
sinian times. This reservoir model does not require
refilling, since we calculate that the amount of mud to be
mobilized is modest.
We propose to link basin inversion and initiation of mud
volcanism to the latest kinematic re-organisations in the
area. The present-day rapid rate of convergence ([3 cm/
year) is the result of the recent motion of the Anatolia–
Aegean block, which probably took place after 5 m.y., thus
triggering large-scale transcurrent motion along the Wes-
tern and Eastern branches of the Mediterranean Ridge.
Opening of the Corinth Gulf, activation of the Kephalonia
Fault, change in the stress pattern along the Hellenic arc,
indicate that the present-day framework was already
established by 1 Ma. We relate initiation of mud volcanism
to these recent tectonic changes.
Acknowledgements The authors wish to thank three anonymous
reviewers for their thorough and constructive comments. We warmly
thank J. Ashi for his careful reading of a preliminary version of the
manuscript, and P. Clift for his editorial and scientific contribution.
Appendix
A. Image analysis
The image analysis starts with the raw image, without
grid and coordinates. All images are 8-bits (256 gray
levels) grayscale bit-maps. The flow chart of image pro-
cessing is (1) Remove the lower part of the 256-levels of
gray histogram (0–127), considered as noise level; then
stretch the resulting histogram to fill the 256 gray levels;
(2) Apply a median filter (3 · 3 neighbourhood) to
remove spikes; (3) Apply a 192-mask image on the fil-
tered image with a bit-to-bit AND logical operator. This
single operation gives the 192 value to all pixels between
192 and 255, the 128 value to all pixels between 128 and
192, the 64 value to all pixels between 64 and 128, and
288 Mar Geophys Res (2007) 28:271–295
123
the null value to all pixels between 0 and 64; (4) Keep
bin 128 as the medium reflectivity and bin 192 as the
high reflectivity. This operation allows to keep the pixels
between 192 and 256 of the original raw reflectivity
image; (5) Remove the slopes (Fig. 3b) above 10� (18%).
The slopes have been calculated from the same digital
elevation model which produced the bathymetry con-
toured at 20 m; (6) Perform an open process (erosion
operation, followed by dilation, which smoothes objects
and removes isolated pixels).
B. Computation of mud volumes
Reflectivity mapping allowed us to estimate the surface
covered by mud flows, over the outer and inner belts.
We showed that 92% of the surface belong to the inner
belt, while the remaining 8% are scattered within the
outer belt. We now wish to convert our surface estimates
to volumetric estimates. In most cases, the area of the
mud flow that we detected is comparable to the size of
the corresponding mud volcano. Since we only seek
orders of magnitude here, we assume in the following
that mud flows can be taken as a proxy for the finite size
of the edifice, although we are aware that it may be a
rather crude approximation. Each root of the mud
volcano is assumed to be a cone. For volumetric cal-
culations, we neglect the relief that stands above the
seafloor since most of the volume is within the root
itself. We further assume that all volcanoes are homo-
thetic in shape:
r
h¼ constant; ð3Þ
where r is the radius of the cone, and h its height. We
define a shape ratio k:
k ¼ v
s; ð4Þ
where v is the volume of the root, and s the area of the mud
volcano at the seafloor. k is not constant. The cone
approximation thus leads to:
k ¼ v
s¼ h
3: ð5Þ
Under the homothetic assumption, we thus have
kr¼ constant ¼ k
ffiffiffi
pp
s�12; ð6Þ
which implies
ks�12 ¼ constant: ð7Þ
This dimensionless constant characterizes the geometric
properties of the entire population. The total volume is:
VT ¼X
i
kisi ¼X
i
ðkis�1
2
i Þs32
i ; ð8Þ
where the summation is over the entire population. Since
kis�1
2
i ¼ constant; ð9Þ
the total volume can be rewritten:
VT ¼ kjs�1
2
j
X
i
s32
i ; ð10Þ
where subscript j refers to any mud volcano of the popu-
lation. In other words, if we know the geometric properties
of one volcano, the homothetic assumption implies that the
total volume can be calculated from the summation of the
surfaces.
The Napoli mud volcano, surveyed during ODP Leg 160
(Emeis et al. 1996) was chosen as the reference mud
volcano. Applying the previous scheme leads to
kjs�1
2
j ¼ 0:11� 0:01: We finally find that for the inner
domain, 92% of the total surface convert to 96% of the
total volume.
C. Acoustical model
The standard acoustical propagation law can be written
(Mitchell 1993):
Sb ¼ SbðhÞT2wsðhÞT2
swðhÞ exp �4
Z h
0
apðzÞsin h
dz
� �
; ð11Þ
where Sb(h) is the effective backscatter coefficient of the
buried surface, h is the grazing angle of the refracted wave,
z is the vertical distance measured below the sediment
surface. ap is the attenuation expressed in nepers m–1. The
conventional model generally assumes that the attenuation
a is constant with depth. Then, taking the logarithm of
Eq. 11 and multiplying by 10 to convert the variables to
decibels, the effective backscattering strength is:
BS ¼ BSvðhÞ þ 20 log10ðTwsTswÞ �2adBh
sin h; ð12Þ
where h is the sediment thickness. Some authors measured
a decreasing attenuation with depth (Gorgas et al. 2002),
which comes to solving Eq. 11 for a varying attenuation
with depth, ap(z) = a0 + bp z. b is the rate of attenuation in
Mar Geophys Res (2007) 28:271–295 289
123
dB m–2, and is negative in unconsolidated superficial
sediments, as shown by Gorgas et al. (2002). Equation 11
becomes:
Sb ¼ SbðhÞT2wsðhÞT2
swðhÞ exp�4a0h
2 sin h
� �
exp�4bph2
2 sin h
� �
;
ð13Þ
The new expression of BS is:
BS ¼ BSvðhÞ þ 20 log10ðTwsTswÞ �2a0;dBh
sin h� bdBh2
sin h:
ð14Þ
We solve Eq. 14 for the linear case (b = 0) and for the
non-linear case ðb\0Þ: In the linear case (Eq. 12), the
loss is proportional to the effective thickness he ¼ h=sin h;equivalent to the distance traveled by the ray into the
sediments. The best linear fit gives a ¼ 2:0� 0:7 dB m�1;
which is equivalent to k ¼ 0:16� 0:06 dB m�1 kHz�1:
These values are in the range of values found in-situ
by Gorgas et al. (2002) for unconsolidated superficial
sediments. In the non-linear case, the best fit gives
a0 ¼ 3 dB m�1 and b ¼ �1:2 dB m�2: At a depth of 1 m,
a ¼ 1:8 dB m�1: The non-linear model does not improve
significantly the fit, and although plausible, the decrease
of the attenuation with depth is not required by our data.
In any case, both models lead to the same range of values
for the attenuation.
D. Characteristics of inferred mud flows
In Table 3 are given some characteristics of the mud flows
identified on the Mediterranean Ridge during the course of
the present study.
Table 3 Longitude, latitude and depth of inferred emission point, associated mud flows surface, for the 215 mud flows individualized over the
western Mediterranean Ridge, sorted according to decreasing latitude. mbsl is metres below sea level
Longitude
(d:m:s)
Latitude
(d:m:s)
Surface
(km2)
Depth
(mbsl)
Name Longitude
(d:m:s)
Latitude
(d:m:s)
Surface
(km2)
Depth
(mbsl)
Name
19:37:11 37:56:28 3.45 3,337 – 20:43:41 36:22:19 5.61 2,848 –
19:37:3 37:50:6 3.71 3,310 – 20:47:12 36:22:12 2.77 2,830 –
19:49:58 37:49:57 2.67 3,451 – 20:44:19 36:21:40 0.87 2,846 –
19:45:16 37:43:41 0.60 3,306 – 20:46:2 36:20:43 8.59 2,856 –
19:46:16 37:28:28 1.30 3,335 – 20:47:23 36:19:59 4.17 2,912 –
19:25:2 37:25:29 1.98 3,390 – 20:36:25 36:19:41 5.28 2,797 –
19:40:5 37:21:45 1.48 3,507 – 20:49:25 36:19:35 4.24 2,943 –
19:55:21 37:21:35 5.72 3,284 – 20:55:39 36:18:40 2.00 3,633 –
19:58:39 37:20:17 7.67 3,210 – 20:35:22 36:18:38 14.72 2,807 –
19:45:35 37:18:42 2.11 3,496 – 20:44:5 36:16:42 1.21 2,983 –
19:57:25 37:14:19 39.36 3,198 – 20:40:7 36:15:49 1.50 2,779 –
20:3:58 37:9:15 20.91 3,106 – 20:46:16 36:15:14 0.79 2,957 –
18:57:7 37:9:12 1.84 3,420 – 20:44:49 36:14:58 7.22 2,895 –
19:32:54 37:6:22 2.69 3,381 – 20:47:26 36:11:39 5.45 2,870 –
20:9:2 37:5:56 14.80 2,991 – 20:24:59 36:10:50 3.24 3,118 –
19:51:17 37:0:42 18.08 3,522 – 20:46:7 36:10:39 8.46 2,752 –
19:46:48 36:58:8 7.21 3,522 – 20:41:4 36:10:2 7.20 2,950 –
20:27:12 36:51:50 3.21 3,202 – 20:48:36 36:6:55 18.66 2,632 –
19:52:25 36:50:15 0.88 3,195 – 20:58:17 36:6:37 4.98 3,423 –
20:31:13 36:50:2 3.32 3,426 – 21:1:48 36:5:18 1.35 3,553 –
19:49:12 36:49:51 1.80 3,311 – 20:49:44 36:4:30 2.04 2,751 –
19:44:25 36:46:37 1.43 3,227 – 20:50:47 36:4:21 16.34 2,753 –
19:55:7 36:46:22 2.35 3,243 – 20:48:47 36:3:30 4.33 2,795 –
20:33:53 36:46:9 28.30 2,894 – 20:53:21 36:3:28 3.67 2,925 –
19:45:24 36:43:28 1.37 3,187 – 20:46:21 36:2:29 3.87 2,863 –
20:21:0 36:40:10 2.64 2,901 – 20:48:12 36:2:22 2.55 2,803 –
20:29:54 36:38:7 1.34 2,767 – 20:50:36 36:2:18 3.81 2,889 –
19:56:1 36:37:52 1.04 3,102 – 20:56:17 36:1:40 38.11 2,792 –
290 Mar Geophys Res (2007) 28:271–295
123
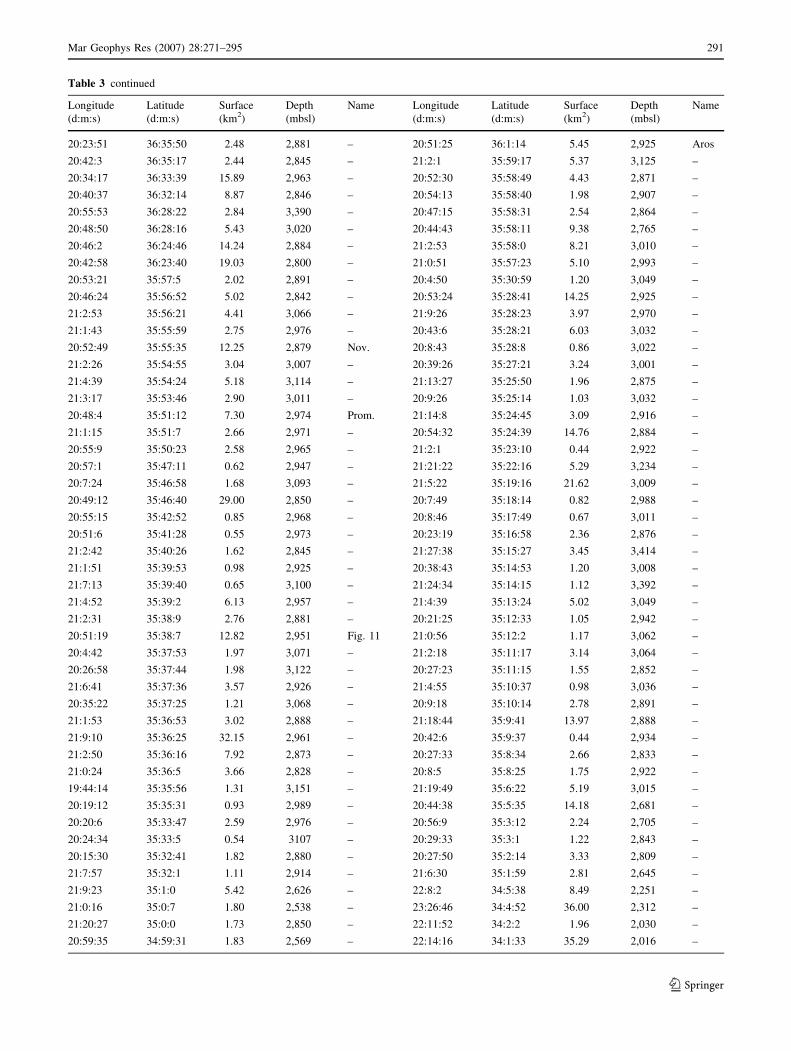
Table 3 continued
Longitude
(d:m:s)
Latitude
(d:m:s)
Surface
(km2)
Depth
(mbsl)
Name Longitude
(d:m:s)
Latitude
(d:m:s)
Surface
(km2)
Depth
(mbsl)
Name
20:23:51 36:35:50 2.48 2,881 – 20:51:25 36:1:14 5.45 2,925 Aros
20:42:3 36:35:17 2.44 2,845 – 21:2:1 35:59:17 5.37 3,125 –
20:34:17 36:33:39 15.89 2,963 – 20:52:30 35:58:49 4.43 2,871 –
20:40:37 36:32:14 8.87 2,846 – 20:54:13 35:58:40 1.98 2,907 –
20:55:53 36:28:22 2.84 3,390 – 20:47:15 35:58:31 2.54 2,864 –
20:48:50 36:28:16 5.43 3,020 – 20:44:43 35:58:11 9.38 2,765 –
20:46:2 36:24:46 14.24 2,884 – 21:2:53 35:58:0 8.21 3,010 –
20:42:58 36:23:40 19.03 2,800 – 21:0:51 35:57:23 5.10 2,993 –
20:53:21 35:57:5 2.02 2,891 – 20:4:50 35:30:59 1.20 3,049 –
20:46:24 35:56:52 5.02 2,842 – 20:53:24 35:28:41 14.25 2,925 –
21:2:53 35:56:21 4.41 3,066 – 21:9:26 35:28:23 3.97 2,970 –
21:1:43 35:55:59 2.75 2,976 – 20:43:6 35:28:21 6.03 3,032 –
20:52:49 35:55:35 12.25 2,879 Nov. 20:8:43 35:28:8 0.86 3,022 –
21:2:26 35:54:55 3.04 3,007 – 20:39:26 35:27:21 3.24 3,001 –
21:4:39 35:54:24 5.18 3,114 – 21:13:27 35:25:50 1.96 2,875 –
21:3:17 35:53:46 2.90 3,011 – 20:9:26 35:25:14 1.03 3,032 –
20:48:4 35:51:12 7.30 2,974 Prom. 21:14:8 35:24:45 3.09 2,916 –
21:1:15 35:51:7 2.66 2,971 – 20:54:32 35:24:39 14.76 2,884 –
20:55:9 35:50:23 2.58 2,965 – 21:2:1 35:23:10 0.44 2,922 –
20:57:1 35:47:11 0.62 2,947 – 21:21:22 35:22:16 5.29 3,234 –
20:7:24 35:46:58 1.68 3,093 – 21:5:22 35:19:16 21.62 3,009 –
20:49:12 35:46:40 29.00 2,850 – 20:7:49 35:18:14 0.82 2,988 –
20:55:15 35:42:52 0.85 2,968 – 20:8:46 35:17:49 0.67 3,011 –
20:51:6 35:41:28 0.55 2,973 – 20:23:19 35:16:58 2.36 2,876 –
21:2:42 35:40:26 1.62 2,845 – 21:27:38 35:15:27 3.45 3,414 –
21:1:51 35:39:53 0.98 2,925 – 20:38:43 35:14:53 1.20 3,008 –
21:7:13 35:39:40 0.65 3,100 – 21:24:34 35:14:15 1.12 3,392 –
21:4:52 35:39:2 6.13 2,957 – 21:4:39 35:13:24 5.02 3,049 –
21:2:31 35:38:9 2.76 2,881 – 20:21:25 35:12:33 1.05 2,942 –
20:51:19 35:38:7 12.82 2,951 Fig. 11 21:0:56 35:12:2 1.17 3,062 –
20:4:42 35:37:53 1.97 3,071 – 21:2:18 35:11:17 3.14 3,064 –
20:26:58 35:37:44 1.98 3,122 – 20:27:23 35:11:15 1.55 2,852 –
21:6:41 35:37:36 3.57 2,926 – 21:4:55 35:10:37 0.98 3,036 –
20:35:22 35:37:25 1.21 3,068 – 20:9:18 35:10:14 2.78 2,891 –
21:1:53 35:36:53 3.02 2,888 – 21:18:44 35:9:41 13.97 2,888 –
21:9:10 35:36:25 32.15 2,961 – 20:42:6 35:9:37 0.44 2,934 –
21:2:50 35:36:16 7.92 2,873 – 20:27:33 35:8:34 2.66 2,833 –
21:0:24 35:36:5 3.66 2,828 – 20:8:5 35:8:25 1.75 2,922 –
19:44:14 35:35:56 1.31 3,151 – 21:19:49 35:6:22 5.19 3,015 –
20:19:12 35:35:31 0.93 2,989 – 20:44:38 35:5:35 14.18 2,681 –
20:20:6 35:33:47 2.59 2,976 – 20:56:9 35:3:12 2.24 2,705 –
20:24:34 35:33:5 0.54 3107 – 20:29:33 35:3:1 1.22 2,843 –
20:15:30 35:32:41 1.82 2,880 – 20:27:50 35:2:14 3.33 2,809 –
21:7:57 35:32:1 1.11 2,914 – 21:6:30 35:1:59 2.81 2,645 –
21:9:23 35:1:0 5.42 2,626 – 22:8:2 34:5:38 8.49 2,251 –
21:0:16 35:0:7 1.80 2,538 – 23:26:46 34:4:52 36.00 2,312 –
21:20:27 35:0:0 1.73 2,850 – 22:11:52 34:2:2 1.96 2,030 –
20:59:35 34:59:31 1.83 2,569 – 22:14:16 34:1:33 35.29 2,016 –
Mar Geophys Res (2007) 28:271–295 291
123

References
Akhmanov G (1996) Lithology of mud breccia clasts from the
Mediterranean Ridge. Mar Geol 132(1–4):151–164
Akhmanov GG, Woodside JM (1998) Mud volcanic samples in the
context of the Mediterranean Ridge mud diapiric belt. In:
Robertson AHF, Emeis K-C, Richter C, Camerlenghi A (eds)
Proc ODP, vol 160. Scientific Results (Ocean Drilling Program),
College Station, TX, pp 597–605
Akhmanov GG, Premoli Silva I, Erba E, Cita MB (2003) Sedimentary
succession and evolution of the Mediterranean Ridge western
sector as derived from lithology of mud breccia clasts. Mar Geol
195:277–299
Aloisi G, Pierre C, Rouchy J-M, Foucher J-P, Woodside J, The
MEDINAUT Scientific Party (2000) Methane-related authigenic
carbonates of eastern Mediterranean Sea mud volcanoes and
their possible relation to gas hydrate destabilisation. Earth Planet
Sci Lett 184(1):321–338
Armijo R, Meyer B, Hubert A, Barka A (1999) Westward propagation
of the North Anatolian fault into the northern Aegean: timing
and kinematics. Geology 27(3):267–270
Breen N, Silver E, Hussong D (1986) Structural styles of an
accretionary wedge south of the island of Sumba, Indonesia,
revealed by SeaMARC II side scan sonar. Geol Soc Am Bull
97:1250–1261
Breen N, Silver E, Roof S (1989) The Water back arc thrust belt,
Eastern Indonesia: the effect of accretion against an irregularly
shaped arc. Tectonics 8(1):85–98
Brown K, Westbrook G (1988) Mud diapirism and subcretion in the
Barbados Ridge accretionary complex; the role of fluids in
accretionary processes. Tectonics 7(3):613–640
Table 3 continued
Longitude
(d:m:s)
Latitude
(d:m:s)
Surface
(km2)
Depth
(mbsl)
Name Longitude
(d:m:s)
Latitude
(d:m:s)
Surface
(km2)
Depth
(mbsl)
Name
21:19:22 34:59:2 3.83 2,783 – 22:16:37 33:59:44 0.93 2,053 –
21:20:33 34:58:37 5.40 2768 – 21:55:25 33:58:38 8.13 2,019 –
21:21:3 34:56:25 1.74 2,737 – 22:19:35 33:58:24 7.34 2,147 –
20:16:16 34:56:21 0.55 2,932 – 22:7:53 33:57:41 12.01 2,191 –
20:51:14 34:55:54 2.22 2,748 – 23:21:48 33:57:21 2.35 2,079 –
20:45:27 34:54:22 3.34 2,801 – 22:47:33 33:56:13 78.43 1,847 –
20:19:12 34:54:6 1.89 2,845 – 22:51:5 33:56:1 26.52 1,847 –
20:4:45 34:51:47 3.63 2,882 – 23:6:34 33:55:41 19.03 1,968 –
20:4:55 34:50:27 3.23 2,903 – 22:1:7 33:51:20 9.21 2,076 –
20:23:27 34:50:11 1.33 2,815 – 23:19:11 33:50:46 4.07 1,717 –
20:41:28 34:49:31 3.08 2,689 – 23:18:57 33:50:5 7.31 1,688 –
20:19:1 34:49:13 1.62 2,853 – 20:36:41 33:48:31 0.72 2,722 –
21:6:46 34:48:44 4.50 2,350 – 21:54:23 33:48:4 1.37 2,047 –
21:24:53 34:48:3 5.59 2,448 – 22:25:20 33:47:14 32.81 1,365 –
21:36:19 34:44:48 1.95 2,567 – 21:54:4 33:46:54 2.96 2,042 –
21:23:24 34:42:15 2.61 2,212 – 22:14:51 33:46:51 7.01 1,853 –
20:22:24 34:42:4 3.15 2,802 – 22:32:12 33:46:10 2.67 1,433 –
20:30:32 34:41:59 4.69 2,719 – 22:9:23 33:46:8 67.20 1,709 –
21:57:38 34:41:24 3.73 2,825 – 20:31:32 33:46:1 0.99 2,855 –
21:58:13 34:39:11 1.49 2,319 – 22:42:49 33:46:1 43.04 1,158 Anteus
21:54:4 34:38:55 1.26 2,205 – 23:13:24 33:44:39 5.80 1,497 –
21:21:51 34:38:15 3.17 2,234 – 22:16:1 33:44:10 11.47 1,843 –
21:59:32 34:38:10 0.51 2,327 – 22:48:11 33:44:10 13.54 1,385 –
21:47:47 34:34:36 2.16 2,227 – 22:13:24 33:42:57 3.44 1,796 –
21:41:6 34:28:0 2.18 2,334 – 23:12:46 33:32:37 1.39 1,966 –
21:35:41 34:25:29 5.99 2,126 – 22:21:21 33:29:39 1.71 1,699 –
22:10:55 34:24:3 76.01 2,145 – 22:5:24 33:28:30 1.04 1,930 –
20:42:58 34:22:47 0.97 2,587 – 20:54:37 33:24:28 3.04 3,008 –
22:8:29 34:13:58 10.12 2,397 – 22:3:17 33:20:23 9.26 2,181 –
21:51:59 34:7:54 18.50 2,203 – 22:21:46 33:19:33 2.47 2,247 –
23:26:13 34:6:46 5.90 2,418 – 21:11:20 33:15:21 4.14 2,920 –
22:34:22 34:5:38 1.79 2,301 –
Names of known mud volcanoes: Nov, Novorossiysk; Prom, Prometheus
292 Mar Geophys Res (2007) 28:271–295
123

Calais E, DeMets C, Nocquet J (2003) Evidence for a post-3.16-Ma
change in Nubia Eurasia North America plate motions? Earth
Planet Sci Lett 216(1–2):81–92
Camerlenghi A, Cita M, Hieke W, Ricchiuto T (1992) Geological
evidence for mud diapirism on the Mediterranean Ridge
accretionary complex. Earth Planet Sci Lett 109(3–4):493–504
Camerlenghi A, Cita M, Della Vedova B, Fusi N, Mirabile L, Pellis G
(1995) Geophysical evidence of mud diapirism on the Mediter-
ranean Ridge accretionary complex. Mar Geophys Res
17(2):115–141
Camerlenghi A, Pini GA (2007) Mud volcanoes, olistostromes, and
argille scagliose in the Mediterranean Region. In: McKenzie JA,
Bernoulli D, Cita MB (eds) Major discoveries in sedimentary
geology in the Mediterranean realm from a historical perspective
to new developments. IAS Special Publications, Blackwell
Publishing, in press
Ceramicola S, Praeg D, Monteys X, Unnithan V, Wardell N, Cova A,
Garziglia S, OGS Explora Scientific Party (2006) Imaging of a
new province of seabed cold seeps in the northern Ionian Sea
(Calabrian Arc)—towards ecosystems mapping. In: Geophysics
Research Abstracts, vol 8, p 4868
Chamot-Rooke N, Rabaute A, Kreemer C (2005a) Western
Mediterranean Ridge mud belt correlates with active shear
strain at the prism-backstop geological contact. Geology
33(11):861–864
Chamot-Rooke N, Rangin C, Le Pichon X, Rabaute A, Laurent O,
Ego F, Lallemant S, Nielsen C, Pagot P, Tsang Hin Sun D,
Walcott R, Bousquet R (2005b) DOTMED: a synthesis of deep
marine data in eastern Mediterranean. Mem. Soc. Geol. France
177:64, 9 pl. + cdrom
Chaumillon E, Mascle J, Hoffmann J (1996) Deformation of the
western Mediterranean Ridge; importance of Messinian evapo-
ritic formations. Tectonophysics 263(1–4):163–190
Cita M, Ryan W, Paggi L (1981) Prometheus mud breccia; an
example of shale diapirism in the Western Mediterranean Ridge.
Annales Geologiques des Pays Helleniques 30:543–570
Cita M, Bossio A, Colombo A, Gnaccolinia M, Salvatorini G, Kastens
K, McCoy F, Broglia C, Camerlenghi A, Catrullo D, Clauzon G,
Croce M, Giambastiani M, Malinverno A, Parisi E (1982)
Stratigraphy and neotectonics in the eastern Mediterranean
Ridge; Cobblestone area 3 re-visited. Mem Soc Geol It 24(Part
2):443–458
Costa E, Camerlenghi A, Polonia A, Cooper C, Fabretti P, Mosconi
A, Murelli P, Romanelli M, Sormani L, Wardell N (2004)
Modeling deformation and salt tectonics in the eastern Mediter-
ranean Ridge accretionary wedge. Geol Soc Am Bull 116(7/
8):880–894
Cronin BT, Ivanov MK, Limonov AF, Egorov A, Akhmanov GG,
Akhmetjanov AM, Kozlova E, Shipboard, Scientific Party TTR-
5 (1997) New discoveries of mud volcanoes on the Eastern
Mediterranean Ridge. J Geol Soc London 154:173–182
Curewitz D, Karson J (1997) Structural settings of hydrothermal
outflow: fracture permeability maintained by fault propagation
and interaction. J Volcanol Geotherm Res 79(3–4):149–168
Emeis K-C, Robertson A, Richter C et al (eds) (1996) Proc ODP, vol
160. Init Repts, (Ocean Drilling Program) College Station, TX
Flotte N, Plagnes V, Sorel D, Benedicto A (2001) Attempt to date
Pleistocene normal faults of the Corinth-Patras Rift (Greece) by
U/Th method, and tectonic implications. Geophys Res Lett
28(19):3769–3772
Fruehn J, Reston T, von Huene R, Bialas J (2002) Structure of the
Mediterranean Ridge accretionary complex from seismic veloc-
ity information. Mar Geol 186(1–2):43–58
Fusi N, Kenyon N (1996) Distribution of mud diapirism and other
geological structures from long-range sidescan sonar (GLORIA)
data, in the eastern Mediterranean Sea. Mar Geol 132(1–4):21–38
Galindo-Zaldivar J, Nieto L, Woodside J (1996) Structural features of
mud volcanoes and the fold system of the Mediterranean Ridge,
south of Crete. Mar Geol 132(1–4):95–112
Gorgas T, Wilkens R, Fu S, Frazer N, Richardson M, Briggs K, Lee H
(2002) In situ acoustic and laboratory ultrasonic sound speed and
attenuation measured in hetegeneous soft seabed sediments: Eel
River shelf California. Mar Geol 182(1–2):103–119
Hamilton EL (1972) Compressional wave attenuation in marine
sediments. Geophysics 37:620–646
Hamilton EL (1980) Geoacoustic modeling of the sea floor. J Acoust
Soc Am 68(5):1313–1340
Henry P, Le Pichon X, Lallemant S, Foucher J-P (1990) Mud volcano
field seaward of the Barbados accretionary complex; a deep-
towed scan sonar. J Geophys Res B 95(6):8917–8929
Hensen C, Nuzzo M, Hornibrook E, Pinheiro LM, Bock B, Magalhaes
VH, Bruckmann W (2007) Sources of mud volcano fluids in the
Gulf of Cadiz—indications for hydrothermal imprint. Geochim
Cosmochim Acta 71(5):1232–1248
Hieke W, Cita M, Mirabile G, Negri A, Werner F (1996) The summit
area (Antaeus/Pan di Zucchero) of the Mediterranean Ridge; a
mud diapir field?. Mar Geol 132(1–4):113–129
Hubert-Ferrari A, Armijo R, King G, Meyer B, Barka A (2002)
Morphology, displacement, and slip rates along the North
Anatolian Fault. J Geophys Res 107(B10), doi:10.1029/
2001JB000,393
Huguen C (2001) Deformation recente a actuelle et argilo-cinese
associee au sein de la Ride Mediterraneenne (Mediterranee
orientale). Ph.D. thesis, Universite Pierre et Marie Curie, Paris
VI
Huguen C, Mascle J, Chaumillon E, Kopf A, Woodside J, Zitter T
(2004) Structural setting and tectonic control of mud volcanoes
from the Central Mediterranean Ridge (Eastern Mediterranean).
Mar Geol 209(1–4):245–263, doi:10.1016/j.margeo.2004.05.002
Huguen C, Mascle J, Woodside J, Zitter T, Foucher J-P (2005) Mud
volcanoes and mud domes of the Central Mediterranean Ridge:
near-bottom and in situ observations. Deep Sea Res. Part I–
Oceanogr Res Papers 52(10):1911–1931
Huguen C, Chamot-Rooke N, Loubrieu B, Mascle J (2006)
Morphology of a pre-collisional, salt-bearing, accretionary
complex: the Mediterranean Ridge (Eastern Mediterranean).
Mar Geophys Res 27(1):61–75
Ivanov M, Limonov A, Cronin B (1996a) Mud volcanism and fluid
venting in the eastern part of the Mediterranean Ridge, vol 68.
UNESCO Rep. Mar. Sci., Paris
Ivanov M, Limonov A, van Weering T (1996b) Comparative
characteristics of the Black Sea and Mediterranean Ridge mud
volcanoes. Mar Geol 132(1–4):253–271
Jackson DR, Winebrenner DP, Ishimaru A (1986) Application of the
composite roughness model to high-frequency bottom backscat-
tering. J Acoust Soc Am 79(5):1410–1422
Kastens K (1991) Rate of outward growth of the Mediterranean Ridge
accretionary complex. Tectonophysics 199:25–50
Kobayashi K, Ashi J, Boulegue J, Cambray H, Chamot-Rooke N,
Fujimoto H, Furuta T, Iiyama J, Koizumi T, Mitsuzawa K,
Monma H, Murayama M, Naka J, Nakanishi M, Ogawa Y,
Otsuka K, Okada M, Oshida A, Shima N, Soh W, Takeushi A,
Watanabe M, Yamagata T (1992) Deep-tow survey in the
KAIKO-Nankai cold seepage areas. Earth Planet Sci Lett
109:347–354
Kopf A (1999) Fate of sediment during plate convergence at the
Mediterranean Ridge accretionary complex; volume balance of
mud extrusion versus subduction and/or accretion. Geology
27(1):87–90
Kopf A (2002) Significance of mud volcanism. Rev Geophys 40(2):1–52
Kopf A, Behrmann J (2000) Extrusion dynamics of mud volcanoes on
the Mediterranean Ridge accretionary complex. In: Vendeville
Mar Geophys Res (2007) 28:271–295 293
123
B, Mart Y, Vigneresse J (eds) Salt, shales and igneous diapirs in
and around Europe, vol 174. Geological Society Special
Publications, London, pp 169–204
Kopf A, Robertson A, Volkmann N (2000) Origin of mud breccia
from the Mediterranean Ridge accretionary complex based on
evidence of the maturity of organic matter and related
petrographic and regional tectonic evidence. Mar Geol 166
(1–4):65–82
Kopf A, Klaeschen D, Mascle J (2001) Extreme efficiency of mud
volcanism in dewatering accretionary prisms. Earth Planet Sci
Lett 189(3–4):295–313
Kreemer C, Chamot-Rooke N (2004) Contemporary kinematics of the
southern Aegean and the Mediterranean Ridge. Geophys J Int
157(3):1377–1392
Kroon D, Alexander I, Little M, Lourens L, Matthewson A,
Robertson A, Sakamoto T (1998) Oxygen isotope and sapropel
stratigraphy in the eastern mediterranean during the last
3.2 million years, vol 160. In: Robertson AHF, Emeis K-C,
Richter C, Camerlenghi A (eds) Proc ODP. Scientific Results
(Ocean Drilling Program), College Station, TX, pp 181–189
Le Pichon X, Henry P, Lallemant S, Foucher J-P, Boulegue J,
Westbrook G, Avedik F, Langseth M, Hobart M, Benedetti M
(1990) Mud volcano field seaward of the Barbados accretionary
complex; a submersible survey. J Geophys Res B 95(6):
8931–8943
Le Pichon X, Chamot-Rooke N, Lallemant S, Noomen R, Veis G
(1995) Geodetic determination of the kinematics of Central
Greece with respect to Europe—implications for Eastern
Mediterranean tectonics. J Geophys Res B 100(7):
12675–12690
Le Pichon X, Lallemant S, Chamot-Rooke N, Lemeur D, Pascal G
(2002) The Mediterranean Ridge backstop and the Hellenic
nappes. Mar Geol 186(1–2):111–125
Limonov A, Kenyon N, Ivanov M, Woodside J (1995) Deep-sea
depositional systems of the Western Mediterranean and mud
volcanism on the Mediterranean Ridge, vol 67. UNESCO Rep.
Mar. Sci., Paris
Limonov A, Woodside J, Cita M, Ivanov M (1996) The Mediterra-
nean Ridge and related mud diapirism; a background. Mar Geol
132(1–4):7–19
Loncke L, Mascle J, FANIL Scientific Parties (2004) Mud volcanoes,
gas chimneys, pockmarks and mounds in the Nile deep-sea fan
(Eastern Mediterranean): geophysical evidences. Mar Pet Geol
21:669–689
McCluky S, Reilinger R, Mahmoud S, Ben Sari D, Tealeb A (2003)
GPS constraints on Africa (Nubia) and Arabia plate. Geophys
J Int 155(1):126–138
McKenzie D (1972) Active tectonics of the Mediterranean region.
Geophys J R Astron Soc 30:109–185
MEDINAUT/MEDINETH Scientific Party (2000) Linking Mediter-
ranean brine pools and mud volcanism. Eos Trans AGU
81(51):625, 631–632
Mellors R, Kilb D, Aliyev A, Gasanov A, Yetirmishli G (2007)
Correlations between earthquakes and large mud volcano
eruptions. J Geophys Res 112:B04304, doi:10.1029/
2006JB004489
Mercier J, Sorel D, Simeakis K (1987) Changes in the state of stress
in the overriding plate of a subduction zone: the Aegean arc from
the Pliocene to the present. Ann Tectonicae 1:20–39
Mitchell N (1993) A model for attenuation of backscatter due to
sediment accumulations and its application to determine sedi-
ment thickness with GLORIA sidescan sonar. J Geophys Res B
98(12):22477–22493
Netzeband GL, Hubscher CP, Gajewski D (2006) The structural
evolution of the Messinian evaporites in the Levantine Basin.
Mar Geol 230:249–273
Nielsen C, Rangin C, Chamot-Rooke N, Sorel D, Laurent O (2001)
The occidental termination of the Mediterranean Ridge: onshore
and offshore constraints along the Kephalonia Fault. In:
Geophysics Research Abstracts, vol 3, March 2001, France,
p 872
Nielsen C, Chamot-Rooke N, Rangin C, Andaman Cruise Team
(2004) From partial to full strain partitioning along the Indo-
Burmese hyper-oblique subduction. Mar Geol 209(1–4):303–
327, doi:10.1016/j.margeo.2004.05.001
Perez Belzuz F, Alonso B, Ercilla G (1997) History of mud diapirism
and trigger mechanisms in the western Alboran Sea. Tectono-
physics 282(1–4):399–422
Piper D, Perissoratis C (2003) Quaternary neotectonics of the South
Aegean arc. Mar Geol 198(3–4):259–288
Reston T, Fruehn J, von Huene R (2002a) The structure and evolution
of the western Mediterranean Ridge. Mar Geol 186(1–2):83–110
Reston T, von Huene R, Dickmann T, Klaeschen D, Kopp H (2002b)
Frontal accretion along the western Mediterranean Ridge: the
effect of Messinian evaporites on wedge mechanics and
structural style. Mar Geol 186(1–2):59–82
Robertson A, Kopf A (1998a) Origin of clasts and matrix within the
Milano and Napoli mud volcanoes, Mediterranean Ridge accre-
tionary complex. In: Robertson AHF, Emeis K-C, Richter C,
Camerlenghi A (eds) Proc ODP, vol 160. Scientific Results
(Ocean Drilling Program), College Station, TX, pp 575–595
Robertson A, Kopf A (1998b) Tectonic setting and processes of mud
volcanism on the Mediterranean Ridge accretionary complex:
evidence from Leg 160. In: Robertson AHF, Emeis K-C, Richter
C, Camerlenghi A (eds) Proc ODP, vol 160. Scientific Results
(Ocean Drilling Program), College Station, TX, pp 665–680
Robertson A, Shipboard Scientific Party (1996) Mud volcanism on the
Mediterranean Ridge: initial results of Ocean Drilling Program
Leg 160. Geology 24(3):239–242
Ryan W, Kastens K, Cita M (1982) Geological evidence concerning
compressional tectonics in the eastern Mediterranean. Tectono-
physics 86(1–3):213–242
Sage F, Von Gronefelda G, Deverchere J, Gaullier V, Maillard A,
Gorini C (2005) Seismic evidence for Messinian detrital deposits
at the western Sardinia margin, northwestern Mediterranean.
Mar Pet Geol 22:757–773
Schulz H, Emeis K, Volkmann N (1997) Organic carbon provenance
and maturity in the mud breccia from the Napoli mud volcano:
indicators of origin and burial depth. Earth Planet Sci Lett
147(1–4):141–151
Silver E, Breen N, Prasetyo H, Hussong D (1986) Multibeam study of
the Flores backarc thrust belt, Indonesia. J Geophys Res B
91(3):3489–3500
Sorel D (2000) A Pleistocene and still-active detachment fault and the
origin of the Corinth-Patras rift, Greece. Geology 28(1):83–86
Sorel D, Bizon G, Aliaj S, Hasani L (1992) Stratigraphical data on the
age and duration of the compressional tectonic phases in the
external Hellenids (NW Greece and Albania) since the Miocene.
Bull Soc Geol Fr 163(4):447–454
Staffini F, Spezzaferri S, Aghib F (1993) Mud diapirs of the
Mediterranean Ridge; sedimentological and micropaleontologi-
cal study of the mud breccia. Riv It Paleontol Stratigr 99(2):
225–254
Sumner R, Westbrook G (2001) Mud diapirism in front of the
barbados accretionary wedge: the influence of fracture zones and
north America–south America plate motions. Mar Pet Geol
18(5):591–613
Van Rensbergen P, Depreiter D, Pannemans B, Moerkerke G, Van
Rooij D, Marsset B, Akhmanov G, Blinova V, Ivanov M,
Rachidi M, Magalhaes V, Pinheiro M, Cunha M, Henriet JP
(2005) The El arraiche mud volcano field at the Moroccan
Atlantic slope, Gulf of Cadiz. Mar Geol 219(1):1–17
294 Mar Geophys Res (2007) 28:271–295
123

Volgin A, Woodside J (1996) Sidescan sonar images of mud
volcanoes from the Mediterranean Ridge; possible causes of
variations in backscatter intensity. Mar Geol 132(1–4):39–53
Westbrook G, Reston T (2002) The accretionary complex of the
Mediterranean Ridge: tectonics, fluid flow and the formation of
brine lakes. Mar Geol 186(1–2):1–8
Woodside JM, David L, Frantzis A, Hooker SK (2006) Gouge marks
on deep-sea mud volcanoes in the eastern Mediterranean: caused
by Cuvier’s beaked whales ? Deep Sea Res Part I–Oceanograp
Res. Papers 53:1762–1771
Zitter T (2004) Mud volcanism and fluid emissions in Eastern
Mediterranean neotectonic zones. Ph.D. thesis, Vrije Universi-
teit, Amsterdam, 140 pp
Zitter TAC, Huguen C, Woodside JM (2005) Geology of mud
volcanoes in the eastern Mediterranean from combined sidescan
sonar and submersible surveys. Deep Sea Res. Part I–Oceanogr
Res Papers 52(3):457–475
Mar Geophys Res (2007) 28:271–295 295
123