quantitative model of the growth of floodplains by vertical accretion
TRANSCRIPT

QUANTITATIVE MODEL OF THE GROWTH OF FLOODPLAINS BYVERTICAL ACCRETION
JOHN A. MOODY* AND BRENT M. TROUTMAN
US Geological Survey, Water Resources Division, Mail Stop 413, Denver Federal Center, Lakewood, Colorado 80225, USA
Received 25 February 1998; Revised 25 March 1999; Accepted 21 May 1999
ABSTRACT
Asimple one-dimensionalmodel is developed to quantitatively predict the change in elevation, over a periodof decades, forvertically accreting floodplains. This unsteadymodel approximates themonotonic growth of a floodplain as an incrementalbut constant increase of net sediment deposition per flood for those floods of a partial duration series that exceed a thresholddischarge corresponding to the elevation of the floodplain. Sediment deposition from each flood increases the elevation ofthe floodplain and consequently themagnitudeof the threshold discharge resulting in a decrease in the number of floods andgrowth rate of the floodplain.
Floodplain growth curves predicted by this model are compared to empirical growth curves based ondendrochronology and to direct field measurements at five floodplain sites. The model was used to predict the valueof net sediment deposition per flood which best fits (in a least squares sense) the empirical and field measurements; thesevalues fall within the range of independent estimates of the net sediment deposition per flood based on empiricalequations. These empirical equations permit the application of the model to estimate of floodplain growth for otherfloodplains throughout the world which do not have detailed data of sediment deposition during individual floods.Copyright # 2000 John Wiley & Sons, Ltd.
KEYWORDS: floodplain growth; fluvial geomorphology; vertical accretion
INTRODUCTION
North American floodplains have gone through a rapid cycle of utility within the short time span of Europeanoccupation. Initially, floodplains were important as locations near water for settlements and agriculture.Later, some floodplains were abandoned or used for dumping waste products. More recently, they haveregained respect and are now recognized as important features of the fluvial ecosystem. Interest in therestoration of rivers (US Department of Agriculture, 1979; Petts et al., 1992; National Research Council,1992; Bayley, 1995; Swanson, 1997), the origin of ecotones (Salo, 1990), the storage and remobilization ofcontaminants such as mining wastes (Gilbert, 1917; Kennedy, 1956; Lewin et al., 1977; Marron, 1992),radioactive wastes (Miller and Wells, 1986; Graf, 1994), urban wastes (Leenaers and Schouten, 1989) andchemicals (Sciacca, 1998), the possibility that rivers and their floodplains might be sinks for the `missing'carbon in the carbon cycle (Stallard, 1998), and the interaction between channel and floodplain processes(Sellin, 1964; Wolff and Burges, 1994; Brierley et al., 1997; Cazanacli and Smith, 1997) can be advancedwith the development of models of floodplain growth on a secular time scale of decades.Models of floodplain growth have been developed at several time and spatial scales. The avulsion model
(Bridge and Leeder, 1979; Bridge and Mackey, 1993) has been developed for time scales of several thousandyears in order to interpret ancient alluvium such as coarse-grained sandstone bodies which may serve asreservoirs for hydrocarbon. For shorter time scales, Howard (1992) has developed a meandering-sedimentation model that couples bank erosion and meandering with primarily diffusive floodplainsedimentation. Both models simplify the floodplain building processes by assuming that mean deposition
Earth Surface Processes and LandformsEarth Surf. Process. Landforms 25, 115±133 (2000)
CCC 0197-9337/2000/020115±19 $17.50Published in 2000 by John Wiley & Sons, Ltd. This article is a US government work and is in the public domain in the United States.
* Correspondence to: J. A. Moody, US Geological Survey, Water Resources Division, Mail Stop 413, Denver Federal Center,Lakewood, Colorado 80225, USA.

rates are steady for long time intervals and that the same processes act over large spatial scales of 105±106 mencompassing entire basins. These assumptions are not used in the spatially dependent floodplain model ofNicholas andWalling (1997a, 1997b), which focuses on predicting the detailed, two-dimensional distributionof sedimentation thickness over relatively small spatial scales of 10±103 m during individual floods at timescales of only 3±5 days. Nor are these assumptions used in the steady, longitudinal flow model of James(1985) which has been verified in the laboratory for even smaller spatial scales of 0�1±1 m. None of thesefloodplain growth models addresses the unsteady flow problem or the vertical aggradation of floodplainsduring individual floods over the secular time scale.River basins are so widely variable in their width, slope and alluvial material that any single type of
floodplain building process is unlikely to prevail throughout a basin. Nanson and Young (1981) havediscussed the two views of the floodplain building process: point bar-lateral migration (Wolman and Leopold,1957; Leopold et al., 1964) and overbank vertical accretion (Melton, 1936; Blake and Ollier, 1971; Ritter etal., 1973; Stene, 1980; Nanson, 1986). Nanson and Croke (1992) later classified the floodplain spectrum intothree classes (each class contains subclasses or orders) based on stream power and boundary resistance; theserange from high-energy non-cohesive floodplains (Class A) typically located in steep headwaters, to medium-energy non-cohesive floodplains (Class B), to low-energy cohesive floodplains (Class C) with low gradients.Stream power character varies from extreme, short-lasting (flash) floods with episodic frequencies to amixture of floods occurring several times a year to long-lasting floods with only annual frequency. Theseindividual floods create floodplain stratigraphy which by its nature indicates that the sedimentation is notcontinuous (Brakenridge, 1988), being an accumulation of layers from discrete floods, each with a differentcharacter.Many different classes of floodplains coexist within any river basin and since it is improbable that any
single model of floodplain growth could simulate all of the possible variations then models will, for the nearfuture, represent only certain floodplain classes or processes within a class. One process, point-bar lateralmigration, has been described by both qualitative facies models (Jackson, 1976) and quantitative models(Allen, 1970, 1977; Bridge, 1975). These models are specifically applicable to building floodplains within thechannel of a meandering river up to the elevation of the surrounding floodplain (Class B3; Nanson and Croke,1992) for short temporal and spatial scales. Another process, overbank vertical accretion, has been describedqualitatively by Blake and Ollier (1971), Nanson (1986) and Moody et al. (1999) but only a quantitativediffusion model (Pizzuto, 1987) has been developed and some doubt exists whether or not diffusion is thecorrect process to use in modelling overbank, vertically accreting floodplains.Examples of the overbank vertical-accretion process are the channel-expansion floodplains described by
Moody et al. (1999) which have developed within a channel widened by a catastrophic flood (similar to ClassA3; Nanson and Croke, 1992) on the Powder River in southeast Montana. Following the catastrophic flood of1978, new floodplains grew within the widened channel by overbank suspended-sediment deposition from amixed population of moderate floods. These moderate floods were caused by ice jams following thesnowmelt at low elevations in the late winter±early spring, by snowmelt at high elevations in late spring±earlysummer, and by flash floods following localized summer thunderstorms. Similar channel-expansion typefloodplains have developed along the Cimarron River in southwestern Kansas (Schumm and Lichty, 1963),and along Plum Creek in Colorado (Friedman et al., 1996). Along the Green River in Utah, reductions inflood discharges (as a result of the closing of the Flaming Gorge Dam in 1962) have produced the same effectas channel widening (Allred, pers. comm., 1999). Along some reaches of the river, the channel expandssignificantly during high discharges but is laterally stable, and overbank vertical accretion is the dominantprocess. Along other reaches, point-bar lateral migration is the dominant process, and floodplain buildingprocesses are mixed.This paper describes a quantitative floodplain growth model based on the unsteady nature of the vertically
accreting channel-expansion floodplains along the Powder River. Powder River is one of the few relativelylarge (annual mean discharge is 12�8 m3 sÿ1) unregulated rivers in the United States with plenty of suspendedsediment (annual mean concentration is 6200 mg lÿ1). As such, it provides an outdoor laboratory to study, inaccelerated time, how other floodplains with perhaps less suspended sediment might develop. In contrast toother models (Bridge and Leeder, 1979; James, 1985; Pizzuto, 1987; Bridge and Mackey, 1993; Nicholas and
Published in 2000 by John Wiley & Sons, Ltd. Earth Surf. Process. Landforms 25, 115±133 (2000)
116 J. A. MOODY AND B. M. TROUTMAN
Walling, 1997a, 1997b) that assume a steady-state continuous process, the incremental-growth modeldescribed in this paper is formulated to represent floodplain growth as the accumulation of equal sedimentlayers deposited by discrete but random floods several times per year over a secular time scale. The modelfocuses on the growth of the floodplain crest or levee which is the important interface where mass andmomentum are exchanged (Knight and Hamed, 1984; Rouve and Stein, 1990; Brierley et al., 1997). Thegeneral applicability of the incremental-growth model is tested first with data from two other rivers havingsimilar climatic conditions, Little Missouri River in western North Dakota (Everitt, 1968) and Beatton Riverin northeastern British Columbia (Hickin and Nanson, 1975; Nanson and Beach, 1977), and one havingdifferent climatic conditions, Brandywine Creek in southeastern Pennsylvania (Wolman, 1955; Wolman and
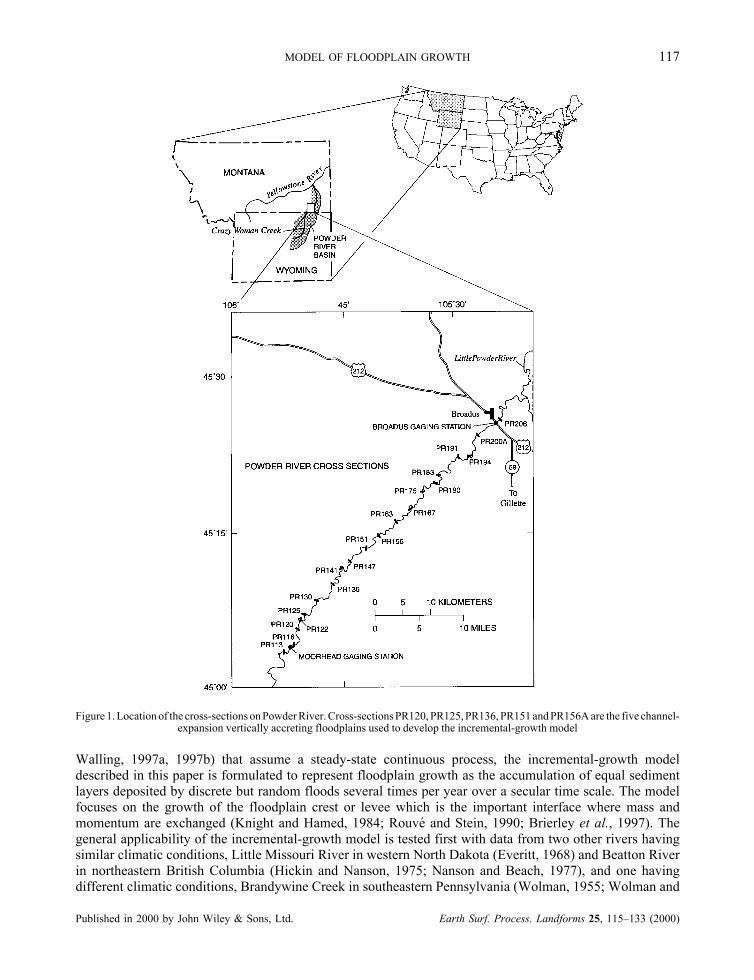
Figure1.Location of the cross-sections onPowderRiver.Cross-sectionsPR120, PR125,PR136, PR151andPR156Aare the five channel-expansion vertically accreting floodplains used to develop the incremental-growth model
Published in 2000 by John Wiley & Sons, Ltd. Earth Surf. Process. Landforms 25, 115±133 (2000)
MODEL OF FLOODPLAIN GROWTH 117

Leopold, 1957; Pizzuto, 1987). The paper concludes with a discussion of applications to other floodplains inthe world.
MODEL DEVELOPMENT
This incremental-growth model for floodplains is a quantitative model which predicts the elevation of thefloodplain with time and is similar to the one suggested and used by Wolman and Leopold for BrandywineCreek in southeastern Pennsylvania (Wolman, 1955; Wolman and Leopold, 1957): `If a specific thickness ofmaterial were deposited on the flood plain every time a river over flowed its banks it would be possible tocompute the rate of rise of the flood-plain surface by the use of flood frequency data.' This model has beendeveloped for vertically accreting floodplains along Powder River (Figure 1) which has certain hydraulic andsedimentologic characteristics and for which 18 years of net sediment deposition data exist. It is a one-dimensional model, using a partial-duration flood series to predict the vertical growth of the floodplain crestor levee as a consequence of net sediment deposition by all floods which are higher than the floodplain crestor levee. Data for sediment deposition per flood for the Powder River are used to calibrate an empiricalequation for predicting flood deposition along other rivers.
Hydraulic and sedimentologic characteristics
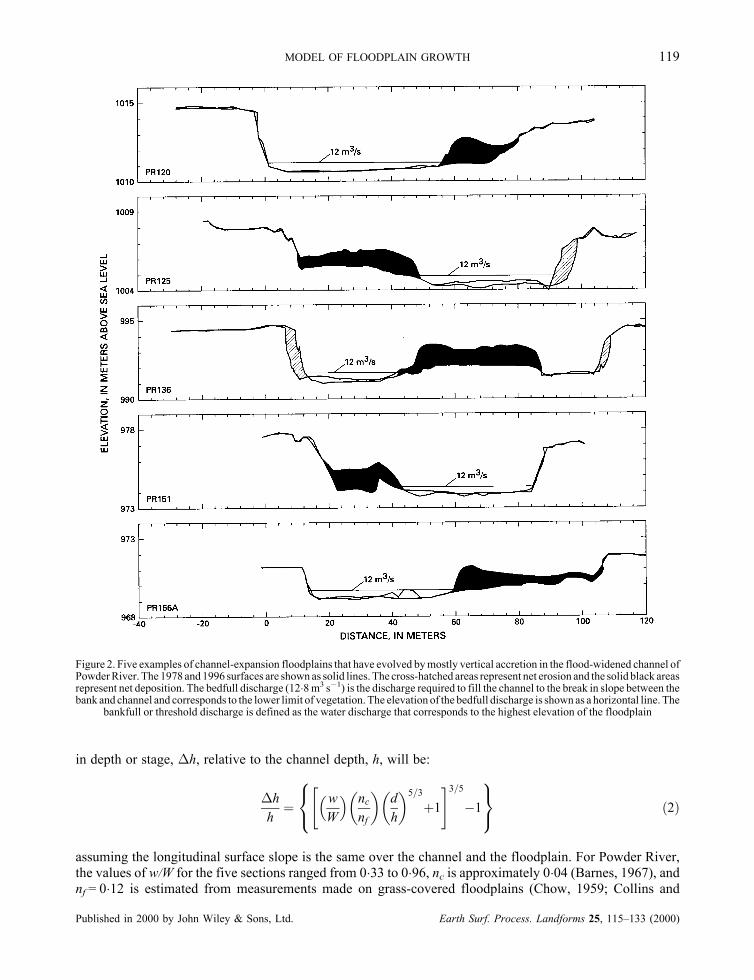
The model is based on 18 years of data for five of 23 cross-sections on the Powder River which areexamples of vertically accreting channel-expansion floodplains. The change in elevation of the channel bedin the Powder River has not shown any consistent trend since the 1978 flood. Linear regressions of theminimum riverbed elevation versus time after the 1978 flood (for the five sections PR120, PR125, PR136,PR151 and PR156A; Figure 2) indicated increasing (two sections), decreasing (two sections), and no change(one section) in the elevation of the channel bed with time. Correlation coefficients were less than 0�68 for allfive sections and averaged 0�28. Other cross-sections (18) representing other types of floodplains did notshow any consistent trend in changes of the channel bed elevation between 1978 and 1998. Otherinvestigators have reported similar observations for the Gila River (Burkham, 1972), Brandywine Creek (Piz-zuto, 1987) and Paria River (Topping, 1997). Thus, the incremental-growth model assumes that the minimumbed elevation is constant. This is not a fixed restraint, however, and the possibility of the channel bedchanging relative to the floodplain is investigated later.The bedload component (83 per cent bed material is>0�125 mm) in the Powder River is only 2±7 per cent
of the suspended load (Hembree et al., 1952; Litke, 1983; Moody and Meade, 1990) and the floodplains arecomposed primarily of very fine sand (0�063±0�125 mm) and silt (82 per cent finer than 0�125 mm; Moody etal. 1999). During high discharge, some of the bed material that moves as bedload at low discharge becomespart of the suspended load and thus the bedload is an even smaller proportion of the suspended load duringfloods. Therefore, the bedload component is neglected (as a first order approximation) in the incremental-growth model and the initial process of sedimentation on the floodplains is assumed to be suspended-sediment deposition.The effect of the floodplain on the stage±discharge relation is also negligible depending upon the ratios of
the floodplain width to channel width, floodplain flow depth to channel flow depth, and floodplain roughnessto channel roughness. To estimate this effect we can imagine a barrier at the edge of a rectangular channel ofwidth W, which prevents water from entering a level floodplain of width w, so that the stage±dischargerelation is:
Q � Wh5=3S1=2
nc�1�
where a Manning-type resistance, nc, is assumed in the channel, h is the water depth in the channel, and S isthe water-surface slope. If the water depth is above the floodplain and the barrier is removed allowing waterto flow at a depth d, downstream across the floodplain with a roughness of nf, then an estimate of the change
Published in 2000 by John Wiley & Sons, Ltd. Earth Surf. Process. Landforms 25, 115±133 (2000)
118 J. A. MOODY AND B. M. TROUTMAN
in depth or stage, �h, relative to the channel depth, h, will be:
�h
h� w
W
� � nc
nf
� �d
h
� �5=3
�1" #3=5
ÿ18<:
9=; �2�
assuming the longitudinal surface slope is the same over the channel and the floodplain. For Powder River,the values of w/W for the five sections ranged from 0�33 to 0�96, nc is approximately 0�04 (Barnes, 1967), andnf = 0�12 is estimated from measurements made on grass-covered floodplains (Chow, 1959; Collins and
Figure 2. Five examples of channel-expansion floodplains that have evolved bymostly vertical accretion in the flood-widened channel ofPowderRiver. The 1978 and1996 surfaces are shownas solid lines. The cross-hatched areas represent net erosion and the solid black areasrepresent net deposition. The bedfull discharge (12�8m3 sÿ1) is the discharge required to fill the channel to the break in slope between thebank and channel and corresponds to the lower limit of vegetation. The elevation of the bedfull discharge is shownas a horizontal line. The
bankfull or threshold discharge is defined as the water discharge that corresponds to the highest elevation of the floodplain
Published in 2000 by John Wiley & Sons, Ltd. Earth Surf. Process. Landforms 25, 115±133 (2000)
MODEL OF FLOODPLAIN GROWTH 119

Flynn, 1978). The family of curves defined by w/W for � h/h versus d/h indicates that for shallow flow depthson the floodplain (d/h<0�2) the change in stage is <2 per cent and is<5 per cent for d/h<0�4. Thus, thestage±discharge relation will not change significantly for stages slightly above the elevation of the floodplain;this was also shown by Knight and Demetriou (1983) for smooth floodplains in a flume. As the floodplaingrows vertically upward, the imaginary barrier becomes the real levee maintaining the stage±dischargerelation. This small effect is also supported by unpublished data from the Green River near Green River(Allred, pers. comm., 1999) where an analogous channel-expansion floodplain developed at the gaugingcross-section and the stage±discharge relation did not change significantly based on the fact that theminimum riverbed elevation did not indicate any trend with time. Therefore, the observed decrease ofsedimentation with time on floodplains noted by several authors (Wolman and Leopold, 1957; Everitt, 1968;Nanson, 1980; Howard, 1992) is modelled by the incremental-growth model as a consequence of the increasein elevation of the floodplain which increases the threshold or bankfull discharge because the stage±dischargerelation and channel bed elevation remain fixed. Thus, as flood discharges increase, the frequency of floodingdecreases and the net sediment deposition decreases with time.
Partial duration flood series
Floodplain growth does not occur only during the maximum annual flood but, as Wolman and Miller(1960) point out, during moderate but more frequent floods. These floods are sufficiently large to cover thefloodplain and recur `at least once each year or two and in many cases several or more times per year'(Wolman and Miller, 1960) and in some cases as much as seven times per year (Lambert and Walling, 1987).For this reason, we use the partial-duration series rather than the annual maximum series to determine theflood frequency characteristics (Table I). Unlike the annual series, the partial-duration series is defined byfloods which exceed a baseflow discharge (Chow, 1964). In this paper, we have selected the base value to bethe bedfull discharge because it is an important hydrogeomorphic parameter (Brakenridge, 1988) andcorresponds to the reference level used by Osterkamp and Hedman (1982) and the normal stage defined byBrakenridge (1988). It is defined geomorphically to be the discharge when the water level is at the elevationof the break in slope between the relatively steep bank and the nearly level mobile channel bed. This usuallycoincides with the lower limit of vegetation (Hupp and Osterkamp, 1985) which is indicative of a floodplainand is perhaps easier to identify than bankfull discharge. Discharges less than bedfull flow are not relevant to
Table I. Flood frequency characteristics of four ¯oodplains
Minimumdischarge(m3 sÿ1) �
Discharge (m3 sÿ1) Ln (discharge) Duration (days) Ln (duration)
River Max. Med. Mean SD Max. Med. Mean SD
Beatton River nearFort St. John, BritishColumbia 52�5 3�2 1700 277 5�51 0�99 105 17 2�76 1�13
Brandywine Creek atChadds Ford, Penn. 11�2 17�8 300 20�7 3�21 0�68 209 2 0�94 1�04
Little Missouri R. nearWatford, North Dakota 15�4 6�1 1560 39�4 3�97 1�06 95 5 1�63 1�23
Powder River atMoorhead, Montana 12�8 6�4 779 25�3 3�52 0�88 129 5 1�75 1�25Based on dailymean discharges greater than theminimumdischarge equal to the annual mean discharge; � is themean number offloods per year greater than the annual mean discharge; Max., maximum; Med., median, SD, standard deviation
Published in 2000 by John Wiley & Sons, Ltd. Earth Surf. Process. Landforms 25, 115±133 (2000)
120 J. A. MOODY AND B. M. TROUTMAN
floodplain growth. For Powder River the bedfull discharge is 12�8 m3 sÿ1. It actually equals the baseflowdefined as the time average or annual mean discharge, and is exceeded only 24 per cent of the time. Between1 October 1929 and 30 September 1995 (excluding 1973 when no data were collected), 429 floods in PowderRiver were greater than 12�8 m3 sÿ1 corresponding to an average of 6�4 floods per year with a medianduration of 5 days. Similar data for the Beatton River, Brandywine Creek and Little Missouri River are listedin Table I, and because the bedfull discharge was not known for these rivers, the time-averaged annual meandischarge or baseflow discharge is listed.Flood frequency distributions have been approximated as log-normal distributions (Chow, 1954; Wolman
and Miller, 1960) and because the partial-duration flood series is defined by a baseflow discharge we haveused a truncated log-normal probability distribution given by:
F�q� �ZqQM
�
x�������2�p e
ÿ�log xÿ��22�2 dx; q � QM �3�
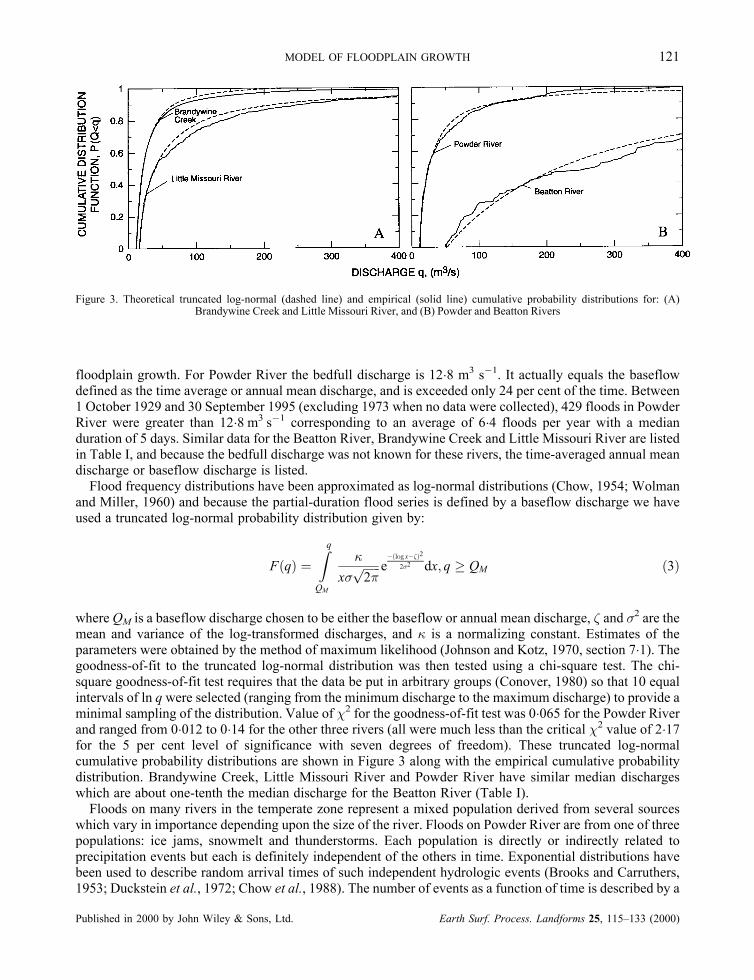
where QM is a baseflow discharge chosen to be either the baseflow or annual mean discharge, � and �2 are themean and variance of the log-transformed discharges, and � is a normalizing constant. Estimates of theparameters were obtained by the method of maximum likelihood (Johnson and Kotz, 1970, section 7�1). Thegoodness-of-fit to the truncated log-normal distribution was then tested using a chi-square test. The chi-square goodness-of-fit test requires that the data be put in arbitrary groups (Conover, 1980) so that 10 equalintervals of ln q were selected (ranging from the minimum discharge to the maximum discharge) to provide aminimal sampling of the distribution. Value of �2 for the goodness-of-fit test was 0�065 for the Powder Riverand ranged from 0�012 to 0�14 for the other three rivers (all were much less than the critical �2 value of 2�17for the 5 per cent level of significance with seven degrees of freedom). These truncated log-normalcumulative probability distributions are shown in Figure 3 along with the empirical cumulative probabilitydistribution. Brandywine Creek, Little Missouri River and Powder River have similar median dischargeswhich are about one-tenth the median discharge for the Beatton River (Table I).Floods on many rivers in the temperate zone represent a mixed population derived from several sources
which vary in importance depending upon the size of the river. Floods on Powder River are from one of threepopulations: ice jams, snowmelt and thunderstorms. Each population is directly or indirectly related toprecipitation events but each is definitely independent of the others in time. Exponential distributions havebeen used to describe random arrival times of such independent hydrologic events (Brooks and Carruthers,1953; Duckstein et al., 1972; Chow et al., 1988). The number of events as a function of time is described by a
Figure 3. Theoretical truncated log-normal (dashed line) and empirical (solid line) cumulative probability distributions for: (A)Brandywine Creek and Little Missouri River, and (B) Powder and Beatton Rivers
Published in 2000 by John Wiley & Sons, Ltd. Earth Surf. Process. Landforms 25, 115±133 (2000)
MODEL OF FLOODPLAIN GROWTH 121

Poisson process where event inter-arrival times are exponential and independent. The parameter � for theprocess is the mean number of floods per year (Table I) and is estimated by N/n, where N is the total numberof floods occurring in n years. Brandywine Creek has about three times more floods per year than either theLittle Missouri or the Powder River. The Beatton River has the fewest floods per year and these occur fromApril to October (43 per cent in May and June) whereas the Little Missouri and Powder Rivers have somefloods in February, March and November (27±30 per cent in May and June), and Brandywine Creek has afairly even distribution of floods throughout the year (18 per cent in May and June). In general during floods,six phases of sediment erosion and deposition have been described (Zwolinski, 1992); however, at the presenttime, the physics of erosion and deposition during a flood are poorly quantified so that the actual amounts oferosion and deposition cannot be calculated and therefore the net sediment deposition (deposition minuserosion) must be estimated.
Net sediment deposition rate
Sediment deposition rates are easier to quantify than erosion rates because simple settling is much easier tomodel mathematically than the complex hydraulic processes involved in erosion. In general, mostmathematical models have used depth-integrated mass balance equations to specify the deposition orerosion (source or sink) terms in a one- or two-dimensional model. A steady-state model of Pizzuto (1987)avoided specifying both deposition and erosion rates by using `an equilibrium vertically integratedconcentration' which allowed him to predict relative deposition rates and he estimated the deposition rate perflood by dividing the total accumulation by the number of floods giving an average deposition per flood of1�4 cm for Brandywine Creek. The two-dimensional, step-wise, steady-state model of Nicholas and Walling(1997a) specified a net sediment deposition rate but reported difficulty in using Engelund (1970) and Parker(1978) equations when flow depths on floodplains approached zero and therefore they used an empiricalrelation requiring calibration. Total net deposition for a single flood lasting 5 days was then calculated as thesum of the deposition at each time step at each grid node and ranged from 0 to 0�10 cm (assuming a bulkdensity of 1�2 g cmÿ3). This suggests that using an empirical approach based on field measurements willsimplify the complex unsteady problem (involving the variation of sediment concentration, particle-sizedistribution, turbulent eddy diffusivities, vertical velocity profiles as functions of time as well as spatiallyvariable floodplain topography) until a useful physically based solution can be found for predicting thedeposition per flood in shallow-water conditions.Field measurements of sediment deposition during a single flood vary depending upon the river and the
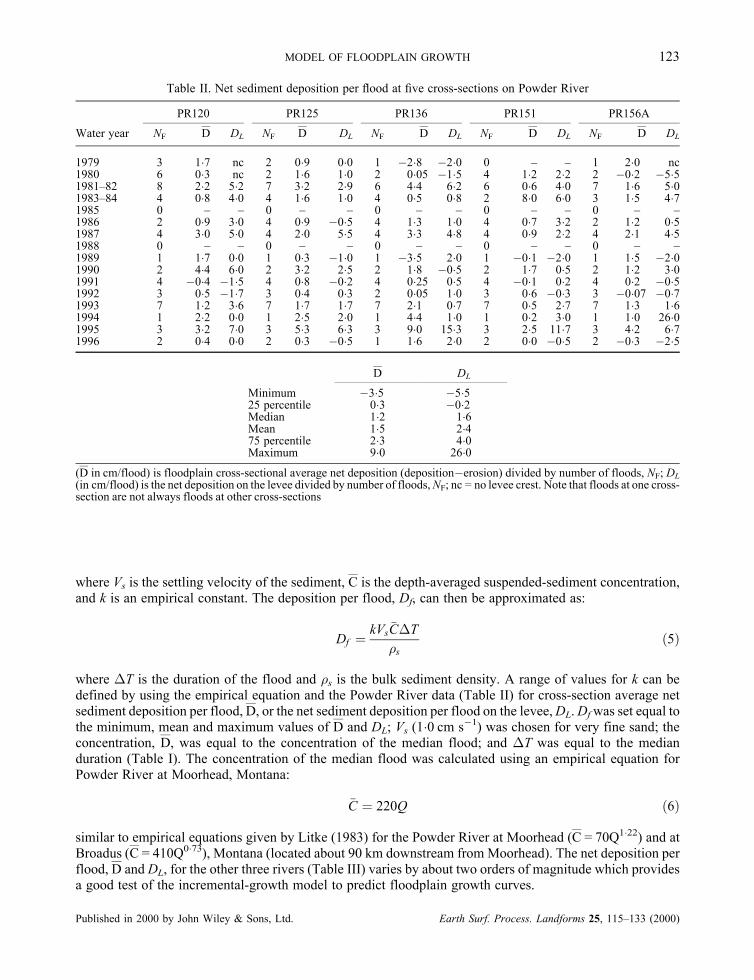
location relative to the river, and are usually measurements for catastrophic floods. Such catastrophic floodshave deposited 122±183 cm onMissouri River levees in 1881, 0�5±84 cm on the Mississippi River (excludingpoint bars) in 1973, 0�2±60 cm on the Ob' River (excluding point bars) in 1969, and 0�3±56 cm on the OhioRiver in 1937 (Bridge and Leeder, 1979); however, most of the `work' is done by more frequent, moderatefloods (Wolman and Miller, 1960). Average cross-sectional net deposition rates for 50 such moderate floodsat the five cross-sections during 18 years on Powder River ranged from ÿ3�5 to 9�0 cm/flood with a mean of1�5 cm/flood (Table 2). Net deposition on the levee was greater and ranged fromÿ5�5 to 26�0 cm/flood with amean of 2�4 cm/flood. As a first approximation, the net deposition per flood is considered as a constant;however, the annual deposition will vary depending upon the number of floods each year.Data on net sediment deposition per flood may not exist for other rivers, so that an estimate can be made by
combining the field data from the Powder River with an empirical equation. Howard (1992) proposed in hischannel migration model of a floodplain that the deposition rate depends upon the relative floodplain heightbut this seems to require knowing the unknown±the `maximum floodplain height'. Others (Parker, 1978;Pizzuto, 1987) have suggested an equation for the deposition rate, Dr, as a function of sediment diffusivitywhich depends on actual flow conditions, but this is not conducive to a priori estimates of the deposition rateand, as mentioned above, Nicholas and Walling (1997a) found it difficult to use this type of equation inshallow water so they proposed the empirical equation:
Dr � kVs�C �4�
Published in 2000 by John Wiley & Sons, Ltd. Earth Surf. Process. Landforms 25, 115±133 (2000)
122 J. A. MOODY AND B. M. TROUTMAN
where Vs is the settling velocity of the sediment, C is the depth-averaged suspended-sediment concentration,and k is an empirical constant. The deposition per flood, Df, can then be approximated as:
Df � kVs�C�T
�s�5�
where �T is the duration of the flood and �s is the bulk sediment density. A range of values for k can bedefined by using the empirical equation and the Powder River data (Table II) for cross-section average netsediment deposition per flood, D, or the net sediment deposition per flood on the levee,DL.Dfwas set equal tothe minimum, mean and maximum values of D and DL; Vs (1�0 cm sÿ1) was chosen for very fine sand; theconcentration, D, was equal to the concentration of the median flood; and �T was equal to the medianduration (Table I). The concentration of the median flood was calculated using an empirical equation forPowder River at Moorhead, Montana:
�C � 220Q �6�
similar to empirical equations given by Litke (1983) for the Powder River at Moorhead (C = 70Q1�22) and atBroadus (C = 410Q0�73), Montana (located about 90 km downstream from Moorhead). The net deposition perflood, D and DL, for the other three rivers (Table III) varies by about two orders of magnitude which providesa good test of the incremental-growth model to predict floodplain growth curves.
Table II. Net sediment deposition per ¯ood at ®ve cross-sections on Powder River
PR120 PR125 PR136 PR151 PR156A
Water year NF D DL NF D DL NF D DL NF D DL NF D DL
1979 3 1�7 nc 2 0�9 0�0 1 ÿ2�8 ÿ2�0 0 ± ± 1 2�0 nc1980 6 0�3 nc 2 1�6 1�0 2 0�05 ÿ1�5 4 1�2 2�2 2 ÿ0�2 ÿ5�51981±82 8 2�2 5�2 7 3�2 2�9 6 4�4 6�2 6 0�6 4�0 7 1�6 5�01983±84 4 0�8 4�0 4 1�6 1�0 4 0�5 0�8 2 8�0 6�0 3 1�5 4�71985 0 ± ± 0 ± ± 0 ± ± 0 ± ± 0 ± ±1986 2 0�9 3�0 4 0�9 ÿ0�5 4 1�3 1�0 4 0�7 3�2 2 1�2 0�51987 4 3�0 5�0 4 2�0 5�5 4 3�3 4�8 4 0�9 2�2 4 2�1 4�51988 0 ± ± 0 ± ± 0 ± ± 0 ± ± 0 ± ±1989 1 1�7 0�0 1 0�3 ÿ1�0 1 ÿ3�5 2�0 1 ÿ0�1 ÿ2�0 1 1�5 ÿ2�01990 2 4�4 6�0 2 3�2 2�5 2 1�8 ÿ0�5 2 1�7 0�5 2 1�2 3�01991 4 ÿ0�4 ÿ1�5 4 0�8 ÿ0�2 4 0�25 0�5 4 ÿ0�1 0�2 4 0�2 ÿ0�51992 3 0�5 ÿ1�7 3 0�4 0�3 2 0�05 1�0 3 0�6 ÿ0�3 3 ÿ0�07 ÿ0�71993 7 1�2 3�6 7 1�7 1�7 7 2�1 0�7 7 0�5 2�7 7 1�3 1�61994 1 2�2 0�0 1 2�5 2�0 1 4�4 1�0 1 0�2 3�0 1 1�0 26�01995 3 3�2 7�0 3 5�3 6�3 3 9�0 15�3 3 2�5 11�7 3 4�2 6�71996 2 0�4 0�0 2 0�3 ÿ0�5 1 1�6 2�0 2 0�0 ÿ0�5 2 ÿ0�3 ÿ2�5
D DL
Minimum ÿ3�5 ÿ5�525 percentile 0�3 ÿ0�2Median 1�2 1�6Mean 1�5 2�475 percentile 2�3 4�0Maximum 9�0 26�0
(D in cm/flood) is floodplain cross-sectional average net deposition (depositionÿerosion) divided by number of floods, NF; DL
(in cm/flood) is the net deposition on the levee divided by number of floods,NF; nc = no levee crest. Note that floods at one cross-section are not always floods at other cross-sections
Published in 2000 by John Wiley & Sons, Ltd. Earth Surf. Process. Landforms 25, 115±133 (2000)
MODEL OF FLOODPLAIN GROWTH 123

Incremental-growth model
The incremental-growth model represents the increase in the average elevation across the floodplain not asa continuous process in time but as an incremental process that raises the elevation of the floodplain duringeach flood by a constant thickness equal to the net deposition per flood, Df. Furthermore, since the minimumbed elevation is constant and the effect of the floodplain is negligible on the stage±discharge relation then themean depth, h, and the discharge, Q, are related by:
h � cQ f �7�
The initial elevation of the floodplain is e (0) and the average (or expected) floodplain elevation at time t ise (t). Corresponding to the elevation e(t), a threshold discharge QT(t) is defined by:
QT�t� � e�t� ÿ emin
c
� �1f
�8�
where emin is the minimum riverbed elevation. Sediment deposition will occur for a flood with discharge Q attime t only if Q> QT(t). Under the assumption that flood arrivals constitute a Poisson process with rate �floods per year, then the average incremental increase, �e, per year is approximated by:
�e�t� � Df �T�t��t �9�
where
�T �t� � ��1ÿ F�QT�t��� �10�
�t is one year, and Df can be either D or DL. Because the quantity �T(t) is equal to the flood rate �multipliedby an exceedance probability, which is decreasing in time as the floodplain grows, it represents an `effective'rate of occurrence of floods. The incremental increase each year, �e, is added to the elevation, e(t), of the
Table III. Estimates of net sediment deposition per ¯ood
River
Mediandischarge(m3 sÿ1)
Concentra-tion* formediandischarge(mg lÿ1)
Median¯ood
duration(days)
Cross-sectional averagedeposition (cm) Levee deposition (cm)
Minimum Mean Maximum Minimum Mean Maximum
Powder 25�3 5600 5 ÿ3�5 1�5 9�0 ÿ5�5 2�4 26�0k 0�0018 0�00074 0�0045 ÿ0�0027 0�0012 0�0130Beatton 277 5300 17 ÿ12 4�8 29 ÿ18 7�8 84Brandywine 20�7 100 2 ÿ0�03 0�01 0�06 ÿ0�04 0�02 0�19Little Missouri 39�4 3300 5 ÿ2�1 0�9 5�3 ÿ3 1�4 15
Empirical equation Df = k Vs C �T, with Vs = 1�0 cm sÿ1 (very fine sand) and assuming a bulk density of 1�20 g cmÿ3* Concentrations were calculated using the following empirical equations:BeattonRiver:C (mg lÿ1)=11Q1�1 (m3 sÿ1), r2= 0�98; sediment data 24May1988 to13 June1992were providedbyEnvironmentCanada, Environmental Service and Applications, Vancouver, BCBrandywine Creek: C (mg lÿ1) = 1�4 Q1�4 (m3sÿ1), estimated fromWolman (1955, figure 21)Little Missouri River: C (mg lÿ1) = 450Q0�54 (m3sÿ1), r2=0�31, 80 measurements, US Geological Survey ± North Dakota 1978±1994)
Published in 2000 by John Wiley & Sons, Ltd. Earth Surf. Process. Landforms 25, 115±133 (2000)
124 J. A. MOODY AND B. M. TROUTMAN

floodplain and a new threshold discharge is computed for the following year using Equation 8. Repeating thisprocedure iteratively generates a stair-like theoretical growth curve for the elevation of the floodplain as afunction of time.
RESULTS
Theoretical growth curves were calculated for four floodplains using the incremental-growth model and thencompared to the floodplain growth curves determined by direct measurements for the Powder River and byindirect measurements for the Beatton River, Brandywine Creek and Little Missouri River (Figure 4).Theoretical growth curves for the Powder River were compared to the annual or biannual measurements ofthe growth of channel-expansion floodplains at the five sections along Powder River for 18 years after theflood in 1978 (Moody and Meade, 1990; Moody et al., 1999). The theoretical curves for the Beatton andLittle Missouri Rivers were compared to the empirical growth curves based on dendrochronology techniques(Nanson and Beach, 1977; Everitt, 1968). The theoretical curve for Brandywine Creek was compared to thesingle measurement of time and elevation (a carbon-14 date gave an age of 1450� 200 years BP and theelevation of the floodplain was 1�7 m; Wolman and Leopold, 1957). Rather than selecting a single value of Df
from Table III, we obtained a least-squares estimate by varying the values ofDf until we minimized the mean-square error between the theoretical growth curve and the empirical (Beatton and Little Missouri) ormeasured (Powder River) growth curves. For Brandywine Creek, the theoretical growth curve was started at0�48 m above the channel bed (not at the channel bed as shown in Wolman and Leopold, 1957) correspondingto the water surface at the mean annual discharge. With only one point for the Brandywine, the deposition perflood could not be determined by minimizing the mean-square error, so the net deposition per flood wasselected which produced a theoretical growth curve that passed between a horizontal line segmentrepresenting the error bars for the uncertainty in the age of the floodplain surface (not shown in Figure 4 but atan elevation of 1�7 m and drawn from 1250 to 1650 years).The least-squares estimates of the net deposition per flood, De, were all within the range of possible
estimated values (Table III). Estimates for the five sections along the Powder River were greater than the
Figure4.Theoretical floodplain growth curves for four floodplains using aconstant net depositionper flood thatminimizes the root-mean-square error between the theoretical and empirical growth curves or between the theoretical and field measured growth curves. Time isfrom the beginning of floodplain growth. The average number of floods per year is listed in Table I. Data for the Beatton River were takenfrom Nanson and Beach (1977), and for the Little Missouri River from Everitt (1968, figure 5). Data for the Powder River are measuredelevations of the floodplain crest at section PR120 described byMoody andMeade (1990).One data point forBrandywineCreek (at about
1450 years and at an elevation of 1�7 m) was published by Wolman and Leopold (1957) but is not shown on this figure.
Published in 2000 by John Wiley & Sons, Ltd. Earth Surf. Process. Landforms 25, 115±133 (2000)
MODEL OF FLOODPLAIN GROWTH 125

mean or median values (Table II) and ranged from 5±6 cm/flood (only PR120 is shown in Figure 4). Themodel accounted for 73±90 per cent of the total variance about the temporal mean elevation. For the BeattonRiver, the least-squares estimate was 9 cm/flood and the model accounted for 97 per cent of the total varianceand for the Little Missouri River it was 13 cm/flood and the model accounted for 99 per cent of the totalvariance. For the Brandywine, a net deposition of 0�05 cm/flood produced a theoretical growth curve thatpassed between the error bars. Most predicted values of the net sediment deposition per flood are only two tothree times larger than the mean in Table III with the exception of the Little Missouri River. All predictedvalues, however, fall within the ranges of net sediment deposition per flood estimated using the empiricalmethod calibrated using Powder River data.
DISCUSSION
The incremental-growth model produces reasonable growth curves for vertically accreting floodplains of thechannel-expansion type on Powder River and for unknown types of floodplain along the Beatton River,Brandywine Creek and Little Missouri River. In this section, we will examine several issues associated withthis model: (1) flood sedimentation, (2) channel-bed elevation, and (3) general application of the model toother rivers in the world.
Flood sedimentation
Net sediment deposition is a combination of two independent processes: sediment deposition and sedimenterosion. The physics of these processes are different and conceptual models (Mertes, 1990; Zwolinski, 1992)assume that two erosional maxima occur (one during the rapid rise in stage and one during the rapid fall instage) and deposition occurs essentially in phase with the hydrograph. While the frequency distribution of netsediment deposition per flood for the Powder River looks normal, it is still skewed and has both positive andnegative values (not indicative of a log-normal distribution) which might result from the difference of twolog-normal distributions. In this case, the mean value for only the deposition process would be greater and thevariance less than the net sediment deposition values. This may explain why the least-squares estimates weregreater than the mean and median values in Table II. Measurements of net sediment deposition are relativelyeasy to make (measurements before and after flood) but the use of these data complicates interpretations. Netdeposition for aggrading floodplains is positive and the incremental-growth model always predicts amonotonically increasing elevation of the floodplain. However, observed net sediment deposition per floodvalues in Table II are both positive and negative so that the actual floodplain sometimes increases and thendecreases during any specific year but on average it increases over the secular time scale. Separatemeasurements of erosion and deposition during several floods would provide data to define a joint probabilitymodel of erosion and deposition. Such an improved model could incorporate both processes to determine thenet sediment deposition during floods.The net sediment deposition for Powder River has a relatively narrow range (about one order of magnitude)
and even catastrophic floods vary by only about two orders of magnitude (Bridge and Leeder, 1979). Netsediment deposition per flood for the Powder River did not indicate any definite increase with time eventhough the threshold discharge did increase as the floodplain grew vertically upward. One might expect thatthe larger floods required to inundate the higher floodplain would have deposited more sediment. Becausethey did not, this then might suggest that larger floods, while they deposit more sediment, also erode moresediment such that the relatively narrow range in net sediment deposition is smaller than might otherwise beexpected. The relatively narrow range of net sediment deposition might also be attributed to the fact that onlythe top portion of water and sediment in a channel above the mean elevation of the floodplain enters thefloodplain (Parker et al., 1996). The vertical gradient of the suspended-sediment distribution in this topportion is less than the gradient near the bottom so that the concentration is relatively uniform and may onlyvary a few orders of magnitude within the narrow range of flood discharges.The empirical constant, k (in Equation 5), is estimated from the Powder River data and this introduces the
question of whether that constant is appropriate for other rivers. It is essentially a measure of the efficiency ofthe net deposition process independent of the sediment concentration but dependent upon the turbulent or
Published in 2000 by John Wiley & Sons, Ltd. Earth Surf. Process. Landforms 25, 115±133 (2000)
126 J. A. MOODY AND B. M. TROUTMAN
unsteady flow conditions. By similarity these flow conditions are the same over any floodplain if theReynolds number and other dimensionless numbers are the same. The use of the empirical constant has,therefore, some general application. The range of values of k in Table III probably reflects a range inReynolds number for the Powder River as well as the other floodplains. The least-squares estimate of the netsediment deposition for the Little Missouri River (13 cm/flood) was about 10 times greater than the mean ormedian estimate in Table III and may reflect more variability in flow conditions.The deposition process has been initially conceived as a advective process transporting suspended
sediment from the channel across the floodplain. Several observers (Kesel et al., 1974; Pizzuto, 1987) havereported that sediment thickness decreases exponentially away from the channel and Parker et al. (1996) haveshown theoretically that the concentration varies exponentially with distance as water flows over a point bar.Sediment deposition on the floodplain probably initially reflects this exponential concentration but it is verylikely that during some stages of a flood, the bedload transport process advects some sediment from the leveeto distal portions of the floodplain and perhaps after the flood has receded the aeolian transport processdiffuses additional sediment away from the crest or levee.A wide range of sediment deposition rates has been published for Brandywine Creek. Both the empirical
(0�01 cm/flood) and the predicted (0�05 cm/flood) estimates of the net sediment deposition per flood forBrandywine Creek were less than the value of 1�4 cm/flood estimated by Pizzuto (1987) for the post-settlement period (c. 1730 to 1980s). During the pre-settlement period, an average overbank accretion rate of0�05 cm/year was calculated by Ritter et al. (1973) from seven estimates spanning 1200 to 6200 years BP.Erosion peaked during the agricultural period (1850 to 1930) and was reduced about 200 per cent (Jacobsonand Coleman, 1986) during the recent period (1930 to 1980s). The empirical estimate of the net sedimentdeposition per flood was based only on data for the recent period and so reflects a soil erosion rate higher thanthe pre-settlement period but probably less than the agricultural period included in Pizzuto's (1987) estimate.The net sediment deposition, 0�05 cm/flood, predicted by the incremental-growth model seems reasonablebecause it represents an average value for at least the last 1450 years and includes high values during the post-settlement period but also includes low values inferred for the much longer pre-settlement period. If Wolmanand Leopold's hypothetical curve is examined closely, the apparent depositional `rate' per flood forBrandywine Creek seems large. If Figure 64 (Wolman and Leopold, 1957) is enlarged and the elevation of thefloodplain is scaled off the enlarged figure, about 91 cm of accretion has occurred in 10 years. Dividing by thethickness (0�15 cm) they assumed to be deposited per flood gives about 606 floods or about 61 floods peryear. This is much too large for the number of floods per year, so that it should probably be interpreted as `theaverage number of days per year on which a given stage is equalled or exceeded', not the number of floods.This is equivalent to a deposition of about 9 cm/year or 0�5 cm per flood event (assuming 17�8 flood eventsper year) and is probably also reasonable for the recent or earlier agricultural period but is probably too high ifthe pre-settlement period is considered. Thus, the difference in the assumed deposition rate (9 cm/year) usedby Wolman and Leopold (1957) and the net deposition predicted by the incremental-growth model (0�05 cm/flood) illustrates the importance in knowing the historical land use before predicting the growth of floodplains by vertical accretion.
Bed elevation
We established that the channel-bed elevation of Powder River has not shown a significant trend with timesince the 1978 flood. But we do not have this information for the Beatton River which had the most rapidgrowth of all four floodplains (Figure 4). However, vertical aggradation and degradation of both the channelbed and floodplain are possible. Because channel aggradation might be an explanation for the rapid growthrate of the Beatton River floodplain, the effect of channel-bed aggradation was investigated for the BeattonRiver. The channel bed must increase at a slower rate than the floodplain because the empirical floodplaingrowth curves always indicated that the floodplain is increasing relative to the channel bed. Therefore, theincremental-growth model was run for the Beatton River assuming three different growth rates for thechannel bed: 0�50Df, 0�25Df and 0�10Df. The net sediment deposition was again determined by minimizingthe mean-square error. The corresponding estimated values of Df were 5, 7 and 8 cm/flood, and the modelaccounted for 66, 86 and 94 per cent of the total variance, respectively. Increasing the elevation of the channel
Published in 2000 by John Wiley & Sons, Ltd. Earth Surf. Process. Landforms 25, 115±133 (2000)
MODEL OF FLOODPLAIN GROWTH 127

bed decreases the average water depth and corresponding threshold discharge, thus increasing the floodprobability and the number of floods. At first, the floodplain grows slowly because the optimal (determinedby minimal mean-square error for the entire growth curve) net sediment deposition per flood is smaller, but iteventually grows more rapidly than when the channel bed remains fixed (Figure 5). However, for thefloodplain along the Beatton River, the theoretical growth curve which best represents the floodplain is theone when no channel bed aggradation occurs.
Application to other floodplains
The incremental-growth model predicts the overbank vertical accretion with time for a floodplain and isapplicable for those rivers or reaches of a river where point-bar lateral migration or channel aggradation arenot dominant processes. This excludes rivers with avulsions which are common when the channel bed isaggrading relative to the floodplain (Howard, 1992). The model was developed for floodplains where thewidth of the floodplain was less than the width of the channel, so that caution must be used if the model isapplied to wider floodplains. Rivers should also have a small ratio of bedload to suspended load. This will, ingeneral, be the larger rivers of the world (Meade et al., 1990) for which Richards (1982) indicates thatbedload transport represents about 1±10 per cent of the total load transport. Few rivers have measurements ofboth bedload and suspended load transport and for some rivers the bedload has been calculated using the sizedistribution of the bed material, velocity measurements and bedload equations (Colby and Hembree, 1955;Graf, 1971).Ratio of bedload to suspended load for the Mississippi River varies along the length of the river. In the
impounded reach of the Upper Mississippi River above St Louis, Missouri, the ratio is, not surprisingly,relatively low (*5 per cent; Table IV) because this reach is controlled by 26 locks and dams formingnavigation pools, thus the incremental-growth model should work well to predict the slow rise of a floodplainby future filling of backwater areas which is a concern of communities along the river. The Upper MississippiRiver below St Louis has been channelized which may be the cause of the large ratio (*26 per cent) ofbedload to suspended load. Vertical deposition is unlikely to be an important process in this reach of the riverand the channelization may retard the growth of any floodplains. Below the confluence with the Ohio River,the Lower Mississippi River is engineered but still exhibits a meandering character; the ratio of bedload tosuspended load decreases but seems a little high for the successful use of the model throughout the entire
Figure 5. Sensitivity of the incremental-growthmodel to channel aggradation using theBeattonRiver. Time in years is from the beginningof floodplain growth.� = Data from (Nanson and Beach, 1977), figure 24
Published in 2000 by John Wiley & Sons, Ltd. Earth Surf. Process. Landforms 25, 115±133 (2000)
128 J. A. MOODY AND B. M. TROUTMAN
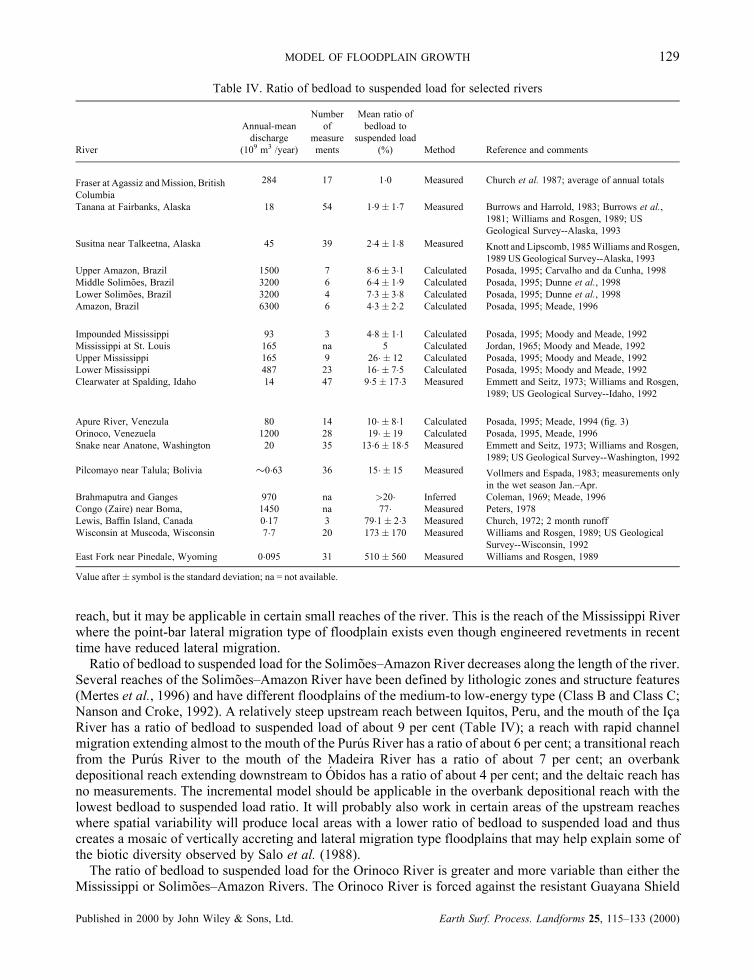
reach, but it may be applicable in certain small reaches of the river. This is the reach of the Mississippi Riverwhere the point-bar lateral migration type of floodplain exists even though engineered revetments in recenttime have reduced lateral migration.Ratio of bedload to suspended load for the SolimoÄes±Amazon River decreases along the length of the river.
Several reaches of the SolimoÄes±Amazon River have been defined by lithologic zones and structure features(Mertes et al., 1996) and have different floodplains of the medium-to low-energy type (Class B and Class C;Nanson and Croke, 1992). A relatively steep upstream reach between Iquitos, Peru, and the mouth of the IcËaRiver has a ratio of bedload to suspended load of about 9 per cent (Table IV); a reach with rapid channelmigration extending almost to the mouth of the PuruÂs River has a ratio of about 6 per cent; a transitional reachfrom the PuruÂs River to the mouth of the Madeira River has a ratio of about 7 per cent; an overbankdepositional reach extending downstream to OÂ bidos has a ratio of about 4 per cent; and the deltaic reach hasno measurements. The incremental model should be applicable in the overbank depositional reach with thelowest bedload to suspended load ratio. It will probably also work in certain areas of the upstream reacheswhere spatial variability will produce local areas with a lower ratio of bedload to suspended load and thuscreates a mosaic of vertically accreting and lateral migration type floodplains that may help explain some ofthe biotic diversity observed by Salo et al. (1988).The ratio of bedload to suspended load for the Orinoco River is greater and more variable than either the
Mississippi or SolimoÄes±Amazon Rivers. The Orinoco River is forced against the resistant Guayana Shield
Table IV. Ratio of bedload to suspended load for selected rivers
River
Annual-mean
discharge
(109 m3 /year)
Number
of
measure
ments
Mean ratio of
bedload to
suspended load
(%) Method Reference and comments
Fraser at Agassiz andMission, British
Columbia
284 17 1�0 Measured Church et al. 1987; average of annual totals
Tanana at Fairbanks, Alaska 18 54 1�9� 1�7 Measured Burrows and Harrold, 1983; Burrows et al.,
1981; Williams and Rosgen, 1989; US
Geological Survey--Alaska, 1993
Susitna near Talkeetna, Alaska 45 39 2�4� 1�8 Measured Knott and Lipscomb, 1985Williams and Rosgen,
1989 US Geological Survey--Alaska, 1993
Upper Amazon, Brazil 1500 7 8�6� 3�1 Calculated Posada, 1995; Carvalho and da Cunha, 1998
Middle SolimoÄes, Brazil 3200 6 6�4� 1�9 Calculated Posada, 1995; Dunne et al., 1998
Lower SolimoÄes, Brazil 3200 4 7�3� 3�8 Calculated Posada, 1995; Dunne et al., 1998
Amazon, Brazil 6300 6 4�3� 2�2 Calculated Posada, 1995; Meade, 1996
Impounded Mississippi 93 3 4�8� 1�1 Calculated Posada, 1995; Moody and Meade, 1992
Mississippi at St. Louis 165 na 5 Calculated Jordan, 1965; Moody and Meade, 1992
Upper Mississippi 165 9 26� � 12 Calculated Posada, 1995; Moody and Meade, 1992
Lower Mississippi 487 23 16� � 7�5 Calculated Posada, 1995; Moody and Meade, 1992
Clearwater at Spalding, Idaho 14 47 9�5� 17�3 Measured Emmett and Seitz, 1973; Williams and Rosgen,
1989; US Geological Survey--Idaho, 1992
Apure River, Venezula 80 14 10� � 8�1 Calculated Posada, 1995; Meade, 1994 (®g. 3)
Orinoco, Venezuela 1200 28 19� � 19 Calculated Posada, 1995, Meade, 1996
Snake near Anatone, Washington 20 35 13�6� 18�5 Measured Emmett and Seitz, 1973; Williams and Rosgen,
1989; US Geological Survey--Washington, 1992
Pilcomayo near Talula; Bolivia �0�63 36 15� � 15 Measured Vollmers and Espada, 1983; measurements only
in the wet season Jan.±Apr.
Brahmaputra and Ganges 970 na >20� Inferred Coleman, 1969; Meade, 1996
Congo (Zaire) near Boma, 1450 na 77� Measured Peters, 1978
Lewis, Baf®n Island, Canada 0�17 3 79�1� 2�3 Measured Church, 1972; 2 month runoff
Wisconsin at Muscoda, Wisconsin 7�7 20 173� 170 Measured Williams and Rosgen, 1989; US Geological
Survey--Wisconsin, 1992
East Fork near Pinedale, Wyoming 0�095 31 510� 560 Measured Williams and Rosgen, 1989
Value after� symbol is the standard deviation; na = not available.
Published in 2000 by John Wiley & Sons, Ltd. Earth Surf. Process. Landforms 25, 115±133 (2000)
MODEL OF FLOODPLAIN GROWTH 129

by its Andean tributaries, and the mean ratio for 11 sites along the Orinoco is about 19 per cent (Table IV).The large variability (standard deviation of about 19 per cent) is probably a result of measurements beingmade in both the wet and the contrasting dry season (Meade, 1994). The Apure River, an Andean tributaryflowing across the Ilanos, has a somewhat lower ratio (Table IV) suggesting that the incremental-growthmodel might best be used for some tributaries of the Orinoco rather than the Orinoco itself.While the Brahmaputra River is large, no bedload measurements have been reported to date. Coleman
(1969) did make measurements of bedform transport (dunes and sand waves: 60±200 m/day), and thesemeasurements are about 50 times greater than the bedform transport (� 2 m/day) reported by Mertes (1985)for the Amazon River so it seems likely that for the Brahmaputra River, the ratio of bedload to suspended loadis not negligible and the incremental-growth model would not be applicable.
SUMMARY
The incremental-growth model is a one-dimensional model for predicting the vertical accretion of the leveeor the cross-sectional average elevation of floodplains. It was developed from field data for channel-expansion, vertically accreting floodplains along the Powder River where: (1) the bedload transport is 2±7 percent of the suspended load transport; (2) the channel bed shows no significant changes in elevation with time;and (3) the width of the floodplain is less than the width of the channel. The model is essentially an unsteadymodel focusing on incremental deposition during individual floods and having a secular time scale of severaldecades to a hundred years. It differs from the steady-state, two-dimensional models used to predict thedevelopment of basin-scale sandstone over long time scales or point-bar development over shorter timescales, and from very short time scale models used to predict spatial distribution over complex topographicfloodplains during single floods. The incremental-growth model requires: (1) a partial-duration floodfrequency probability distribution; (2) the average number of floods per year; (3) a stage±discharge relation;and (4) estimates of the net sediment deposition per flood based on an empirically derived constant and somesuspended sediment and discharge measurements. It has been used to predict the growth of floodplains alongthree other rivers with quite different hydraulic and sedimentologic characteristics than the Powder River andis applicable to some large rivers throughout the world or to those reaches of rivers which have verticallyaggrading floodplains interspersed among other type of floodplains.
ACKNOWLEDGEMENTS
John Pitlick, University of Colorado, reviewed a paper concerning the growth of some flood plains along thePowder River and made a suggestion which led to this re-examination of other works on flood-plain growth.Bob Meade, Jim Pizzuto and Gordon Wolman made review comments that improved the content of eachversion of the paper. John Bridge and Ian Foster made comments on a later version that led to some extensiverethinking of the paper. Lynne Campo, Environment Canada, and Mike Church, University of BritishColumbia, were both helpful in providing data for the Beatton River. Bob Meade and Leal Mertes providedinsights into the workings of some of the larger rivers of the world.
REFERENCES
Allen, J. R. L. 1970. `A quantitative model of grain size and sedimentary structures in lateral deposits', Geological Journal, 7, 129±146.
Allen, J. R. L. 1977. `Changeable rivers: Some aspects of their mechanics and sedimentation', in Gregory, K. J. (Ed.), River ChannelChanges, John Wiley & Sons, New York, 16±45.
Barnes, H. H. Jr. 1967. Roughness characteristics of natural channels US Geological Survey Water-Supply Paper 1849, pp. 213.Bayley, P. B. 1995. `Understanding large river-floodplain ecosystems', BioScience, 45, 153±158.Blake, D. H. and Ollier, C. D. 1971. `Alluvial plains of the Fly River, Papua', Zeitschrift fuÈr Geomorphologie, N.F., Suppl. Bd. 12, 1±17.
Brakenridge, G. R. 1988, `River flood regime and floodplain stratigraphy', in Baker, V. R., Kochel, R. C. and Patton, P. C. (Eds),Flood Geomorphology, John Wiley & Sons, New York, 139±156.
Bridge, J. S. 1975. `Computer simulation of sedimentation in meandering streams', Sedimentology, 22, 3±43.Bridge, J. S. and Leeder, M. R. 1979. `A simulation model of alluvial stratigraphy', Sedimentology, 26, 617±644.
Published in 2000 by John Wiley & Sons, Ltd. Earth Surf. Process. Landforms 25, 115±133 (2000)
130 J. A. MOODY AND B. M. TROUTMAN

Bridge, J. S. and Mackey, S. D. 1993. A revised alluvial stratigraphy model International Association of Sedimentologists, SpecialPublications 17, 319±336.
Brierley, G. J., Ferguson, R. J. and Woolfe, K. J. 1997. `What is a fluvial levee?', Sedimentary Geology, 114, 1±9.Brooks, C. E. P. and Carruthers, N. 1953. Handbook of Statistical Methods in Meteorology, Her Majesty's Stationery Office, London.Burkham, D. E. 1972 Channel changes of the Gila River in Safford Valley, Arizona 1846±1970, US Geological Survey ProfessionalPaper 655-G, pp. 24.
Burrows, R. L. and Harrold, P. E. 1983. Sediment transport in the Tanana River near Fairbanks, Alaska, US Geological Survey Water-Resources Investigations Report 83-4064, pp. 116.
Burrows, R. L., Emmett, W. W. and Parks, B. 1981. Sediment transport in the Tanana River near Fairbanks, Alaska, 1977±79, USGeological Survey Water-Resources Investigations Report 81-20, pp. 56.
Carvalho, N. O. and da Cunha, S. B. 1998. Estimative da carga soÂlida do Rio Amazonas e seus principais tributaÂrios para a foz eoceano: uma retrospectiva, A AÂ gua em Revista, ServicËo GeoloÂgico do Brasil, CPRM, 6: 10, 44±58.
Cazanacli, D. and Smith, N. D. 1997. `The evolution of natural levees in the Saskatchewan River, Cumberland Marshes,Saskatchewan', GSA Abstracts with Program, A-112.
Chow, V. T. 1954. `The log-probability law and its engineering application', Proceedings of the American Society of Civil Engineers80, 1±25.
Chow, V. T. 1959. Open-Channel Hydraulics, McGraw Hill, New York, pp. 680.Chow, V. T. 1964. `Statistical and probability analysis of hydrologic data', Part I, in Chow, V. T. (Ed.), Handbook of AppliedHydrology, Section 8-I, McGraw-Hill, New York, 8±20.
Chow, V. T. Maidment, D. R. and Mays, L. W. 1988. Applied Hydrology, McGraw-Hill, New York, pp. 374.Church, M. 1972. Baffin Island Sandurs: A study of Arctic fluvial process, Geological Survey of Canada Bulletin 216, pp. 208.Church, M. McLean, D. G. Kostaschuk, R. and Tassone, B. 1987. `Sediment transport in lower Fraser River: Summary of results andfield excursion guide', International Association of Hydrological Sciences, IUGG, XIX General Assembly, Vancouver, Canada, 9±22 August 1987, 90.
Colby, B. R. and Hembree, C. H. 1955. Computations of total sediment discharge, Niobrara River near Cody, Nebraska, US GeologicalSurvey Water-Supply Paper 1357, pp. 187.
Coleman, J. M. 1969. `Brahmaputra River: Channel processes and sedimentation', Sedimentary Geology, 3, 129±239.Collins, D. L. and Flynn, K. M. 1978. A summary of measured hydraulic data for the series of steady and unsteady flow experimentsover uniform grass roughness, US Geological Survey Open-File Report 78-808, pp. 826.
Conover, W. J. 1980. Pratical Nonparametric Statistics, 2nd edition, John Wiley & Sons, New York, pp. 493.Duckstein, L. Fogel, M. M. and Kisiel, C. C. 1972. `A stochastic model of runoff-producing rainfall for summer type storms', WaterResources Research, 8, 410±421.
Dunne, T. Mertes, L. A. K. Meade, R. H. Richey, J. E. and Forsberg, B. R. 1998. `Exchanges of sediment between the flood plain andchannel of the Amazon River in Brazil', Geological Society of America Bulletin, 110, 450±467.
Emmett, W. W. and Seitz, H. R. 1973. Suspended and bedload sediment transport in the Snake and Clearwater Rivers in the vicinity ofLewiston, Idaho, March 1972 through June 1973, US Geological Survey Basic-Data Report, pp. 78.
Engelund, F. 1970. `Instability of erodible beds', Journal of Fluid Mechanics. 42, 225±244.Everitt, B. L. 1968. `Use of the cottonwood in an investigation of the recent history of a flood plain', American Journal of Science, 266,417±439.
Friedman, J. M. Osterkamp, W. R. and Lewis, W. M. Jr. 1996. `The role of vegetation and bed-level fluctuations in the process ofchannel narrowing', Geomorphology, 14, 341±351.
Gilbert, G. K. 1917. Hydraulic-mining deÂbris in the Sierra Nevada, US Geological Survey Professional Paper 105, pp. 154.Graf, W. H. 1971. Hydraulics of Sediment Transport, McGraw-Hill, New York, pp. 513.Graf, W. L. 1994. Plutonium in the Rio Grande: Environmental change and contamination in the nuclear age, Oxford University Press,New York, pp. 329.
Hembree, C. H. Colby, B. R. Swenson, H. A. and Davis, J. R. 1952. Sedimentation and chemical quality of water in the Powder Riverdrainage basin Wyoming and Montana, US Geological Survey Circular 170, pp. 92.
Hickin, E. J. and Nanson, G. C. 1975. `The character of channel migration on the Beatton River, northeastern British Columbia,Canada', Geological Society of America Bulletin, 86, 487±494.
Howard, A. D. 1992. `Modeling channel migration and floodplain sedimentation in meandering streams', in Carling, P. A. and Petts,G. E. (Eds), Lowland Floodplain Rivers: Geomorphological Perspectives, John Wiley & Sons, New York, 1±41.
Hupp, C. R. and Osterkamp, W. R. 1985. `Bottomland vegetation distribution along Passage Creek, Virginia, in relation to fluviallandforms', Ecology, 66(3), 670±681.
Jackson, R. G. II. 1976. `Depositional model of point bars in the lower Wabash River', Journal of Sedimentary Petrology, 46(3), 579±594.
Jacobson, R. B. and Coleman, D. J. 1986. `Stratigraphy and recent evolution of Maryland Piedmont flood plains', American Journal ofScience, 286, 617±637.
James, C. S. 1985. `Sediment transfer to overbank sections', Journal of Hydraulic Research, 23, 435±452.Johnson, N. L. and Kotz, S. 1970. Continuous Univariate Distributions, John Wiley & Sons, New York, 80±87.Jordan, P. R. 1965. Fluvial sediment of the Mississippi River at St. Louis, Missouri, US Geological Survey Water-Supply Paper 1802,pp. 89.
Kennedy, V. C. 1956. Geochemical studies in the southwestern Wisconsin zinc-lead area, US Geological Survey Bulletin 1000-E, pp.220.
Kesel, R. H. Dunne, K. C. McDonald, R. C. and Allison, K. R. 1974. `Lateral erosion and overbank deposition of the Mississippi Riverin Louisiana caused by 1973 flooding', Geology, 461±464.
Knight, D. W. and Demetriou, J. D. 1983. `Flood plain and main channel flow interaction', Journal of Hydraulic Engineering, ASCE,109, 1073±1092.
Knight, D. W. and Hamed, M. E. 1984. `Boundary shear in symmetrical compound channels', Journal of Hydraulic Engineering, 110,
Published in 2000 by John Wiley & Sons, Ltd. Earth Surf. Process. Landforms 25, 115±133 (2000)
MODEL OF FLOODPLAIN GROWTH 131

1412±1430.Knott, J. M. and Lipscomb, S. W. 1985. Sediment discharge data for selected sites in the Susitna River basin, Alaska, October 1982 toFebruary 1984, US Geological Survey Open-File Report 85-157, pp. 68.
Lambert, C. P. andWalling, D. E. 1987. `Floodplain sedimentation: A preliminary investigation of contemporary deposition within thelower reaches of the River Culm, Devon, UK', Geografiska Annaler, 69, 393±404.
Leenaers, H. and Schouten, C. J. 1989. `Soil erosion and floodplain soil pollution: Related problems in the context of a river basin', inHadley, R. F. and Ongley, E. D. (Eds.), Sediment and the Environment, International Association of Hydrological SciencesPublication 184, 75±83.
Leopold, L. B. Wolman, M. G. and Miller, J. P. 1964. Fluvial Processes in Geomorphology, W. H. Freeman and Company, SanFrancisco, pp. 522.
Lewin, J. Davise, B. E. and Wolfenden, P. J. 1977. `Interactions between channel change and historic mining sediments', in Gregory,K. J. (Ed.), River Channel Changes, John Wiley & Sons, New York, 353±368.
Litke, D. W. 1983. Suspended sediment in selected streams of southeastern Montana, US Geological Survey Water-ResourcesInvestigations 82-4087 pp. 52.
Marron, D. C. 1992. `Floodplain storage of mine tailings in the Bell Fourche River system: A sediment budget approach', EarthSurface Processes and Landforms, 17, 675±685.
Meade, R. H. 1994. `Suspended sediments of the modern Amazon and Orinoco Rivers', Quaternary International, 21, 29±39.Meade, R. H. 1996. `River sediment inputs to major deltas', in Milliman, J. D. and Haq, B. U. (Eds), Sea-Level Rise and CoastalSubsidence Causes, Consequences, and Strategies, Kluver Academic, Dordrecht, 63±85.
Meade, R. H. Yuzyk, T. R. and Day, T. J. 1990. `Movement and storage of sediment in rivers of the United States and Canada', in TheGeology of North American, Vol. O-1, Surface Water Hydrology, Geological Society of America, 255±280.
Melton, F. A. 1936. `An empirical classification of flood-plain streams', Geographical Review, 26, 593±609.Mertes, L. A. K. 1985. Floodplain development and sediment transport in the SolimoÄes-Amazon River in Brazil, Master's thesis,University of Washington, pp. 108.
Mertes, L. A. K. 1990. Hydrology, hydraulics, sediment transport and geomorphology of the central Amazon floodplain, Ph D thesis,University of Washington, pp. 225.
Mertes, L. A. K. Dunne, T. and Martinelli, L. A. 1996. `Channel-floodplain geomorphology along the SolimoÄes-Amazon River,Brazil', Geological Society of America Bulletin, 108, 1089±1107.
Miller, J. R. and Wells, S. G. 1986. `Types and processes of short-term sediment and uranium-tailings storage in arroyos: an examplefrom the Rio Puerco of the West, New Mexico', in Hadley, R.F. (Ed.), Drainage Basin Sediment Delivery, IAHS Publication, 159,335±353.
Moody, J. A. and Meade, R. H. 1990. Channel changes at cross sections of the Powder River between Moorhead and Broadus,Montana, 1975-88, US Geological Survey Open-File Report 89-407, pp. 252.
Moody, J. A. andMeade, R. H. 1992. Hydrologic and sedimentologic data collected during three cruises at low water on the MississippiRiver and some of it tributaries, July 1987±June 1988, US Geological Survey Open-File Report 91-485, pp. 143.
Moody, J. A. Pizzuto, J. E. and Meade, R. H. 1999. `Ontogeny of a flood plain', Geological Society of America Bulletin, 111, 291±303.Nanson, G. C. 1980. `Point bar and floodplain formation of the meandering Beatton River, northeastern British Columbia, Canada',Sedimentology, 27, 3±29.
Nanson, G. C. 1986. `Episodes of vertical accretion and catastrophic stripping: A model of disequilibrium flood-plain development',Geological Society of America Bulletin, 97, 1467±1475.
Nanson, G. C. and Beach, H. F. 1977. `Forest succession and sedimentation on a meandering-river floodplain, northeast BritishColumbia, Canada', Journal of Biogeography, 4, 229±251.
Nanson, G. C. and Croke, J. C. 1992. `A genetic classification of floodplains', Geomorphology, 4, 459±486.Nanson, G. C. and Young, R. W. 1981. `Overbank deposition and floodplain formation on small coastal streams of New South Wales',Zeksehrift Geomorphologie N. F., 25, 332±347.
National Research Council 1992. Committee on Restoration of Aquatic Ecosystems, Science, Technology and Public Policy, NationalAcademy Press, Washington, D.C., pp. 552.
Nicholas, A. P. and Walling, D. E. 1997a. `Modelling flood hydraulic and overbank deposition on river floodplains', Earth SurfaceProcesses and Landforms, 19, 59±77.
Nicholas, A. P. and Walling, D. E. 1997b. `Investigating spatial patterns of medium-term overbank sedimentation on floodplains: acombined numerical modelling and radiocaesium-based approach', Geomorphology, 19, 133±150.
Osterkamp, W. R. and Hedman, E. R. 1982. Perennial-streamflow characteristics related to channel geometry and sediment in MissouriRiver basin, US Geological Survey Professional Paper 1242, pp. 20.
Parker, G. 1978. `Self-formed straight rivers with equilibrium banks and mobile bed, Part 1, The sand-silt river', Journal of FluidMechanics, 89, 109±125.
Parker, G. Cui, Y. Imran, J. and Dietrich, W. E. 1996. `Flooding in the lower Ok Tedi, Papua, New Guinea due to the disposal of minetailing and its ameleoration', in International Seminar on Recent Trend of Floods and their Preventive Measures, 20±21 June 1996,Sapporo, Japan.
Peters, J. J. 1978. `Discharge and sand transport in the braided zone of the Zaire estuary', Netherlands Journal of Sea Research, 12(3/4)273±292.
Petts, G. E. Large, A. R. G. Greenwood, M. T. and Bickerton, M. A. 1992. Floodplain assessment for restoration and conservation:Linking hydrogeomorphology and ecology', in Carling, P. A. and Petts, G. E. (Eds), Lowland Floodplain Rivers:Geomorphological Perspectives, John Wiley & Sons, New York, 217±234.
Pizzuto, J. E. 1987. `Sediment diffusion during overbank flows', Sedimentology, 34, 301±317.Posada, L. G. 1995. Transport of sand in deep rivers, PhD Thesis, Colorado State University pp. 158.Richards, K. 1982. Rivers: Form and Process in Alluvial Channels, Methuen, New York, pp. 358.Ritter, D. F. Kinsey, W. F. III. and Kauffman, M. E. 1973. `Overbank sedimentation in the Delaware River Valley during the last 6000years', Science, 179, 374±375.
Published in 2000 by John Wiley & Sons, Ltd. Earth Surf. Process. Landforms 25, 115±133 (2000)
132 J. A. MOODY AND B. M. TROUTMAN

RouveÂ, G. and Stein, C. J. 1990. `Compound channel flow computation ±theory and practice', EOS, American Geophysical Union,Abstracts, April 24, 1990, pp. 509.
Salo, J. 1990. `External processes influencing origin and maintenance of inland water-land ecotones', in Naiman, R. J. and DeÂcamps(Eds.), The Ecology and Management of Aquatic-Terrestrial Ecotones, Parthenon, Carnforth, 37±64.
Salo, J. Kalliola, R. Hakkinen, I. Makinen, Y. Niemela, P. Puhakka, M. and Coley, P. D. 1988. `River dynaics and the diversity ofAmazon lowland forest', Nature, 322, 254±258.
Schumm, S. A. and Lichty, R. W. 1963. Channel widening and flood-plain construction along Cimarron River in southwestern Kansas,US Geological Survey Professional Paper 352-D, pp. 88.
Sciacca, J. E. 1998. `Hydrostratigraphic analysis of a complex fluvial deposition system, Sacra-mento County, California', AAPGBulletin, 82(5A), 858.
Sellin, R. H. J. 1964. `A laboratory investigation into the interaction between the flow in the channel of a river and that over its floodplain', Lattouille Blanche, 7, 793±801.
Stallard, R. F. 1998, `Terrestrial sedimentation and the carbon cycle: Coupling weathering and erosion to carbon burial', GlobalBiogeochemical Cycles, 12, 231±257.
Stene, L. P. 1980. `Observations on lateral and overbank deposition±Evidence from Holocene terraces, southwestern Alberta',Geology, 8, 314±317.
Swanson, F. J. 1997. `Development in river and watershed management from ecosystem perspectives' in 50th Anniversary Meeting ofthe Japan Society for Erosion Control Engineering, 1997 October 8±9, Tokyo, Japan, 173±181.
Topping, D. J. 1997. Physics of flow, sediment transport, hydraulic geometry, and channel geomorphic adjustment during flash floodsin an ephemeral river, the Paria River, Utah and Arizona, PhD thesis, Department of Geological Sciences, University of Washington,pp. 405.
US Department of Agriculture 1978. Strategies for Protection and Management of Floodplain Wetland and other Riparian Ecosystems,Proceedings of the Symposium, 11±13 December 1978, Callaway Gardens, Georgia, pp. 410.
US Geological Survey ±Alaska. 1993. Water-resources data for Alaska, water year 1993, US Geological Survey Water-Data ReportsAK-92-1, pp. 373.
US Geological Survey ±Idaho. 1992. Water-resources data for Idaho, water year 1992, US Geological Survey Water-Data Reports ID-92-2, pp. 431.
US Geological Survey ± North Dakota 1978±1994. Water-resources data for North Dakota, water years 1978±1994, US GeologicalSurvey Water-Data Reports ND-78-1 to ND-94-1 (published annually).
US Geological Survey ± Washington. 1992. Water-resources data for Washington, water year 1992, US Geological Survey Water-DataReport WI-92-1, pp. 459.
US Geological Survey ±Wisconsin. 1992. Water-resources data for Wisconsin, water year 1992 US Geological Survey Water-DataReport WI-92-1, pp. 545.
Vollmers, H. J. and Espada, G. P. 1983. `Sediment measurements in the Pilcomayo River in Bolivia', in Proceedings of the SecondInternational Symposium on River Sedimentation, Nanjing, China, Water Resource and Electric Power Press, 1050±1070.
Williams, G. P. and Rosgen, D. L. 1989. Measured total sediment loads (suspended loads and bedloads) for 93 United States streams,US Geological Survey Open-File Report 89±67, pp. 128.
Wolff, C. G. and Burges, S. J. 1994. `An analysis of the influence of river channel properties on flood frequency', Journal ofHydrology, 153, 317±337.
Wolman, M. G. 1955. The Natural Channel of Brandywine Creek Pennsylvania, US Geological Survey Professional Paper 271, pp. 56.Wolman, M. G. and Leopold, L. B. 1957. River flood plains: Some observations on their formation, US Geological Survey ProfessionalPaper 282-C, pp. 109.
Wolman, M. G. and Miller, J. P. 1960. `Magnitude and frequency of forces in geomorphic processes', Journal of Geology, 68, 54±74.Zwolinski, Z. 1992. `Sedimentology and geomorphology of overbank flows on meadering river floodplains', Geomorphology, 4, 367±379.
Published in 2000 by John Wiley & Sons, Ltd. Earth Surf. Process. Landforms 25, 115±133 (2000)
MODEL OF FLOODPLAIN GROWTH 133