quantitative multiplex immunohistochemistry … reports, volume 19 supplemental information...
TRANSCRIPT
Cell Reports, Volume 19
Supplemental Information
Quantitative Multiplex Immunohistochemistry
Reveals Myeloid-Inflamed Tumor-Immune
Complexity Associated with Poor Prognosis
Takahiro Tsujikawa, Sushil Kumar, Rohan N. Borkar, Vahid Azimi, GuillaumeThibault, Young Hwan Chang, Ariel Balter, Rie Kawashima, Gina Choe, DavidSauer, Edward El Rassi, Daniel R. Clayburgh, Molly F. Kulesz-Martin, Eric R. Lutz, LeiZheng, Elizabeth M. Jaffee, Patrick Leyshock, Adam A. Margolin, Motomi Mori, Joe W.Gray, Paul W. Flint, and Lisa M. Coussens

Supplementary Figure 1A BLymphoid biomarker panel Myeloid biomarker panel
CD3 RORgt CD56PD-1
CD8 Foxp3Tbet GATA3 (white)
CD20PD-L1 p16CD45 (white)
CD3
CD3 CD3 CD3 CD3
CD45CD3
MHC class II
CD68 CSF1R
CD163
DC-SIGN
CD83CD66b
Tryptase
CD3/20/56PD-L1 p16CD45 (white)
CD68 MHC class II
MHC class II

Figure S1 in reference to Figure 1: Pseudo-colored single marker IHC images from sequential multiplex IHC. Single channel images representing the lymphoid (Figure 1E) and myeloid (Figure 1F) biomarker antibody panels are shown in (A) and (B), respectively. Boxes represent area magnified. When indicated, CD3, CD68, and MHC class II images are merged to show colocalization in bottom panels. Scale bars = 500 µm (top) and 100 µm (middle), and 10 µm (bottom).

Supplementary Figure 2PD-1: Round 1
Sequ
entia
l IH
CN
ext r
ound
N
o pr
imar
y A
B C
CD3: Round 2 RORgt: Round 3 CD56: Round 4 CD8: Round 5 Tbet: Round 6
Round 2 Round 3 Round 4 Round 5 Round 6 Round 7
GATA3: Round 7 Foxp3: Round8 PD-L1: Round 9 CD20: Round 10 CD45: Round 11
Round 8 Round 9 Round 10 Round 11 Round 12
Sequ
entia
l IH
CN
ext r
ound
N
o pr
imar
y
0
400
800
Cel
ls p
er a
rea
PDA
CH
NSC
CTo
nsil
010002000300040005000
0
1000
2000
3000
1 3 5 8 11 13Round
Round 1(Std IHC) Round 3 Round 11 Round 13
1 3 5 8 11 13Round
1 3 5 8 11 13Round
Round 1(Std IHC) Round 3 Round 11 Round 13
Round 1(Std IHC) Round 3 Round 11 Round 13
CD45
Cel
ls p
er a
rea
Cel
ls p
er a
rea
Cel
ls p
er a
rea
PDA
CH
NSC
CTo
nsil
1 3 5 8 11 13Round
Round 1(Std IHC) Round 3 Round 11 Round 13
1 3 5 8 11 13Round
1 3 5 8 11 13Round
Round 1(Std IHC) Round 3 Round 11 Round 13
Round 1(Std IHC) Round 3 Round 11 Round 13
CD20
Cel
ls p
er a
rea
Cel
ls p
er a
rea
0
1000
2000
3000
0500
1000150020002500
0
50
100

Figure S2 in reference to Figure 1: Validation of chromogenic multiplex IHC. (A) To validate antibody-stripping protocol, staining was performed in the same number of rounds in corresponding to the protocol shown in Table S1. Images represent chromogenic staining with labeled biomarkers and the number of round (top panel). Following AEC wash and antibody stripping, complete removal of antibody and signal was confirmed by incubating with only the detection reagent and AEC in the next sequential round (bottom panel). Scale bars = 10 µm. (B, C) Comparison between standard IHC and multiple rounds of sequential IHC was performed in detection of CD45 (B) and CD20 (C) in human tonsil, head and neck squamous cell carcinoma (HNSCC), and pancreatic ductal adenocarcinoma (PDAC) tissue. Top panel images represent findings of standard IHC (round 1) and AEC images in IHC round 3, 11, and 13. Scale bars = 100 µm. Bottom graphs show cell counts of CD45+ (B) or CD20+ (C) cells quantified in five regions of 62500 µm2 area by image cytometry. No significant reduction of detection was observed when comparing IHC round 1 to 13. The bars show mean ± SD. Statistical significance determined by Kruskal-Wallis test.
Supplementary Figure 3
PD-1
MergeCD56 (No signal)
PD-L1 (No signal)
CD45
CD20
CD8
Tbet
CD3 GATA3
Foxp3RORgt
Tryptase
CD66b
CD83
MHC class II
CD68
Merge
CD3/20/56
PD-L1
CSF1R
CD163
CD45 DC-SIGNA B

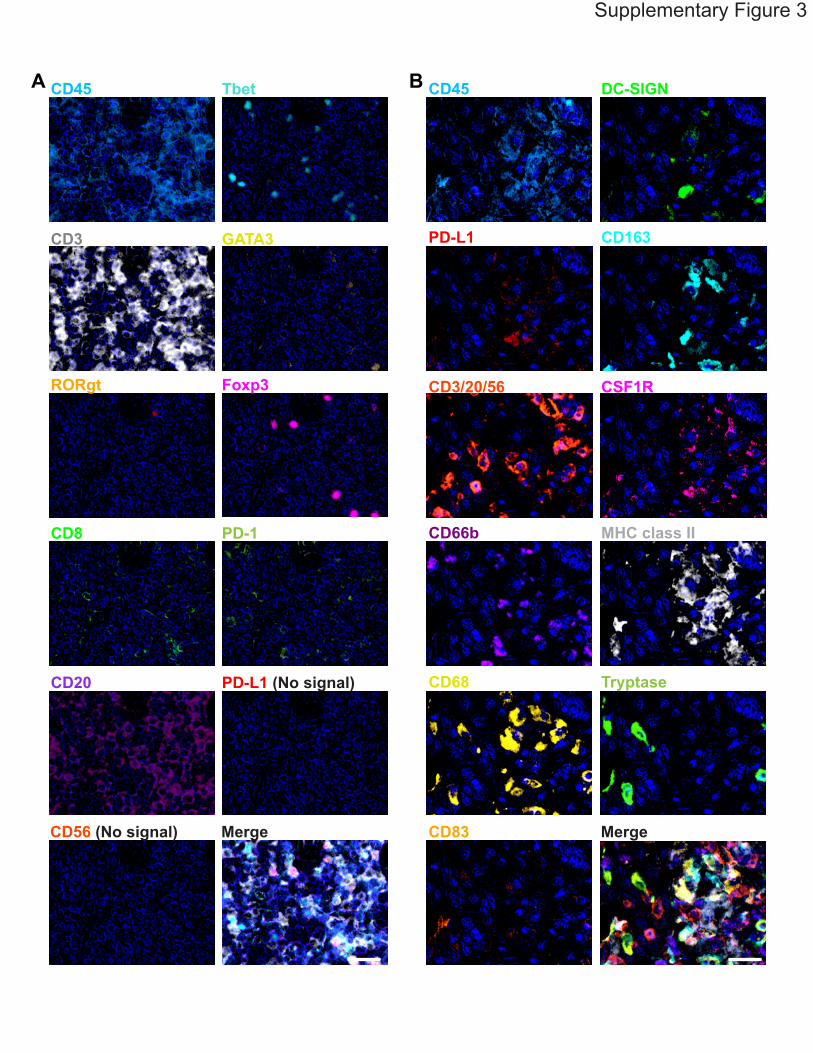
Figure S3 in reference to Figure 2: Pseudo-colored images of single-stained multi-plexmultiplex cycles shown in Figure 2. Single channel images in support of Figures 2A and 2B are shown in (A) and (B), respectively. Scale bars = 50 µm.

ANuclei CD3 Foxp3 p16CD8
Image cytometry on neg control (w/o primary ab)
No gate
No gate
No gate
0.1 0.2 0.3 0.4 0.5p16 Mean Intensity
0.5
0.4
0.3
0.2
0.1CD
45 M
ean
Inte
nsity
10010-1
CD3 Mean Intensity
CD
8 M
ean
Inte
nsity 0.5
0.4
0.3
0.2
0.1
0.6CD45+
CD3+CD8í
No gate
Foxp3 Mean Intensity0.1 0.2 0.3 0.4 0.5
0.5
0.45
0.4
0.35
0.3Nuc
lei M
ean
Inte
nsity
Foxp3 Mean Intensity
Nuc
lei M
ean
Inte
nsity
Foxp3-IHC
p16-IHC
CD3-IHC5002500 1000750
750
563
375
188
0
5002500 1000750750
563
375
188
0
5002500 1000750750
563
375
188
0
0.1 0.2 0.3 0.4 0.5
0.5
0.45
0.4
0.35
0.3
10010-1
CD3 Mean Intensity
CD
8 M
ean
Inte
nsity 0.5
0.4
0.3
0.2
0.6
0.1 0.2 0.3 0.4 0.5p16 Mean Intensity
0.5
0.4
0.3
0.2
0.1CD
45 M
ean
Inte
nsity
CD8+ T cells
T cells
B cells
D E
CD45
B cell: CD45+CD19+32.3
CD45+CD19-67.6
CD19
FSC
-A
CD8+ T cell: CD45+CD3+CD8+26.0
CD8- T cell: CD45+CD3+CD8-45.4
CD45+CD19-CD3-28.5
CD3
CD
8
CD45 CD20 CD3
CD
8
CD45+CD20íCD45+
CD45+CD19íCD45+
No gate
Live cells
Imag
e cy
tom
etry
Flow
cyt
omet
ry
0 20 40 60 800
20
40
60
80
100
Image Cytometry
Flow
Cyt
omet
ry
R = 0.7857P = 0.0208
R = 0.8333P = 0.0102
R = 0.6667P = 0.0710
% of CD45+ cells
10010-110010-1 10010-1
10-1
100
Nuc
lei M
ean
Inte
nsity
10-1
100
Nuc
lei M
ean
Inte
nsity
10-1
100
10510410310-3010510410310-3010510410310-30
105
104
103
10-30
50k
100k
150k
200k
250k
FSC
-A
0
50k
100k
150k
200k
250k
75.8% 24.0%
29.5%71.0%
CD45+58.5
31.3%
25.5%
43.7%
B CLymphoid biomarker panel Myeloid biomarker panel
100
100
100
100
Foxp3 Mean IntensityRO
Rgt
Mea
n In
tens
ity
CD3 Mean IntensityCD
8 M
ean
Inte
nsity
100
100
GATA3 Mean IntensityTbet
Mea
n In
tens
ity
CD20 Mean IntensityNuc
lei M
ean
Inte
nsity
CD56 Mean IntensityNuc
lei M
ean
Inte
nsity
CD45 Mean IntensityNuc
lei M
ean
Inte
nsity
100
CD3-CD20-CD56 Mean Intensity
Nuc
lei M
ean
Inte
nsity
Nuc
lei M
ean
Inte
nsity
CD45 Mean Intensity
100
CSF1R Mean Intensity10-1
100
CD
163
Mea
n In
tens
ity
100
100
Tryp
tase
Mea
n In
tens
ity
100
CD66b Mean Intensity
100MHC class II
Mean Intensity
100
Nuc
lei M
ean
Inte
nsity
100
Nuc
lei M
ean
Inte
nsity
CD68 Mean Intensity100
100
CD83 Mean Intensity
100
DC
-SIG
N M
ean
Inte
nsity
10-1
100
100 No Gate No Gate
No Gate No Gate No Gate
No Gate No Gate
No Gate No Gate
No Gate No Gate No Gate
No Gate
100
100
100
100
100
100
100
Supplementary Figure 4

Figure S4 in reference to Figure 3: Validation of image cytometry analysis. (A) Image cytometry analysis enables visualization of positional linkage between dot plots and original images. Colored dots in the left panels are pointed out in the original AEC images (middle panel), and multiplexed IHC images (right panels). Scale bars = 100 µm. Right panel shows image cytometry findings on negative control slides. (B, C) Density plots in negative control slides are shown in support of Figures 3C and D. The x and y axes are shown on a logarithmic scale. (D) Comparison between image cytometry and flow cytometry in human PDAC tissues (N = 8). Representative density plots from flow cytometry (upper) and image cytometry (lower) are shown. (E) Pairwise associations of T cell (CD45+ CD3+), B cell (CD45+ CD19+ or CD20+), CD8+ T cell (CD45+ CD3+ CD8+) of total CD45+ cells are assessed by Spearman correlation coefficient. Estimated regression lines for each category were shown.
Hypo-inflamed Myeloid-inflamedLymphoid-inflamed
Core #32 Core #3 Core #21
Mu
lti-
ple
x I
HC
Ima
ge
cy
tom
etr
y
CD45í
CD45+ Lymphoid CD45+ Non-lymphoid
0
20
40
60
80
100
% o
f tot
al c
ells
CD45í
CD45+ Lymphoid CD45+ Non-lymphoid
CD45í
CD45+ Lymphoid CD45+ Non-lymphoid
Nuc
lei M
ean
Inte
nsity
CD45 CD3-CD20-CD56 (Lymphoid cell markers)
CD45í CD45+
34.4% 64.0% 18.6% 81.6%
Non-lymphoidLymphoid
CD45+
Nuc
lei M
ean
Inte
nsity
CD45 CD3-CD20-CD56 (Lymphoid cell markers)
CD45í CD45+
82.7% 16.4% 90.9% 9.4%
Non-lymphoidLymphoid
CD45+
Nuc
lei M
ean
Inte
nsity
CD45 CD3-CD20-CD56 (Lymphoid cell markers)
CD45í CD45+
52.9% 47.1% 94.9% 5.2%
Non-lymphoidLymphoid
CD45+
Supplementary Figure 5
Nuclei
CD68
CD45
CD66b
CD3-CD20-CD56
Nuclei
CD68
CD45
CD66b
CD3-CD20-CD56
Nuclei
CD68
CD45
CD66b
CD3-CD20-CD56
Image plotImage plotImage plot50003750350012500
5000
3750
3500
1250
0
500037503500125005000
3750
3500
1250
0
500037503500125005000
3750
3500
1250
0
0
20
40
60
80
100
% o
f tot
al c
ells
0
20
40
60
80
100
% o
f tot
al c
ells
CD45í
Total
0
5000
10000
15000
HPV-posHPV-negNormal
CD8+ T
TREGTH1 TH2
TH17
TH0B ce
llNK
CD163í� TAM
CD163+
TAM
DC-SIG
N+ D
C
CD83+ D
C
CD66b+
Gr
Mast c
ell
CD45+ Othe
rs0
1000
2000
3000
Cell
den
sit
y (
cel
ls/m
m2)
C D
PTPRC (CD45
)
CD3E: T
cell
CD4: Help
er T
TBX21
: TH1
GATA3: TH2
FOXP3: TREG
CD8A: C
D8+ T
CD19: B
cell
NCAM1 (CD56
): NK
CD14: M
onoc
yte
CD68: M
acrop
hage
CSF1R: M
acrop
hage
CD163:
Macrop
hage
MRC1: Mac
ropha
ge
CD209 (
DCSIGN): D
C
CD83: D
C
CEACAM8 :CD66
b+ G
r
FCER1A: E
os/M
ast/B
aso
-5
0
5
10
Re
lati
ve g
en
e e
xpre
ssio
n
(pa
nca
n n
orm
ali
zed
)
HPV-neg (N = 80)HPV-pos (N = 39)
Cel
l den
sity
(cel
ls/m
m2 )
*
*
**
*
***
*
*
*
**
*
****
***** * * **** ** *****
***
HPV-neg HPV-pos0
20
40
60
80
100
0
20
40
60
80
100
Neo
pla
sti
c c
ell n
est
are
a o
f to
tal a
rea
(%
)
Neo
pla
sti
c c
ell n
est
are
a o
f to
tal a
rea
(%
)
E F
SubgroupL H M0 500 1000 1500 2000
0
20
40
60
80
100
Days
Ove
rall
surv
iva
l (%
)
0 500 1000 1500 20000
20
40
60
80
100
Days
Ove
rall
surv
iva
l (%
)
Log rank test P = 0.0285
Log rank test P = 0.3151
Subgroup L
Subgroup M
Subgroup H(N = 0)
(N = 6)
(N = 11)
Subgroup L
Subgroup M
Subgroup H(N = 8)
(N = 11)
(N = 2)
HPV-pos HPV-negB
A

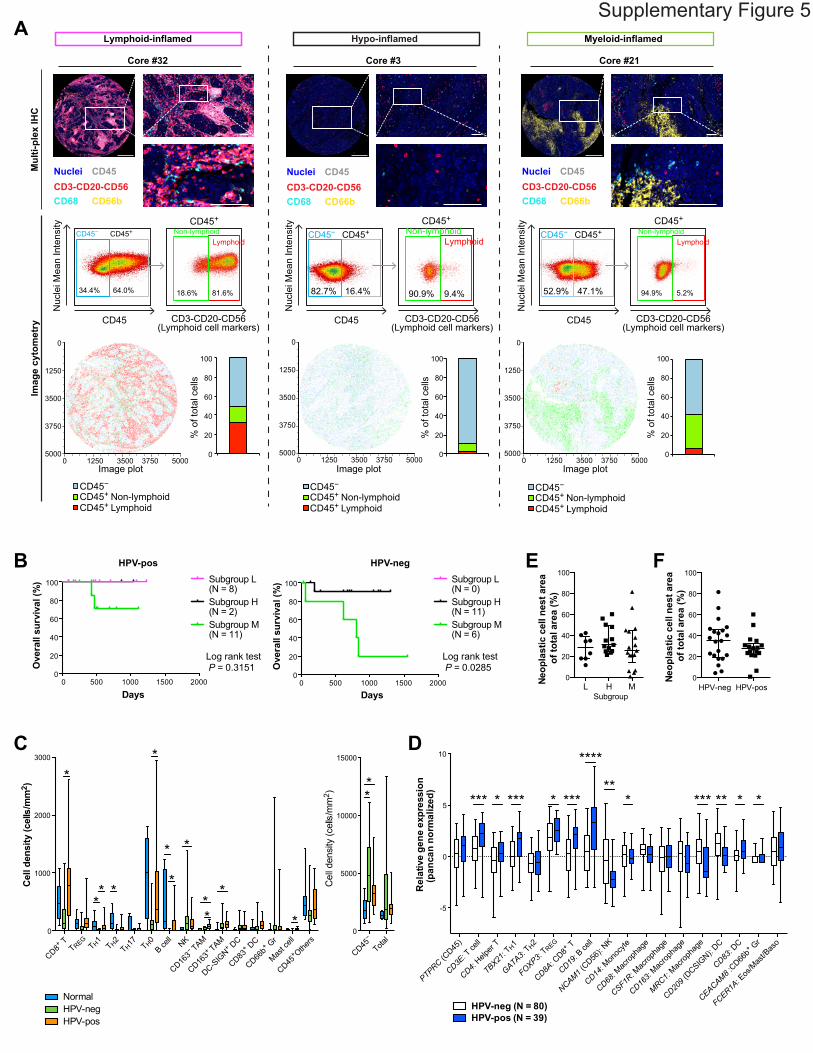
Figure S5 in reference to Figure 4: Cell density, composition, and TCGA analysis for subclassification of HNSCC. (A) Micrographs show multiplex IHC findings in lymphoid-, hypo-, and myeloid-inflamed subgroups in HNSCC (Figure 4C), showing high infiltration of lymphoid cell populations in core #32, hypo-infiltration of CD45+ leukocytes in core #3, and high infiltration of CD68+ and CD66b+ cells in core #21. Boxes and hashed lines represent area magnified. Biomarkers and color annotations were shown in bottom left. Scale bars = 500 µm (top left) and 100 µm (top right and bottom right). Image cytometry-based quantification was shown in corresponding to IHC images. Top two panels show density plots of CD45 and cocktail antibodies of CD3, CD20 and CD56 (lymphoid cell markers). Image plots (bottom left) depict location of cells identified above by image cytometry, according to color markers below. Composition graphs (bottom right) show quantified cell percentages of CD45−, CD45+CD3-CD20-CD56− (non-lymphoid) and CD45+CD3-CD20-CD56+ (lymphoid) cells of total cells, according to color markers below. (B) Kaplan-Meier analyses of overall survival of HPV-positive and negative HNSCC patients were shown with stratification by lymphoid- (L), hypo- (H) and myeloid- (M) inflamed subgroups. Statistical significance was determined via log-rank test. (C) The box-whisker plots of cell density in support of Figure 4C are shown. *, **, and *** show P < 0.05, 0.01, and 0.001, respectively, by Kruskal-Wallis tests with FDR adjustments. Bars, boxes and whiskers represent median, interquartile range and range, respectively. (D) Comparison of gene expression between HPV-positive and HPV-negative HNSCC from The Cancer Genome Atlas (N = 39 and 80, respectively). TCGA HNSCC mRNA gene expression by pancan-normalized RNAseq (Illumina-HiSeq) (N = 564) were downloaded from UCSC cancer browser at https://genome-cancer.ucsc.edu (Data obtained in October, 2014). 434 samples without available information of HPV-status were excluded, and total of 119 cases were analyzed by expression of immune cell lineage markers. Vertical axis shows log2-based gene expression normalized to all TCGA cancer types. Bars, boxes and whiskers represent median, interquartile range and range, respectively. *, **, ***, and **** show P < 0.05, 0.01, 0.001, and 0.0001, respectively, by Kruskal-Wallis tests with FDR adjustments. (E, F) Area of neoplastic cell nest (% of total tissue area) was immunohistochemically assessed based on p16 (HPV-positive) and EpCAM (HPV-negative), and compared among the three subgroups indicated in Figure 4C (D) or between groups stratified by HPV-status (E). Each single dot represents one core/individual in TMA. Statistical significance in (D) and (E) was determined by Kruskal-Wallis test, and p values in (D) were adjusted by FDR.

A No Gate
CD3
CD8
Foxp3
Tbet CD56
PD-L1
CD45
G
*0 10 20 30 40
% of total CD45+ cells
Lym
phoi
d bi
omar
ker p
anel
Mye
loid
bio
mar
ker p
anel
B
GATA3
RORgt
CD20
PD-1
12 color
C
D
Image plot
Image plot
MHC class II
CD68
CSF1R
CD163
DC-SIGN
CD83
CD66b
Tryptase
CD3/20/56
PD-L1
CD45
12 color
Low myeloidHigh myeloid
CD45 Mean Intensity
Nuc
lei m
ean
inte
nsity
Nuc
lei m
ean
inte
nsity
Nuc
lei m
ean
inte
nsity
CD
8 m
ean
inte
nsity
CD3 Mean Intensity Foxp3 Mean Intensity
RO
Rgt
mea
n in
tens
ityR
OR
gt m
ean
inte
nsity
CD56 Mean Intensity CD20 Mean Intensity GATA3 Mean Intensity
CD3-20-56 Mean Intensity
Nuc
lei m
ean
inte
nsity
Tryp
tase
mea
n in
tens
ity
Nuc
lei m
ean
inte
nsity
Nuc
lei m
ean
inte
nsity
MHC II Mean Intensity CD83 Mean IntensityDC
-SIG
N m
ean
inte
nsity
CD
163
mea
n in
tens
ity
CD66b Mean Intensity CD68 Mean Intensity CSF1R Mean Intensity
CD45+
10-1 10010-1
100
10-110-2
10-1
100
10-2
10-1
100
10-2
10-1
100
10-2
10-1
100
10-110-210-110-2 100
10-110-2 10010-110-2 100
10-110-2 10010-110-2 100
10-110-2 10010-110-2 100 10-110-2 100
10-1
100
10-1
100
10-1
100
10-1
100
10-2
10-1
100
10-2
10-1
100
0.50.40.30.20.100
0.5
0.4
0.3
0.2
0.1
Lym
phoi
d M
yelo
id
CD8+ TTREG
TH1TH2
TH17TH0
B cellNK
CD163í TAMCD163+ TAM
DC-SIGN+ DCCD83+ DCCD66b+ Gr
Mast cellCD45+ Other
F
E
Min MaxMedian
Cell density (cells/mm2)
26�����\OS < 2 y
Low myeloid-inflamed High myeloid-inflamed
Cancerous region Non-cancerous region(excluded)
Max
Med
Min
CD45+ cell density
Region #1
Region #2
Region #3
Hematoxylin + CD45-IHC
Heat map
1 mm
Whole tissue image
2.5 x 2.5 mm
1 mm
Leukocyte density mapping Regions of interest
#1 #2 #3
Single tumor
Mast cell
CD66b+ Gr
CD8
NK
B cell
CD163í TAM
DC-SIGN+ DC
CD163+ TAM
CD83+ DC
TREG
TH1
TH2
TH17
TH0
Supplementary Figure 6

Figure S6 in reference to Figure 5: Region of interest (ROI) selection based on leukocyte hot spot analysis in neoadjuvant GVAX treated PDAC. (A, B) Pseudo-colored images of single-stained multiplex cycles shown in Figure 5A and 5B are shown in (A) and (B), respectively. Scale bars = 100 µm. (C, D) Image cytometry analyses for lymphoid (C) and myeloid (D) biomarker panels based on Figure 5A images are shown, together with corresponding image plots visualizing cells identified in the gating strategies. (E) Overview of mapping analyses of CD45+ leukocyte cell densities. Following generation of whole tissue-based pseudo-IHC images from hematoxylin and CD45-IHC image (left panel), a heat map of leukocyte cell density is generated based on quantification of CD45+ cells per area (middle panels). Excluding pathologist-evaluated non-malignant regions, three highest leukocyte density regions are selected and exported as ROIs for downstream image analysis (right panels). Magnification is shown. (F) Each single cell in the heat map of Figure 5B is split to three columns from independent ROIs. The data is visualized in a new heat map according to color scale (upper left), showing that three different ROIs are basically sharing similar signatures across immune cell lineages with mild variation. Overall survival (OS) and low/high myeloid inflamed profiles defined in Figure 5B are shown. (G) Immune cell percentages comparing low and high myeloid-inflamed profiles were quantified as a percentage of total CD45+ cells. Statistical significance was determined via Kruskal-Wallis tests with FDR adjustments, with * P < 0.05.

Supplementary Figure 7
CD45 (white)
CD3
CD4
CD8
Grz BTbet
Eomes
PD-1
Ki67
CD68
IDO
12 color
A
BCD3 CD8
Eomes Ki67 IDOPD-1
Nuclei
CD8Nuclei Nuclei CD68
Hematoxylin
0 20 40 60 80 100
C
CD
8+ T
cell
Low myeloidHigh myeloid
0 20 40 60 80 100Ki67+ %
*
CD
8+ T
cell
26�����\�OS < 2 y
PD-1+Eomes–
PD-1+Eomes+
PD-1–Eomes+
PD-1–Eomes–
PD-1+Eomes–
PD-1+Eomes+
PD-1–Eomes+
PD-1–Eomes–
DKi67+ %

Figure S7 in reference to Figure 6: T cell functional biomarker panel images and quantification. (A) Single channel images of T cell functional biomarker panels in support of Figure 6A are shown. (B) In support of Figure 6B, hematoxylin and multiplex IHC images are shown in a lymphoid aggregative area of human PDAC tissues. Biomarkers and color annotations were shown. Scale bars = 100 µm. (C, D) Box whisker plots show Ki67 positive percentages evaluated in each CD8+ T cell subpopulation, comparing low vs high meyloid-inflamed profiles and long and short overall survival (OS) groups. Bars, boxes and whiskers represent median, interquartile range and range, respectively. Statistical significances between the two groups were determined via Kruskal-Wallis tests with FDR adjustments, with * P < 0.05.

C
TAM DCCD163+ CD83+
Nuclei
CD68PD-L1
Nuclei
Nuclei
MHC class IIPD-L1
Nuclei
CD163í DC-SIGN+
CD163
CD68 MHC class IICD83DC-SIGN
CSF1R
CD66b+ Gr Mast cellNuclei
TryptasePD-L1
Nuclei
NK
PD-L1CD20
CD8 T TREG B cell
Nuclei
CD66bPD-L1
NucleiPD-L1CD3Foxp3
Nuclei
CD56PD-L1
NucleiPD-L1CD3CD8
Nuclei
p16PD-L1
Tumor cellA
Supplementary Figure 8
B
0 20 40 60 80 100
CD45í
CD45+ Other
Mast cell
CD66b+ Gr
CD163í TAM
DC-SIGN+ DC
CD163+ TAM
CD83+ DC
% PD-L1+
***
***
******
HPV+ HNSCC
Normal
HPVí HNSCC
(N = 21)
(N = 17)
(N = 8)
0 2 4 6 80
25
50
75
Gra
nzy
me
B+
CD
8+ T
cell
(cel
ls/m
m2 )
R = 0.6067P = 0.0017
0 25 50 75 1000
20
40
60
80
PD-L1+ % of DC-SIGN+ DC
Gra
nzy
me
B+
% o
f CD
8+ T
cell R = 0.6223
P = 0.0012
PD-L1+ % of total cells
FD
0 2 4 6 80
10
20
30
40
PD-L1+ % of total cells
CD
8+ T
cell
% o
f CD
45+
cell
R = 0.2253P = 0.2898
E
Figure S8 in reference to Figure 7: PD-L1 expression profiles in neoplastic and immune cell lineages. (A) PD-L1 expression on neoplastic cells in HPV-positive HNSCC tissue. Box denotes area magnified in right. Scale bars = 50 µm. (B) Micrographs showing PD-L1+ immune cells (red arrowheads) in 20 µm square frames. (C) PD-L1-positive % in each cell lineage was quantified by image cytometry. Bars, boxes and whiskers represent median, interquartile range and range, respectively. * P < 0.05, and ** P < 0.01, by Kruskal-Wallis tests with FDR adjustments. (D, E) Spearman correlations of granzyme B+ CD8+ T cells of CD45+ cells (D) or Granzyme B+ CD8+ T cell density (E) versus PD-L1+ percentages of total cells were shown with estimated regression lines (red) in the neoadjuvant GVAX-treated PDAC cohort (N = 24). (F) Spearman correlation of PD-L1+% of DC-SIGN+ DCs and Granzyme B+% of CD8+ T cells was shown with estimated regresssion lines (N = 24).
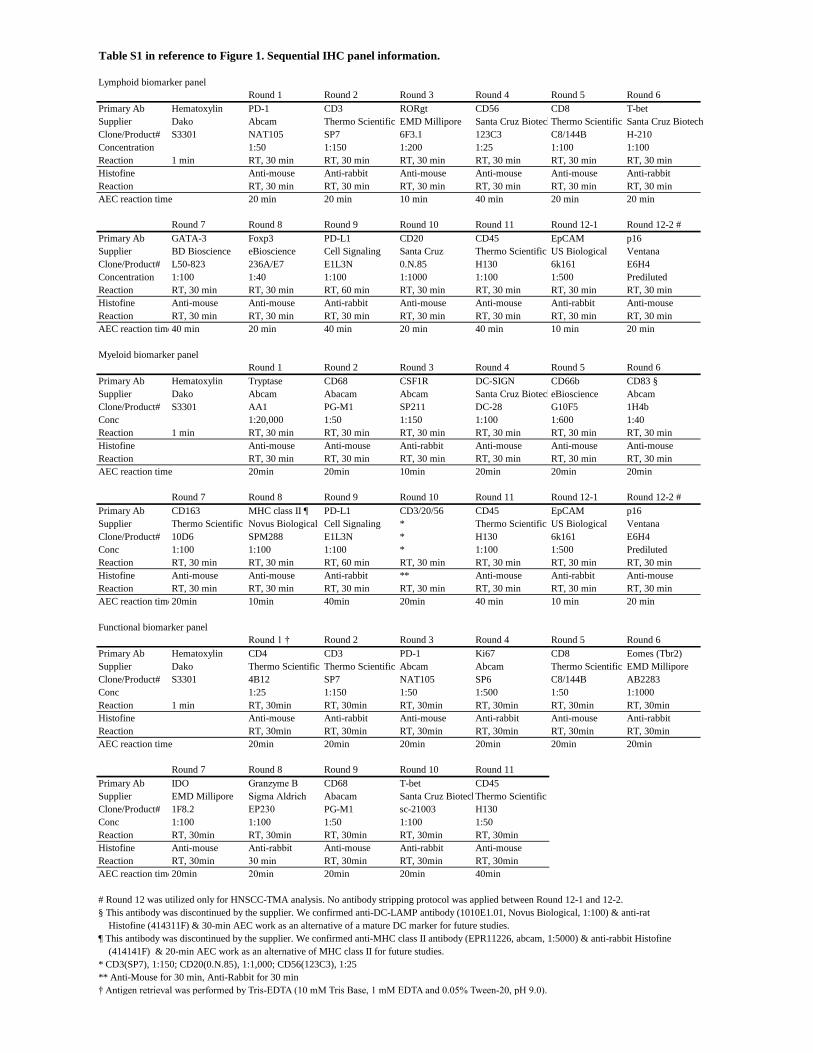
Table S1 in reference to Figure 1. Sequential IHC panel information.
Lymphoid biomarker panel
Round 1 Round 2 Round 3 Round 4 Round 5 Round 6
Primary Ab Hematoxylin PD-1 CD3 RORgt CD56 CD8 T-bet
Supplier Dako Abcam Thermo Scientific EMD Millipore Santa Cruz BiotechThermo Scientific Santa Cruz Biotech
Clone/Product# S3301 NAT105 SP7 6F3.1 123C3 C8/144B H-210
Concentration 1:50 1:150 1:200 1:25 1:100 1:100
Reaction 1 min RT, 30 min RT, 30 min RT, 30 min RT, 30 min RT, 30 min RT, 30 min
Histofine Anti-mouse Anti-rabbit Anti-mouse Anti-mouse Anti-mouse Anti-rabbit
Reaction RT, 30 min RT, 30 min RT, 30 min RT, 30 min RT, 30 min RT, 30 min
AEC reaction time 20 min 20 min 10 min 40 min 20 min 20 min
Round 7 Round 8 Round 9 Round 10 Round 11 Round 12-1 Round 12-2 #
Primary Ab GATA-3 Foxp3 PD-L1 CD20 CD45 EpCAM p16
Supplier BD Bioscience eBioscience Cell Signaling Santa Cruz Thermo Scientific US Biological Ventana
Clone/Product# L50-823 236A/E7 E1L3N 0.N.85 H130 6k161 E6H4
Concentration 1:100 1:40 1:100 1:1000 1:100 1:500 Prediluted
Reaction RT, 30 min RT, 30 min RT, 60 min RT, 30 min RT, 30 min RT, 30 min RT, 30 min
Histofine Anti-mouse Anti-mouse Anti-rabbit Anti-mouse Anti-mouse Anti-rabbit Anti-mouse
Reaction RT, 30 min RT, 30 min RT, 30 min RT, 30 min RT, 30 min RT, 30 min RT, 30 min
AEC reaction time40 min 20 min 40 min 20 min 40 min 10 min 20 min
Myeloid biomarker panel
Round 1 Round 2 Round 3 Round 4 Round 5 Round 6
Primary Ab Hematoxylin Tryptase CD68 CSF1R DC-SIGN CD66b CD83 §
Supplier Dako Abcam Abacam Abcam Santa Cruz BiotecheBioscience Abcam
Clone/Product# S3301 AA1 PG-M1 SP211 DC-28 G10F5 1H4b
Conc 1:20,000 1:50 1:150 1:100 1:600 1:40
Reaction 1 min RT, 30 min RT, 30 min RT, 30 min RT, 30 min RT, 30 min RT, 30 min
Histofine Anti-mouse Anti-mouse Anti-rabbit Anti-mouse Anti-mouse Anti-mouse
Reaction RT, 30 min RT, 30 min RT, 30 min RT, 30 min RT, 30 min RT, 30 min
AEC reaction time 20min 20min 10min 20min 20min 20min
Round 7 Round 8 Round 9 Round 10 Round 11 Round 12-1 Round 12-2 #
Primary Ab CD163 MHC class II ¶ PD-L1 CD3/20/56 CD45 EpCAM p16
Supplier Thermo Scientific Novus Biological Cell Signaling * Thermo Scientific US Biological Ventana
Clone/Product# 10D6 SPM288 E1L3N * H130 6k161 E6H4
Conc 1:100 1:100 1:100 * 1:100 1:500 Prediluted
Reaction RT, 30 min RT, 30 min RT, 60 min RT, 30 min RT, 30 min RT, 30 min RT, 30 min
Histofine Anti-mouse Anti-mouse Anti-rabbit ** Anti-mouse Anti-rabbit Anti-mouse
Reaction RT, 30 min RT, 30 min RT, 30 min RT, 30 min RT, 30 min RT, 30 min RT, 30 min
AEC reaction time20min 10min 40min 20min 40 min 10 min 20 min
Functional biomarker panel
Round 1 † Round 2 Round 3 Round 4 Round 5 Round 6
Primary Ab Hematoxylin CD4 CD3 PD-1 Ki67 CD8 Eomes (Tbr2)
Supplier Dako Thermo Scientific Thermo Scientific Abcam Abcam Thermo Scientific EMD Millipore
Clone/Product# S3301 4B12 SP7 NAT105 SP6 C8/144B AB2283
Conc 1:25 1:150 1:50 1:500 1:50 1:1000
Reaction 1 min RT, 30min RT, 30min RT, 30min RT, 30min RT, 30min RT, 30min
Histofine Anti-mouse Anti-rabbit Anti-mouse Anti-rabbit Anti-mouse Anti-rabbit
Reaction RT, 30min RT, 30min RT, 30min RT, 30min RT, 30min RT, 30min
AEC reaction time 20min 20min 20min 20min 20min 20min
Round 7 Round 8 Round 9 Round 10 Round 11
Primary Ab IDO Granzyme B CD68 T-bet CD45
Supplier EMD Millipore Sigma Aldrich Abacam Santa Cruz BiotechThermo Scientific
Clone/Product# 1F8.2 EP230 PG-M1 sc-21003 H130
Conc 1:100 1:100 1:50 1:100 1:50
Reaction RT, 30min RT, 30min RT, 30min RT, 30min RT, 30min
Histofine Anti-mouse Anti-rabbit Anti-mouse Anti-rabbit Anti-mouse
Reaction RT, 30min 30 min RT, 30min RT, 30min RT, 30min
AEC reaction time20min 20min 20min 20min 40min
# Round 12 was utilized only for HNSCC-TMA analysis. No antibody stripping protocol was applied between Round 12-1 and 12-2.
§ This antibody was discontinued by the supplier. We confirmed anti-DC-LAMP antibody (1010E1.01, Novus Biological, 1:100) & anti-rat
Histofine (414311F) & 30-min AEC work as an alternative of a mature DC marker for future studies.
¶ This antibody was discontinued by the supplier. We confirmed anti-MHC class II antibody (EPR11226, abcam, 1:5000) & anti-rabbit Histofine
(414141F) & 20-min AEC work as an alternative of MHC class II for future studies.
* CD3(SP7), 1:150; CD20(0.N.85), 1:1,000; CD56(123C3), 1:25
** Anti-Mouse for 30 min, Anti-Rabbit for 30 min
† Antigen retrieval was performed by Tris-EDTA (10 mM Tris Base, 1 mM EDTA and 0.05% Tween-20, pH 9.0).

Table S2 in refernce to Figure 4. Patient and disease characteristics in HNSCC TMA
Features All patients HPV-positive HPV-negative
N = 38 N = 21 N =17
Gender
Male 29 18 11
Female 9 3 6
Age
< 60 14 8 6
60–80 23 13 10
> 80 1 0 1
T stage
1–2 36 21 15
3–4 2 0 2
N stage
0 20 8 12
1–3 18 13 5
M stage
0 38 21 17
1 0 0 0
Stage
I–II 18 8 10
III–IV 20 13 7
Smoking history
Never 10 7 3
Ever 28 14 14
Alcohol consumption
Absent 22 14 8
Present 13 7 6
Unknown 3 0 3
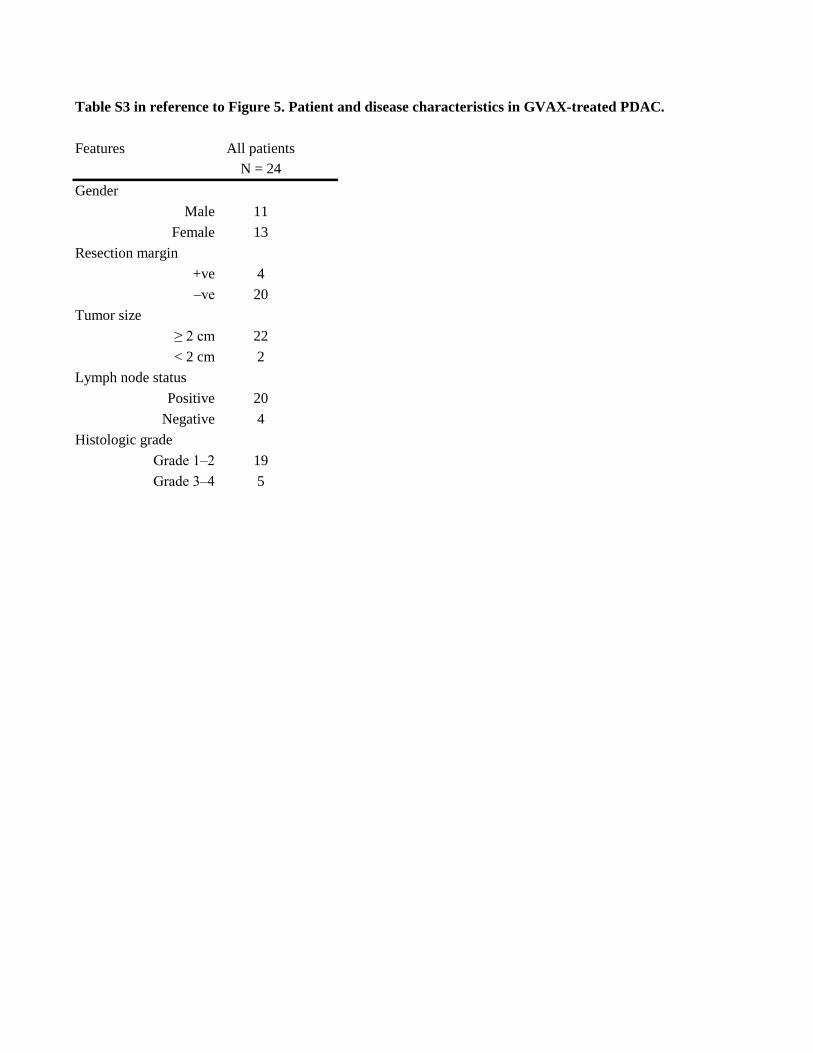
Table S3 in reference to Figure 5. Patient and disease characteristics in GVAX-treated PDAC.
Features All patients
N = 24
Gender
Male 11
Female 13
Resection margin
+ve 4
–ve 20
Tumor size
≥ 2 cm 22
< 2 cm 2
Lymph node status
Positive 20
Negative 4
Histologic grade
Grade 1–2 19
Grade 3–4 5

SUPPLEMENTAL EXPERIMENTAL PROCEDURES
Clinical samples and TMA construction
Human FFPE samples of HNSCC were obtained from the Oregon Health and Science University (OHSU) Knight
Biolibrary, and the OHSU Department of Dermatology research repository. FFPE surgical specimens were obtained from
a total of 38 patients with previously untreated oropharyngeal squamous cell carcinoma, and were used to create a TMA
for analysis. All HNSCC samples were reviewed by a head and neck pathologist (D.A.S) to select representative tissue
with dense, non-necrotic tumor. As control, a total of 10 adult palatine and lingual tonsillectomy specimen removed for
benign, non-inflammatory indications (i.e. obstructive sleep apnea) were included in the TMA. The TMA was created
using an automated microarrayer (3D Histech TMA Master; Budapest, Hungary), which took 2 mm cores from the
selected area of the donor block and placed them into an array on the recipient block. All HNSCC tumors were staged
according to the 7th edition AJCC/UIC TNM classification and cohort characteristics are shown in Table S2. HPV-status
was determined by p16 staining and/or by quantitative PCR when available. Two cases of benign tonsillectomy specimen
were excluded due to insufficient amount of tissue in the TMA. A total of 24 human PDAC tumor specimens with
presence of intratumoral lymphoid aggregates were obtained from our previous study wherein allogeneic GM-CSF-
secreting pancreatic tumor vaccine (GVAX) was administered intradermally either alone or in combination with immune
modulatory doses of cyclophophamide as neoadjuvant treatment for patients with resectable PDAC (NCT00727441,
Table S3) (Lutz et al., 2014).
Sequential immunohistochemistry and image acquisition
Sections (5 μm) of FFPE tissues were placed in a 60C heat chamber for 30 min, deparaffinized with xylene, and
rehydrated in serially graded alcohols to distilled water. Slides were stained by hematoxylin (S3301, Dako) for 1 min,
mounted with TBST buffer (0.1 M TRIS-HCl, pH 7.5, 0.15 M NaCl plus 0.05% Tween-20), and coverslipped with
Signature Series Cover Glass (12460S, Thermo Scientific), followed by whole tissue scanning using an Aperio
ImageScope AT (Leica Biosystems) at 20x magnification. After decoverslipping slides with 1.0 min. agitation in TBST,
peroxidase activity was blocked by 0.6% hydrogen peroxidase in methanol for 30 min, and slides were subjected to heat-
mediated antigen retrieval immersed in citrate buffer (pH 6.0) or Tris-EDTA (10 mM Tris Base, 1.0 mM EDTA and
0.05% Tween-20, pH 9.0) for 15 min. Then, sequential immunohistochemistry consisting of iterative cycles of staining,
scanning, and antibody/chromogen stripping was performed according to a modified protocol based on previous
reports(Glass et al., 2009; Lan et al., 1995; Tramu et al., 1978). After a protein blocking step with 5.0% goat serum, 2.5%
BSA, and 0.1% Tween-20, unlabeled primary antibodies were added to sections at the indicated dilution shown in Table
S1. After washing in TBST buffer, slides were visualized with either an anti-mouse or anti-rabbit Histofine Simple Stain
MAX PO horseradish peroxidase-conjugated polymer (Nichirei Biosciences Inc.), followed by peroxidase detection with
AEC for the indicated incubation time specified in Table S1. Cover slipping, whole tissue scanning, and decoverslipping
were performed as described above. Following chromogenic destaining in an alcohol gradient, antibodies were stripped by
a 15 min low power microwave heat treatment following high power boiling in Antigen Retrieval Citra Solution
(BioGenex). Slides were then restained sequentially in the indicated order shown in Table S1.
Image processing and analysis
The digital image workflow encompasses three steps: image preprocessing, visualization, and quantitative image analysis
as shown in below.

A flowchart showing digital image processing workflow in multiplex IHC. Following image acquisition by digital
slide scanner, images are subjected to three steps, consisting of preprocessing, quantification and visualization. Software
required for this workflow is indicated as CellProfiler pipelines available at https://github.com/multiplexIHC/cppipe (¶),
free or open-source software (#), and commercially available software (§).
Image preprocessing and selection of ROI were conducted as described below. Since iteratively digitized images need to
be precisely co-registered so that cell features overlap down to a single pixel level, coregistration of images was
performed using a CellProfiler Version 2.1.1 pipeline, “Alignment_Batch.cppipe” developed by VA and RNB. The

pipeline is available under GPLv2 (a widely used free software license) at https://github.com/multiplexIHC/cppipe.
Pseudocodes for algorithms used are available in Supplementary Note 2. Based on a small number of manually selected
single structures such as cells, vessels, and edges of tissues, the pipeline calculates global vertical and horizontal offsets
for each image relative to the hematoxylin stained image. Using these coordinate ranges and the co-registration offsets, we
extract a set of non-compressed TIFF images for each ROI that are aligned across the single-marker images, and ready for
quantitative analysis and visualization. In the HNSCC TMA analysis, each ROI was selected from a total area of each
single tissue core. In the PDAC surgical specimen analysis, a heat map of CD45+ cell density in the whole-slide digital
images was generated based on hematoxylin and CD45-IHC images. Then, the heat map was utilized for selection of three
rectangle ROIs within intratumoral high CD45-density area (approximately 6.25 mm2, or less if analyzable cancerous area
is smaller than 3.0 x 6.25 mm2) (Figure S6F).
Visualization was performed via conversion of co-registered images to pseudo-colored single-marker images in ImageJ
Version 1.48 (Schneider et al., 2012): following coregistration, exported images were processed using an ImageJ plugin,
Color_Deconvolution (www.mecourse.com/landinig/software/software.html) for AEC and hematoxylin signal
separation13
. Following pixel histogram optimization, images were then inverted and converted to gray-scale, followed by
pseudo-coloring in ImageJ and ImageScope (Leica Biosystems) as described previously (Gunderson et al., 2015).
Single cell-based segmentation and quantification of staining intensity was performed using an automated image
segmentation pipeline "CellID_FlowCyt - 6.9.15.cpproj" (developed by VA and RNB) using CellProfiler Version 2.1.1.
The pipeline is available under GPLv2 at https://github.com/multiplexIHC/cppipe. Pseudocodes for algorithms used are
available in Supplementary Note 3. This customized pipeline used several AEC-stained images for assessment of signal
intensities, and one hematoxylin-stained image for cell segmentation. First, individual RGB channels were extracted from
the hematoxylin-stained image. Next, pixel intensities for images were inverted to optimize the algorithm’s ability to
detect cells. Cell segmentation of the hematoxylin-stained image was then performed using a built-in watershed
segmentation algorithm as described previously (Wählby et al., 2004). Prior to segmentation, a built-in thresholding
method was utilized to identify local intensity maxima and minima, as well as to differentiate foreground from
background pixels, as described previously (Padmanabhan et al., 2010). The nature of multiplex staining allows
segmentation results (referred to as “objects”) to be used as templates for staining quantification of serially scanned AEC
images. The color channel specific to AEC staining was extracted from each AEC-stained image. Using objects from the
watershed segmentation, cell coordinates were overlaid onto these AEC channels, thus locating each cell on the
biomarker-stained images. Subsequently, measurements of pixel intensity were extracted and recorded. CellProfiler also
measured 26 different area and shape features of cells in the image. A color map was then constructed of all identified
cells by assigning a number to each pixel within each individual cell, and saved for image cytometry analysis. Finally, all
pixel intensity and shape-size measurements were saved to a file format compatible with flow and image cytometry data
analysis software, FCS Express 5 Image Cytometry Version 5.01.0029 (De Novo Software).
Pseudocode for image coregistration
# The inputs are the script, and an array of the image files (in most cases 12 total). It is assumed the first image is
H&E, and is only used for alignment and segmentation
script, image1, image2, image3, image4, image5, image6, image7, image8, image9, image10, image11, image12 =
inputs
""" Alignment """

# The implemented alignment algorithm aligns all images to the first image in the list.
# Displays each image, in which the user must select a common point
def find_offsets(all_image_files):
file1 = all_image_files[0]
# Reference coordinates to be compared to each other image's coordinates
file1_coordinates = []
# X and y offsets. Image 0 (file1) has an offset of 0,0 because it's the reference image. All other images are
aligned to it.
offsets = [ (0,0) ]
# When the user right clicks in the graph, it adds the coordinates to the coordinate list. When the window is
closed, the script continues
# IMPORTANT: Coordinate lists must be same length.
def onclick(event, coordinate_list):
coordinate_list.append( (event.x, event.y) )
figure1.showimage(file1)
figure1.connect("right_click_event", onclick(file1_coordinates))
figure1.show()
# Iterate through all images (besides first "reference" image)
for x in range(1, len(all_image_files)):
filex_coordinates = []
while len(filex_coordinates) != len(file1_coordinates):
figure1.showimage(all_image_files[x])
figure1.connect("right_click_event", onclick(filex_coordinates))
figure1.show()
# Offset compared to reference image (file1). Find diference between reference image and current image
points.
x_offset = int(sum(filex_coordinates[a][0] - file1_coordinates[a][0] for a in range(0,
len(filex_coordinates)))/len(filex_coordinates))
y_offset = int(sum(filex_coordinates[a][1] - file1_coordinates[a][1] for a in range(0,
len(filex_coordinates)))/len(filex_coordinates))
# Add this image's coordinates to offsets array
offsets.append( (x_offset, y_offset) )
return offsets
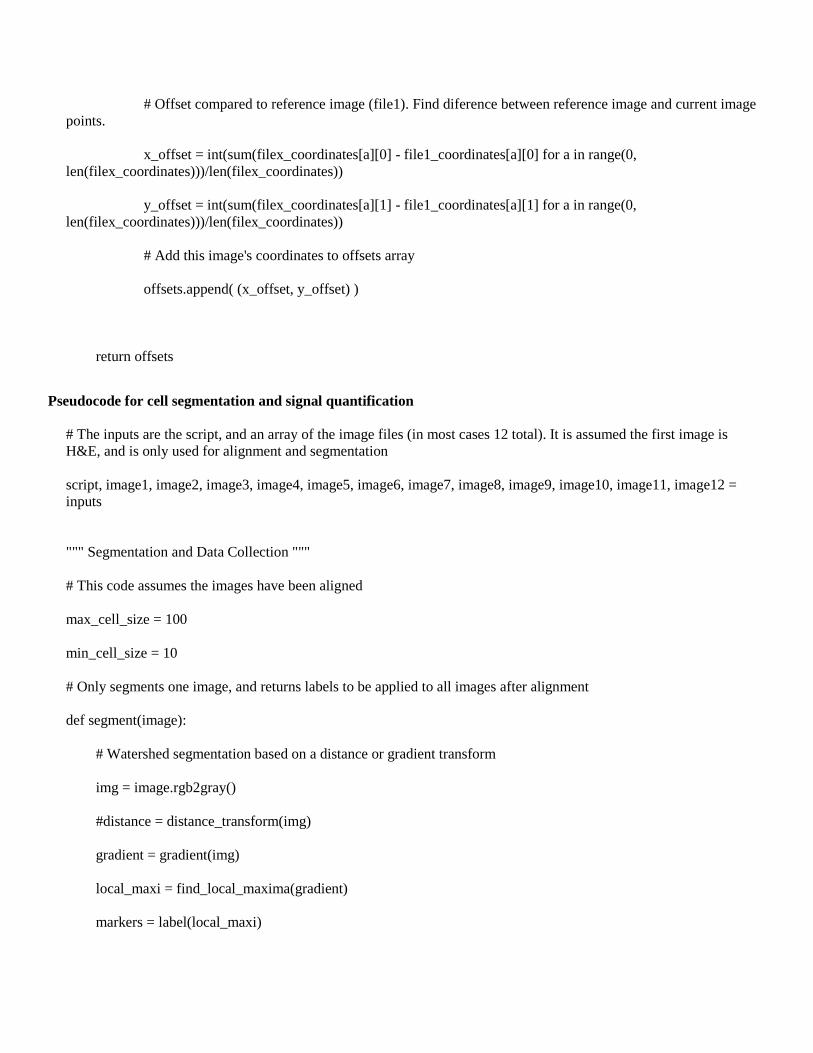
Pseudocode for cell segmentation and signal quantification
# The inputs are the script, and an array of the image files (in most cases 12 total). It is assumed the first image is
H&E, and is only used for alignment and segmentation
script, image1, image2, image3, image4, image5, image6, image7, image8, image9, image10, image11, image12 =
inputs
""" Segmentation and Data Collection """
# This code assumes the images have been aligned
max_cell_size = 100
min_cell_size = 10
# Only segments one image, and returns labels to be applied to all images after alignment
def segment(image):
# Watershed segmentation based on a distance or gradient transform
img = image.rgb2gray()
#distance = distance_transform(img)
gradient = gradient(img)
local_maxi = find_local_maxima(gradient)
markers = label(local_maxi)

labels = watershed(-gradient, markers, mask=image)
# Remove cells that are too big or too small
temp_props = regionprops(labels, image)
for cell in temp_props:
if cell['area'] < min_cell_size or cell['area'] > max_cell_size:
labels[labels == cell['label']] = 0
return labels
# Collect stain data from all images except first (assumes first is H&E)
def collect_data(all_image_files, labels):
# Make dataframe to store protein intensities
save_data = pd.DataFrame( col1=labels['label'], col1_name='Cells' )
# Record label numbers, in order
save_data['Labels'] = (x['label'] for x in regionprops(labels))
# In each image, measure the AEC level of each label
for x in range(1, len(all_image_files)):
add_data = []
for cell in regionprops(labels):
# Access pixels of each label, overlay the image onto pixels, and record normalized RGB
intensities
# These RGB values are normalized based on AEC staining (3-amino-9-ethylcarbazole). Values
vary based on staining method

add_data.append(a['pixels'].read_pixels( mask=all_image_files[x], normalize=(0.274, 0.679,
0.680) ))
save_data['Image_' + x + '_AEC'] = add_data
# Save data is organized as a pandas dataframe of rows and columns.
# The first column is the label count for individual (1 to [number of labels])
# The 2nd-12th columns are the AEC intensity values of each label (cell) on each image.
save_data.io.save("Image_Cytometry_Results")
# Make arrays of all input images
all_images = [image1.asarray, image2.asarray, image3.asarray,
image4.asarray, image5.asarray, image6.asarray,
image7.asarray, image8.asarray, image9.asarray,
image10.asarray, image11.asarray, image12.asarray]
# Dictionary of image offsets
image_offsets = []
# Find offsets
image_offsets = find_offsets(all_images)
# Align images based on offsets
for x in range(0, len(image_offsets))
all_images[x] = realign_pixels( all_images[x], image_offsets[x] )
# Now that images are aligned, segment cells in H&E image and collect data
collect_data( all_images, segment(all_images[0]) )

REFERENCE FOR SUPPLEMENTAL EXPERIMENTAL PROCEDURES
Glass, G., Papin, J.A., and Mandell, J.W. (2009). SIMPLE: a sequential immunoperoxidase labeling and erasing method. J
Histochem Cytochem 57, 899-905.
Gunderson, A.J., Kaneda, M.M., Tsujikawa, T., Nguyen, A.V., Affara, N.I., Ruffell, B., Gorjestani, S., Liudahl, S.M.,
Truitt, M., Olson, P., et al. (2015). Bruton's Tyrosine Kinase (BTK)-dependent immune cell crosstalk drives pancreas
cancer. Cancer Discov 6, 270-285.
Lan, H.Y., Mu, W., Nikolic-Paterson, D.J., and Atkins, R.C. (1995). A novel, simple, reliable, and sensitive method for
multiple immunoenzyme staining: use of microwave oven heating to block antibody crossreactivity and retrieve antigens.
Journal of Histochemistry & Cytochemistry 43, 97-102.
Lutz, E.R., Wu, A.A., Bigelow, E., Sharma, R., Mo, G., Soares, K., Solt, S., Dorman, A., Wamwea, A., and Yager, A.
(2014). Immunotherapy Converts Nonimmunogenic Pancreatic Tumors into Immunogenic Foci of Immune Regulation.
Cancer Immunology Research 2, 616-631.
Padmanabhan, K., Eddy, W.F., and Crowley, J.C. (2010). A novel algorithm for optimal image thresholding of biological
data. J Neurosci Methods 193, 380-384.
Schneider, C.A., Rasband, W.S., and Eliceiri, K.W. (2012). NIH Image to ImageJ: 25 years of image analysis. Nat
Methods 9, 671-675.
Tramu, G., Pillez, A., and Leonardelli, J. (1978). An efficient method of antibody elution for the successive or
simultaneous localization of two antigens by immunocytochemistry. J Histochem Cytochem 26, 322-324.
Wählby, C., SINTORN, I.M., Erlandsson, F., Borgefors, G., and Bengtsson, E. (2004). Combining intensity, edge and
shape information for 2D and 3D segmentation of cell nuclei in tissue sections. J Microsc 215, 67-76.