quantitative reservoir optimization
TRANSCRIPT

Authors:Dakin Sloss, Chairman of TachyusDr. Ganesh Thakur, Former SPE President, Chevron VP & Fellow
Quantitative Reservoir OptimizationTransform Your Data Into Dollars
May 16, 2016

Fundamentally, energy production requires understanding where resources are located and how to extract them cost-effectively and safely. Over the last decade, you probably deployed significant capital to collect massive quantities of real-time sensor data; howev-er, particularly given current commodity prices, you are still seeking to modernize analysis techniques and thus realize the return on investment from your new data sources.
In order to accomplish this mission-critical objective, your operation needs a platform to rapidly integrate seismic data, cores, well logs, completion designs, real-time production data, maintenance records, and financial constraints. Additionally, you require software capable of flexible descriptive analytics to visualize and contextualize this deluge of data.
Such applications must not only integrate and visualize disparate data sources, but also unlock the power of predictive analytics by empowering your engineers to quickly predict initial production and decline rates, production responses to stimulation, relationships between completion design and initial production, and field-wide forecasts for any given injection redistribution. Ultimately, to transform data into dollars, you need prescriptive analytics to explore millions of scenarios and identify optimal operational and develop-ment plans.
Quantitative Reservoir Optimization 1
INTRODUCTION
Recommend optimal decisionPrescriptive Analytics
Forecast the futurePredictive Analytics
Visualize and explore dataDescriptive Analytics
Connect disparate sourcesIntegration
Measurement Gather raw data
Figure 1Data drives decision-making process to create value
30+ 25,000+ 20%+Wells
40%Oil Fields
Tachyus’ breakthrough technology, Data PhysicsTM, has been extensively validated and tested
Oil Production Operating Cost
This executive briefing introduces the first-of-its-kind platform that operators are already using to unlock the hidden value in their greatest untapped asset: their data. Tachyus’ breakthrough quantitative optimization framework Data Physics has been validated across 30+ fields and more than 25,000 wells to enable operators to increase production by greater than 20%.
2
●
●
●
●
●
●
●
●
●
●
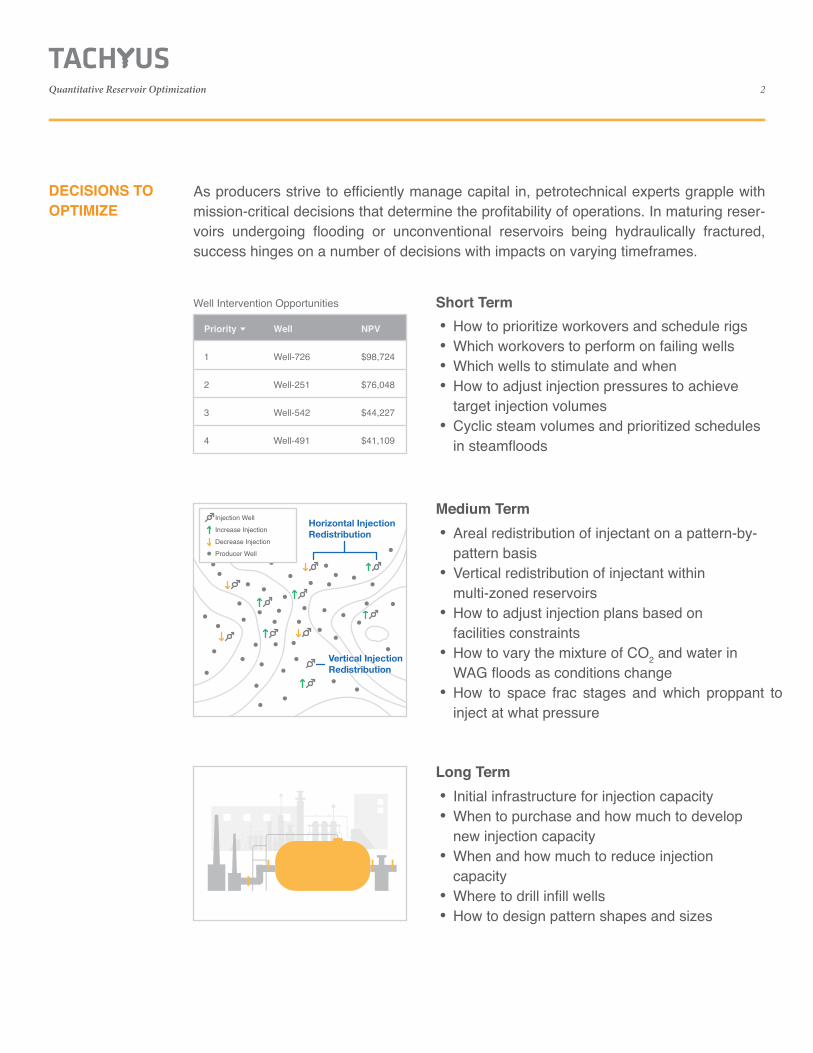
How to prioritize workovers and schedule rigsWhich workovers to perform on failing wellsWhich wells to stimulate and whenHow to adjust injection pressures to achievetarget injection volumesCyclic steam volumes and prioritized schedules in steamfloods
Areal redistribution of injectant on a pattern-by-pattern basisVertical redistribution of injectant within multi-zoned reservoirsHow to adjust injection plans based onfacilities constraintsHow to vary the mixture of CO2 and water in WAG floods as conditions changeHow to space frac stages and which proppant to inject at what pressure
As producers strive to efficiently manage capital in, petrotechnical experts grapple with mission-critical decisions that determine the profitability of operations. In maturing reser-voirs undergoing flooding or unconventional reservoirs being hydraulically fractured, success hinges on a number of decisions with impacts on varying timeframes.
Priority
1
2
3
4
Well
Well-726
Well-251
Well-542
Well-491
Horizontal InjectionRedistribution
Vertical InjectionRedistribution
Injection Well
Increase Injection
Decrease Injection
Producer Well
NPV
$98,724
$76,048
$44,227
$41,109
Well Intervention Opportunities Short Term
Medium Term
●
●
●
●
●
Initial infrastructure for injection capacityWhen to purchase and how much to develop new injection capacityWhen and how much to reduce injection capacityWhere to drill infill wellsHow to design pattern shapes and sizes
Long Term
DECISIONS TO OPTIMIZE
Quantitative Reservoir Optimization

3
Physics-Based Approaches
For crucial decisions, operators typically rely on semi-quantitative approaches such as decline curve analysis or simple analytical models. These methods are capable of using only a small portion of available data and function as rules of thumb, resulting in qualita-tively optimized reservoir management decisions at best.
On the other extreme, major oil companies leverage sophisticated predictive modeling. Reservoir simulation is the most advanced technique available today in that it is capable of integrating disparate data sources and predicting over long time horizons. While reser-voir simulation is an excellent tool for field studies and long-term planning, certain limita-tions prevent operators from leveraging simulation for day-to-day decision-making.
In essence, reservoir simulation enables operators to precisely model the physics of a small number of scenarios; however, it is not designed to produce thousands or millions of scenarios and to automatically update those scenarios based on real-time data. Even for operators with the world’s most sophisticated simulations, there is a need for faster models in order to achieve prescriptive analytics and leverage real-time data.
LIMITATIONSOF EXISTINGMODELING
Reliance on geomodeling workflows requiring months to years of manual set-up1It requires hours or days to run a single scenario due to computational complexity2It is impractical to obtain optimal solutions given a limited set of scenarios3Lack of uncertainty quantification because of insufficient number of models4
5 Sequential data integration results ininconsistencies and failure to honor all the data
Traditional models cannot process the large number of parameters required to increase resolution6It is difficult to integrate data for which physical models are unknown or unclear7
�e most notable challenges to quantitative optimizationbased on reservoir simulation include:
Even for operators with the world’s most sophisticated simulations, there is a need for faster models to achieve prescriptive analytics and leverage real-time data.
Quantitative Reservoir Optimization
4
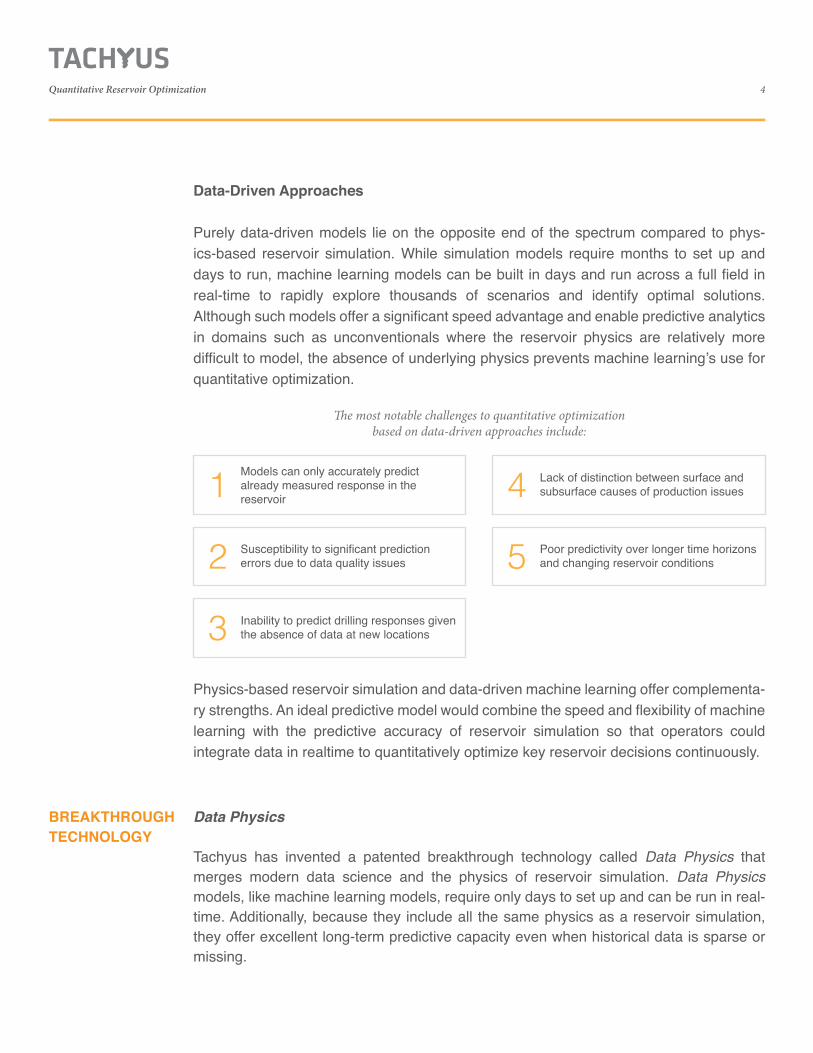
Data-Driven Approaches
Purely data-driven models lie on the opposite end of the spectrum compared to phys-ics-based reservoir simulation. While simulation models require months to set up and days to run, machine learning models can be built in days and run across a full field in real-time to rapidly explore thousands of scenarios and identify optimal solutions. Although such models offer a significant speed advantage and enable predictive analytics in domains such as unconventionals where the reservoir physics are relatively more difficult to model, the absence of underlying physics prevents machine learning’s use for quantitative optimization.
Physics-based reservoir simulation and data-driven machine learning offer complementa-ry strengths. An ideal predictive model would combine the speed and flexibility of machine learning with the predictive accuracy of reservoir simulation so that operators could integrate data in realtime to quantitatively optimize key reservoir decisions continuously.
�e most notable challenges to quantitative optimizationbased on data-driven approaches include:
Models can only accurately predict already measured response in the reservoir1Susceptibility to significant prediction errors due to data quality issues2Inability to predict drilling responses given the absence of data at new locations3
4 Lack of distinction between surface and subsurface causes of production issues
Poor predictivity over longer time horizons and changing reservoir conditions5
Data Physics
Tachyus has invented a patented breakthrough technology called Data Physics that merges modern data science and the physics of reservoir simulation. Data Physics models, like machine learning models, require only days to set up and can be run in real-time. Additionally, because they include all the same physics as a reservoir simulation, they offer excellent long-term predictive capacity even when historical data is sparse or missing.
BREAKTHROUGH TECHNOLOGY
Quantitative Reservoir Optimization

5
Data Physics models integrate production data, log data, and seismic data in a single assimilation step unlike traditional sequential reservoir simulation workflows. Additionally, data assimilation is automatic and leverages sophisticated algorithms requiring minimal human intervention. These models directly incorporate raw data such as log responses without the need for manual interpretation. Thus, Data Physics models can be built rapid-ly, updated continuously, and assimilate various forms of data without inconsistencies.
Figure 3 compares the oil saturation map obtained from a Data Physics model on the left and a conventional simulation model of the same field on the right, holding computational time constant. This comparison illustrates that Data Physics models produce the same kind of output as traditional simulation models, but at a much higher resolution for the same computational input, allowing identification of bypassed oil.
Similarly, Data Physics models calculate the saturation map of a field orders of magnitude faster than conventional simulation models for the same spatial and temporal resolution. As a result, Data Physics models can be used to explore thousands, or even millions, of operational and development plans on a daily basis, incorporating the latest available real-time data.
Figure 2
Data PhysicsTM
Neural Networks
Fuzzy Logic
Machine Learning
Conservation of Energy
Conservation of Mass
Darcy’s Law
Output
Input 1
Input 2
Input n
Data Science and Machine LearningPhysics and Simulations
0 7 7 6 8 6 4 7 3 5 7 0 9 4 5 8 6 8 3 7 0 0 49 9 2 9 1 0 8 6 2 8 1 6 4 1 4 2 0 0 2 4 8 2 5 3 3 8 5 5 4 4 6 7 3 3 2 1 5 6 2 2 1 5 6 0 8 2 1 3 7 8 1 7 7 2 3 4 7 3 8 0 5 4 6 1 0 9 4 7 4 3 0 8 0 5 3 8 1 9 1 0 0 1 8 7 2 43 2 9 7 1 3 5 4 2 4 2 6 1 2 5 4 1 2 5 3 2 4 4 1 2 4 2 0 1 2 4 1 5 1 3 1 5 2 4 1 7 1 4 8 2 1 2 1 5 0 3 0 2 0 6 1 8 4 5 2 1 4 2 7 8 3 2 4 8 7 0 2 6 7 8 0 1 3 3 9 8 2 1 2 2 6 7 60 3 5 0 3 3 6 8 1 2 5 0 4 1 5 1 1 2 27 5 1 3 3 5 2 1 2 4 2 5 1 9 1 2 3 4 1 6 4 14 6 8 9 1 7 9 4 8 3 4 3 7 3 5 2 0 2 3 1 5 1 3 5 1 9 2 0 7 3 2 1 4 2 3 2 4 1 1 5 1 5 4 0 5 1 2 6 4
Figure 3
Data Physics Model Conventional Simulation
Quantitative Reservoir Optimization

6
Figure 4
Closed-Loop Optimization
After fitting historical data and validating predictive capacity, Data Physics models can be used to quantitatively optimize any future performance indicator such as short-term cash flow, NPV, or ultimate recovery. Additionally, due to the speed of Data Physics models, closed-loop optimization becomes possible. Figure 4 shows a closed-loop framework wherein Data Physics models continuously ingest new data, and the updated models optimize reservoir management decisions such as water redistribution, cyclic steam candidate selection, completion design, and infill drilling in realtime throughout the life of the field.
Updating
Optimization
Measured DataOptimized ControlsReal Reservoir
Reservoir Models
Sensors
Model Calibration
Control Algorithms
Cyclic Steam Stimulation
Cyclic steam is a thermal EOR process that consists of shutting in a producing well, inject-ing steam into it, allowing the steam to soak, and then returning the well to production with increased production due to thermal response in the reservoir.
The objective is to identify and cycle the set of wells that maximize the ROI of the steam jobs by modifying individual well steam volumes and the schedule of wells. Figure 5 shows the performance of Cyclic Steam Stimulation (CSS) jobs in a field undergoing steamflood and cyclic steam in Bakersfield, CA, with and without Data Physics and the corresponding quantitative optimization for cyclic steam injection. The results indicate a significant sustained increase in oil production of at least 30% due to optimization.
CASE STUDIES
Quantitative Reservoir Optimization

7
Figure 5
At day 45, the operator began using the Tachyus optimization solution. �is solution provided the operator with a list of wells to steam that was di�erent from the original plan.
�e blue line is obtained by looking at the CSS jobs performed by the operator exactly one year prior and projecting forward the same production response. �e orange line shows a drop starting at day 45 and spike at day 80. �e short-term drop occurred because wells are taken o�ine during steaming; the spike occurred a�er
the wells returned to production with increased oil production.
Steamflood
Full steamflood optimization consists of a combination of pattern design, areal steam redistribution, vertical steam redistribution, selection of total steam capacity, and infill drilling location selection. This case study simply focuses on steam capacity optimization.
Figure 6 shows sample optimized and unoptimized injection scenarios. The operator is not yet maximizing production or minimizing injection. Depending on the operator’s priorities and risk tolerance, there are several optimal solutions. For example, steam injection can decrease almost 40% while maintaining oil production, or oil production can increase 20% while maintaining injection.
Figure 6
One Optimal Examplerevenue > 10%opex < 20%
Decrease Opex
Incr
ease
Rev
enue
20
15
10
5
0-40 -30 -20
Cost Reduction (%)
Incr
emen
tal O
il Pr
oduc
tion
(%)
-10 0
Current non-optimal steaminjection and oil production
2500
500 100Days
150
Mon
thly
Allo
cate
d O
il Pr
oduc
tion
(BO
PD)
1000
1500
Actual field oil production responseafter optimization
Projected field oil production if the operator hadcontinued cyclic operation without optimization
Historical field oil production prior to optimization
Possible Injection StrategiesUnoptimizedMinimize OpexMaximize Revenue
Quantitative Reservoir Optimization
8
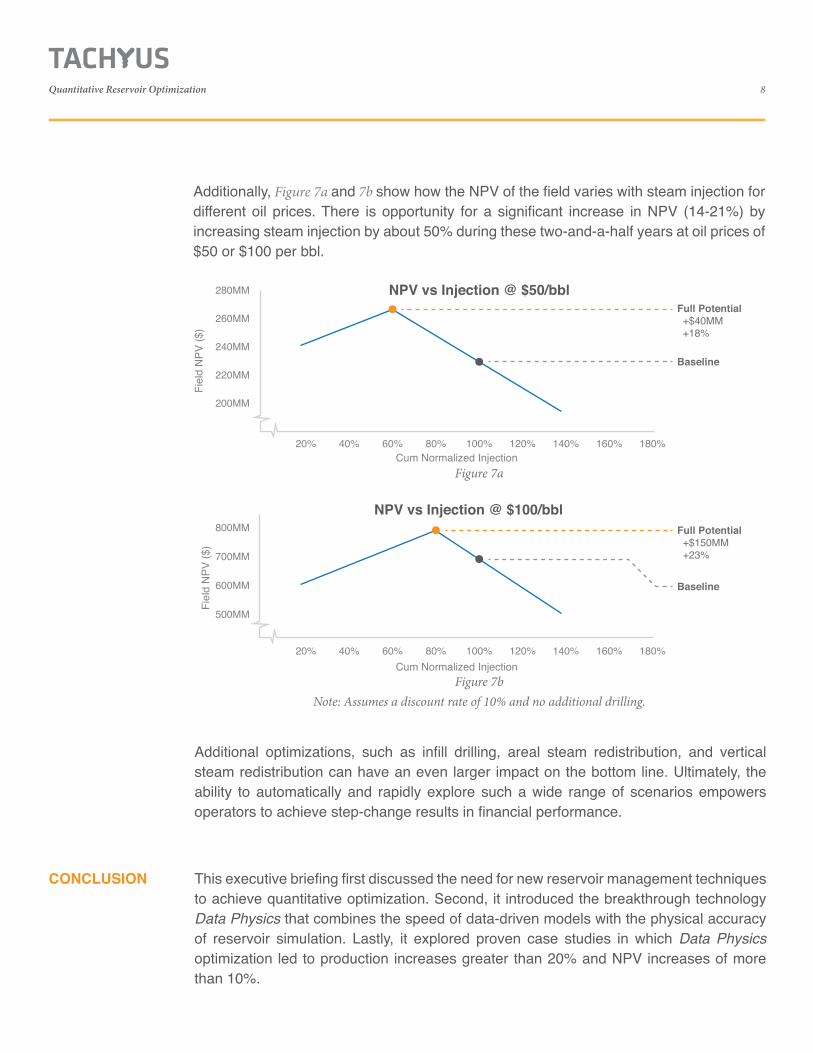
Additionally, Figure 7a and 7b show how the NPV of the field varies with steam injection for different oil prices. There is opportunity for a significant increase in NPV (14-21%) by increasing steam injection by about 50% during these two-and-a-half years at oil prices of $50 or $100 per bbl.
Figure 7a
NPV vs Injection @ $50/bbl
Fiel
d N
PV ($
)
Cum Normalized Injection
280MM
260MM
240MM
220MM
200MM
100% 180%20% 160%140%120%80%60%40%
Baseline
Full Potential +$40MM +18%
Additional optimizations, such as infill drilling, areal steam redistribution, and vertical steam redistribution can have an even larger impact on the bottom line. Ultimately, the ability to automatically and rapidly explore such a wide range of scenarios empowers operators to achieve step-change results in financial performance.
This executive briefing first discussed the need for new reservoir management techniques to achieve quantitative optimization. Second, it introduced the breakthrough technology Data Physics that combines the speed of data-driven models with the physical accuracy of reservoir simulation. Lastly, it explored proven case studies in which Data Physics optimization led to production increases greater than 20% and NPV increases of more than 10%.
CONCLUSION
Figure 7bNote: Assumes a discount rate of 10% and no additional drilling.
180%
Fiel
d N
PV ($
)
Cum Normalized Injection
800MM
700MM
600MM
500MM
20% 160%140%120%100%80%60%40%
Baseline
Full Potential +$150MM +23%
NPV vs Injection @ $100/bbl
Quantitative Reservoir Optimization