quantitative separation of alcohol and ester forms of vitamin a by solvent extraction and...
TRANSCRIPT
August, 1944 A N A L Y T I C A L E D I T I O N 509
All subsequent colorimeter measurements are made by taking a reading on an oxidized solution, reducing the solution in the ab- sorption tube with a small crystal of ferrous ammonium sulfate, and taking a second reading. The difference between the first and second readings then represents the color due to the dichro- mate present. If appreciable amounts of highly colored ions are present, the colorimetet is adjusted to read zero on the reduced solution before a reading is taken on the oxidized sample.
DESCRIPTION OF COLORIMETER
A Klett-Summerson photoelectric colorimeter was used. This colorimeter has a logarithmic scale, and when Beer’s law applies, the scale readings are proportional to the concentration of col- ored ion. Measurements were made in an absorption tube of 12.5-mm. inside diameter, with a color filter transmitting be- tween 410 and 480 millimicrons.
DISCUSSION OF RESUL.3
Reference to Table I1 shows that duplicate determinations agree well and the results obtained compare favorably with the Bureau of Standard certificate values. Moderate amounts of the ordinary alloying constituents do not affect the accuracy of the method. Since the color intensity of dichromate is depen-
dent upon the concentration of ferric perchlorate, it is evident that large amounts of alloying constituents would produce an appreciable error in this method. In the case of silicon, for ex- ample, experience has shown that amounts in excess of 1 % cause a perceptible error if the normal graph of per cent us. colorimeter reading is used. However, supplementary graphs for the de- termination of chromium in high-silicon iron or steel may be prepared, by using samples which contain known chromium and known, similar, high-silicon percentages. An additional pre- caution deserves mention: it is necessary to allow the silica pres- ent in the colorimeter tube to settle for 1 or 2 minutes before taking a reading. This method is applicable to the great majority of steels with‘out
any modification whatever. Inasmuch as iron is not separated from chromium, the analysis is more rapid than most methods for the colorimetric determination of chromium in steel.
LITERATURE CITED
(1) Mal’tsev and Temirenko, Zavodskaya Lab., 10, 357 (1941). (2) Yoe, J. H., “Photometric Chemical Analysis”, Vol. I, pp. 165-
70, New York, John Wiley & Sons, 1928.
Quantitative Separation of Alcohol and Ester Forms of Vitamin A
By Solvent Extraction and Chromatographic Methods
GERALD REED, E. C. WISE, AND R. J. L. FRUNDT Research Laboratories, Kalamazoo, Mich.
1f vitamin A alcohol and vitamin A palmitate are distributed between equal volumes of 95% aqueous methanol and petroleum ether, 27% of the alcohol form and 98% of the ester form remain in the petroleum ether phase. A simple formula allows calculation of the percentage of either form of vitamin A i f an unknown mixture i s distributed between the solvents. Vitamin A alcohol can b e sepa- rated quantitatively from its esters b y filtration of a solution in ethyl- ene dichloride through chromatographic columns of activated alumina. A procedure for carrying out this analytical separation i s described.
T HAS been claimed (4 ) that esterified vitamin A in its natu- I ral state in fish liver oils has a higher biological potency than equivalent amounts of vitamin A alcohol in the unsaponifiable fractions of these oils. Investigation of these claims necessitated the development of a fast and simple method for the analytical separation of vitamin A alcohol from its esters. Molecular dis- tillation of oils has been used (6), but the equipment is not so simple in operation as is desirable for an analytical method. (.I method for the assay of both forms by fluorophotometry was pub- lished after the completion of this manuscript, 8.)
The analytical separation by solvent fractionation was studied by Gillam (6) who reported the distribution of vitamin .4 (alco- hol) hetween light petroleum ether and aqueous methanol. Claussen (3) separated the alcohol and ester forms by distribu- tion between hexane and Sl.9yo aqueous ethanol. A search of the literature did not reveal data concerning the advantages of different alcohols for the separation or details of the analytical procedure.
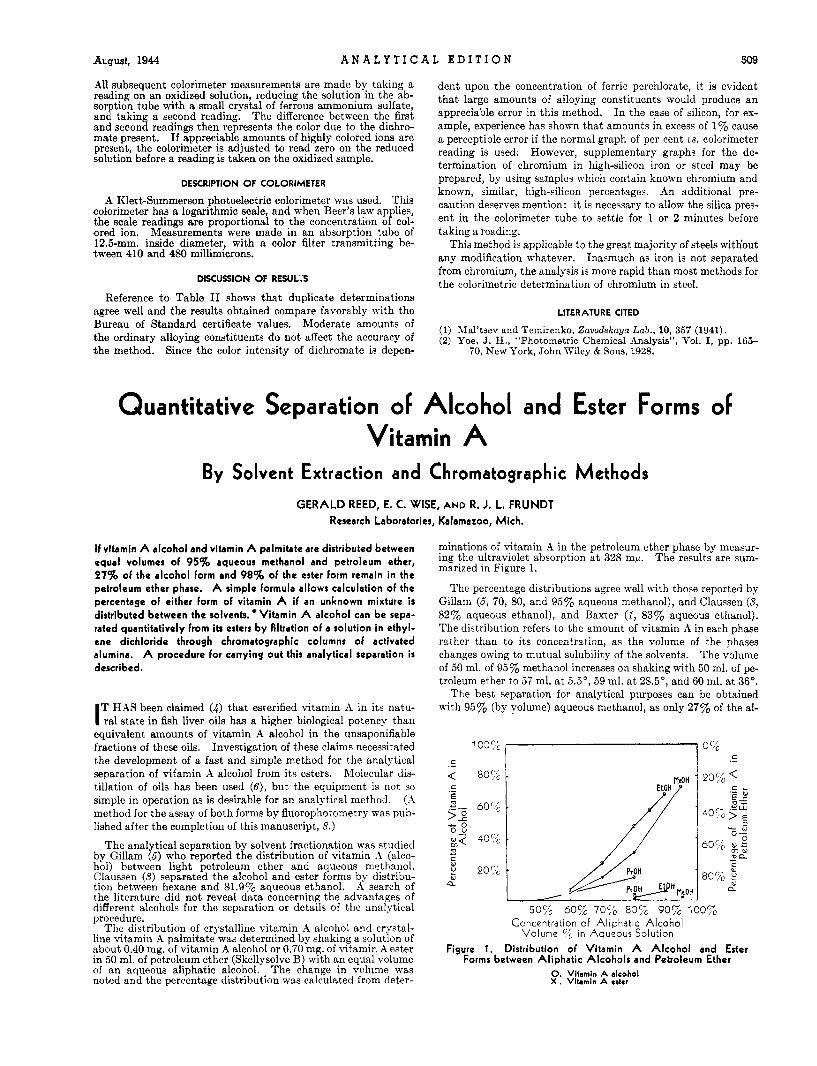
The distribution of crystalline vitamin A alcohol and crystal- line vitamin -4 palmitate was determined by shaking a solution of about 0.40 mg. of vitamin A alcohol or 0.70 mg. of vitamin A ester in 50 ml. of petroleum ether (Skellysolve B) with an equal volume of an aqueous aliphatic alcohol. The change in volume was noted and the percentage distribution was calculated from deter-
minations of vitamin 4 in the petroleum ether phase by measur- ing the ultraviolet absorption a t 325 mp. The results are sum- marized in Figure 1.
The percentage distributions agree well with those reported by Gillam (5, 70, 80, and 95% aqueous methanol), and Claussen (3, S2’3, aqueous ethanol), and Baxter (1, 83% aqueous ethanol). The distribution refers to the amount of vitamin A in each phase rather than to its concentration, as the volume of the phases changes owing to mutual solubility of the solvents. The volume of 50 ml. of 95% methanol increases on shaking with 50 ml. of pe- troleum ether to 57 ml. at 5.5’, 59 ml. a t 28.5”, and 60 ml. a t 36’.
The best separation for analytical purposes can be obtained with 95% (by volume) aqueous methanol, as only 27% of the a1-
103‘C, I I I
50% 60% 70:; 8070 90% 1007 Concentration of Aliphatic Alcohol
Volume % in Aqueous Solution
Figure 1. Distribution of Vitamin A Alcohol and Ester Forms between Aliphatic Alcohols and Petroleum Ether
0. Vitamin A alcohol X . Vitamin A d e r
510 I N D U S T R I A L A N D E N G I N E E R I N G C H E M I S T R Y Vol. 16, No. 8
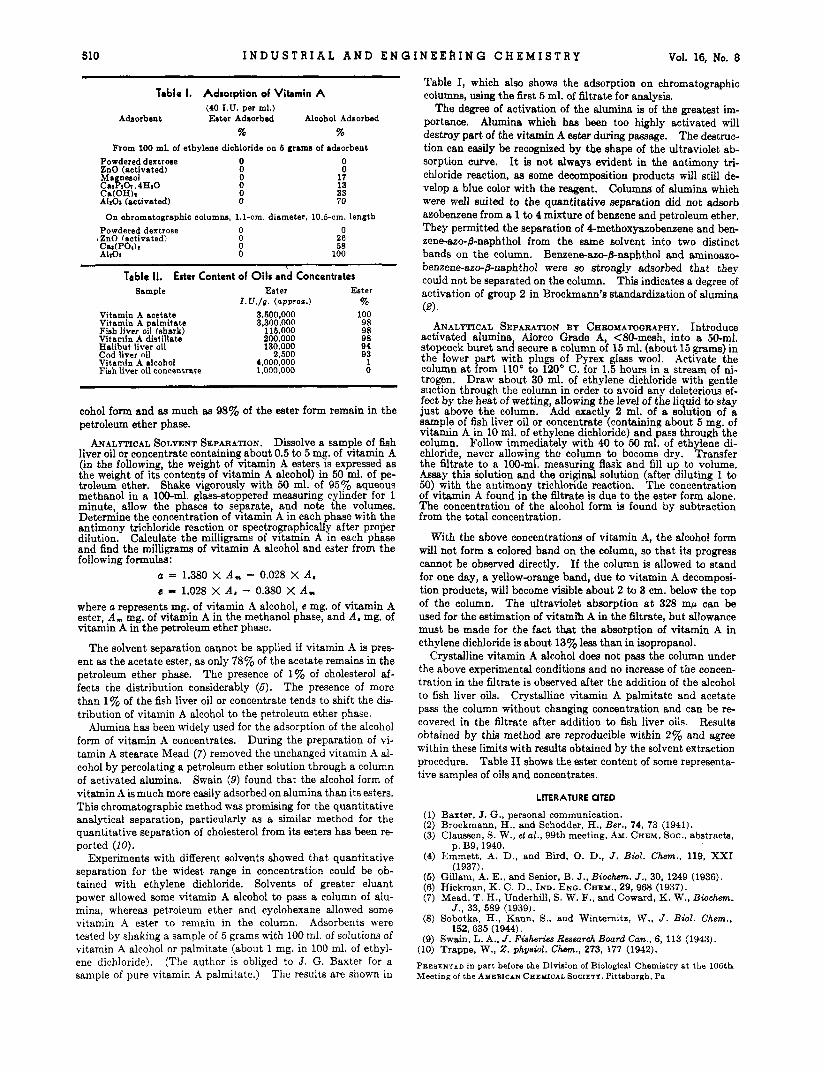
Table 1. Adsorption of Vitamin A (40 I.U. per ml.)
Adaorbent Ester Adsorbed Alcohol Adsorbed
% % From 100 ml. of ethylene dichloride on 6 gram of adsorbent
0 0 17 13 33 70
On chromatographic aolumns, 1.1-om. diameter, 10.5-om. length Powdered dextrose 0
.ZnO (activated) 0 CSl(P0Ih 0 AlrOa 0
0 26 58
100
Table II. Ester Content of Oils and Concentrates Sample Eater Ester
I . U . / o . (npproz.) % Vitamin A acetate 3..500,000 100 Vitamin A palmitate 3,300.000 98 Fish liver oil (nhark) 115.OOo 9 s Vitamin A distillate 200.000 98 Halibut liver oil 130.000 94 Cod liver nil 2,JOO 93 Vitamin A alcohol 4,000,000 1 Fish liver oil concentrate 1,000,000 0
coho1 form and as much as 98% of the eater form remain in the petroleum ether phase.
Dissolve a sample of fish liver oil or concentrate containing about 0.5 to 5 mg. of vitamin A (in the following, the weight of vitamin A esters is expressed as the weight of its contents of vitamin. A alcohol) in 50 mi. of pe- troleum ether. Shake vigorously with 50 ml.. of 95% aqueous methanol in a 100-ml. glass-stoppered measunng cylinder for 1 minute, allow the phases to separate, and note the volumes. Determine the concentration of vitamin A in each phase with the antimony trichloride reaction or spectrographically after proper dilution. Calculate the milligrams of vitamin A in each phase and find the milligrams of vitamin A alcohol and ester from the following formulas:
ANALYTICAL SOLVENT SEPARATION.
u = 1.380 X A , - 0.028 X A , e = 1.028 X A . - 0.380 X A ,
where 5 represents mg. of vitamin A alcohol, e mg. of vitamin A ester, A,,, mg. of vitamin A in the methanol phase, and A. mg. of vitamin A in the petroleum ether phase.
The solvent separation cannot be applied if vitamin A is pres- ent as the acetate ester, as only 78% of the acetate remains in the petroleum ether phase. The presence of 1% of cholesterol af- fects the distribution considerably (6). The presence of more than 1 % of the fish liver oil or concentrate tends to shift the dis- tribution of vitamin A alcohol to the petroleum ether phase.
Alumina has been widely used for the adsorption of the alcohol form of vitamin A concentrates. During the preparation of vi- tamin A stearate Mead (7) removed the unchanged vitamin A al- cohol by percolating a petroleum ether solution through a column of activated alumina. Swain (9) found that the alcohol form of vitamin A is much more easily adsorbed on alumina than its esters. This chromatographic method was promising for the quantitative analytical separation, particularly as a similar method for the quantitative separation of cholesterol from its esters has been re- ported (IO).
Experiments with different solvents showed that quantitative separation for the widest range in concentration could be ob- tained with ethylene dichloride. Solvents of greater eluant power allowed some vitamin A alcohol to pass a column of alu- mina, whereas petroleum ether and cyclohexane allowed some vitamin A ester to remain in the column. Adsorbents were tested by shaking a sample of 5 grams with 100 ml. of solutions of vitamin A alcohol or palmitate (about 1 mg. in 100 ml. of ethyl- ene dichloride). (The author is obliged to J. G. Baxter for a sample of pure vitamin A palmitate.) The results are shown in
Table I, which also shows the adsorption on chromatographic columns, using the first 5 ml. of filtrate for analysis.
The degree of activation of the alumina is of the greatest im- portance. Alumina which has been too highly activated will destroy part of the vieamin A ester during passage. The destruc- tion can easily be recognized by the shape of the ultraviolet ab- sorption c w e . It is not always evident in the antimony tri- chloride reaction, tu some decomposition products will still de- velop a blue color with the reagent. Columns of alumina which were well suited to the quantitative eeparation did not adsorb azobenzene from a 1 to 4 mixture of benzene and petroleum ether. They permitted the separation of 4methoxyazobenzene and ben- zene-azo-,%naphthol from the same solvent into two distinct bands on the column. Benzene-mo-&naphthol and aminoazo- benzene-azo-,%naphthol were so strongly adsorbed that they could not be separated on the column. This indicates a degree of activation of group 2 in Brockmann'e standardization of alumina (2).
ANALYTICAL SEPARATION BY CHBOMATOGRAPHY. Introduce activated aIumina AIorco Grade A, <80-mesh, into a 50-ml. stopcock buret and secure a column of 15 ml. (about 15 grams) in the lower part with plugs of Pyrex glass wool. Activate the column a t from 110' to 120" C. for 1.5 hours in a stream of ni- trogen. Draw about 30 ml. of ethylene dichloride with gentle suction through the column in order to avoid any deleterious ef- fect by the heat of wetting, allowing the level of the li uid to stay just above the column. Add exactly 2 ml. of a ejution of a sample of fish liver oil or concentrate (containing about 5 mg. of vitamin A in 10 ml. of ethylene dichloride) and pass through the column. Follow immediately with 40 to 50 ml. of ethylene di- chloride, never allowing the column to become dry. Transfer the filtrate to a 100-ml. measuring 5ask and fill up to volume. Asmy this solution and the original solution (after diluting 1 to 50) with the antimony trichloride reaction. The concentration of vitamin A found in the filtrate is due to the ester form alone. The concentration of the alcohol form is found by subtraction from the total concentration.
With the above concentrations of vitamin A, the alcohol form will not form a colored band on the column, so that its progress cannot be observed directly. If the column is allowed to stand for one day, a yellow-orange band, due to vitamin A decomposi- tion products, will become visible about 2 to 3 cm. below the top of the column. The ultraviolet absorption a t 328 mp can be used for the estimation of vitamih A in the filtrate, but allowance must be made for the fact that the absorption of vitamin A in ethylene dichloride is about 13% leas than in isopropanol.
Crystalline vitamin A alcohol does not pass the column under the above experimental conditions and no increase of the concen- tration in the filtrate is observed after the addition of the alcohol to fish liver oils. Crystalline vitamin A palmitate and acetate pass the column without changing concentration and can be re- covered in the filtrate after addition to fish liver oils. Results obtained by this method are reproducible within 2% and agree within these limits with results obtained by the solvent extraction procedure. Table I1 shows the ester content of some representa- tive samples of oils and concentrates.
LITERATURE CITED
(1) Baxter, J. G., personal communication. (2) Brockmann, H., and Schodder, H., Ber., 74, 73 (1941). (3) Claussen, S. W., et al., 99th meeting, h. CHEM. SOC., abstracts,
(4) Emmett, A. D., and Bird, 0. D., J . Biol. Chem., 119, XXI
(5) Gillam, A. E., and Senior, B. J.. Bwchem. J . , 30, 1249 (1936). (6) Hickman, K. C. D., IND. ENG. CHEM., 29, 968 (1937). (7) Mead, T. H., Underhill, S. W. F., and Coward, K. W., Bwchem.
p. B9, 1940.
(1 937).
J . , 33, 589 (1939). (8) Sobotka, H.. Kann, S., and Winternits, W., J . Biol. Chem..
152, 635 (1944). (9) Swain, L. A,, J . Fisheries Research Board Can., 6, 113 (1943) (10) Trappe, W., 2. phvsiol. Chem., 273, 177 (1942). PRESENTED in part before the Division of Biological Chemistry at the 106th Meeting of the AMERICAN CHEMICAL SocxETT, Pittsburgh. Pa