quantitative summaries of treatment effect - biomed central
TRANSCRIPT
Cope and Jansen BMC Medical Research Methodology 2013, 13:147http://www.biomedcentral.com/1471-2288/13/147
RESEARCH ARTICLE Open Access
Quantitative summaries of treatment effectestimates obtained with network meta-analysisof survival curves to inform decision-makingShannon Cope1* and Jeroen P Jansen2
Abstract
Background: Increasingly, network meta-analysis (NMA) of published survival data are based on parametric survivalcurves as opposed to reported hazard ratios to avoid relying on the proportional hazards assumption. If a Bayesianframework is used for the NMA, rank probabilities associated with the alternative treatments can be obtained, whichdirectly support decision-making. In the context of survival analysis multiple treatment effect measures are availableto inform the rank probabilities.
Methods: A fractional polynomial NMA of overall survival in advanced melanoma was performed as an illustrativeexample. Rank probabilities were calculated and presented for the following effect measures: 1) median survival;2) expected survival; 3) mean survival at the follow-up time point of the trial with the shortest follow-up; 4) hazardor hazard ratio over time; 5) cumulative hazard or survival proportions over time; and 6) mean survival at subsequenttime points. The advantages and disadvantages of the alternative measures were discussed.
Results: Since hazard and survival estimates may vary over time for the compared interventions, calculations of rankprobabilities for an NMA of survival curves may depend on the effect measure. With methods 1–3 rank probabilities donot vary over time, which are easier to understand and communicate than rank probabilities that vary over time asobtained with methods 4–6. However, rank probabilities based on methods 4–6 provide useful information regardingthe relative treatment effects over time.
Conclusions: Different approaches to summarize results of a NMA of survival curves with rank probabilities havepros and cons. Rank probabilities of treatment effects over time provide a more transparent and informativeapproach to help guide decision-making than single rank probabilities based on collapsed measures, such asmedian survival or expected survival. Rank probabilities based on survival proportions are the most intuitive andstraightforward to communicate, but alternatives based on the hazard function or mean survival over time mayalso be useful.
Keywords: Network meta-analysis, Rank, Probabilities, Survival
BackgroundRandomized controlled trials (RCTs) are often used toinform healthcare decisions [1-4]. In the absence of ahead-to-head or direct comparison, indirect treatmentcomparisons provide a useful alternative [2,5-9]. An evidencebase that consist of multiple RCTs where each trial has atleast one intervention in common with another can besynthesized by means of a network meta-analysis (NMA).
* Correspondence: [email protected] Group, 33 Bloor Street East, Suite 1300, Toronto M4W 3H1, CanadaFull list of author information is available at the end of the article
© 2013 Cope and Jansen; licensee BioMed CeCreative Commons Attribution License (http:/distribution, and reproduction in any medium
This method provides pooled estimates of available directcomparisons, indirect comparisons of pairwise contrastsfor which no head-to-head RCT is available, and a synthesisof consistent direct and indirect evidence, resulting in moreprecise treatment effect estimates [3,10]. NMAs providea comprehensive synthesis of the evidence from RCTsfor multiple treatments useful for decision-makers toassess whether a new treatment should be adopted orwhether additional evidence is required in the presenceof uncertainty [11].
ntral Ltd. This is an open access article distributed under the terms of the/creativecommons.org/licenses/by/2.0), which permits unrestricted use,, provided the original work is properly cited.
Cope and Jansen BMC Medical Research Methodology 2013, 13:147 Page 2 of 12http://www.biomedcentral.com/1471-2288/13/147
Meta-analyses or NMAs can be performed in a frequen-tist or a Bayesian framework. The result of a frequentistmeta-analysis comparing treatments A and B is an estimateof the treatment effect (i.e. difference between A and B) aswell as an associated p-value. The p-value indicates whetherthe results are statistically ‘significant’ or ‘non-significant’.If results are significant, the probability of erroneouslyrejecting the null hypothesis is judged to be small enoughgiven the observed data. For example, if treatment A isconsidered significantly better than treatment B then thedifference between the treatments is considered extremeenough to suggest that there is only a small probability(<5%) of incorrectly rejecting the null hypothesis. Thereforethe p value reflects the probability of observing such atreatment difference assuming the null hypothesis is true.However, decision-makers are interested in minimizing therisk of an unsupported positive interpretation as well asthe risk of overlooking a true difference. In other words,probabilities associated with the alternative hypothesis (i.e.A is better than B) are of interest but cannot be deducedfrom a frequentist analysis. Moreover, for an analysisof more than two treatments, p values resulting from afrequentist analysis associated with each pairwise com-parison do not provide a straightforward interpretation ofthe relative efficacy or safety of the alternative interventionsfor decision-makers.By using a Bayesian NMA it is possible to calculate the
probability of being the best treatment out of all thosetreatments assessed with respect to the outcome of interest.This approach combines a prior probability distribution(representing a prior belief of the possible values forparameter) with a likelihood distribution of the observedeffect, resulting in a posterior probability distribution [12].With Monte Carlo simulations the probability that atreatment is best is calculated based on the proportion ofcycles during the sampling process where a treatmentranks first of out all the treatments included in termsof the treatment effect size [13]. Similarly, it is possibleto calculate the probability of being the second besttreatment, third best treatment, etc., up until the prob-ability of being worst treatment out of those assessed.These probability statements offer an intuitive summaryof the joint posterior distribution of the effect sizes forall the included treatments, which naturally facilitatesdecision-making [13].Salanti et al. have proposed several methods to present
rank probabilities of treatments. Given the challenge ofefficiently summarizing results from an analysis involvingmultiple pairwise comparisons, probabilities are positionedas a useful alternative to ‘p values’ resulting from afrequentist analysis. The importance of presenting acomplete overview of the probabilities associated with eachranking is emphasized to avoid the over-interpretation ofthe probabilities associated with being the ‘best’ treatment,
which necessitates a more comprehensive approach topresent the information. Therefore, several differentapproaches are proposed by Salanti et al. to summarizethe probabilities in a clear a concise manner. However,all of the methods implicitly assume that the treatmenteffects are constant over time [13].In many RCTs the endpoint of interest is the time to the
occurrence of a certain event, such as time to progression,progression-free survival, or overall survival. The synthesisof published results across different studies by means ofan NMA is typically based on the constant hazard ratio(HR). However, it has been recognized that an NMA thatrelies on the proportional hazards assumption is biasedif the survival curves or hazard functions of competinginterventions cross [14-17]. Recently NMA models forsurvival data have been presented that do not assume aconstant HR but allow the relative treatment effects to varyover time [14-16]. Such analyses can result in time-varyingHRs, survival proportions over time, and expected survivalby treatment. In order to apply the methods proposedby Salanti et al. to these analyses it is important toacknowledge that treatment effects may vary over time.In this paper we discuss alternative approaches to
present rank probabilities in the context of a BayesianNMA of parametric survival curves.
MethodsMotivating exampleEvidence baseAs an illustrative example the efficacy of systemic chemo-therapy for advanced unresectable melanoma was assessedin terms of overall survival. Ten RCTs were included inthe network of evidence (Figure 1) [18-27], which wereidentified with a systematic review of the literature. Thetreatments were categorized as dacarbazine monotherapy(DTIC), DTIC + Interferon (DTIC+ IFN), DTIC + non-IFN,and Non-DTIC. Although the most recent treatmentsare not included, the analysis provides a useful examplein oncology, where parametric survival analyses are oftenutilized.
Network meta-analysisThe available survival data of the different studies wascombined by means of a Bayesian NMA of parametricsurvival curves with models proposed by Jansen 2011[15]. With this approach the survival of patients in a trialfor the interventions being compared are modeled overtime with parametric survival functions and the differencein the shape and scale parameters of these functionsbetween interventions are synthesized and indirectlycompared across trials. Within the Bayesian framework,analyses consist of data, likelihood, parameters, and amodel. The data was extracted from the included RCTs,where for each arm the reported Kaplan Meier curves
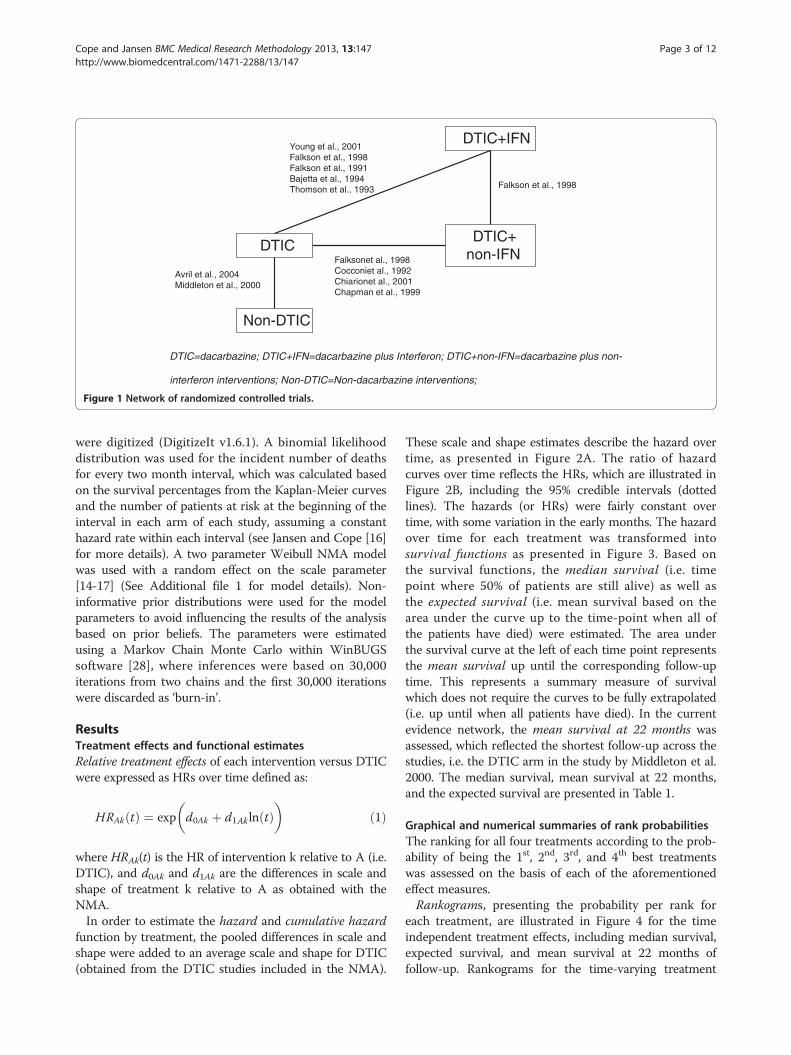
DTIC=dacarbazine; DTIC+IFN=dacarbazine plus Interferon; DTIC+non-IFN=dacarbazine plus non-
interferon interventions; Non-DTIC=Non-dacarbazine interventions;
DTIC
DTIC+IFN
DTIC+non-IFN
Non-DTIC
Falkson et al., 1998
Young et al., 2001Falkson et al., 1998Falkson et al., 1991Bajetta et al., 1994Thomson et al., 1993
Falksonet al., 1998Cocconiet al., 1992Chiarionet al., 2001Chapman et al., 1999
Avril et al., 2004Middleton et al., 2000
Figure 1 Network of randomized controlled trials.
Cope and Jansen BMC Medical Research Methodology 2013, 13:147 Page 3 of 12http://www.biomedcentral.com/1471-2288/13/147
were digitized (DigitizeIt v1.6.1). A binomial likelihooddistribution was used for the incident number of deathsfor every two month interval, which was calculated basedon the survival percentages from the Kaplan-Meier curvesand the number of patients at risk at the beginning of theinterval in each arm of each study, assuming a constanthazard rate within each interval (see Jansen and Cope [16]for more details). A two parameter Weibull NMA modelwas used with a random effect on the scale parameter[14-17] (See Additional file 1 for model details). Non-informative prior distributions were used for the modelparameters to avoid influencing the results of the analysisbased on prior beliefs. The parameters were estimatedusing a Markov Chain Monte Carlo within WinBUGSsoftware [28], where inferences were based on 30,000iterations from two chains and the first 30,000 iterationswere discarded as ‘burn-in’.
ResultsTreatment effects and functional estimatesRelative treatment effects of each intervention versus DTICwere expressed as HRs over time defined as:
HRAk tð Þ ¼ exp
�d0Ak þ d1Ak ln tð Þ
�ð1Þ
where HRAk(t) is the HR of intervention k relative to A (i.e.DTIC), and d0Ak and d1Ak are the differences in scale andshape of treatment k relative to A as obtained with theNMA.In order to estimate the hazard and cumulative hazard
function by treatment, the pooled differences in scale andshape were added to an average scale and shape for DTIC(obtained from the DTIC studies included in the NMA).
These scale and shape estimates describe the hazard overtime, as presented in Figure 2A. The ratio of hazardcurves over time reflects the HRs, which are illustrated inFigure 2B, including the 95% credible intervals (dottedlines). The hazards (or HRs) were fairly constant overtime, with some variation in the early months. The hazardover time for each treatment was transformed intosurvival functions as presented in Figure 3. Based onthe survival functions, the median survival (i.e. timepoint where 50% of patients are still alive) as well asthe expected survival (i.e. mean survival based on thearea under the curve up to the time-point when all ofthe patients have died) were estimated. The area underthe survival curve at the left of each time point representsthe mean survival up until the corresponding follow-uptime. This represents a summary measure of survivalwhich does not require the curves to be fully extrapolated(i.e. up until when all patients have died). In the currentevidence network, the mean survival at 22 months wasassessed, which reflected the shortest follow-up across thestudies, i.e. the DTIC arm in the study by Middleton et al.2000. The median survival, mean survival at 22 months,and the expected survival are presented in Table 1.
Graphical and numerical summaries of rank probabilitiesThe ranking for all four treatments according to the prob-ability of being the 1st, 2nd, 3rd, and 4th best treatmentswas assessed on the basis of each of the aforementionedeffect measures.Rankograms, presenting the probability per rank for
each treatment, are illustrated in Figure 4 for the timeindependent treatment effects, including median survival,expected survival, and mean survival at 22 months offollow-up. Rankograms for the time-varying treatment

A
B
0.00
0.01
0.02
0.03
0.04
0.05
0.06
0.07
0.08
0 10 20 30 40 50 60 70 80 90 100
Haz
ard
Time (months)
DTIC
DTIC + IFN
DTIC + non-IFN
Non-DTIC
0.0
0.5
1.0
1.5
2.0
2.5
3.0
0 10 20 30 40 50 60 70 80 90 100
Haz
ard
Rat
io v
s. D
TIC
Time (months)
DTIC + IFN
DTIC + non-IFN
Non-DTIC
Figure 2 Hazard for each treatment over time (A), and Hazard ratio for each treatment versus DTIC over time (B).
Cope and Jansen BMC Medical Research Methodology 2013, 13:147 Page 4 of 12http://www.biomedcentral.com/1471-2288/13/147
effects are presented in Figure 5, corresponding to thehazard (ratio), survival proportions, and mean survival.The rankograms for the time-independent measures
were fairly similar with some minor differences, suggestingDTIC + non-IFN and non-DTIC tended to have the highestprobabilities of being the best and second best treatments.DTIC generally had the highest probability of being thirdbest, and DTIC + IFN usually had the highest probabilityof being the worst. The rankograms for median survival
(Figure 4A) and expected survival (Figure 4B) were mostlycomparable (with a slight tradeoff between treatmentranks 3 and 4 for DTIC and DTIC + IFN), whereas therankogram based on the mean survival at 22 months(Figure 4C) differed because the survival curvescrossed at about 17 months for non-DTIC and DTIC +non-IFN.The time-dependent measures were generally comparable
and similar to the time-independent measures, indicating

0%
10%
20%
30%
40%
50%
60%
70%
80%
90%
100%
0 10 20 30 40 50 60 70 80 90 100
S(t
)
Time (months)
DTIC Median= 7.8 months
DTIC+IFN Median= 7.9 months
DTIC+Non-IFN Median= 9.9 months
Non-DTIC Median= 10.2 months
Median survival
Expected survival (area under survival curve)
Mean survival (area under survival curve) up until 22 months
Figure 3 Survival proportions for each treatment over time.
Cope and Jansen BMC Medical Research Methodology 2013, 13:147 Page 5 of 12http://www.biomedcentral.com/1471-2288/13/147
that DTIC + non-IFN and non-DTIC were the best treat-ments, followed by DTIC and DTIC + IFN. Variationin the hazard in the initial period is most obvious inFigure 5A, where the probability of being the best treat-ment is based on the HR. This indicates that non-DTIC isthe best treatment for the first 5 months, after which timeDTIC + non-IFN is the best treatment. The rankogramsbased on the survival proportions (Figure 5B) were similarto those based on the hazards, although the decrease inthe probability of DTIC + IFN being the best (and secondbest) was less dramatic with the former. Rankogramsbased on the mean survival over time were also similarto those based on HRs and survival proportions, whereresults for DTIC differed the most which remained moreconsistent over time with respect to the probability of bestand second best. Similarly rankograms for non-DTIC basedon the mean survival were less sensitive to differencesover time.Another measure to summarize probabilities proposed
by Salanti et al. [13] is the surface under the cumulativeranking curve (SUCRA), which provides a summary statis-tic for the cumulative ranking. SUCRA ranges from 0 to 1,where 1 reflects the best treatment with no uncertaintyand 0 reflects the worst treatment with no uncertainty.
Table 1 Overview of time-independent summary measures
Outcome DTIC
Median survival 7.85
Expected survival (after all patients died)and 95% credible interval
12.61 (11.31, 14.13)
Mean survival at 22 months and95% credible interval
9.84 (9.13, 10.60)
SUCRA for treatment k out of competing interventions acan be expressed as follows based on a vector of cumulativeprobability cumk,b to be among b best treatments:
SUCRAk ¼
Xa−1
b¼1
cumk;b
a−1ð2Þ
SUCRA was assessed for all effect measures for eachtreatment. In order to emphasize the importance ofassessing SUCRA, probabilities of being the best treat-ment are compared to the SUCRA scores. Figures 6 and 7present the probability that each treatment is best as wellas SUCRA for the time-independent and time-dependentmeasures.Figure 6 illustrates that the pattern associated with the
probability of being the best treatment is fairly consistentwith the results for SUCRA for the time independentmeasures. However, for non-DTIC, the probability ofbeing best is lower than SUCRA for the mean at 22 monthsrelative to the median and expected mean because SUCRAaccounted for the higher probability of non-DTIC beingthe second best treatment. Generally, the differencebetween DTIC and DTIC + IFN was less pronounced for
DTIC + IFN DTIC + non-IFN Non-DTIC
7.87 9.88 10.19
11.41 (8.44, 15.48) 16.11 (11.21, 23.14) 15.31 (9.17, 24.34)
9.61 (7.66, 11.72) 11.15 (8.88, 13.33) 11.23 (8.05, 13.99)

A
B
C
0%
10%
20%
30%
40%
50%
60%
70%
80%
90%
100%
1 2 3 4
Pro
bab
ility
Rank
DTIC
DTIC + IFN
DTIC + non-IFN
non-DTIC
0%
10%
20%
30%
40%
50%
60%
70%
80%
90%
100%
1 2 3 4
Pro
bab
ility
Rank
DTIC
DTIC + IFN
DTIC + non-IFN
non-DTIC
0%
10%
20%
30%
40%
50%
60%
70%
80%
90%
100%
1 2 3 4
Pro
bab
ility
Rank
DTIC
DTIC + IFN
DTIC + non-IFN
non-DTIC
Figure 4 Rankograms: Probability plots for competing interventions based on median survival (A), expected survival (B), and meansurvival at 22 months (C).
Cope and Jansen BMC Medical Research Methodology 2013, 13:147 Page 6 of 12http://www.biomedcentral.com/1471-2288/13/147
the probability of being the best treatment than forSUCRA, whereas the difference between DTIC + non-IFNand non-DTIC was more pronounced for the probabilityof being the best than for SUCRA.The overall pattern for the probability of being the best
treatment and SUCRA are similar for the time-independent
and time-varying outcomes (Figure 7), although there weresome differences depending on the specific time-varyingmeasure. For example, differences between the probabilityof being the best treatment and SUCRA for DTIC + non-IFN and non-DTIC were greatest when based on theHRs and smallest when based on the mean survival.

A
0%
10%
20%
30%
40%
50%
60%
70%
80%
90%
100%
1 2 3 4
Pro
bab
ility
Rank
DTIC
Month 100
Month 75
Month 50
Month 25
Month 15
Month 10
Month 5
Month 3
Month 1
0%
10%
20%
30%
40%
50%
60%
70%
80%
90%
100%
1 2 3 4
Pro
bab
ility
Rank
DTIC+IFN
Month 100
Month 75
Month 50
Month 25
Month 15
Month 10
Month 5
Month 3
Month 1
0%
10%
20%
30%
40%
50%
60%
70%
80%
90%
100%
1 2 3 4
Pro
bab
ility
Rank
DTIC+non-IFN
Month 100
Month 75
Month 50
Month 25
Month 15
Month 10
Month 5
Month 3
Month 1
0%
10%
20%
30%
40%
50%
60%
70%
80%
90%
100%
1 2 3 4
Pro
bab
ility
Rank
Non-DTIC
Month 100
Month 75
Month 50
Month 25
Month 15
Month 10
Month 5
Month 3
Month 1
B
0%
10%
20%
30%
40%
50%
60%
70%
80%
90%
100%
1 2 3 4
Pro
bab
ility
Rank
DTIC
Month 100
Month 75
Month 50
Month 25
Month 15
Month 10
Month 5
Month 3
Month 1
0%
10%
20%
30%
40%
50%
60%
70%
80%
90%
100%
1 2 3 4
Pro
bab
ility
Rank
DTIC+IFN
Month 100
Month 75
Month 50
Month 25
Month 15
Month 10
Month 5
Month 3
Month 1
0%
10%
20%
30%
40%
50%
60%
70%
80%
90%
100%
1 2 3 4
Pro
bab
ility
Rank
DTIC+non-IFN
Month 100
Month 75
Month 50
Month 25
Month 15
Month 10
Month 5
Month 3
Month 1
0%
10%
20%
30%
40%
50%
60%
70%
80%
90%
100%
1 2 3 4
Pro
bab
ility
Rank
Non-DTIC
Month 100
Month 75
Month 50
Month 25
Month 15
Month 10
Month 5
Month 3
Month 1
C
0%
10%
20%
30%
40%
50%
60%
70%
80%
90%
100%
1 2 3 4
Pro
bab
ility
Rank
DTIC
Month 100
Month 75
Month 50
Month 25
Month 15
Month 10
Month 5
Month 3
Month 1
0%
10%
20%
30%
40%
50%
60%
70%
80%
90%
100%
1 2 3 4
Pro
bab
ility
Rank
DTIC+IFN
Month 100
Month 75
Month 50
Month 25
Month 15
Month 10
Month 5
Month 3
Month 1
0%
10%
20%
30%
40%
50%
60%
70%
80%
90%
100%
1 2 3 4
Pro
bab
ility
Rank
DTIC+non-IFN
Month 100
Month 75
Month 50
Month 25
Month 15
Month 10
Month 5
Month 3
Month 1
0%
10%
20%
30%
40%
50%
60%
70%
80%
90%
100%
1 2 3 4
Pro
bab
ility
Rank
Non-DTIC
Month 100
Month 75
Month 50
Month 25
Month 15
Month 10
Month 5
Month 3
Month 1
Figure 5 Probability plots for competing interventions based on hazard (ratio) over time (A), survival proportions over time (B), andmean survival over time (C).
Cope and Jansen BMC Medical Research Methodology 2013, 13:147 Page 7 of 12http://www.biomedcentral.com/1471-2288/13/147

0%10%20%30%40%50%60%70%80%90%
100%M
edia
n su
rviv
al
Exp
ecte
d su
rviv
al
Mea
n su
rival
at 2
2m
Med
ian
surv
ival
Exp
ecte
d su
rviv
al
Mea
n su
rival
at 2
2m
Med
ian
surv
ival
Exp
ecte
d su
rviv
al
Mea
n su
rival
at 2
2m
Med
ian
surv
ival
Exp
ecte
d su
rviv
al
Mea
n su
rival
at 2
2m
Med
ian
surv
ival
Exp
ecte
d su
rviv
al
Mea
n su
rival
at 2
2m
Med
ian
surv
ival
Exp
ecte
d su
rviv
al
Mea
n su
rival
at 2
2m
Med
ian
surv
ival
Exp
ecte
d su
rviv
al
Mea
n su
rival
at 2
2m
Med
ian
surv
ival
Exp
ecte
d su
rviv
al
Mea
n su
rival
at 2
2m
DTIC DTIC+IFN DTIC+non-IFN Non-IFN
Solid=Probability of treatment being the best; Diagonal lines= SUCRAFigure 6 Probability of being the best treatment and SUCRA for median survival, expected survival, and mean survival at 22 months.
Cope and Jansen BMC Medical Research Methodology 2013, 13:147 Page 8 of 12http://www.biomedcentral.com/1471-2288/13/147
Additionally, the initial period where non-DTIC isexpected to be the best treatment is shortest whenbased on the HR, longer when based on the survivalfunction, and longest when based on the mean survival(up until almost 30 months). A unique feature of therankograms based on survival is that the point at whichthe probability of being the best treatment switchesfrom non-DTIC to DTIC + non-IFN is also the timepoint when the survival curves cross. As with thetime-independent measures, for all three time-dependentmeasures the probability of being the best treatmentsuggests that DTIC and DTIC + IFN are comparableand reflect the two worst treatments, whereas DTIC +non-IFN appear to be better than non-DTIC. By evalu-ating SUCRA it is possible to differentiate DTIC andDTIC + IFN, where a majority of the time points sug-gest DTIC had a higher proportion than DTIC + IFN.Moreover, differences between DTIC + non-IFN andnon-DTIC are less dramatic for SUCRA (as opposed tothe probability of being the best treatment), particularlyfor mean survival. Overall, SUCRA results may raisequestions about the additional efficacy of IFN in combin-ation with DTIC as opposed to DITC alone.
DiscussionAdvantages and disadvantages of different effectmeasures in relation to treatment rankingTable 2 outlines the previously described alternative effectmeasures resulting from a NMA of survival data involvinga multi-dimensional treatment effect. While these measuresare all related and based on the same analysis, each meas-ure involves a different interpretation and slightly differentrank probabilities. Therefore, it is necessary to considerthe advantages and disadvantages associated with eachmeasure to calculate the rank probabilities.
Time independent measures: median survival, expectedsurvival, or mean survival at a specific time point?Median survival provides an intuitive outcome for clini-cians, which can easily be compared across treatmentsand is not very sensitive to parametric modeling assump-tions. However, the median survival does not capturesurvival information beyond the time point at which 50%of patients have died, thereby providing a limited effectmeasure to rank treatments.Expected survival is the primary measure of interest for
cost-effectiveness evaluations involving survival, although

A
B
C
0%
10%
20%
30%
40%
50%
60%
70%
80%
90%
100%
0 10 20 30 40 50 60 70 80 90 100
SU
CR
A o
r p
(bes
t)
Time (months)
SUCRA- DTIC
SUCRA- DTIC+IFN
SUCRA- DTIC+non-IFN
SUCRA- Non-DTIC
P(best)- DTIC
P(best)- DTIC+IFN
P(best)- DTIC+non-IFN
P(best)- Non-DTIC
0%
10%
20%
30%
40%
50%
60%
70%
80%
90%
100%
0 10 20 30 40 50 60 70 80 90 100
SU
CR
A o
r p
(bes
t)
Time (months)
SUCRA- DTIC
SUCRA- DTIC+IFN
SUCRA- DTIC+non-IFN
SUCRA- Non-DTIC
P(best)- DTIC
P(best)- DTIC+IFN
P(best)- DTIC+non-IFN
P(best)- Non-DTIC
0%
10%
20%
30%
40%
50%
60%
70%
80%
90%
100%
0 10 20 30 40 50 60 70 80 90 100
SU
CR
A o
r p
(bes
t)
Time (months)
SUCRA- DTIC
SUCRA- DTIC+IFN
SUCRA- DTIC+non-IFN
SUCRA- Non-DTIC
P(best)- DTIC
P(best)- DTIC+IFN
P(best)- DTIC+non-IFN
P(best)- Non-DTIC
Figure 7 Probability of being best treatment and SUCRA for the hazard (ratio) over time (A), survival proportions over time (B), andmean survival at subsequent time points (C).
Cope and Jansen BMC Medical Research Methodology 2013, 13:147 Page 9 of 12http://www.biomedcentral.com/1471-2288/13/147
this measure may require extrapolation of survival pro-portions beyond the follow-up of the included studies.Consequently, rank probabilities base on the expected
survival may often rely on extrapolation, possibly to a dif-ferent extent for each treatment. Also, althoug the estimatesfrom a parametric model will reflect this uncertainty, the
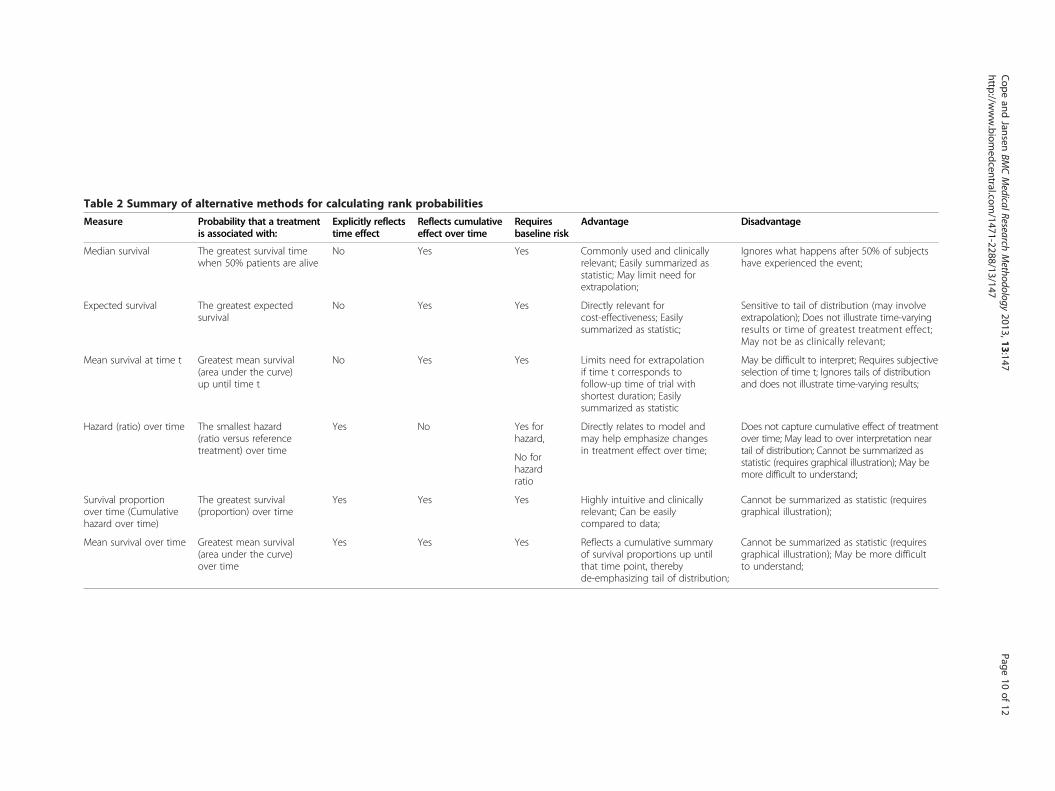
Table 2 Summary of alternative methods for calculating rank probabilities
Measure Probability that a treatmentis associated with:
Explicitly reflectstime effect
Reflects cumulativeeffect over time
Requiresbaseline risk
Advantage Disadvantage
Median survival The greatest survival timewhen 50% patients are alive
No Yes Yes Commonly used and clinicallyrelevant; Easily summarized asstatistic; May limit need forextrapolation;
Ignores what happens after 50% of subjectshave experienced the event;
Expected survival The greatest expectedsurvival
No Yes Yes Directly relevant forcost-effectiveness; Easilysummarized as statistic;
Sensitive to tail of distribution (may involveextrapolation); Does not illustrate time-varyingresults or time of greatest treatment effect;May not be as clinically relevant;
Mean survival at time t Greatest mean survival(area under the curve)up until time t
No Yes Yes Limits need for extrapolationif time t corresponds tofollow-up time of trial withshortest duration; Easilysummarized as statistic
May be difficult to interpret; Requires subjectiveselection of time t; Ignores tails of distributionand does not illustrate time-varying results;
Hazard (ratio) over time The smallest hazard(ratio versus referencetreatment) over time
Yes No Yes forhazard,
Directly relates to model andmay help emphasize changesin treatment effect over time;
Does not capture cumulative effect of treatmentover time; May lead to over interpretation neartail of distribution; Cannot be summarized asstatistic (requires graphical illustration); May bemore difficult to understand;
No forhazardratio
Survival proportionover time (Cumulativehazard over time)
The greatest survival(proportion) over time
Yes Yes Yes Highly intuitive and clinicallyrelevant; Can be easilycompared to data;
Cannot be summarized as statistic (requiresgraphical illustration);
Mean survival over time Greatest mean survival(area under the curve)over time
Yes Yes Yes Reflects a cumulative summaryof survival proportions up untilthat time point, therebyde-emphasizing tail of distribution;
Cannot be summarized as statistic (requiresgraphical illustration); May be more difficultto understand;
Cope
andJansen
BMCMedicalResearch
Methodology
2013,13:147Page
10of
12http://w
ww.biom
edcentral.com/1471-2288/13/147

Cope and Jansen BMC Medical Research Methodology 2013, 13:147 Page 11 of 12http://www.biomedcentral.com/1471-2288/13/147
structural uncertainty regarding the choice of the under-lying distribution is not captured, which is an importantconsideration [29].Rank probabilities based on the mean survival at a
specific time point, such as the duration of the trial withthe shortest follow-up, may avoid extrapolation. Thereforethis summary measure may be less sensitive to theassumptions of extrapolation, although a subjective choiceregarding the time point for analysis is required, whichleaves it open to criticism.Overall, a summary measure such as the median survival,
expected survival, or mean survival at a specific follow-uptime has the advantage of providing a simple statisticthat does not require graphical presentation over time.Consequently, rank probabilities based on these effectmeasures are therefore easier to interpret and compareacross different analyses than time-varying effect measures.However, the rank probabilities associated with the onedimensional effect measures do not capture the possibletime-varying nature of the underlying hazard of dying andare sensitive to the choice of effect measure.
Time-varying measures: hazard, survival, or meansurvival over time?Rank probabilities based on the hazard or HR at each timepoint reflect the treatment ranking at each time pointindependent of previous time points. Presenting the hazardor HR over time illustrates how treatment effects may varyover time, which may not be easily detected based on thecorresponding survival curves. However, HR curves maynot be straightforward to interpret and later time pointsmay be less relevant due to the small proportion of subjectsthat remain at risk of dying.Rank probabilities based on the survival proportions
reflect the cumulative treatment effect of the hazard upto that point in time. Survival curves can be considered themost complete and intuitive representation of treatmenteffects over time. Presenting survival proportions alsoallows the results of the meta-analysis to be compared tothe observed survival curves reported for the individualstudies. Therefore, rank probabilities presented over timebased on survival curves may provide the simplest inter-pretation and the most ‘face validity’ as compared tothose based on the hazards or HRs over time, especiallyconsidering that decision-makers are likely to be mostlyconcerned with actual survival over time, as opposed tothe risk of dying at each time point.Mean survival at subsequent time points may provide
another measure with value as well for treatment rankings.By evaluating the area under the curve up to each timepoint, as opposed to the actual survival percentages, moreweight is attributed to earlier treatment effects when agreater proportion of patients are still alive. If twotreatments cross, the treatment with the more favorable
survival in the beginning will result in a longer period ofbeing the best treatment if the mean survival is used incomparison to the survival proportions or the HRs. Em-phasizing the early treatment effects (and de-emphasizinglater ones) may be considered useful given the increasinguncertainty in treatment effects over time due to reducedpopulation at risk and the possible extrapolation ofsurvival curves.Overall, rank probabilities of treatment effects over time
may provide a more transparent and informative approachto help guide decision-making in comparison to singlerank probabilities based on collapsed measures, such asmedian survival, or expected survival. Rank probabilitiesbased on survival proportions may be the most intuitiveand straightforward to communicate, but alternatives basedon the hazard function or mean survival over time may beuseful as well.
Probability of being best treatment, rankograms, or SUCRA?Summarizing treatment effects and their associateduncertainty in terms of the probability that each treatmentis best is often presented, although when there is con-siderable variation in the uncertainty regarding the relativetreatment effects, this approach may lead to false con-clusions. Rankograms provide the most informative andbalanced approach to translate treatment effects andtheir associated uncertainty into probability statementsfor decision-making by presenting the probability thateach treatment is best, 2nd best, 3rd best, etc. However,rankograms become more difficult to interpret for time-varying treatment effects as compared to one-dimensionaleffect measures. In the context of time-varying treatmenteffects, graphing SUCRA may provide a more concisesummary measure than presenting all rank probabilities.
ConclusionIn this paper we present different alternatives for quantita-tive summaries of treatment effect estimates obtained withNMA of survival data to help inform decision-making.Rank probabilities based on one-dimensional measuressuch as median survival, expected survival, or mean survivalat one follow-up time are relatively easy to understand,but do not provide the wealth of information captured byrank probabilities over time. Survival proportions reflectthe cumulative effect of treatments over time and providethe most intuitive basis for rank probabilities and SUCRA.Rank probabilities based on the hazard (ratio) functionover time provide information on the treatment effect ateach time point, ignoring effects at previous time points.Rank probabilities based on the mean survival at eachtime point give more weight to the treatment effects whena greater proportion of patients are alive. Rankograms oftime-varying treatment effects can be presented efficientlywith SUCRA.

Cope and Jansen BMC Medical Research Methodology 2013, 13:147 Page 12 of 12http://www.biomedcentral.com/1471-2288/13/147
Additional file
Additional file 1: Appendix. Random effects first order fractionalpolynomial network meta-analysis model for survival curves.
Competing interestsThe authors declare that they have no competing interests.
Authors’ contributionsSC and JJ conceived of the study. SC performed the statistical analysis anddrafted the manuscript. JJ participated in the study design and helped todraft the manuscript. All authors read and approved the final manuscript.
AcknowledgementsThe research was performed without specific funding.
Author details1Mapi Group, 33 Bloor Street East, Suite 1300, Toronto M4W 3H1, Canada.2Tufts University School of Medicine, Boston, MA, USA.
Received: 4 July 2013 Accepted: 12 November 2013Published: 1 December 2013
References1. Dias S, Sutton AJ, Ades AE, Welton NJ: Evidence synthesis for decision
making 2: a generalized linear modeling framework for pairwise andnetwork meta-analysis of randomized controlled trials. Med Decis Making2013, 33(5):607–617.
2. Glenny AM, Altman DG, Song F, et al: Indirect comparisons of competinginterventions. Health Technol Assess 2005, 9:1–134.
3. Jansen JP, Fleurence R, Devine B, et al: Interpreting indirect treatmentcomparisons & network meta-analysis for health care decision-making:report of the ISPOR task force on indirect treatment comparisons goodresearch practices—part 1. Value Health 2011, 14:417–428.
4. Song F, Altman DG, Glenny A, Deeks JJ: Validity of indirect comparison forestimating efficacy of competing interventions: empirical evidence frompublished meta-analyses. BMJ 2003, 326:472.
5. Caldwell DM, Ades AE, Higgins JPT: Simultaneous comparison of multipletreatments: combining direct and indirect evidence. BMJ 2005,331:897–900.
6. Sutton A, Ades AE, Cooper N, Abrams K: Use of indirect and mixedtreatment comparisons for technology assessment. Pharmacoeconomics2008, 26:753–767.
7. National Institute for Health and Clinical Excellence: Guide to the Methods ofTechnology Appraisal. London: NICE; 2008.
8. Pharmaceutical Benefits Advisory Committee: Guidelines for preparingsubmissions to the Pharmaceutical Benefits Advisory committee. (Version 4.3).Canberra: Australian Government, Department of Health and Ageing; 2008.
9. Wells GA, Sultan SA, Chen L, Khan M, Coyle D: Indirect Evidence: IndirectTreatment Comparisons in Meta-Analysis. Ottawa: Canadian Agency for Drugsand Technologies in Health; 2009.
10. Lu G, Ades AE: Combination of direct and indirect evidence in mixedtreatment comparisons. Stat Med 2004, 23:3105–3124.
11. Sculpher M, Claxton K, Drummon M, McCabe C: Whither trial-basedeconomic evaluation for health care decision-making? Health Econ 2006,15(7):677–687.
12. Jansen JP, Crawford B, Bergman G, Stam W: Bayesian meta-analysis ofmultiple treatment comparisons: an introduction to mixed treatmentcomparisons. Value Health 2008, 11(5):956–964.
13. Salanti G, Ades AE, Ioannidis JPA: Graphical methods and numericsummaries for presenting results for multiple-treatment meta-analysis:an overview and tutorial. J Clin Epidemiol 2011, 64(2):163–171.
14. Ouwens MJNM, Philips Z, Jansen JP: Network meta-analysis of parametricsurvival curves. Res Synth Methods 2010, 1(3–4):258–271.
15. Jansen JP: Network meta-analysis of survival data with fractional polynomials.BMC Med Res Methodol 2011, 11:61.
16. Jansen JP, Cope S: Meta-regression models to address heterogeneity andinconsistency in network meta-analysis of survival outcomes.BMC Med Res Methodol 2012, 12:152. doi:10.1186/1471-2288-12-152.
17. Latimer NR: Survival analysis for economic evaluations alongside clinicaltrials- extrapolation with individual patient-level data. Med Decis Making2013, 33(5). doi:10.1177/0272989X12472398.
18. Avril MF, Aamdal S, Grob JJ, Hauschild A, Mohr P, Bonerandi JJ, et al:Fotemustine compared with dacarbazine in patients with disseminatedmalignant melanoma: a phase III study. J Clin Oncol 2004, 22(6):1118–1125.
19. Bajetta E, Di Leo A, Zampino MG, Sertoli MR, Comella G, Barduagni M, et al:Multicenter randomized trial of dacarbazine alone or in combinationwith two different doses and schedules of interferon alfa-2a in thetreatment of advanced melanoma. J Clin Oncol 1994, 12:806–811.
20. Chapman PB, Einhorn LH, Meyers ML, Saxman S, Destro AN, Panageas KS,et al: Phase III multicenter randomized trial of the dartmouth regimenversus dacarbazine in patients with metastatic melanoma. J Clin Oncol1999, 17:2745–2751.
21. Chiarion SV, Nortilli R, Aversa SM, Paccagnella A, Medici M, Corti L, et al:Phase II randomized study of dacarbazine, carmustine, cisplatin andtamoxifen versus dacarbazine alone in advanced melanoma patients.Melanoma Res 2001, 11(2):189–196.
22. Cocconi G, Bella M, Calabresi F, Tonato M, Canaletti R, Boni C, et al:Treatment of metastatic malignant melanoma with dacarbazine plustamoxifen. New Engl J Med 1992, 327:516–523.
23. Falkson CI, Ibrahim J, Kirkwood JM, Coates AS, Atkins MB, Blum RH: Phase IIItrial of dacarbazine versus dacarbazine with interferon alpha-2b versusdacarbazine with tamoxifen versus dacarbazine with interferon alpha-2band tamoxifen in patients with metastatic malignant melanoma: an easterncooperative oncology group study. J Clin Oncol 1998, 16:1743–1751.
24. Falkson CI, Falkson G, Falkson HC: Improved results with the addition ofinterferon alfa-2b to dacarbazine in the treatment of patients withmetastatic malignant melanoma. J Clin Oncol 1991, 9:1403–1408.
25. Middleton MR, Grob JJ, Aaronson N, Fierlbeck G, Tilgen W, Seiter S, et al:Randomized phase III study of temozolomide versus dacarbazine in thetreatment of patients with advanced metastatic malignant melanoma.J Clin Oncol 2000, 18:158–166.
26. Thomson DB, Adena M, McLeod GR, Hersey P, Gill PG, Coates AS, et al:Interferon-alpha 2a does not improve response or survival whencombined with dacarbazine in metastatic malignant melanoma: resultsof a multi-institutional Australian randomized trial. Melanoma Res 1993,3:133–138.
27. Young AM, Marsden J, Goodman A, Burton A, Dunn JA: Prospectiverandomized comparison of dacarbazine (DTIC) versus DTIC plusinterferon-alpha (IFN-alpha) in metastatic melanoma. Clin Oncol 2001,13:458–465.
28. Spiegelhalter D, Thomas A, Best N, Lunn D: WinBUGS User Manual: Version1.4. Cambridge: MRC Biostatistics Unit; 2003.
29. Cope S, Ouwens MJNM, Jansen JP, Schmid P: Progression-free survival withFulvestrant 500 mg and alternative endocrine therapies as second-linetreatment for advanced breast cancer: a network meta-analysis withparametric survival models. Value Health 2013, 16(2):403–417.
doi:10.1186/1471-2288-13-147Cite this article as: Cope and Jansen: Quantitative summaries oftreatment effect estimates obtained with network meta-analysis ofsurvival curves to inform decision-making. BMC Medical ResearchMethodology 2013 13:147.
Submit your next manuscript to BioMed Centraland take full advantage of:
• Convenient online submission
• Thorough peer review
• No space constraints or color figure charges
• Immediate publication on acceptance
• Inclusion in PubMed, CAS, Scopus and Google Scholar
• Research which is freely available for redistribution
Submit your manuscript at www.biomedcentral.com/submit