quantitative trait loci for resistance to fusarium head ... · jordan e. ullrich abstract ... i...
TRANSCRIPT
Quantitative Trait Loci for Resistance to Fusarium Head Blight in the Hulless Winter
Barley Cultivar Eve
Jordan Elizabeth Ullrich
Thesis submitted to the faculty of the Virginia Polytechnic Institute and State University
in partial fulfillment of the requirements for the degree of
Master of Science
In
Crop and Soil Environmental Sciences
Carl A. Griffey
David G. Schmale, III
Jason A. Holliday
April 25th, 2017
Blacksburg, VA
Keywords: Hordeum vulgare, barley, Fusarium head blight, Fusarium graminerarum
Schwabe, marker assisted selection, QTL, Quantitative resistance
Copyright © 2017 Jordan E. Ullrich

Quantitative Trait Loci for Resistance to Fusarium Head Blight in the Hulless Winter Barley
Cultivar Eve
Jordan E. Ullrich
ABSTRACT
Fusarium head blight (FHB), caused by Fusarium graminearum Schwabe, is a devastating fungal
disease that affects barley production worldwide through damaged kernels, low yields, and
production of mycotoxins. The most effective means of control is through the use of FHB
resistant cultivars that are developed through gene pyramiding and incorporation of various
sources of resistance. Resistance identified in winter barley cultivar Eve has been identified in
Virginia Tech’s Small Grains Breeding Program. The objectives of this study are to validate
resistance and identify additional resistance QTL, and identify tightly linked and diagnostic
markers for use in MAS programs. A population of F5:7 RILs derived from the cross Eve/
‘Doyce’ were evaluated for FHB resistance. FHB incidence (Inc), FHB severity (Sev), Fusarium
damaged kernels (FDK), and deoxynivalenol (DON) were assessed over 2014-15 and 2015-16 at
Blacksburg, VA, Mount Holly, VA, Kinston, NC, and Lexington, KY. A QTL on chromosome
6H associated with FHB Sev, FDK, and DON was identified. The QTL accounted for as high as
14.5% of the phenotypic variation for DON accumulation, 8.3% for FHB Sev, and 11.87% to
17.63% for FDK. The QTL marker region spans 56.5 to 66.6 cM with flanking markers
SCRI_RS_147342 and Bmag0613. QTL for morphological traits, heading date and height, were
found in the same region as the FHB resistance traits. Diagnostic SNP makers associated with
the FHB resistance QTL identified can be used for FHB resistance identification in MAS
breeding programs to incorporate and pyramid resistance QTL and genes into other plant
material.

Quantitative Trait Loci for Resistance to Fusarium Head Blight in the Hulless Winter Barley
Cultivar Eve
Jordan E. Ullrich
ABSTRACT
Fusarium head blight (FHB), caused by Fusarium graminearum Schwabe, is a devastating fungal
disease that affects barley production worldwide through damaged kernels, low yields, and
production of mycotoxins. The most effective means of control is through the use of FHB
resistant varieties that are developed through gene pyramiding and incorporation of various
sources of resistance. Resistance identified in winter barley cultivar Eve has been identified in
Virginia Tech’s Small Grains Breeding Program. The objectives of this study are to validate
resistance and identify additional resistance gene regions, and identify tightly linked and
diagnostic DNA markers for use in breeding programs. A population individuals derived from
the cross Eve/ ‘Doyce’ were evaluated for FHB resistance. FHB incidence (Inc), FHB severity
(Sev), Fusarium damaged kernels (FDK), and deoxynivalenol (DON) were assessed over 2014-
15 and 2015-16 at Blacksburg, VA, Mount Holly, VA, Kinston, NC, and Lexington, KY. A gene
region on chromosome 6H associated with FHB Sev, FDK, and DON was identified. The region
accounted for high variation in DON accumulation, FHB Sev, and FDK. The molecular marker
region spans 56.5 to 66.6 cM with flanking markers SCRI_RS_147342 and Bmag0613. The
physical traits, heading date and height, were found in the same gene region as the FHB
resistance traits. Diagnostic DNA makers associated with the FHB resistance genes identified
can be used for FHB resistance identification in breeding programs to incorporate and pyramid
resistance genes into other plant material.

iv
DEDICATION
This master’s thesis is dedicated to my parents, Brian and Carla Ullrich, as well to my younger
sister, Mallory. Without their love and support over the years, I would not have been able pursue
and achieve my goals. They have always been my biggest supporters in everything I strived for
and I would not be the person I am today without them.

v
ACKNOWLEDGEMENTS
I would first like to thank Dr. Carl Griffey, my advisor, for allowing me to join the Small
Grain’s Breeding program here at Virginia Tech, as a graduate student. From providing advice
and guidance in the field to endless edits on papers, proposals, and posters, Dr. Griffey has
always there to assist and ensure that I was able to succeed in my research to the best of my
ability, even under the worst circumstances. Without his patience and support, my research
presented here would not have been possible.
I would also like to thank Wynse Brooks for talking Dr. Griffey into taking me on as a
graduate student. Without Wynse’s dedication to barley, my research would not have been made
possible. His support both in the field and in the greenhouse was essential to my success. I would
also like to thank him for providing me project on that focused on barley breeding because
without it I wouldn’t have been able to pursue my dream career or discover my passion for craft
brewing.
Thank you to the members of the Virginia Tech small grains program who helped in so
many ways for me to succeed in my research. I would like to give special thanks to Neal
Carpenter and Kyle Brasier for tolerating my endless questions, assisting me in my analysis, and
providing humor when it was needed most. Additionally, I would like to thank Amy Weldon for
traveling with me to take field notes. She was always ready to spend long hours in the field no
matter the time or weather condition. Her assistance in my research was invaluable and I would
not have been able to collect all my data without her help. I also would like to thank Subas Malla
and Jonathon Light, without their help in maintaining the scab nurseries in Blacksburg and
Mount Holly, VA my research would not have been possible. Thank you to Luciana Rosso for all
your help in the lab and for tolerating my endless questions about protocols. Luciana provided
invaluable advice and guidance in the lab and without it my lab work would have been much
more difficult to perform.
Lastly, I’d like to thank Brian Ward, Anthony Christopher, John Seago, Nick Meier, and
the numerous undergraduate students that aided in my research.

vi
I also want to thank the crew at the EVAREC station in Warsaw, VA for their assistance in my
project. I particularly want to thank David ‘Scooter’ Dunaway and Robert Pitman for taking field
notes on my project when I was unable to and ensuring that everything was running smoothly at
the experimental station. Without their assistance, my research would not have been possible.
Finally, I would like to thank my committee members, Dr. David Schmale III and Dr.
Jason Holliday for their suggestions and guidance regarding my research. Without their
contributions as well as contributions from other members in our department, my research would
not have been possible.

vii
ATTRIBUTIONS
Many collaborators and colleagues assisted in the collection and analysis of the data I am
presenting in this thesis. A description of their contributions is described below.
Chapter 2: Quantitative Trait Loci for Resistance to Fusarium Head Blight in the Hulless Winter
Barley Cultivar Eve
Carl Griffey, PhD is currently the W.G. Wysor of Agriculture at Virginia Tech. Dr. Griffey was
one of the co-principal investigators for the grants that supported this research.
Wynse Brooks, MS is currently a research associate primarily focusing on barley breeding and
genetics at Virginia Tech. Wynse Brooks created the winter hulless barley mapping population
that was tested in this study.
Neal Carpenter, BS is currently a PhD candidate at Virginia Tech. Neal Carpenter has aided in
collection of field data as well as assisted in the analysis of the data presented in this thesis.
Luciana Rosso, PhD is currently a research associate at Virginia Tech. Dr. Rosso aided in the
collection of molecular data and in the creation of the molecular markers identified in this study.
Subas Malla, PhD is currently an assistant professor at Texas A&M. During his time at Virginia
Tech, Dr. Malla aided in the experimental design, field maintenance, data collection, and data
analysis for this research.
David Schmale III, PhD is currently a professor at Virginia Tech. Dr. Schmale aided with fungal
inoculation and provided assistance with experimental design.
Niki McMaster, is currently a research associate in the Schmale Lab at Virginia Tech. Niki
McMaster aided in the collection of mycotoxin data during the duration of this project.

viii
Shiaoman Chao, PhD is currently a research molecular geneticist at the USDA-ARS in Fargo,
ND. Dr. Chao collected and analyzed single nucleotide polymorphism (SNP) marker data.
Gina Brown-Guedira, PhD is currently a research geneticist at the USDA-ARS in Raleigh, NC.
Dr. Brown-Guedira aided in collection of DNA for analysis through SNP markers.
Paul Murphy, PhD is currently a professor at NC State University. Dr. Murphy organized and
maintained field plots in Kinston, NC during the duration of this research.
Dave Van Sanford, PhD is currently a professor at the University of Kentucky. Dr. Sanford
organized and maintained field plots in Lexington, KY during the duration of this research.
Anthony Clark, PhD is currently a senior laboratory technician at the University of Kentucky.
Dr. Clark assisted in data collection and field maintenance during the duration of this research.
Christina Cowger, PhD is currently a USDA associate professor in Raleigh, NC. Dr. Cowger
assisted in field maintenance while research was conducted at the USDA in Lake Wheeler, NC.
Robert Brueggeman, PhD is currently an assistant professor at North Dakota State University.
Dr. Brueggeman organized and collected data from trials conducted in Nanjing, China.

ix
TABLE OF CONTENTS
Page
Dedication ……………………………………………………………………………………..iv
Acknowledgements …………………………………………………………………....………v
Attributions .……………………………………………………………………………...…...vii
List of Tables …………………………………………………………………………….........x
List of Figures …………………………………………………………………………...……x
Chapter 1: Literature Review …………………………………………….……………….…1
Introduction ………………………………………………………………….…….…...2
Disease Cycle and Pathogen ………………………………………………….………..4
Host Resistance to Fusarium Head Blight …………………………………….…….…9
QTL for FHB Resistance ………………………………………………………….…..11
Morphological and Physiological Traits Associated with FHB …………………........14
Proposed Research ……………………………………………………………….…...17
Literature Cited …………………………………………………………………….…20
Chapter 2: Identification and Validation of Quantitative Trait Loci
for Resistance to Fusarium Head Blight in Virginia Winter Barley
Cultivars ………………………………………………………………………………….….27
Abstract ……………………………………………………………………………....28
Introduction …………………………………………………………………...…..….29
Material and Methods ………………………………………………………...…..…..30
Results ………………………………………………………………………..…...….37
Discussion ……………………………………………………………………..…..…39
Literature Cited ………………………………………………………………..…..…42
Appendix….…………………………………………………………………..….…..56

x
LIST OF TABLES
Page
Table 1.1 Chromosome, QTL Marker Interval/Loci, and Resistant
Cultivar for FHB Severity ……………………………………………………………….…......25
Table 1.2 Chromosome, QTL Marker Interval/Loci, and Resistant
Cultivar for DON Accumulation ……………………………………………………………….26
Table 2.1 Management Practices for All Locations during 2014-15....………………...……...44
Table 2.2 Management Practices for All Locations during 2015-16 ………………......….......45
Table 2.3 Resistance Quantitative Trait Loci (QTL) on Chromosome
6H Associated with Fusarium head blight (FHB) in the winter hulless
barley mapping population Eve/Doyce …………………………………………………….….46
LIST OF FIGURES
Page
Figure 2.1 Distribution of the RILs and parents derived from the
Eve/Doyce Fusarium head blight (FHB) mapping population for
assessment of FHB traits at Kinston, NC (KNC) during 2014-15 ..……………………......….47
Figure 2.2 Distribution of the RILs and parents derived from the
Eve/Doyce Fusarium head blight (FHB) mapping population for
assessment of FHB traits at Lexington, KY (LXY) during 2014-15 ……………………….....48
Figure 2.3 Distribution of the RILs and parents derived from
the Eve/Doyce Fusarium head blight (FHB) mapping population
for assessment of FHB traits at Mount Holly, VA (MHV) during
2014-15 …………………………………………………………………………………..……49
Figure 2.4 Distribution of the RILs and parents derived from
the Eve/Doyce Fusarium head blight (FHB) mapping population
for assessment of FHB traits at Blacksburg, VA (BVA) during
2015-16 ……………………………………………………………………………………....50
Figure 2.5 Distribution of the RILs and parents derived from
the Eve/Doyce Fusarium head blight (FHB) mapping population
for assessment of FHB traits at Lexington, KY (LXY) during
2015-16 ………………………………………………………………………………….…...51

xi
Page
Figure 2.6 Interaction between height (HT) and the average of
a given Fusarium head blight (FHB) trait for each of the RILs
in the Eve/Doyce mapping population across all locations (BVA,
KNC, LXY, and MHV) and both growing seasons (2014-15 and
2015-16) …………………………………………………………………………................…..52
Figure 2.7 Interaction between heading date (HD) and the average
of a given Fusarium head blight (FHB) trait for each of the RILs
in the Eve/Doyce mapping population across all locations (BVA, KNC,
LXY, and MHV) and both growing seasons (2014-15 and 2015-16) ……………………....…53
Figure 2.8 Correlation plot of Fusarium head blight (FHB)
traits for each of the RILs in the Eve/Doyce mapping population
across all locations (BVA, KNC, LXY, and MHV) and both growing
seasons (2014-15 and 2015-16) …………………………………………………………….…54
Figure 2.9 Linkage map of chromosome 6H created from the
Eve/Doyce RIL population. Identified quantitative trait loci
(QTL) positions for resistance to Fusarium head blight (FHB)
are shown on the right of the linkage group …………………………………………….…….55

1
Chapter 1
Literature Review

2
INTRODUCTION
Barley (Hordeum vulgare) is an extremely important cereal grain worldwide. It is ranked
fifth for crops grown across the globe (Goyal and Ahmed, 2012). In the United States barley is
ranked the fourth most important grain crop that is grown (Magness et al., 1971).
Barley is a widely adapted grain that is cold, salt, and drought tolerant (Goyal and Ahmed,
2012). Barley is an annual cereal crop that favors cool, dry growing conditions (Clark, 2007).
Some breeding programs have developed more adaptable cultivars that thrive in environmental
conditions that may not be conducive to typical barley growth. In geographical regions, such as
the mid-Atlantic region, where there is high humidity and variable rain fall, barley is a valuable
crop to farmers due to its ability to grow in a variety of environmental conditions (Thomason et
al., 2009). Two classes of barley are primarily grown, spring and winter types, depending on the
geographical location. Winter barley has been traditionally grown in the mid-Atlantic region for
livestock feed.
Barley production in the United States can generate about $3 billion annually (Goyal and
Ahmed, 2012). It is a very important grain that is used for malt, animal feed, and human
consumption (Baik and Ullrich, 2008). According to the U.S Grains Council, roughly 66% of the
barley produced in the United States is used for human consumption, 22% is used for animal
feed, and roughly 12% is exported (Cordero, 2013). Barley can be a source of vital nutrients as
well as provide other health benefits when consumed by humans. Soluble fiber, which can be
found in barley, is able to lower risk of cardiovascular disease, diabetes mellitus, reduce levels of
plasma cholesterol, and provide many other health benefits (Hallfrisch and Behall, 2005). With
the rise of craft brewing, the demand for malt barley has risen exponentially due to the increase
in the amount of malt required to create craft beers. Three to seven times more malt is needed to

3
create craft beer versus non-craft beer (Sheet, 2015). Due to this dramatic increase in the brewing
industry, maltsters and brewers are requesting local production of superior varieties that are able
to meet their demands and requirements for malting and brewing. Barley exports have been
predicted to rise through 2024 to developing countries such as China and India, for livestock feed
as well as for using in brewing. Development of superior locally adapted cultivars is essential in
order for this commodity to meet the rising economical demands for this important grain crop.
Aside from the two different growth habits of spring and winter barley, there are also
other characteristics that are taken into account when deciding which genotypes to plant. These
genotype characteristics include: hulled versus hulless barley and two versus six rowed barley.
Hulled and hulless barley types vary significantly in kernel weight, starch, -glucan, oil and ash
content (Griffey et al., 2010). Hulless barley has lower ash and oil concentrations than hulled
barley, but has higher starch concentrations (Griffey et al., 2010). Both hulled and hulless types
can be used as livestock feed. Hulless barley tends to have higher digestible energy and
nutritional value than hulled barley, while hulled barley tends to have a lower energy content due
its high fiber content (Bhatty, 1993, Wang et al., 1997). Hulled barley that is grown in the mid-
Atlantic region is typically used as livestock feed (Brann et al., 2009).
Fusarium Head Blight (FHB), caused by Fusarium graminearum Schwabe, is one of the
most detrimental diseases of the barley production industry in the United States, especially in
regions that are prone to have long periods of wet weather during the flowering stage (Zhu et al.,
1999). Economic losses caused by FHB have exceeded more than $3 billion in wheat and barley
since 1996 in the U.S. (McMullen et al., 1997). FHB causes yield losses, low test weights,
discolored shriveled kernels, low seed germination, reduced seed quality, and contamination of
grain with mycotoxins (McMullen et al., 1997). Low test weights and yield are primarily due to

4
floret sterility and deformed seed that is produced by infected barley plants (Zhu et al., 1999).
Deoxynivalenol (DON) or vomitoxin, is the main mycotoxin that is most problematic in barley
and wheat production (McMullen et al., 1997). DON accumulation in kernels results in
unacceptable grain quality due to its ability to inhibit protein synthesis (Berger et al., 2014,
Pestka, 2007). Even at low levels, the mycotoxin renders the grain unacceptable for animal feed,
human consumption, and malting (Zhu et al., 1999).
Barley breeding programs worldwide are working towards developing high yielding,
disease resistant and economically viable cultivars. Multiple methods are used in breeding to
select desired individuals such as marker assisted selection (MAS) and genomic selection. The
process of MAS uses molecular markers to identify and select individual genotypes having genes
and quantitative trait loci (QTL) associated with critical phenotypic traits. It is mainly used to
identify traits that show simple inheritance or QTL that explain a large proportion of the
phenotypic variation within a population (Massman et al., 2011). These traits are often complex,
meaning that genotype x environment interactions as well as interactions with other genes
influence trait expression. MAS can also improve the efficiency of transferring resistance by
using gene specific or tightly linked markers to avoid transferring unwanted traits to the
improved progeny (Kou and Wang, 2010). Using molecular breeding methods such as MAS is
critical to incorporating and pyramiding genes for resistance to diseases in improved cultivars.
Disease Cycle and Pathogen
FHB is caused by the fungal pathogen Fusarium graminearum Schwabe and is the most
common causal pathogen of this disease in North America as well as many other small grain
growing regions in the world (Goswami and Kistler, 2004). It affects a variety of small grain

5
crops such as wheat (Triticum aestivum L.), barley, triticale (X Triticosecale Wittmack), rye
(Secale cereale), and oats (Avena sativa) (Wegulo et al., 2008). The fungus may also cause ear
rot and Gibberella stalk rot disease in maize (Zea mays) (Goswami and Kistler, 2004). FHB can
cause seed to be shriveled and chalky with low test weight, and produce mycotoxins that affect
seed quality. The two mycotoxins that are mainly produced are, a trichothecene toxin known as
deoxynivalenol (DON) or vomitoxin and the oestrogenic toxin known as zearalenone (Goswami
and Kistler, 2004).
According to Bai et al. (2001), DON is essential to FHB virulence and disease spread in
wheat, but not in barley. This mycotoxin affects an eukaryotic cell’s ability to synthesize protein
by binding to ribosomes that are involved in essential cellular activities such as cell
differentiation and death (Goswami and Kistler, 2004, Pestka, 2007, Pestka and Smolinski,
2005). According to Bennett et al. (2003), DON can cause detrimental effects in livestock such
as feed refusal, diarrhea, hemorrhaging, among other acute symptoms. Poor weight gain is often
a result due to the adverse effects of this mycotoxin which is detrimental to producers (Wise and
Woloshuk, 2010). Not only does DON affect livestock, but can adversely affect humans as well.
Symptoms such as nausea, vomiting, convulsions, and anorexia are usually associated with
humans who have digested significant amounts of this mycotoxin (Goswami and Kistler, 2004).
DON is usually concentrated in the shriveled, chalky kernels (Wise and Woloshuk, 2010). This
mycotoxin is regulated by the U.S. Food and Drug Administration (FDA), who sets acceptable
and safe concentration limits for human consumption, swine feed, cattle feed and feed destined
to other animals. The FDA set a 1 part per million (ppm) limit in finished products but in malt
barley there is zero tolerance for DON (Food and Administration, 2010). The maximum DON
concentration is 5 ppm for feed to be used by swine, 10 ppm for feed to be used by cattle, and

6
5ppm for feed to be used by other non-ruminant animals (Food and Administration, 2010, Wise
and Woloshuk, 2010). For brewers and maltsters, DON can be very problematic and can affect
both the malting and brewing process. DON is can typically be washed out of infected grains
during the steeping stage of malting, but Fusarium regrowth can occur during germination
leading to unacceptable DON levels in both the finished malt and beer (Schwarz et al., 1995).
The other mycotoxin, zearalenone, is no common in small grains showing symptoms of FHB.
FHB is a monocyclic disease, indicating that after initial infection often via airborne
ascospores, little to no secondary infection occurs from the conidia that form on the heads
(Wegulo et al., 2008). Some of the secondary infection that can occur after initial infection is due
to rain splash that can disperse ascospores or macroconidia throughout the plant canopy (Paul et
al., 2004). The fungus overwinters in residues such as wheat, barley, maize, or in the soil
(Nyvall, 1970, Reis, 1990, Shaner, 2003, Sutton, 1982, Wiese, 1987). Perithecia form on the
overwintering material and produce conidia and sexual spores called ascospores, which are the
primary inoculum in the spring and early summer (Schmale III et al., 2005, Wegulo et al., 2008).
FHB infection begins with the introduction of ascospores into a field under favorable conditions
(Markell and Francl, 2003). The ascospores are spread by wind, rain, or insects to susceptible
plants within a field (Parry et al., 1995, Sutton, 1982, Wegulo et al., 2008). Ascospores
transported long distances by atmospheric motions often have an essential role in initial disease
development on susceptible hosts when optimal environmental conditions are present (Francl et
al., 1999, Schmale III and Bergstrom, 2003, Shaner, 2003). Initiation of fungal growth begins
when the ascospores land on or near spikelets on the host plant (Sutton, 1982). Host plants are
most susceptible to Fusarium spore infection during anthesis, but infection can also occur during
the soft dough stage of kernel development (Del Ponte et al., 2007, McMullen et al., 1997,

7
Wegulo et al., 2008). Host plants are most susceptible to infection during anthesis because the
anthers and pollen serve as a source of nutrients and provide stimulates to the developing fungal
spores (Savi et al., 2015, Strange and Smith, 1971). The fungal hyphae develop on the spikelet
where they grow towards stomata or other areas of weakness, such as exposed anthers, in order
to enter inside the inflorescence (Bushnell et al., 2003). Not only does fungal growth occur from
the outside to inside of inflorescences, mycelia growth can also form on glumes and spread to
surrounding plant tissue (Bushnell et al., 2003). Later in the growing season during or after
maturity, perithecia may form on seed heads (Wegulo et al., 2008).
Moist, warm temperatures are critical for fungal infection and growth (Wegulo et al.,
2008). Temperatures from 77F to 86F are ideal for infection and symptom development
(Wegulo et al., 2008). Along with warm temperatures, wet conditions are needed for spore
germination, infection and production as well. Frequent wet conditions, especially during
anthesis, combined with warm temperatures create ideal conditions for fungal infection and
growth on susceptible plants (McMullen et al., 1997). Usually fields that are irrigated have more
consistent and severe infection than rain fed fields due to the consistent supply of water (Wegulo
et al., 2008).
FHB symptoms can start to appear two to four days after infection if optimal conditions
for fungal growth are present (Wegulo, 2012). Initial infection can occur from anthesis to soft
dough stages under conditions conducive to spore growth, although infection that occurs during
anthesis is most damaging to the host plant (Wegulo, 2012). The inflorescences on an infected
head will bleach and when severe infection occurs, premature bleaching or blight of the entire
seed head occurs (Goswami and Kistler, 2004). Infection often occurs first in the middle of the
head where flowering initiates (Wegulo et al., 2008). Browning or purpling of the peduncle

8
beneath an inflorescence is also an indication where infection has occurred (Goswami and
Kistler, 2004, Wegulo et al., 2008). Under moist conditions, orange to salmon pink groups of
spores will form at the base of the florets (Wegulo et al., 2008). Brown to tan discoloration or
dark water soaking can also occur at the site of infection (Goswami and Kistler, 2004). Damaged
kernels become “tombstone” like in appearance: white, chalky, shriveled seed that may also have
pink discoloration depending on severity (McMullen et al., 1997).
The best management practices for control of FHB include an integration of good cultural
techniques, fungicides, and resistant varieties (Mesfin et al., 2003). Fungicide applications can be
very useful in controlling infections of FHB if they are applied at the appropriate time.
Fungicides are generally applied during the critical time of infection, which is from flowering to
soft dough stage depending on the level of risk for FHB infection. Although fungicides can be
beneficial in control of FHB, studies have shown that fungicides usually only provide up to 50%
protection against this fungal pathogen (Pirgozliev et al., 2003). Producers must take care to read
fungicide labels to ensure proper dose and to ensure that the fungicides will not promote FHB or
toxin development. Strobilurin fungicides, such as azoxyst robin, are not recommended since this
class of fungicide has been reported to enhance FHB development and increase DON
accumulation roughly by 41% in barley kernels (Pirgozliev et al., 2003).
The most economical method of FHB control is the use of resistant varieties (Mesfin et
al., 2003). Completely resistant varieties are not available, and varieties vary from moderately
resistant to susceptible. Producers are recommended to choose the most resistant variety
available for their needs (Wise and Woloshuk, 2010). Another means to lower risks from FHB is
use of a combination of varieties that have different flowering times. This staggers flowering
dates of the crop and therefore, the times of peak infection to reduce the risk of total crop

9
infection. Other cultural control management options include reduction of inoculum through
tillage or by non-host crop rotation (Kleczewski, 2014, Pirgozliev et al., 2003). Through tillage,
farmers are able to bury and potentially reduce within-field inoculum sources as well as sources
for long distance transport of fungal spores, in fields before planting their small grains crop.
Reduction of inoculum within a field as well as inoculum that is transported long distances,
through tillage is an impractical means of control since in recent years minimal to no-till
methods have become more common in farming systems in an effort to reduce erosion and
improve soil tilth. Non-host crop rotation is an effective means of control. By rotating non-host
crops, such as soybeans or alfalfa, into crop rotation after host plants, farmers can reduce FHB
incidence within a field by 15% (Pirgozliev et al., 2003). By using a combination of resistant
varieties, crop rotation, and proper application of fungicides, the risk of FHB can be reduced.
Host Resistance to Fusarium Head Blight
Resistance to FHB has been difficult to breed for due to multiple factors including,
limited information, sources and forms of genetic resistance, genotype x environment
interactions, and the cost of phenotyping (Zhu et al., 1999). Resistance to FHB is race non-
specific, which means that the resistance is quantitative or horizontal in nature (Zhu et al., 1999).
FHB resistance is a complex trait that has relatively low heritability and is strongly influenced by
environmental factors (Massman et al., 2011).
There are five types of FHB resistance in wheat and barley. Type I, type II, and type III
resistance are generally considered to be the main resistance types. Type I resistance is the
“restriction of initial pathogen infection”, which has been identified in both wheat and barley
(Schroeder and Christensen, 1963). Type II resistance is the “restriction of spread of the

10
pathogen in the spike after initial infection” (Rudd et al., 2001). Type II resistance varies among
wheat genotypes, while in barley it is innate and the fungus generally does not move up or down
the spike after initial infection (Steffenson et al., 2003). Type III resistance is the ability to
prevent DON synthesis and enhance its degradation (Zhu et al., 1999).
Quantitative trait loci (QTL) have been identified for both qualitative and quantitative
disease resistance in both wheat and barley (Zhu et al., 1999). It is extremely important when
introducing and pyramiding disease resistance genes to use molecular markers to select for
and/or verify the presence of resistance QTL (De la Pena et al., 1999, Zhu et al., 1999). Several
methods have been employed to identify QTL regions. Linkage maps saturated with restriction
fragment length polymorphisms (RFLP) have been used to postulate the chromosome region
where a given QTL most likely resides (De la Pena et al., 1999). Before implementing MAS into
a breeding program, the effects and consistency of a QTL should be validated in multiple
populations and environments (Mesfin et al., 2003). When identifying and selecting QTL of
interest, certain criteria should be considered in the detection of other traits associated with the
desired QTL, such as association of FHB resistance with heading date or plant height, in the
targeted region of interest and to set thresholds for the detection of significant QTLs in repeated
environments and populations (De la Pena et al., 1999). These criteria can aid in effectively
identifying and validating desired QTL regions in the donor or resistant germplasm.
Resistance to FHB has been identified and mapped in spring barley. The challenge with
most germplasm sources that provide resistance to FHB and DON are that they are either non-
adapted to the area of interest and/or possess poor agronomic or quality traits. Such traits can
include poor straw strength, late maturity, high protein, and susceptibility to other diseases. In
the case of malting barley, FHB resistance has been found to be associated with an increase grain

11
protein and nitrogen content which can cause poor malting and brewing qualities (Sarlin et al.,
2005). Incorporation of resistance from diverse sources into breeding programs is essential to
enhance the level of FHB resistance. Some common sources of FHB resistance are ‘Chevron’
(CIho 1111), ‘Fredrickson’ (CIho 13647), ‘Zhedar 2’ (Prom et al., 1997), and ‘CIho 4196’.
Chevron is a non-malting, six row cultivar from Switzerland that has expressed resistance to
FHB, kernel discoloration (KD), and DON in various field tests (De la Pena et al., 1999,
Gebhardt et al., 1992, Rudd et al., 2001). Drawbacks from using Chevron as a source of FHB
and DON resistance are its tall plant height, weak straw strength, late maturity, low yields, and
small kernels (De la Pena et al., 1999). Resistance in Chevron has been reported to be inherited
quantitatively (De la Pena et al., 1999). Fredrickson, a two row cultivar from Japan, has been
moderately resistant to FHB in field tests (Mesfin et al., 2003). Zhedar 2, a two row variety that
originated from China, has shown resistance to FHB severity and reduced DON production and
accumulation (Dahleen et al., 2003, Prom et al., 1997) CIho 4196, a two row Chinese land race,
also expresses resistance to FHB (Rudd et al., 2001). These are a few of the main sources of
resistance that are being used in breeding programs.
QTL for FHB Resistance
Traditionally, barley breeding programs have experienced difficulty incorporating FHB
resistance into their programs since resistance is complex and often involves a combination of
many QTL as well as being greatly influenced by genotype x environment interactions and
physiological traits such as heading date and height (Mesfin et al., 2003). Identification and
validation of QTL is important since individual QTL may only have small effects on the overall
level of resistance exhibited by an individual (Mesfin et al., 2003). Resistance QTL are also often

12
linked to agronomic traits, such as heading date or height, that confound FHB resistance and its
assessment (Mesfin et al., 2003). Field studies conducted by Ma et al. (2000), de la Pena et al.
(1999), Dahleen et al. (2003), and Zhu et al. (1999) indicate that FHB resistance is linked to
multiple loci and certain morphological or physiological traits.
Resistance to FHB and DON accumulation has been mapped to all seven barley
chromosomes, with resistance QTL on chromosomes 2H and 6H being the most common (Table
1.1 and 1.2) (Berger et al., 2014, Mesfin et al., 2003). De la Pena et al. (1999) identified FHB
resistance QTL on multiple barley chromosomes: 1(7H), 2(2H), 3(3H), 4(4H), 5(1H), and 7(5H)
in a Chevron/M69 mapping population (Mesfin et al., 2003). According to Mesfin et al. (2003) a
major region on chromosome 2H is associated with FHB resistance, DON accumulation, and
kernel discoloration and accounts for “13.5% of the phenotypic variation for FHB resistance”
(De la Pena et al., 1999). Ma et al. (2000) identified nine QTL for FHB resistance in a Chevron/
‘Stander’ (PI 564743) mapping population. Resistant QTL were found on chromosomes 1(7H),
2(2H), 3(3H), 6(6H), and 7(5H) (Ma et al., 2000). The QTL found on chromosome 2(2H)
accounts for 11.8% to 20.8% of phenotypic variation in FHB resistance across the five
environments that the Chevron/Stander population was tested (Mesfin et al., 2003). Zhu et al.
(1999) identified FHB resistance on all barley chromosomes except 7(5H) in a ‘Gobernadora’
(OC640/Mari//Pioneer/3/Maris Canon) / CMB643 (Shyri/Gloria//Copal///Shyri/Grit) two-rowed
barley mapping population (Meszaros et al., 2007). The largest FHB resistance QTL was found
on chromosome 2(2H) and accounted for 33% of the phenotypic variation (Mesfin et al., 2003,
Zhu et al., 1999). The resistance QTL found on chromosome 4(4H) accounted for 4% to 12% of
the FHB phenotypic variation and was associated with “plant height, seeds per inflorescences,
inflorescence density, and lateral floret size” (Mesfin et al., 2003). Dahleen et al. (2003)

13
identified nine resistance QTL for FHB severity and five resistance QTL for reduced DON
accumulation on all chromosomes except 4(4H) and 7(1H), in a Zhedar 2/ND9712//Foster
double haploid population. Among the QTL identified for FHB severity, only two significant
QTL identified on 6H were unique to the resistant parent Zhedar 2 (Dahleen et al., 2003). Three
resistance QTL associated with low FHB severity were identified in a study of ‘Harbin’
(accession No. C649) / Turkey 6 (accession No. T602) recombinant inbred mapping population
(Hori et al., 2006). Resistant QTL were found on chromosomes 2H, 4H, and 6H across multiple
years and locations with the QTL located on chromosome 6H contributing the highest amount of
phenotypic variance (18.6%) (Hori et al., 2006).
Resistance to DON development and accumulation has been found on various
chromosomes across all the studies mentioned above and is frequently associated with FHB
resistance QTL. De la Pena (1999) identified four QTL regions in a Chevron / M69 population
that were associated with DON accumulation resistance on chromosomes 1(7H), 2(2H), and
7(1H). The QTL found on chromosome 2(2H) that is related to DON accumulation is linked to
FHB resistance as well (De la Pena et al., 1999). Dahleen et al. (2003) identified one unique
QTL on chromosome 6 that is associated with low DON accumulation, as well as reduced FHB
severity, in the Zhedar 2 /ND9712//Foster population. Ma et al. (2000) identified nine QTL for
lower FHB severity and DON accumulation in a Chevron / Stander population. Of the nine QTL
identified, eight were shared between the two traits, which further supports that FHB resistance
and DON accumulation QTL are often linked together or the same.

14
Morphological and Physiological Traits Associated with FHB
As discussed in the previous section, very often major morphological or physiological
traits are linked with FHB resistance. Spike type, flowering type, and heading date are important
traits that are often found to be associated with FHB severity (Mesfin et al., 2003). The Vrs1,
main influential loci located on chromosome 2H, and Int-c loci control whether barley heads will
be two or six rowed (Mesfin et al., 2003). Two rowed spikes are controlled by Vrs1; int-c/int-c
(Lundqvist and Franckowiack, 1997), while six rowed spikes are controlled by vrs1/vrs1; Int-c.
Several studies have been conducted and identified a link between the Vrs1 locus and resistance
to FHB and DON accumulation. Mesfin et al. (2003) discovered that the Vrs1 locus was
associated to FHB resistance in a Fredrickson / Stander (PI 564743) population as well as a
Fredrickson /Stander//M81 population that was used to validate the QTL. Although they
discovered that the Vrs1 locus is associated with FHB resistance, they were unable to determine
if the regions were tightly linked or if it was due to a pleiotropic effect of the Vrs1 locus (Mesfin
et al., 2003). FHB resistance in barley has more frequently been discovered in two row barley
cultivars versus six row barley cultivars (Steffenson et al., 1996). Chevron is one of the few six
row barley cultivars that exhibits resistance, while CIho 4196, Zhedar 1, Zhedar 2, Harbin,
Fredrickson, ‘Harrington’ from Canada, ‘Kitchin’ from the U.S. and ‘Shyri’ from Mexico, are
some of the two row barley varieties that exhibit moderate to high resistance to FHB and DON
accumulation (Rudd et al., 2001). A study performed with five RIL mapping populations
composed of Harbin by susceptible crosses identified 13 QTL regions across all seven barley
chromosomes (Sato et al., 2008). All of the QTL found in the study were found to be associated
with flowering type on chromosome 2H, but none near the vrs1 locus (Sato et al., 2008). Since

15
none of the resistance was found near the vrs1 locus, this suggests that the resistance seen in two
row by six row may be due to a pleiotropic effect (Sato et al., 2008).
Flowering type, whether the flower is open or closed, is controlled by the cly1/Cly2 gene
that is located on the long arm of chromosome 2H (Turuspekov et al., 2004). Previous studies
performed by Steffenson (2003) and Yoshida et al. (2005) identified a link between flowering
type and FHB resistance. Yoshida et al. (2005) observed that the difference in FHB resistance
between cleistogamous and chasmogamous pairs was greater and more stable in the NIL
populations, suggesting that flowering type does affect the amount of FHB resistance exhibited.
Two studies performed by Hori et al. (2005, 2006), using Harbin derived populations, identified
FHB resistance QTL on chromosome 2H that were near the same region as cly1/Cly2 locus. It is
still to be determined if there is a linkage effect between FHB resistance and the cly1/Cly2 locus.
The Vrs1 locus often has been found to be associated with other agronomic traits such
heading date and spike morphology (Massman et al., 2011). Heading date has been associated
with FHB resistance and DON accumulation in multiple studies. Plant height and heading date
are crucial components to FHB development (Ma et al., 2000). Late heading date may be
associated with FHB resistance since the heads experience less exposure time to the fungal
spores (Mesfin et al., 2003). Ma et al. (2000) reported a negative correlation between late
heading date and FHB severity and DON accumulation in a Chevron / Stander double haploid
population. The resistance QTL identified by Dahleen et al. (2003) in the Zhedar 2 population
were also found to be linked to later heading. The association between heading date and FHB
resistance may be due to linkage between the genes for heading date and FHB resistance or due
to pleiotropic effects (Ma et al., 2000). In a similar study performed by de la Pena et al. (1999),
in a Chevron / M69 population, they also identified an association between late heading and tall

16
plants with lower FHB severity and DON concentrations. The linkage between heading date and
FHB resistance has caused a barrier for plant breeders since they often do not select later heading
individuals and therefore may be eliminating potential resistance genes. A study was conducted
using near isogenic lines (NILs) derived from a Chevron / M69 mapping population to assess the
Qrgz-2H-8 region on chromosome 2(2H) that is associated with heading date and FHB resistance
(Nduulu et al., 2007). They discovered one recombinant that did showed uncoupling between
late heading and FHB resistance which proves that the linkage between heading date and FHB
resistance can be broken (Nduulu et al., 2007). Further research and fine mapping of the QTL
regions in question are needed to confirm the association between FHB resistance and
morphological traits as well as if the linkage can be unbroken in other mapping populations.
Within the Virginia Tech barley breeding program, sources of FHB resistance were
identified in winter barley cultivars ‘Eve’ (PI659067) and ‘Nomini’ (PI566929). Eve is a six
rowed hulless winter barley that express moderate resistant to FHB and has reduced
accumulation of DON toxins (Brooks et al., 2013). Eve likely received its resistance from the
parent VA94-42-13, which has Chevron in its background. Pedigree information for Chevron is
available at The Triticeae Toolbox database (http://triticeaetoolbox.org/ [accessed 02 Dec. 2016).
Nomini is a six rowed hulled barley cultivar that has exhibited FHB resistance in field trials
(Berger et al., 2014). The FHB resistance expressed by Nomini is likely derived from the parent
‘Henry’ (CI15690), which has Chevron in its background as well. However, some of the QTL
flanking markers in Eve and Nomini do not match those of Chevron or Fredrickson, which
indicates that their resistance may be unique. Further analysis and QTL mapping of elite lines
such as these is critical in identifying and validating QTL for resistance to FHB and DON
accumulation.

17
Proposed Research
Experimental
A hulless winter-barley mapping population derived from a resistant by susceptible cross
will be evaluated for FHB resistance, FDK, and DON accumulation. The mapping population
includes: Eve / ‘Doyce’ (PI634932). Recombinant inbred lines (RILs) will be planted in
randomized complete blocks within inoculated and mist irrigated nurseries at Kinston, North
Carolina, Lake Wheeler, North Carolina, Lexington, Kentucky, Blacksburg, Virginia, and Mt.
Holly, Virginia during the 2014-2015 growing season. In 2015-2016, the populations will be
planted in randomized complete blocks within inoculated and mist irrigated nurseries at Kinston,
North Carolina, Lexington, Kentucky, Blacksburg, VA, and Mt. Holly, VA.
Experimental units in this will study consist of one or two adjacent 1.2m head rows,
which constitutes a plot, with 0.3m spacing between each head row. Each experimental unit will
be used in the evaluation of phenotypic responses to FHB and to produce enough grain for
subsequent analyses of fusarium damaged kernels (FDK) and DON concentration. Corn kernels
inoculated with Fusarium graminearum will be applied to head rows at the early boot stage to
enhance the development of disease at all locations (Khatibi et al., 2011). A combination of six
Fusarium graminerarum isolates will be used in the preparation of inoculum to incite infection
of barley genotypes in the Blacksburg and Mt. Holly, VA scab nurseries. Fusarium isolates, that
are native to this region, will be obtained from Dr. D. Schmale, department of Plant Pathology,
Physiology, and Weed Science at Virginia Tech. At 50% flowering, plots at Blacksburg will be
spray inoculated using 50,000 spores/ml of macroconidia (Berger et al., 2014). Plots within
nurseries will be mist irrigated for one hour each day between the times of 3:00pm and 4:00pm,
except when natural precipitation events occur, for three weeks after the first inoculation. Plots

18
will be harvested at maturity (<16% moisture content) using Wintersteiger plot combines
(Wintersteiger, Salt Lake City, UT) with low fan speeds to minimize loss of Fusarium damaged
kernels during harvest
FHB INC, SEV, and Quantification of FDK and DON in Grain Samples
FHB incidence (INC) and severity (SEV) will be rated in the field nurseries to assess
genotypes for resistance. FHB incidence, the percentage of FHB infected heads, will be
determined by arbitrarily choosing and evaluating 20 FHB infected heads per experimental unit.
FHB severity, the number of FHB infected spikelets divided by the total number of spikelets, is
determined by selecting and evaluating 20 FHB infected heads per experimental unit. Both
incidence and severity will be rated at each of the locations roughly three weeks after flowering,
to ensure that ratings occur at the appropriate time for early and late flowering RILs in within the
population.
After harvest is completed a subsample of grain from each genotype will be taken from
each rep. These subsamples will be cleaned using a screen cleaner without air, to limit the
removal of infected kernels, to remove debris. A smaller subsample of 100 grams will be taken
for quantification of DON concentration and about five grams to assess FDK (Berger et al.,
2014). As described by Khatibi et al. (2012), DON concentration will be determined by grinding
100 grams of kernels into whole grain flour subsamples and then using gas chromatography and
mass spectrometry to analyze the ground samples. FDK is calculated as a percentage of infected
kernels per subsample of 100 kernels. Through these methods, further analysis of resistance to
FHB within the RIL populations is conducted.

19
Molecular Marker Genotyping
Previous work conducted by Greg Berger et al. (2014) on FHB resistance of Virginia
barley postulated that the winter barley cultivars Eve and Nomini may possess unique QTL for
resistance on chromosomes 2H and 6H. The fragment sizes of multiple SSR and/or SNP markers
associated with QTL for FHB resistance found in the resistant sources Nomini, Eve, and
VA06H-48 were not similar to those identified in Fredrickson and Chevron. This indicates that
these cultivars may contain unique FHB resistance QTLs. Genotyping will be conducted at
Virginia Tech as well as at the USDA lab in Fargo, North Dakota. The genotypes will be
screened with markers for resistance QTL across the whole genome, with focus on chromosomes
2H and 6H, using single nucleotide polymorphisms (SNP) and single sequence repeats (SSR).
SNP screening will be conducted by both Virginia Tech and the USDA lab in Fargo, ND. An
Illumina 9K iSelect SNP Chip (Illumina, San Diego, CA) will be performed in the USDA lab in
Fargo, ND. Tissue grinding and DNA extraction will be performed at the USDA lab in Raleigh,
NC prior to the 9K iSelect analysis. The SNP makers that will be ran at Virginia Tech, will be
designed and ordered based on the results of the 9K iSelect. Direct label SSR screening will be
conducted within the Virginia Tech lab via an Applied Biosystem™ (ABI) (ThermoFisher
Scientific, Waltham, MA) and GeneMarker® Software (SoftGenetics, State College, PA). Along
with validation of resistance QTL on chromosomes 2H and 6H in Eve, search for other FHB
resistance QTL across the entire genome will be conducted in an effort to map FHB resistance in
Eve.

20
LITERATURE CITED
Baik, B.-K. and S.E. Ullrich. 2008. Barley for food: characteristics, improvement, and renewed
interest. Journal of Cereal Science 48: 233-242.
Bennett, J. and M. Klich. 2003. chotoxins. C lin. Microbiol. Rev 16: 497-516.
Berger, G., A. Green, P. Khatibi, W. Brooks, L. Rosso, S. Liu, et al. 2014. Characterization of
Fusarium Head Blight Resistance and Deoxynivalenol Accumulation in Hulled and
Hulless Winter Barley. Plant Disease 98: 599-606.
Bhatty, R. 1993. Physicochemical properties of roller-milled barley bran and flour. Cereal
Chemistry 70: 397-397.
Brann, D.E., A. Abaye, P. Peterson, D.R. Chalmers, D.L. Whitt, G.F. Chappell, et al. 2009.
Agronomy handbook.
Brooks, W., M. Vaughn, G. Berger, C. Griffey, W. Thomason, J. Paling, et al. 2013. Registration
of ‘Eve’winter hulless barley. Journal of Plant Registrations 7: 5-11.
Bushnell, W., B. Hazen, C. Pritsch and K. Leonard. 2003. Histology and physiology of Fusarium
head blight. Fusarium head blight of wheat and barley: 44-83.
Canci, P.C., L.M. Nduulu, G.J. Muehlbauer, R. Dill-Macky, D.C. Rasmusson and K.P. Smith.
2004. Validation of quantitative trait loci for Fusarium head blight and kernel
discoloration in barley. Molecular Breeding 14: 91-104.
Clark, A. 2007. Managing Cover Crops Profitably. Sustainable Agriculture Network. p. 77-80.
Cordero, A. 2013. US Grains Council.
Dahleen, L., H. Agrama, R. Horsley, B. Steffenson, P. Schwarz, A. Mesfin, et al. 2003.
Identification of QTLs associated with Fusarium head blight resistance in Zhedar 2
barley. Theoretical and applied genetics 108: 95-104.
De la Pena, R., K. Smith, F. Capettini, G. Muehlbauer, M. Gallo-Meagher, R. Dill-Macky, et al.
1999. Quantitative trait loci associated with resistance to Fusarium head blight and kernel
discoloration in barley. Theoretical and Applied Genetics 99: 561-569.
Del Ponte, E., J. Fernandes and G. Bergstrom. 2007. Influence of growth stage on Fusarium head
blight and deoxynivalenol production in wheat. Journal of Phytopathology 155: 577-581.
Food, U. and D. Administration. 2010. Guidance for industry and FDA: Advisory levels for
deoxynivalenol (DON) in finished wheat products for human consumption and grains and
grain by-products used for animal feed. US Food and Drug Administration: Silver Spring,
MD, USA.

21
Francl, L., G. Shaner, G. Bergstrom, J. Gilbert, W. Pedersen, R. Dill-Macky, et al. 1999. Daily
inoculum levels of Gibberella zeae on wheat spikes. Plant Disease 83: 662-666.
Gebhardt, D., D. Rasmusson and R. Wilcoxson. 1992. Cyclic Breeding Used to Incorporate
Kernel Discloration Resistance into Malting Barley. Crop science 32: 352-356.
Goswami, R.S. and H.C. Kistler. 2004. Heading for disaster: Fusarium graminearum on cereal
crops. Molecular plant pathology 5: 515-525.
Goyal, A. and M. Ahmed. 2012. Barley: Production, Improvement, and Uses. Crop Science 52:
2852-2854.
Griffey, C., W. Brooks, M. Kurantz, W. Thomason, F. Taylor, D. Obert, et al. 2010. Grain
composition of Virginia winter barley and implications for use in feed, food, and biofuels
production. Journal of cereal science 51: 41-49.
Hallfrisch, J. and K. Behall. 2005. Health Effects of Barley Consumption. Cereal Foods World
50: 274-275.
Hori, K., T. Kobayashi, K. Sato and K. Takeda. 2005. QTL analysis of Fusarium head blight
resistance using a high-density linkage map in barley. Theoretical and applied genetics
111: 1661-1672.
Hori, K., K. Sato, T. Kobayashi and K. Takeda. 2006. QTL analysis of Fusarium head blight
severity in recombinant inbred population derived from a cross between two-rowed
barley varieties. Breeding Science 56: 25-30.
Khatibi, P.A., J. Montanti, N.P. Nghiem, K.B. Hicks, G. Berger, W.S. Brooks, et al. 2011.
Conversion of deoxynivalenol to 3-acetyldeoxynivalenol in barley-derived fuel ethanol
co-products with yeast expressing trichothecene 3-O-acetyltransferases. Biotechnol.
Biofuels 4: 26.
Kleczewski, N. 2014. Fusarium Head Blight Management in Wheat. Cooperative Extension Fact
Sheets and Publications. University of Delaware.
Kou, Y. and S. Wang. 2010. Broad-spectrum and durability: understanding of quantitative
disease resistance. Current opinion in plant biology 13: 181-185.
Lundqvist, U. and J. Franckowiack. 1997. BGS 178, intermedium spike-c, int-c. Barley Genet
Newslett 26: 200-201.
Ma, Z., B.J. Steffenson, L.K. Prom and N.L. Lapitan. 2000. Mapping of quantitative trait loci for
Fusarium head blight resistance in barley. Phytopathology 90: 1079-1088.
Magness, J., G. Markle and C.C. Compton. 1971. Food and feed crops of the United States.
Markell, S. and L. Francl. 2003. Fusarium head blight inoculum: species prevalence and
Gibberella zeae spore type. Plant Disease 87: 814-820.

22
Massman, J., B. Cooper, R. Horsley, S. Neate, R. Dill-Macky, S. Chao, et al. 2011. Genome-
wide association mapping of Fusarium head blight resistance in contemporary barley
breeding germplasm. Molecular breeding 27: 439-454.
McMullen, M., R. Jones and D. Gallenberg. 1997. Scab of wheat and barley: a re-emerging
disease of devastating impact. Plant disease 81: 1340-1348.
Mesfin, A., K. Smith, R. Dill-Macky, C. Evans, R. Waugh, C. Gustus, et al. 2003. Quantitative
trait loci for Fusarium head blight resistance in barley detected in a two-rowed by six-
rowed population. Crop Science 43: 307-318.
Meszaros, K., I. Karsai, C. Kuti, J. Banyai, L. Lang and Z. Bedo. 2007. Efficiency of different
marker systems for genotype fingerprinting and for genetic diversity studies in barley
(Hordeum vulgare L.). South African Journal of Botany 73: 43-48.
Nduulu, L., A. Mesfin, G. Muehlbauer and K. Smith. 2007. Analysis of the chromosome 2 (2H)
region of barley associated with the correlated traits Fusarium head blight resistance and
heading date. Theoretical and applied genetics 115: 561-570.
Nyvall, R. 1970. Chlamydospores of Fusarium roseum'Graminearum'as survival structures.
Phytopathology 60: 1175-1177.
Parry, D., P. Jenkinson and L. McLeod. 1995. Fusarium ear blight (scab) in small grain cereals—
a review. Plant pathology 44: 207-238.
Paul, P., S. El-Allaf, P. Lipps and L. Madden. 2004. Rain splash dispersal of Gibberella zeae
within wheat canopies in Ohio. Phytopathology 94: 1342-1349.
Pestka, J.J. 2007. Deoxynivalenol: toxicity, mechanisms and animal health risks. Animal feed
science and technology 137: 283-298.
Pestka, J.J. and A.T. Smolinski. 2005. Deoxynivalenol: toxicology and potential effects on
humans. Journal of Toxicology and Environmental Health, Part B 8: 39-69.
Pirgozliev, S.R., S.G. Edwards, M.C. Hare and P. Jenkinson. 2003. Strategies for the control of
Fusarium head blight in cereals. European Journal of Plant Pathology 109: 731-742.
Prom, L., B. Steffenson, B. Salas, T. FETCH, J. FETCH and H. CASPER. 1997. Barley
accessions resistant to Fusarium head blight and the accumulation of deoxynivalenol.
Cereal Research Communications: 807-808.
1990. Integrated disease management: The changing concepts of controlling head blight and spot
blotch. 3. International Conference on Wheat for the Nontraditional Warm Areas, Foz do
Iguacu (Brazil), 29 Jul-3 Aug 1990, CIMMYT.
Rudd, J., R. Horsley, A. McKendry and E. Elias. 2001. Host plant resistance genes for Fusarium
head blight. Crop Science 41: 620-627.

23
Sarlin, T., A. Laitila, A. Pekkarinen and A. Haikara. 2005. Effects of Three Fusarium Species on
the Quality of Barley and Malt. Journal of the American Society of Brewing Chemists
63: 43-49.
Sato, K., K. Hori and K. Takeda. 2008. Detection of Fusarium head blight resistance QTLs using
five populations of top-cross progeny derived from two-row× two-row crosses in barley.
Molecular breeding 22: 517-526.
Savi, G.D., K.C. Piacentini, S.R. de Souza, M.E. Costa, C.M. Santos and V.M. Scussel. 2015.
Efficacy of zinc compounds in controlling Fusarium head blight and deoxynivalenol
formation in wheat (Triticum aestivum L.). International journal of food microbiology
205: 98-104.
Schmale III, D. and G. Bergstrom. 2003. Fusarium head blight. The Plant Health Instructor.
DOI: 10.1094. PHI-I-2003-0612-01.
Schmale III, D.G., Q.A. Arntsen and G.C. Bergstrom. 2005. The forcible discharge distance of
ascospores of Gibberella zeae. Canadian Journal of Plant Pathology 27: 376-382.
Schroeder, H. and J. Christensen. 1963. Factors affecting resistance of wheat to scab caused by
Gibberella zeae. Phytopathology 53: 831-838.
Schwarz, P.B., H.H. Casper and S. Beattie. 1995. Fate and development of naturally occurring
Fusarium mycotoxins during malting and brewing. American Society of Brewing
Chemists (USA).
Shaner, G. 2003. Epidemiology of Fusarium head blight of small grain cereals in North America.
Fusarium head blight of wheat and barley.
Sheet, B. 2015. Feed Outlook: Special Article.
Snijders, C. 1990. Fusarium head blight and mycotoxin contamination of wheat, a review.
Netherlands Journal of Plant Pathology 96: 187-198.
Steffenson, B. 2003. Fusarium head blight of barley: Impact, epidemics, management, and
strategies for identifying and utilizing genetic resistance. Fusarium head blight of wheat
and barley: 241-295.
Steffenson, B., K. Leonard and W. Bushnell. 2003. Fusarium head blight of barley: impact,
epidemics, management, and strategies for identifying and utilizing genetic resistance.
Fusarium head blight of wheat and barley: 241-295.
1996. Severity of Fusarium head blight and concentrations of deoxynivalenol in near-isogenic
lines of barley differing for several agronomic characters. Proc. 7th International Barley
Genetics Symposium, University Extension Press, Saskatoon, Saskatchewan.
Strange, R. and H. Smith. 1971. A fungal growth stimulant in anthers which predisposes wheat
to attack by Fusarium graminearum. Physiological Plant Pathology 1: 141-150.

24
Sutton, J. 1982. Epidemiology of wheat head blight and maize ear rot caused by Fusarium
graminearum. Canadian Journal of Plant Pathology 4: 195-209.
Thomason, W., W. Brooks, C. Griffey and M. Vaughn. 2009. Hulless barley seeding rate effects
on grain yield and yield components. Crop science 49: 342-346.
Turuspekov, Y., Y. Mano, I. Honda, N. Kawada, Y. Watanabe and T. Komatsuda. 2004.
Identification and mapping of cleistogamy genes in barley. Theoretical and applied
genetics 109: 480-487.
Wang, L., S.R. Behr, R.K. Newman and C.W. Newman. 1997. Comparative cholesterol-
lowering effects of barley β-glucan and barley oil in golden Syrian hamsters. Nutrition
research 17: 77-88.
Wegulo, S.N. 2012. Factors influencing deoxynivalenol accumulation in small grain cereals.
Toxins 4: 1157-1180.
Wegulo, S.N., T.A. Jackson, P.S. Baenziger, M.P. Carlson and J.H. Nopsa. 2008. Fusarium Head
Blight of Wheat.
Wiese, M.V. 1987. Compendium of Wheat Diseases. 2nd ed. American Phytopathological
Society, St. Paul, MN.
Wise, K. and C. Woloshuk. 2010. Fusarium Head Blight (Head Scab). Diseases of Wheat.
Purdue University.
Zhu, H., L. Gilchrist, P. Hayes, A. Kleinhofs, D. Kudrna, Z. Liu, et al. 1999. Does function
follow form? Principal QTLs for Fusarium head blight (FHB) resistance are coincident
with QTLs for inflorescence traits and plant height in a doubled-haploid population of
barley. Theoretical and Applied Genetics 99: 1221-1232.

25

26

27
Chapter 2
Quantitative Trait Loci for Resistance to Fusarium Head Blight in the Hulless Winter Barley
Cultivar Eve

28
ABSTRACT
Fusarium head blight (FHB), caused by Fusarium graminearum Schwabe, is a
devastating fungal disease that affects barley (Hordeum vulgare) production worldwide. This
disease results in reduced yields, damaged kernels, and accumulation of mycotoxins in the grain.
The most effective means of FHB control can be achieved by deployment of FHB resistant
cultivars developed via incorporation and pyramiding of resistance genes from diverse sources.
Resistance to FHB in the winter barley cultivar Eve has been validated in Virginia Tech’s Small
Grains Breeding Program. The objectives of this study were to map and identify the quantitative
trait loci (QTL) for FHB resistance in Eve, and to identify tightly linked, diagnostic, and high-
throughput markers for use in marker assisted selection (MAS) in breeding programs. A
population of 180 recombinant inbred lines (RILs) derived from the cross Eve/’Doyce’ was
evaluated for FHB incidence (Inc), FHB severity (Sev), Fusarium damaged kernels (FDK), and
deoxynivalenol (DON) over two growing seasons (2014-15 and 2015-16) at Blacksburg, VA,
Mount Holly, VA, Kinston, NC, and Lexington, KY. A QTL was identified on chromosome 6H
associated with FHB SEV, FDK, and DON. The QTL accounted for as high as 14.5% of the
phenotypic variation for DON accumulation, 8.3% for FHB SEV, and 11.9% to 17.6% for FDK.
The QTL marker region spans 56.5 to 66.6 cM with flanking markers SCRI_RS_147342 and
Bmag0613 that are 10.1 cM apart. Other QTL for morphological traits, heading date and height,
were also found in the same region as the FHB resistance traits. Phenotypic variation explained
by the QTL was 15.5% for heading date and 6.6% for plant height. Diagnostic single nucleotide
polymorphism (SNP) markers associated with the FHB resistance QTL in Eve can be used to
genotype and select barley parental lines and in MAS breeding to incorporate and pyramid
diverse FHB resistance QTL and genes into adapted cultivars.

29
INTRODUCTION
Fusarium head blight (FHB), caused by Fusarium graminearum Schwabe, is a
devastating fungal disease that affects barley production worldwide (Zhu et al., 1999). FHB can
cause reductions in grain yields, test weights, seed germination, kernel quality, and
contamination by mycotoxins (McMullen et al., 1997). The most effective way to manage FHB
is through the use of resistant barley cultivars. Although this is the most effective way to manage
FHB, completely resistant cultivars are not currently available to producers. Resistance to FHB
is race non-specific, has low heritability, and is influenced by environmental factors, which
makes breeding for resistance complex (Massman et al., 2011, Zhu et al., 1999). Breeding for
FHB resistance requires gene pyramiding from various sources to achieve an adequate level of
resistance. There are five types of resistance to FHB in wheat (Triticum aestivum) and barley.
Types I, II, and III are considered the main types of resistance. Type I is resistance to initial
infection (Schroeder and Christensen, 1963), type II is resistance to the spread of the pathogen
throughout the spike (Rudd et al., 2001) and type III is resistance to the synthesis and
accumulation of deoxynivalenol (DON) (Zhu et al., 1999). FHB resistance has been identified on
all seven chromosomes in the barley genome, with the most common resistance found on
chromosomes 2H and 6H (Berger et al., 2014, Mesfin et al., 2003). Resistance traits for FHB are
often associated with each other, meaning that selection for resistance to severity may also
indirectly select for reduced Fusarium damaged kernels (FDK) and DON accumulation as well.
Resistance has been identified in spring barley varieties such as ‘Chevron’, ‘Fredrickson’, and
CIho 4196. Although these varieties display resistance to FHB, they often have poor agronomic
traits, such as poor yield, and therefore are undesirable for production. Research conducted by
Berger et al. (2014), identified potential unique sources of FHB resistance in winter barley
cultivars Eve and Nomini in Virginia Tech’s Small Grains Breeding Program. Based on the
study performed by Berger et al. (2014), it was hypothesized that FHB resistance in the hulless
winter barley cultivar Eve is different than in previously reported sources. The purpose of this
research was to: 1) validate the potential uniqueness of QTL for resistance to FHB in Eve versus
those previously mapped on chromosomes 2H and 6H; 2) search for additional resistance QTL
within the Eve mapping population; and 3) identify tightly linked and diagnostic markers for use
in MAS breeding programs.

30
MATERIALS AND METHODS
Plant Material
A recombinant inbred line (RIL) population, initially consisting of 459 individuals lines,
was created to map QTL for FHB resistance in Eve (PI 659067), a Virginia Tech hulless winter
barley cultivar (Brooks et al., 2013). Eve, which is moderately resistant to FHB, was crossed
with the FHB susceptible barley cultivar Doyce (PI 634932) (Brooks et al., 2005). Eve was
derived from the cross SC860974/VA94-42-13. Parentage of SC860974 is VA75-42-45 /
SC793556 // CIho 2457. Ancestry of VA75-42-45 is ‘Jotun’ (PI 467357) / 4*’Rogers’ (PI
539127) /3/ ’Cebada Capa’ (PI 539113) / ’Wong’ (PI 539117) // awnleted selection of ‘Hudson’
(CIho 8067). Line SC793556 is a reselection from ‘Redhill’ (CIho 15830) and ‘Lokian’ (CIho
2457) is a hulless winter-habit barley from China. VA94-42-13 was derived from a series of
crosses comprised of (CIho's 9623, 9658, 9708, BYDV Resistant ‘Atlas’ / ’Hanover’ (CIho
13197) or ‘Rapidan’ (CIho 14006) /4/ 2*(‘Harrison’ (CIho 10667) /3/ Cebada Capa / Wong //
awnleted selection of Hudson) /6/ (Harrison /3/ Cebada Capa / Wong // awnleted selection of
Hudson)*4 /4/ ’La Mesita’ (CIho 7565) /5/ (CIho's 9623, 9658, 9708, BYDV Res Atlas /
Hanover or Rapidan) /4/ (Harrison /3/ Cebada Capa / Wong // awnleted selection of Hudson). It
is postulated that Eve likely inherited its FHB resistance from the parent VA94-42-13, since it
parentage includes ‘Chevron’.
From the initial population, a set of 284 F5:6 RILs (Virginia and Lake Wheeler, NC tests)
and 212 RILs included in the former set (other tests in KY and NC) were randomly selected from
the Eve/Doyce mapping population and evaluated for FHB in 2014-15 experiment. From the
RILs evaluated during 2014-15, 180 F6:7 RILs were selected, based on FHB resistance and
susceptibility, from the set of 284 RILs and evaluated for FHB during 2015-16.
Seed from each of the Eve/Doyce RILs included in the 2014-15 experiments was derived
from individually harvested F4:5 head rows grown at the USDA-ARS research station in
Aberdeen, Idaho (latitude 42⁰ 57’ 25” N and longitude 112⁰ 49’ 43’ W). Seed from the RILs
used in the 2015-16 experiments was derived from four F5:6 head rows that were harvested in
bulk using a Wintersteiger plot combine (Wintersteiger, Salt Lake City, UT) at Warsaw, VA.
Seed of the RILs used in each of the experiments was treated with Raxil-MD® (Tebuconazole,
Metalaxyl and Imazalil, Bayer Crop Science) and Gaucho® (Imidacloprid, Bayer Crop Science)
31
prior to planting each year. Treatment of the seed with Raxil-MD® and Gaucho® was used to
limit infection of plants with glume blotch (Stagonospora nodorum formerly Septoria nodorum)
and barley yellow dwarf (pathogen Barley Yellow Dwarf Virus). Subsamples of treated seed of
each RIL were used to plant tests in Virginia as well as at other testing sites by cooperators in
both 2014-15 and 2015-16 growing seasons.
Inoculum
The Fusarium inoculum used in this experiment was composed of various isolates from
the respective state or region in which each test was conducted. The Fusarium isolates used to
produce inoculum for field tests in Virginia were obtained from the lab of Dr. David Schmale, III
in the department of Plant Pathology, Physiology, and Weed Science at Virginia Tech. The
native isolates used in this study are: GPS13#14, GPS8#12, GPS12#8, KBTappN5, KBTappN10,
and KBTappN27. Full strength potato dextrose agar (PDA) media (39g potato dextrose agar in
1L of deionized water; Becton, Dickinson, and Company, Sparks, MD) was used to culture
Fusarium graminearum for 14 days. Corn kernels (Zea mays L.) were soaked in water over night
and placed in autoclave bags (Fisher Scientific catalog # 018267) for sterilization. The corn
kernels were steam sterilized for 24 hours and allowed to cool to room temperature (21⁰C)
before being inoculated with fungal mycelium. Fungal mycelium was cut into 1cm2 pieces,
placed into the autoclave bags with the sterilized corn kernels, and was allowed to incubate for
21 days at room temperature. After incubation, the mycelium colonized corn kernels were
allowed to dry on trays from four to seven days in the greenhouse. One quarter strength PDA (6g
potato dextrose broth and 15g granulated agar in 1L of deionized water; Becton, Dickinson and
Company, Sparks, MD) was used to culture macroconidia that were used to create inoculum
solutions sprayed onto barley spikes in field tests. Macroconidia were allowed to develop for 10
days, then harvested and adjusted to a concentration of 50,000 spores per mL-1 using distilled
water. Spore suspensions were prepared the day of field inoculation.
Field Tests
During the 2014-15 growing season, 284 RILs (F5:6), resistant and susceptible checks,
and parental lines were evaluated for FHB traits at three locations; Blacksburg, VA (BVA,
latitude 37⁰ 11’ 59” N and longitude 80⁰ 35’ 52” W; two replications, two head rows per entry)

32
Mount Holly, VA (MHV, latitude 38⁰ 5’ 50” N and longitude 76⁰ 43’ 30” W; two replications,
two head rows per entry), and Lake Wheeler, NC (LWN, 35⁰ 43’ 39” N and 78⁰ 40’ 47” W; one
replication, one head row per entry). A set of 212 RILs (F5:6), resistant and susceptible checks,
and parental lines were evaluated for FHB traits during the 2014-15 growing season at two
locations; Kinston, NC (KNC, latitude 35⁰ 18’ 04” N and 77⁰ 33’ 54” W longitude; two
replications, one head row per entry) and Lexington, KY (LKY, latitude 38⁰ 7’ 31” N and
longitude 84⁰ 29’ 44” W; two replications, one head row per entry). During the 2015-16 growing
season 180 RILs, with resistant and susceptible checks, were evaluated, using the same design as
in the previous experiments, for FHB traits at four locations: BVA and MHV, KNC, and LKY.
Resistant checks included winter barley cultivars Dan (PI 659066) and Nomini (PI 566929).
Susceptible checks included winter barley varieties ‘Atlantic’ (PI 665041), ‘Thoroughbred’ (PI
6349333), and VA07H-35WS (Thoroughbred/SC872143) (Berger et al., 2014). Heading date
varied among the resistant and susceptible check varieties to monitor and assess disease
incidence and severity among early and later heading lines at each test site.
The 2014-15 and 2015-16 scab nursery tests at all locations were composed of two
replications in a randomized complete block design (RCBD) that included Eve/Doyce RILs,
resistant and susceptible check cultivars, and parental lines dispersed throughout each
replication. During both growing seasons at BVA and MHV, each experimental unit consisted
of two adjacent head rows that were 1.2m in length and had 0.3m spacing in between each row.
Test plots at KNC during both growing seasons consisted of two adjacent head rows that were
1.2 m in length and had 0.15 m spacing in between each row.
For both growing seasons at BVA, MHV, and KNC, scab nursery management practices
included: a standard recommended application of fall pre-plant fertilizer, Harmony Extra SG®
(Thifensulfuron methyl) herbicide, and at GS30 (Zadoks et al., 1974) a top dress application of
nitrogen as UAN (30% Urea ammonium nitrate solution) (Table 2.1 and 2.2). During 2014-15
and 2015-16 in the BVA scab nursery, management practices also included application of
Baythroid XL® (β-cyfluthrin) insecticide at a rate of 1.10 L ha-1 and 1.46 L ha-1 respectively; and
an application of Tilt® fungicide at a rate of 1.46 L ha-1. In the 2014-15 and 2015-16 scab nursery
at MHV management practices included application of Starane® Ultra (fluroxygyr 1-
methylhyeptyl ester) herbicide applied at a rate of 9.866 L ha-1 with Weedar® (2,4-D Amine)

33
herbicide at a rate of 11.692 L ha-1; Palisade® (Trinexapac-ethyl) growth regulator at 7.308 L ha-
1; and Tombstone® insecticide (Cyfluthrin) at 1.462 L ha-1. For both growing seasons at KNC,
the scab nursery management practices also included applications of potassium (K) and
phosphorus (K), based on soil tests performed pre-planting and application of Osprey® herbicide
(Mesosulfuron-Methyl) to control ryegrass (Lolium perenne) populations.
Fusarium colonized corn kernels were applied to experimental units at all locations at the
early boot stage for each growing season (Tables 2.1 and 2.2). During both growing seasons at
BVA, each plot was spray inoculated when 50% of the plants were at anthesis using a CO2-
pressurized sprayer (R and D Sprayers, Opelousas, LA) with 50mL of macroconidia spore
suspension (concentration of 50,000 spores mL-1). Fusarium isolates used for inoculation at KNC
were randomly collected each year (Paul Murphy, personal communication, 2014).
The nurseries at all locations were mist irrigated, unless natural precipitation occurred,
for three weeks after initial inoculation for both growing seasons. Both Virginia locations were
then mist irrigated for one hour each day between the hours of 3:00pm to 4:00pm. At KNC the
scab nursery was mist irrigated twice daily between the hours of 8:00am to 11:00am and 4:00pm
and 7:00pm, for two minutes on, 18 minutes off intervals. At LKY the nursery was mist irrigated
overnight, between the hours of 8:00pm and 7:00am, at 20 minute intervals.
During both test years and at all locations, 20 randomly chosen barley spikes were
selected for FHB assessment 21 days after inoculation in each RIL, resistant and susceptible
check, and parental experimental units. The phenotypic traits evaluated in each plot during both
growing seasons included heading date (Julian), plant height (cm), FHB incidence (Inc), and
FHB severity (Sev). Height was not recorded at MHV and KNC. FHB Inc is the percentage of
FHB infected heads out of 20 arbitrarily selected heads per plot. FHB Sev is the number of FHB
infected spikelets divided by the total number of spikelets per barley spike, for the 20 arbitrarily
chosen barley heads per plot.
In 2015, both replications were harvested at MHV, KNC, and LKY, but only the first
replication of RILs was harvested at BVA because of poor plant stands due to flooding that
occurred throughout the second replication (Table 2.1). In 2016 both replications at BVA, MHV,
and LKY were harvested (Table 2.2). In 2015-16, RILs at KNC were not harvested due to frost
damage that occurred after heading making it impossible to accurately distinguish the difference

34
between damage caused by frost versus FHB. Harvest occurred when plots reached maturity
(moisture <16%) using Wintersteiger plot combines set at low fan speeds to minimize loss of
Fusarium damaged kernels during harvest. Samples from KNC and LKY were transported back
to BVA where they were threshed using a Wintersteiger plot combine set at a low fan speeds.
Upon completion of harvest, a subsample of all genotypes was taken from each experimental
unit and cleaned using a screen cleaner without air, to limit the loss of Fusarium infected kernels,
to remove any excess debris or chaff. A 5g subsample from each genotype was taken and used
for FDK and a 100g was taken for DON analysis (Berger et al., 2014).
FDK and Deoxynivalenol Evaluation
FDK was calculated as the percentage of tombstone or scabby kernels out of 100 kernels.
The 100g subsample taken for DON analysis was ground down into whole barley flour and a 1g
subsample was sent to Dr. Schmale’s lab at Virginia Tech for analysis using a Shimadzu QP2010
GC/MS (gas chromatography/ mass spectrometry; Shimadzu Corporation, Kyoto, Japan; (Tacke
and Casper, 1995) according to protocol describe by Mirocha et al. (1998).
DNA Collection
The RILs, at the F5:6 generation, and parental lines were grown in a greenhouse and
harvested at the two leaf stage. Leaf tissue was placed into 96 well plates, that were composed of
twelve 1.2ml strip tubes (Corning catalog #4408; Corning, Corning, New York) containing a
steel bead for grinding. A second steel bead was added to each tube after tissue was added to aid
in the grinding process. The tissue was stored in a -80⁰C freezer until ready for extraction. To
ensure that the tissue was completely frozen before grinding, the tissue was placed into liquid
nitrogen for a minimum of five minutes. Once frozen, the tissue was ground down in a Spex®
SamplePrep 2010 Geno/Grinder® (Metuchen, NJ) at 1,250 strokes for one minute or until finely
ground. DNA isolation was performed using the CTAB extraction method, with minor
modifications, as described by Saghai-Maroof et al. (1984, 1994).
Genotyping
For genotypic analysis, two types of molecular markers were used: single nucleotide
polymorphisms (SNPs) and single sequence repeats (SSRs). Genotyping using SNP markers was
conducted at both the USDA-ARS lab in Fargo, ND and at Virginia Tech, while SSR markers

35
were run and analyzed only at Virginia Tech. A set of 48 RILs were selected based on FHB
assessments, from five locations between both growing seasons, 24 with high severity, FDK, and
DON ratings and 24 with low severity, FDK, and DON ratings. These 48 RILs and parent DNA
was sent to the USDA lab in Fargo, ND for SNP analysis on an Illumina® 9K iSelect SNP chip
(Illumina, San Diego, CA). Data received from the 9K iSelect SNP chip was analyzed using
GenomeStudio® software (Illumina, San Diego, CA). Based on the results from the 9K iSelect,
eleven polymorphic SNP primers were designed by Dr. Luciana Rosso at Virginia Tech and
produced by Integrated DNA Technologies (Integrated DNA Technologies, Coralville, IA). A
bulk segregate analysis (Michelmore et al., 1991) was conducted on the full population, 180
RILs plus parent lines, at Virginia Tech using SNP and direct-labeled SSR molecular markers.
Three out of nine SSR markers and the 11 SNP markers designed for this mapping population
were polymorphic. Markers that were significant for FHB assessment traits were used to analyze
all 180 RILs in the Eve/Doyce mapping population.
SNP polymerase chain reaction (PCR) was conducted at a volume of 8.11µL containing:
4 µL of 25ng (aqueous DNA), 4µL of KASP® master mix (LGC, Indianapolis, IN), and 0.11 µL
of 72x assay mix (12 µL of 100 µM AL1 primer, 12 µL of 100 µM of AL2 primer, 30 µL of 100
µM C1 primer, and 46 µL of deionized water). PCR reactions were conducted in 0.2 mL semi-
skirt PCR plates (USA Scientific, catalog # 1402-9790, Ocala, FL) using a Hydrocycler-4® (LGC,
Indianapolis, IN). PCR reaction proceeded sequentially: 1) 94⁰C for 15 minutes, 1 cycle; 2) 94⁰C
for 20 secs, 65⁰C for 1 min, 10 cycles with 0.8⁰C down at each cycle; and 3) 94⁰C for 20 secs,
57⁰ C for 1 min, 35 cycles. PCR product was analyzed using FLUOstar Omega Microplate
Reader® (BMG Labtech, Offenburg, Germany). Klustercaller™ (LGC, Indianapolis, IN) was
used to call the alleles for each marker.
The PCR of direct labelled SSR markers was conducted, using a modified protocol
described by Röder et al. (1998), at a volume of 12.5 µL containing: 2.5 µL of 25ng (aqueous
DNA), 1.2 µL of 10 x standard reaction buffer with MgCl2, 0.3 µL of 10mM dNTP, 0.2 µL of
forward primer, 0.2 µL of reverse primer, 7.42 µL of molecular grade H2O, and 0.18 µL of Taq
polymerase (Apex, Genessee Scientific, San Diego, CA). The fluorescent dyes that were attached
to the direct labeled primer are: FAM, VIC, NED, and PET (Applied Biosystems, Foster City,
CA). PCR reactions were performed using GeneAmp® PCR System 9700 (Applied Biosystems,
36
Foster City, CA), iCycler Thermocycler™ (Bio-Rad, Hercules, CA), and C1000™ Thermocycler
(Bio-Rad, Hercules, CA). PCR reaction proceeded sequentially: 1) 95⁰C for 5 min, 1 cycle; 2)
95⁰C for 45 sec, 60⁰C for 1 min, 72⁰C for 1.5 min, 34 cycles; and 3) a final extension at 72⁰C for
5 min, 1 cycle. The annealing temperatures optimized for each individual primer differed and
were optimized for each primer pair.
SSR fragments were analyzed using a 3130lx Genetic Analyzer (Applied Biosystems,
Foster City, CA). A 14 µL solution consisting of 9.75 µL of 95% formamide (Applied
Biosystems, Foster City, CA), 0.25 µL of Gene Scan™ - 500 LIZ® size standard (Applied
Biosystems, Foster City, CA) and 1 µL of FAM, VIC, NED, and PET PCR product. Alleles were
called for each marker based on allele fragment size using Genemarker V1.6 software
(SoftGenetics, State College, PA).
Statistical Analysis
The raw phenotypic data, that was averaged between repetitions at each location, was
used for analysis. Data was not normalized since normalization could lead to the loss of
transgressive segregates, which are individuals that exhibit extreme high or low FHB resistance
within the mapping population (see Appendix Figure A1). A transgressive segregate is an
individual that shows an extreme phenotype when compared to phenotype observed in the parent
lines while an outlier is an observation that is found to abnormally distant from the sample
population. When using a bi-parental mapping population, it is expected to observe transgressive
segregates within the population. FHB assessments for each RIL were assessed for outliers
through scatter plots developed in JMP Pro 13 (Cary, NC) (see Appendix Figure A2). Outliers
were determined if there was abnormal variation between repetitions of the same RIL, i.e. if the
RIL showed resistance in repetition one and susceptibility in repetition two. If a RIL was
determine to be an outlier for the phenotypic data recorded in the field, that RIL was dropped
from analysis for that specific environment. If the RIL was determined an outlier for any of the
post-harvest disease assessments, the sample was re-sampled from the original source and
retested for that specific disease assessment. If the result was the same as the original outlier
result, the RIL was then removed from analysis for that given location. Outliers were removed
from analysis to ensure an accurate depiction of FHB resistance was observed in each nursery at
each location.

37
Phenotypic data was analyzed using R (version 3.3.3, Baltimore, MD). Pairwise
correlations were estimated between heading date (HD), plant height (HT), FHB Inc, FHB Sev,
FDK, and DON for the 48 individuals screened with the Illumina® 9K iSelect. The QTL analysis
was performed using QTL IciMapping (ICIM, version 4.1.1) with Kosambi’s mapping function
(Kosambi, 1943) and a LOD score of 3.0. A thousand permutations were conducted at a
threshold p-value of 0.05 to determine LOD score. Consensus maps by Varshney et al. (2007)
and Muñoz et al. (2011) were used to confirm marker order. Interval and composite interval
mapping was performed to identify significant QTL regions. Construction of linkage maps was
performed using ICIM and Mapchart 2.3 (Voorrips, 2002) was used to draw linkage maps.
RESULTS
Phenotypic Analysis
Distribution of RILs in the Eve/Doyce mapping population were constructed based on the
phenotypic assessments of FHB Inc, FHB Sev, FDK and DON for each growing season (2014-
15 and 2015-16) and each test location (BVA, LKY, KNC, and MHV). RILs typically displayed
a normal distribution for each trait, with a few exceptions at some of the test locations. DON of
RILs at KNC in 2014-15 was skewed towards lower concentrations (Figure 2.1). In the 2014-15
LKY and MHV experiments, incidence and FDK were skewed towards higher levels (Figures
2.2 and 2.3). In the 2015-16 BVA test, severity and DON were skewed towards lower levels
(Figure 2.4). At LKY in 2015-16, incidence was skewed towards higher levels (Figure 2.5).
Traits for which RIL distributions were skewed towards either higher (FDK and/or incidence) or
lower (severity and/or DON) levels likely were due to environmental factors that influenced
disease development and progression at the given test location. Parent lines displayed
appropriate responses for each trait, i.e. Eve displayed a resistant response while Doyce
displayed a susceptible response for all tests except for incidence at MHV in 2014-15 where both
parents displayed the same response (Figure 2.3). High disease pressure at MHV may have
caused parent lines to display the same response for incidence during 2014-15.
Data for FHB traits partitioned on the basis of heading date or height classes (high,
medium and low values) was analyzed in an effort to determine possible interactions between
these morphological characteristics and FHB traits (Figures 2.6 and 2.7). RILs were categorized

38
into classes (high, medium, or low mean values) based on either height or heading date. When
grouped by height there was no statistical difference between the classes for heading date or
incidence, but there were statistical differences between classes for severity, FDK and DON
(Figure 2.6). When grouped by heading date there was no statistical difference between the
classes for FDK, but there were statistical differences between classes for height, incidence,
severity, and DON (Figure 2.7).
Significant positive correlations were found between incidence, severity and DON at
BVA during 2015-16, MHV during 2014-15, and LKY in 2014-15 and 2015-16 (Figure 2.8).
Morphological traits such as heading date and height were significantly correlated to each other
as well as FHB traits across both growing seasons and locations except KNC (Figure 2.8).
Generally, significant correlations were not observed between 2014-15 KNC and the other
experimental sites. Stronger correlations were generally observed between FHB traits with
heading date or height in the 2015-16 BVA and during both growing season at LKY (Figure 2.8).
Genotypic Analysis
From the Illumina® 9K iSelect SNP chip, 330 polymorphic markers were found between
the parents, Eve and Doyce. Among those 330 polymorphic markers dispersed across all seven
chromosomes, only 11 markers on chromosome 6H were significantly associated with FHB
resistance. An additional nine SSR markers were analyzed to further facilitate construction of a
linkage map, and three of them were polymorphic among the parents and RILs. All seven
chromosomes were mapped, but the only significant linkage group was on chromosome 6H
within the mapping population. Consensus maps constructed from Muñoz et al. (2011) and
Varshney et al. (2007) were used to confirm the location of the identified QTL. The linkage map
for chromosome 6H contains a resistance QTL associated with FHB Inc, FHB Sev, FDK, and
DON as well as the morphological traits heading date and plant height (Figure 2.9).
The QTL region identified on chromosome 6H is derived from the moderately resistant
FHB parent Eve. The QTL marker region spans from SCRI_RS_147342 – Bmag0613 (56.5 –
66.6 cM), with significant LOD values ranging from 3.2 – 10.6 (Table 2.3). QTL associated with
heading date and plant height at LKY during 2015-16 spans the marker interval
SCRI_RS_147342 – BOPA1_4676-1-1-59 (56.5 – 60.0 cM). The QTL was significant with
LODs of 10.6 and explained 25.2% of the phenotypic variation. In the same marker interval,

39
QTL associated with FHB Sev and FDK also were observed and explained 5.6% to 8.1% and
11.9% to 17.6% of the phenotypic variation, respectively. The QTL association with DON was
consistent across multiple locations and years with the most significant locations being KNC
(LOD 4.51) and MHV (LOD 3.59) during 2014-15. The marker interval associated with reduced
DON concentration explained 8.95% and 14.5% of the phenotypic variation. In the same marker
interval as DON, a QTL associated with height was also identified at LKY in 2014-15 and BVA
in 2015-16 with LOD scores of 6.22 and 6.33, respectively.
DISCUSSION
FHB resistance has been previously identified on all seven chromosomes in the barley
genome (Mesfin et al., 2003). Previous research has identified numerous FHB resistance QTL on
chromosome 6H associated with lower FHB Sev and reduced DON accumulation in hulled, two
row, spring barley cultivars such as Fredrickson (Canci et al., 2004, Dahleen et al., 2003, Ma et
al., 2000, Mesfin et al., 2003). Research conducted by Berger et al. (2014), identified several
potential sources of FHB resistance in the Virginia Tech Small Grains Breeding Program,
including the hulless winter cultivar Eve. FHB resistance has been difficult to identify and
incorporate into small grains breeding programs due to its quantitative nature, low heritability,
association with morphological traits, and the strong influence by environmental factors
(Massman et al., 2011, Zhu et al., 1999). In the current study, a FHB resistance QTL on
chromosome 6H was identified in the hulless, winter, six row, cultivar Eve that is associated with
reduced FHB Sev, DON accumulation, and FDK.
Previous mapping studies conducted on FHB resistance used SSR and restricted fragment
length polymorphisms (RFLPs) to identify resistance QTL and construct linkage maps. Varshney
et al. (2007) constructed a consensus map including identified FHB resistance QTL across the
entire barley genome. Significant SSR markers, Bmag0613 and GBM1021, that are associated
with FHB resistance, were identified and analyzed in the Eve/Doyce mapping population and
reside in the same relative position on the constructed chromosome 6H consensus map. Recent
studies have incorporated and identified SNP markers associated with FHB resistance due to
their reduced cost and precision. Muñoz et al. (2011) develped an improved consensus map that
contains 2,994 SNP loci that are mapped to 1,163 unique positions. Although this consensus map

40
contains numerous SNP markers, it does not primarily focus on SNP markers associated with
FHB resistance. Diagnostic markers such as the 11 identified in the Eve/Doyce mapping
popuation can be useful in incorporating and pyramiding QTL and/or genes from diverse sources
of FHB resistance into adapted varieties.
The FHB resistance QTL identified in the Eve/Doyce mapping population was identified
using SNP markers and covers the marker interval from SCRI_RS_147342 – BOPA1_8220-
1223. This region spans approximately 3.5 cM (56.5 – 60.0 cM) with the SSR marker
Bmag0613 as one of the flanking markers (66.6 cM). SSR marker positions for GBM1021 and
Bmag0613 were compared to the consensus map created by Varshney et al. (2007) to confirm
the identified FHB resistant QTL. The QTL was consistently associated with reduced DON
accumulation, across multiple locations and years, and explained as much as 14.5% of the
phenotypic variation. Reduced DON accumulation is a critical form of resistance due DON’s
significant impact on barley producers. Research conducted by Canci et al (2004), Dahleen et al.
(2003), and Ma et al. (2000) reported resistance to DON accumulation on chromosome 6H. A
QTL associated with lower FHB Sev was identified on 6H within the marker interval
SCRI_RS_147342 – BOPA1_4676-1-1-59 across two locations and both growing seasons, and
explained up to 8.1 % of the phenotypic variation. Canci et al. (2004), Dahleen et al. (2003), Ma
et al. (2000), and Mesfin et al. (2003) reported resistance associated with FHB Sev on
chromosome 6H. Canci et al. (2004) reported FHB resistance in a similar region on 6H, using a
mapping population derived from Chevron that also was identified in the current study.
Resistance to FDK was identified in the same marker interval as FHB Sev at two locations over
both growing seasons and accounted for 11.9 % to 17.6% of the phenotypic variation. It is often
common to see multiple FHB resistance traits identified in the same QTL region, which indicates
that selection for resistance to FHB Sev or FDK may indirectly select for resistance to DON
accumulation.
Although a significant QTL associated with FHB resistance was identified on
chromosome 6H in this study, the morphological traits heading date and plant height were also
associated with this region. A QTL associated with heading date and height was consistent
between two locations over both growing seasons and mapped near the same interval region
associated with reduced DON accumulation. Height was also identified in the same marker

41
region as FHB Sev and FDK. The question arises as to whether the QTL is conferring actual
resistance or if heading date or height are indirectly influencing FHB resistance. Nduulu et al.
(2007) performed a study to determine if the linkage between heading date and FHB resistance
could be broken. Nduulu et al. (2007) identified only one recombinant line out 1,500 NILs
screened in which the negative linkage between heading date and FHB resistance was broken.
Although it was proven possible, breaking the linkage between morphological traits such as
heading date and FHB resistance may be extremely difficult to achieve.
Through phenotypic and genotypic analysis performed in the current study, a QTL for
FHB resistance on chromosome 6H in Eve was identified and confirmed to be similar to
previously reported QTL on chromosome 6H. Based on these results, we reject the initial
hypothesis proposed by Berger et al. (2014) and conclude that the FHB resistance identified in
Eve is not uniquely different than previously identified FHB resistance. Previous studies have
identified FHB resistance QTL near or in the same region on chromosome 6H (Canci et al.,
2004, Dahleen et al., 2003, Ma et al., 2000, Mesfin et al., 2003). The QTL identified was found
to be associated with lower FHB Sev, FDK, and DON accumulation as well as affecting heading
date and height. Although the FHB resistant QTL identified is not unique, the diagnostic SNP
makers identified in this study will facilitate rapid high-throughput genotyping and
implementation of more efficient MAS breeding to incorporate and pyramid FHB resistance
QTL and genes into adapted cultivars.

42
LITERATURE CITED
Berger, G., A. Green, P. Khatibi, W. Brooks, L. Rosso, S. Liu, et al. 2014. Characterization of
Fusarium Head Blight Resistance and Deoxynivalenol Accumulation in Hulled and
Hulless Winter Barley. Plant Disease 98: 599-606.
Brooks, W., M. Vaughn, G. Berger, C. Griffey, W. Thomason, J. Paling, et al. 2013. Registration
of ‘Eve’winter hulless barley. Journal of Plant Registrations 7: 5-11.
Brooks, W., M. Vaughn, C. Griffey, A. Price, T. Pridgen, W. Rohrer, et al. 2005. Registration
of'Doyce'hulless barley. Crop science 45: 792-794.
Canci, P.C., L.M. Nduulu, G.J. Muehlbauer, R. Dill-Macky, D.C. Rasmusson and K.P. Smith.
2004. Validation of quantitative trait loci for Fusarium head blight and kernel
discoloration in barley. Molecular Breeding 14: 91-104.
Dahleen, L., H. Agrama, R. Horsley, B. Steffenson, P. Schwarz, A. Mesfin, et al. 2003.
Identification of QTLs associated with Fusarium head blight resistance in Zhedar 2
barley. Theoretical and applied genetics 108: 95-104.
Kosambi, D.D. 1943. The estimation of map distances from recombination values. Annals of
Eugenics 12: 172-175.
Ma, Z., B.J. Steffenson, L.K. Prom and N.L. Lapitan. 2000. Mapping of quantitative trait loci for
Fusarium head blight resistance in barley. Phytopathology 90: 1079-1088.
Massman, J., B. Cooper, R. Horsley, S. Neate, R. Dill-Macky, S. Chao, et al. 2011. Genome-
wide association mapping of Fusarium head blight resistance in contemporary barley
breeding germplasm. Molecular breeding 27: 439-454.
McMullen, M., R. Jones and D. Gallenberg. 1997. Scab of wheat and barley: a re-emerging
disease of devastating impact. Plant disease 81: 1340-1348.
Mesfin, A., K. Smith, R. Dill-Macky, C. Evans, R. Waugh, C. Gustus, et al. 2003. Quantitative
trait loci for Fusarium head blight resistance in barley detected in a two-rowed by six-
rowed population. Crop Science 43: 307-318.
Michelmore, R.W., I. Paran and R. Kesseli. 1991. Identification of markers linked to disease-
resistance genes by bulked segregant analysis: a rapid method to detect markers in
specific genomic regions by using segregating populations. Proceedings of the national
academy of sciences 88: 9828-9832.
Mirocha, C.J., E. Kolaczkowski, W. Xie, H. Yu and H. Jelen. 1998. Analysis of deoxynivalenol
and its derivatives (batch and single kernel) using gas chromatography/mass
spectrometry. Journal of Agricultural and Food Chemistry 46: 1414-1418.

43
Muñoz-Amatriaín, M., M.J. Moscou, P.R. Bhat, J.T. Svensson, J. Bartoš, P. Suchánková, et al.
2011. An improved consensus linkage map of barley based on flow-sorted chromosomes
and single nucleotide polymorphism markers. The Plant Genome 4: 238-249.
Nduulu, L., A. Mesfin, G. Muehlbauer and K. Smith. 2007. Analysis of the chromosome 2 (2H)
region of barley associated with the correlated traits Fusarium head blight resistance and
heading date. Theoretical and applied genetics 115: 561-570.
Rudd, J., R. Horsley, A. McKendry and E. Elias. 2001. Host plant resistance genes for Fusarium
head blight. Crop Science 41: 620-627.
Saghai-Maroof, M., K. Soliman, R.A. Jorgensen and R. Allard. 1984. Ribosomal DNA spacer-
length polymorphisms in barley: Mendelian inheritance, chromosomal location, and
population dynamics. Proceedings of the National Academy of Sciences 81: 8014-8018.
Sanghai-Maroof, M., R. Biyashev, G. Yang, Q. Zhang and R. Allard. 1994. Extraordinary
polymorphic microsatellite DNA in barley. Species diversity, chromasomal locations and
population dynamics. Proc. Natl. Acad. Sci 91: 5466-5470.
Schroeder, H. and J. Christensen. 1963. Factors affecting resistance of wheat to scab caused by
Gibberella zeae. Phytopathology 53: 831-838.
Tacke, B.K. and H.H. Casper. 1995. Determination of deoxynivalenol in wheat, barley, and malt
by column cleanup and gas chromatography with electron capture detection. Journal of
AOAC International 79: 472-475.
Varshney, R.K., T.C. Marcel, L. Ramsay, J. Russell, M.S. Röder, N. Stein, et al. 2007. A high
density barley microsatellite consensus map with 775 SSR loci. Theoretical and Applied
Genetics 114: 1091-1103.
Voorrips, R. 2002. MapChart: software for the graphical presentation of linkage maps and QTLs.
Journal of heredity 93: 77-78.
Zadoks, J.C., T.T. Chang and C.F. Konzak. 1974. A decimal code for the growth stages of
cereals. Weed research 14: 415-421.
Zhu, H., L. Gilchrist, P. Hayes, A. Kleinhofs, D. Kudrna, Z. Liu, et al. 1999. Does function
follow form? Principal QTLs for Fusarium head blight (FHB) resistance are coincident
with QTLs for inflorescence traits and plant height in a doubled-haploid population of
barley. Theoretical and Applied Genetics 99: 1221-1232.

44

45

46
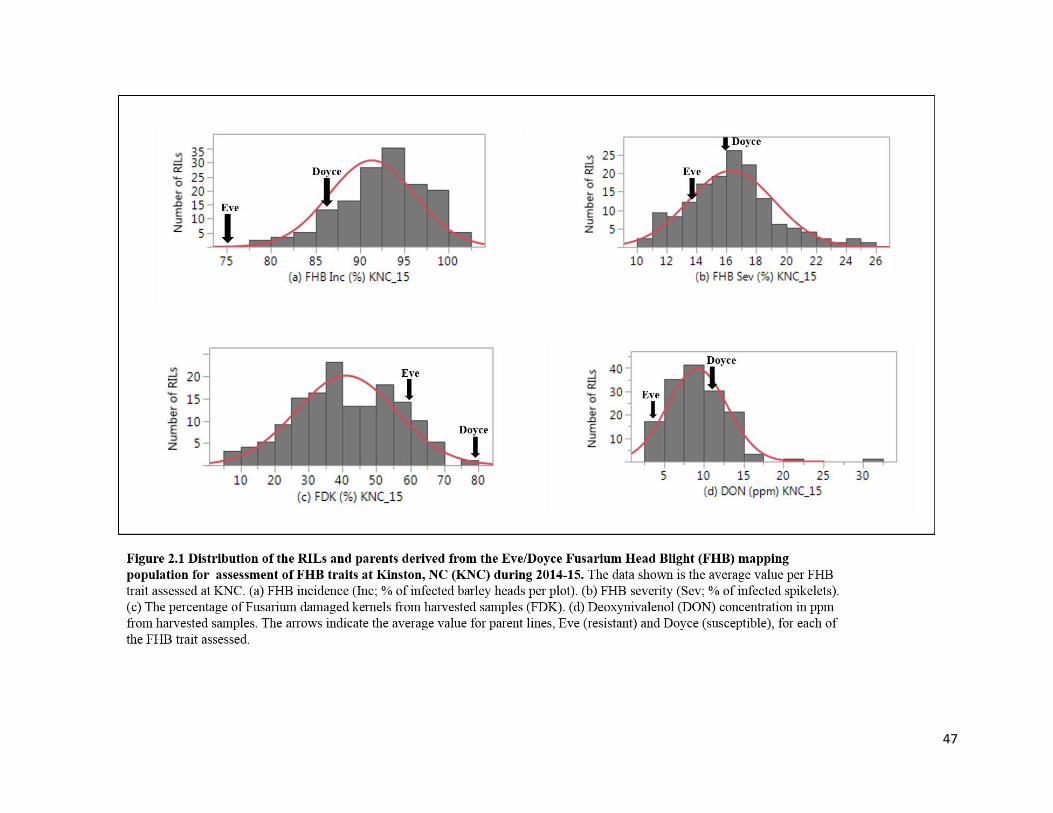
47

48

49

50

51

52

53

54

55

56
APPENDIX

57
APPENDIX