quarter 1 calculus test the attached problems do not ... · the attached problems do not comprise a...
TRANSCRIPT

Quarter 1 Calculus Test
The attached problems do not comprise a comprehensive test review.
As review, use: • this packet • your 3 quizzes and first test • your 3 quiz review packets and first test review packet (blank copies and solutions on web site) • worksheets on Derivative Sketching & Matching • worksheets on Increasing/Decreasing Functions • local extrema worksheet (solutions on web site)
Test topics
Average Rate of Change, Function Notation, Linear ModelsEverything we have learned about derivatives:finding derivative by power rule for polynomial functions and those with negative and fractional exponentsfinding equation of tangent line given function given graph of function (estimate slope of tangent line) given both graph of function and graph of derivativefinding points at which the derivative of a function is a certain value
sketching derivatives by finding slopes of tangent linesinterpreting derivativedistance vs. time graphs and velocity vs. time graphsmatching derivatives to functionsmaking a first derivative number lineidentifying intervals where a function is increasing/decreasing (using the derivative)identifying local min/max points using the first derivative test
Calculus Name: _______________
Additional Practice for Quarter Test
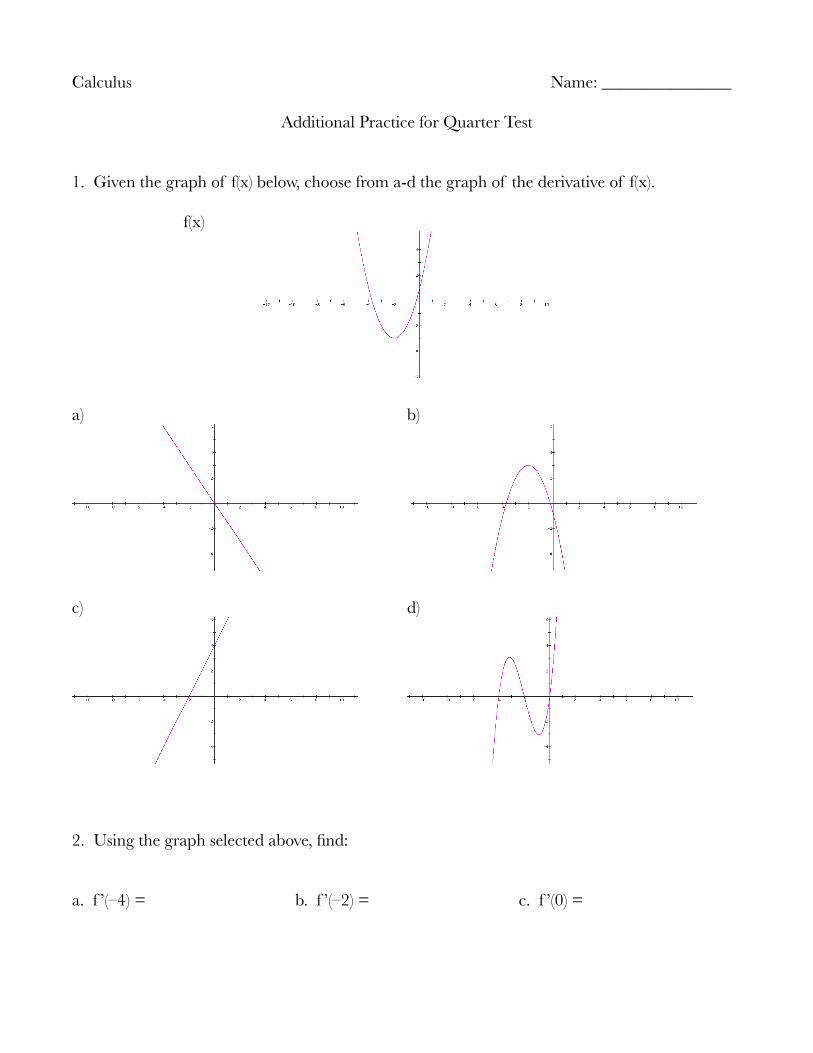
1. Given the graph of f(x) below, choose from a-d the graph of the derivative of f(x).
f(x)
a) b)
c) d)
2. Using the graph selected above, find:
a. f ’(–4) = b. f ’(–2) = c. f ’(0) =

3. Given the graph of f(x), sketch the derivative, f ’(x)
a.
b.
4. a. What is the AROC of f(x) = 2x2 + x – 6 on the interval from x = –1 to x = 4?
b. What is the instantaneous rate of change of f(x) at x = –1? _________

5. Find the derivative f(x) of each of the following functions.
a. f x( ) = −3x3 + 9x2 − 2x + 3 f ’(x) =
b. f x( ) = 2x3−4x2+1x−29 f ’(x) =
c. f x( ) = x3 − 2 x + x23 f ’(x) =
d. f x( ) = −2x + 3 f ’(x) =

6. The graphs of f(x) and f ’(x) are shown below.
Find the equations of the tangent lines at x = 0, x = 1, and x = 2.
Eq of tangent line at x = 0 ___________________
Eq of tangent line at x = 1 ___________________
Eq of tangent line at x = 2 ___________________
f(x) f ’(x)

7. The following graph represents the distance a car has travelled, in miles, vs. time, in hours.
a) What is the instantaneous speed of the car at each of the following times:
a. 1:30_______ b. 2:30_______ c. 3:30_______ d. 4:30_______
b) How far has the car travelled since noon at each of the following times:
a. 1:30_______ b. 2:30_______ c. 3:30_______ d. 4:30_______
c) What is the average speed since noon at each of the following times:
a. 1:30_______ b. 2:30_______ c. 3:30_______ d. 4:30_______
8. Draw a distance vs. time graph for the following situation:A car travels at a constant speed of 35 mph for 2 hours. At the two-hour mark, it quickly slows down and stops. The car remains stopped for 30 minutes, then quickly speeds up to a speed of 20 mph. It travels at a constant speed of 20 mph for for 15 minutes until it reaches its destination then it quickly comes to a stop.

9. The temperature, H, in degrees Fahrenheit, of a frozen pizza placed in a hot oven is given by H = f(t), where t is in minutes since the pizza was put in the oven.
a) Is f ’(t) positive or negative? Why?
b) What does f(10) = 115 mean in practical terms? What are the units of the numbers 10 and 115?
c) What does f ’(15) = 5 mean in practical terms? What are the units of f ’(15)?
d) Why might you expect f ’(40) to be zero?
10. Find the equation of the tangent line to the graph of the function at the given point.
f x( ) = 0.2x3 +0.1x2 −1.2x at x = –1

11. Given f x( ) = x3 + 3x2 + x − 2
a. find f ' x( )
b. For what x-values is the derivative equal to 0? Answers should be exact, not estimated from the graph. On the graph, sketch tangent lines at these x-values.
c. For what x-values is the derivative equal to 3? Answers should be exact, not estimated from the graph. On the graph, sketch tangent lines at these x-values.
Using the derivative, find the intervals on which each function is increasing and decreasing. Write the intervals in 2 < x < 4 format
12. y = −7x −10
13. y = 4x2 − x
14. y = −3x3 + 21x

Find the intervals on which the function is increasing and decreasing, and identify a possible graph of f(x). Note: you are given f '(x), not f(x), but you are describing, and identifying the graph of f(x).
15. Given the derivative f ’(x) = 6x2 – 8x –7Identify the intervals on which f(x) is:
increasing_______________ decreasing_______________ graph:___
16. Given the derivative f ’(x) = – 10x + 12Identify the intervals on which f(x) is:
increasing_______________ decreasing_______________ graph:___
17. Given the derivative f ’(x) = x3 + 9x2 – 3x – 20Identify the intervals on which f(x) is:
increasing____________________________________ graph:___
decreasing____________________________________

Possible graphs of f(x) for #15-17.
A B
C D
E F

G H
I J
K

This page for Ms. Blake's class only.
For each function, identify all local minima and maxima (local/relative extrema) of f(x). Give the x and y values for each point where possible. Justify your answer using the first derivative test.
18. f x( ) = x4 − 5x3 − 2x2 +1
local minima: _____________________ local maxima: ____________________
19. A function with critical points at (–1, 3) and (2, 7) for which the following is true about f ' x( )
local minima: _____________________ local maxima: ____________________
20. The graph of f ' x( ) is shown below.
Find the x-coordinates of the local extrema on the graph of f(x).
local min: _________________ local max: _______________
! –! + ! ! –
! x = –1! x = 2