quarterly biology reports
TRANSCRIPT

QUARTERLY BIOLOGY REPORTS
OWA
FISH AND GAME DMSION - BIOLOGY SECTION
STATE CONSERVATION CO:MMISSION

TABLE OF CONTENTS
ABSTRACTS OF PAPERS Pages- ] - IV
FISHERIES PAGE NO.
1.
2.
3.
Movement of Channel Catfish in Coralville Reservoir Larry R. Mitzner, Fi~heries-Biolog isl -------------------------·
Preliminary Investigations on the Bait Preference of Channel Catfish and Carp in Baited Hoop Nets
Don Kline & J. K. Mayhew, Fisheries Biologist--------------- 7
Aquatic Habitat of the Mississippi River Bordering Iowa-Don R. Helms, Fisheries Biologist--------------------------- 11
4. An Evaluation of Walleye Fry and Fingerling Stocking in Black Hawk Lake
Terry Jennings, Fisheries Biologist-- ------------.,------------ 15
GAME
1.
2.
3.
4.
5.
Iowa's 1968 Waterfowl and Dove Banding Program Richard Bishop, Game Biologist ------------~-------------- 19
Quail Studies on Two Areas in Southern Iowa, 1968 M. E. Stempel and Gene Hlavaka, Game Biologists----------- 30
Miscellaneous Deer Mortality, 1967 Paul D. Kline, Game Biologist------------------------- 38
Trends in Major Cultivated Crops in Iowa R. C. Nomsen, Game Biologi-st-------------------------- 44
Fall Mourning Dove Migration Patterns in Iowa- 1967 & 1968 Eugene D. Klonglan, Asst. Supt. of Biology----------------- 47
6
- 10
14
- 18
- 29
- 37
- 43
- 46
- 52


-n-
ABSTRACTS OF PAPERS
FISHERIES
MOVEMENT OF CHANNEL CATFISH IN CORALVILLE RESERVOIR
Larry R. Mitzner Fisheries Biologist
In an effort to determine the movement of channel catfish in Coralville Reservoir 2,544 individuals were internally tagged. Subsequent recapture of these fish indicated there was an average downstream movement of 0.35 miles with a standard deviation of 2.37 mHes. Fish traveling more than 25 miles were rare and 90% remained within 5 miles of the release point. Maximum dispersion occurred within 100 days. A tendency of homing exists when channel catfish are physically removed from an area after drawdown of water levels. The dam of the reservoir acts as an effective barrier for movement.
PRELIMINARY INVESTIGATIONS ON THE BAIT PREFERENCE OF CHANNEL CATFISH AND CARP IN BAITED HOOP NETS
Don Kline Fisheries Biologists
and J. K. Mayhew
Asst. Supt. of Biology
Preliminary studies to determine bait preference of channel catfish and carp were initiated during 1968. Cheese and soybean cake were used as bait in two nets and one net was unbaited as a control. The catch success of channel catfish was consistent during the three netting blocks, but the highest catch success was recorded with soybean cake in the first period. Cheese and soybean cake caught more channel catfish than no-bait, but at a nonsignificant rate. Carp were not attracted to cheese, soybean cake or no-bait but no evi~ dence indicates they were repelled by bait.
AQUATIC HABITAT OF THE MISSISSIPPI RIVER BORDERING IOWA
Don R. Helms Fisheries Biologist
The aquatic habitats of the Mississippi River bordering Iowa were mapped according to a habitat classification proposed by the UMRCC. Habitat was found to consist of 0.6% tail water, 16.6% main channel, 13.9% main channel border, 10.7% side channel, 16.2% slough, 41.6% lake and 0.3% pond. Maps of individual pools were reproduced on legal size sheets for field use.

..-u,_ AN EVALUATION OF WALLEYE FRY AND FINGERLING STOCKING
IN BLACK HAWK LAKE - 1956 - 1968
Terry Jennings Fisheries Biologist
Walleye fry and fingerling stocking is a major part of Black Hawk Lake walleye management. Until this study the success of these programs in this lake had not been evaluated.
Walleye fry were stocked in 1956, 1965, 1967,d'!nd 1968. Generally, more young walleye were captured during stocking years than non-stocking years. However, with one exception, the increases would not influence future adult populations.
During the fall of 1964 and 1965 marked Fingerling were stocked. Survival of the 1964 stocking was poor. The 1965 planting increased that year class 80% and contributed 58% and 45% to the 1967 and 1968 adult population.
GAME
CONSERVATION AND THE BIOLOGY TEACHER
M. E. Stempel Game Biologist
(This material will be printed in the Science Teachers' Journal)
Number of U. S. schools increased along with expansion of commerce. Today, most of our land, water and air space is utilized; and we have 43,000,000 pupils in elementary and secondary schools. The pupils deserve to know of the results of over-exploitation. The Conservation Commission can supply information on how to retain and enjoy lakes, parks and hunting grounds; a biology teacher can present this material most effectively in outdoor classes.
IOWA'S 1968 WATERFOWL AND DOVE BANDING PROGRAM
Richard Bishop Game Biologist
The 1968 banding operations consisted of five projects. The projects were broken down as post-season banding of wintering mallards, banding of young birds on the breeding grounds, banding of pre-season populations of flying birds, experimental banding, and the hand I ing of mourning doves. Post-season banding accounted for 1, 658 mallards and 1, 178 birds were banded on the breeding grounds. Pre-season banding, mainly of blue-winged teal, produced 3,115 birds. Experimental banding consisted of 35 mallards banded and 91 young Canapa geese. A total of 1,650 doves were banded. A grand total of 7,723 birds was banded in Iowa in 1968.

-Ill-
QUAIL STUDIES ON TWO AREAS IN SOUTHERN IOWA, 1968
M. E. Stempel Game Biologist
Gene Hlavka Game Biologist
On the Wapello and Decatur-Wayne Areas late winter covey counts, bi-weekly summer roadside whistling cock counts and the early fall covey counts were conducted in 1968, The covey counts were conducted with the aid of dogs. The brood stock for both areas consisted of 40 coveys; the 1966-67 average was 32 coveys. More than 12 weeks of significant quail calling indicated good production in 1968. Fifty-seven coveys were located on both areas in October 1968. This was 2 more that the 1966-67 average. The hours per covey flush For both areas in October was 1 . 1, the same as the 1966-67 average. Nearly 30 percent of the quail hunting activity on both study areas was in October (6 quail hunting days). November, December and January had 40, 16 and 14 percent of this activity, respectively.
MISCELLANEOUS DEER MORTALITY, 1967
Paul D. Kline Game Biologist
Reports of deer mortality other than legal hunting totaled 1,451 in 1967. The majority of these (1,273) were victims of traffic accidents. This is a 19.3% increase in reported deer-vehicle collisions since 1966. Average damage to vehicles in these collisions was $99.26. The reports of miscellaneous deer kllls does not give a true picture of non-hunting mortality as there can be little doubt that many deer die from accidents, disease, etc. and are not brought to the attention of officers who make these reports. It is believed the greatly increased numbers of deer reportedly killed on highways in recent years does reflect greater numbers of deer, However, use of these data as an indicator of annual population changes is not wise as other variables are involved and cannot be measured.
TRENDS IN MAJOR CULTIVATED CROPS IN IOWA 1954-1967
R. C. Nomsen Game Biologist
Considerable changes have occurred in farming techniques and cropping practices in Iowa during the past 15 years. Many farm units have doubled or tripled in size and cash grain farming has replaced the diversified farms that were common several years ago. These changes have been more pronounced on the very fertile soils. Safe nesting cover has dedined considerably. The percentage of Iowa cropland harvested for oats hos decreased from 17,3 per cent in 1954 to 5.3 per cent in 1967. Corn acreage has remained about the same but soybeans increased from 2,091,000 acres in 1954 to 5,136,000 in 1967. Foil plowing reduces Field cover so that blowing snow is not stopped until it reaches the winter cover, Drifts soon fill the marginal wintering areas. Potential nesting sites along roadsides are sometimes covered by drifting soU.

-IV-
FALL MOURNING DOVE MIGRATION PATTERNS IN IOWA- 1967 & 1968
Eugene D. Klonglan Asst. Supt. of Biology
Roadside counts of mourning doves were mode on routes in northern, central and southern Iowa during August, September and October of 1967 and 1968. Both morning and evening counts were taken. The highest number of doves was counted in August, with a peak reached the third week. Number of birds sighted declined rapidly after mid-September. The earliest permissible opening date for a hunting season on doves is September 1; thus resident birds are already moving out of the state before that time occurs in the form of birds migrating through state from areas north of us. Only slight differences were Found in counts made at different latitudinal levels of the state during the 3- month survey period, with a small trend toward higher counts as one progressed southward. Evening counts overaged lower in number of birds sighted compared to morning counts, particularly early in the period.

-1-
MOVEMENT OF CHANNEL CATFISH IN CORALVILLE RESERVOIR
Larry R. Mitzner Fisheries Biologist
Channel catfish movement and dispersion in river environments have been studies in Iowa by Harrison (1953), Muncy (1958) and Welker (1967). Similar studies have been conducted elsewhere by McCammon (1956), McCammon (1961 ), Hubley (1963) and Humphries (1965). Houser (1960) has studied channel catfish movement in the large reservoirs of Oklahoma. Movement determinations in farm ponds have been made by Stevens (1961).
Proposed flood control impoundments in Iowa will inundate rivers which presently have excellent catfish habitat. It is, therefore, essential to outline the life history of this species from their displaced enviroment to aid in the determination of management policies for flood control reservoirs. The objective of the report is to describe the movement of channel catfish in a flood control reservoir determined by a tagging study initiated in 1965 at Cora I vi lie Reservoir.
STUDY AREA
Coralville Reservoir is located five miles upstream from Iowa City, Johnson County, Iowa. The dam and reservoir are operated by the Rock Island District, Corps of Army Engineers. From June 15 to September 15 the water is held at elevation 680 m~l, except when flood waters are being stored. At this level the conservation pool has a surface area of 4,200' acres. During flood stages the pool may increase to a maximum storage capacity of 24,800 acres at 720 msl. From February 1 to June 15, in anticipation of spring floods, the pool is gradually lowered to elevation 670 msl. The impoundment contains 1, 820 surface acres at this level. From September 15 to February 1 the level is raised to 683 msl for management of waterfowl.
Discharge rate from the dam is regulated by the volume of water stored in the reservoir. Maximum discharge is slightly in excess of 10,000 cfs. In dry seasons, outflow is regulated to maintain 150 cfs through Iowa City, for pollution control purposes.
Tagging effort was concentrated in four specific areas, which are listed as follows: l. A two mile section of river 47 miles upstream from the dam. 2. A three mile section of river 22 miles upstream from the dam. 3. The lower 12 miles of the permanent pool. 4. A three mile section of river below the outlet structure.
Area]; and 2 are arbitrarily designated as headwaters, area 3 is the pool and area 4 is the tai I waters.

-2-
METHODS
Tagging was accomplished by inserting a numbered aluminum tag into the body cavity as described by Welker (1967). Tagged fish were marked externally for subsequent identification by removing the adipose fin.
Data recorded was total length, location captured, location released, date, and comments on any visible deformities and injuries. Weights were taken periodically on a representative sample of recaptured fish caught for the first time. ln:someo cases, recaptures were tagged a second time and returned to the water. If the adipose fin had completely healed it was assumed that the fish had sufficient time to recover its normal behavior and was sacrificed.
Slat nets were the primary means of capturing fish in all areas, but 3/4 inch mesh bait nalscwere also used in the head and tailwaters. All gear was baited with cheese or soybean cake.
The netting and tagging operations for the head and tailwaters areas were completed from June 1, to August 31, 1965; then attention was given to the pool area until November 10, 1965. Tagging in the pool was again started on May 1 and completely terminated on June 7, 1966. As was stated above, recaptures were sacrificed throughout the tagging operations and through November 1 , 1968.
RESULTS
The permanent pool contained 2,544 marked individuals followed by 1,090 in the headwaters and 191 in the tailwaters. These marked fish yielded 323 recaptures or 8.4% return.
The number of days the fish carried their tags was analyzed to determine if the dispersion rate was related to time (Figure 1 ). There are four modes of frequency which represent four fishing seasons. The period of 0 to 200 days represents fish tagged in 1965 and recaptured the same year. Similarily, 201 to 500 days is the period these individuals were recaptured in 1966. The other periods are 501 to 850 and 851 to 1150 days. The first two years following tagging were the most successful for obtaining recaptures; 87.6% were taken in 1966 and 1967.
The four time modes were used as convenient intervals to determine if time was a factor in dispersion. Variance was calculated for the distribution of fish during each time interval and compared by the chi-square test for hom~geniety of variances as suggested by Steele (1961). The result was not significant (X of 6.86 X;('.05, 3 df of 7.82), and the conclusion is that maximum dispersion had occurred by the median of the first mode, or 100 days.

., (Q c 0-50 ~
"' 51-100 101-150 151-200
201-250 251-300
301-350 351-400 401-450
0 501-550
" '.
'< 55-1-600 ~
601-650
651-700
701-750
751-800 801-850 851-900
901-950 951-1000
1001-1050 '
1051-1100 ~J
11 o1-115o I
r
'<O:JCDC..QCD"""i"TI
"' w -!'>- ()1 0 0 0 0 0
()-. 'l 0 0 00 "' 0 0 g
I w I

-4-
The dispersion during the first 200 days had a standard deviation of 2.26 miles and a mean gross movement of 0.45 miles upstream. From 201 to 500 days the movement was 0.52 miles downstream with a standard deviation of 2.18 miles. The mean movement for the period, 501 to 850 days, was 0.15 miles downstream; the standard deviation was 2.47 miles. The last period had a movement of 0.23 miles downstream and a standard deviation of 3.12. The pooled data had an average downstream movement of 0.35 and a standard deviation of 2.37 miles (Figure 2).
Fish that were recaptured within 5 miles of their release point were most common; 89.7% were r.e~p:~ptured with in this distance. As many as 22 .4% of the fish were located within one-half mile of their release. Some fish did travel great distances; one individual was recaptured 78.5 miles upstream. However, this was a rare instance and only 4.7% of the fish traveled more than 25 miles from point of release.
Movement was random as reported by Harrison (1953), Muncy (1958), McCammon (1961) and Humphries (1965). There was no indication of asymmetrical movement as was found by Hubley (1963) and Welker (1967).
Many catfish were tagged and released in Hoosier Creek, a major tributary to the reservoir, located ten miles upstream from the dam. During the February drawdown this creek is usually dry and the fish that inhabit it must move into the reservoir. When fish could again move into the area it was found that of all the recaptured catfish that were marked in Hoosier Creek, 40.3% had returned to that area. Of those that were recaptured at Hoosier Creek, regardless of where they were released, 50.3% were originally from Hoosier Creek. This would indicate 40.3-f.o 53.0% of the fish that were naturally displaced, returned to the same area.
It was possible for marked fish to go through the outlet structure at the dam, however, no fish were :recaptured below the dam that had been marked in the pool and conversely, no movement was evident from the tailwaters to the pool. The dam acts as an effective barrier to channel catfish movement.
LITERATURE CITED
Harrison, Harry M. 1953. Returns from tagged channel catfish in the Des Moines River, Iowa.
Iowa Acad. Sci., Vol. 60, pp. 636- 644.
Houser, Alfred 1960. The effect of homing on channel catfish population estimates in large
reservoirs. Proc. Okla. Acad. Sci., VoL 40, pp. 121 - 133.
Hubley, Raymond C., Jr. 1963. Movement of tagged channel catfish in the upper Mississippi River.
Trans. Amer. Fish. Soc., Vol. 92, No. 2, pp. 165- 168.

-5-
50
45
40
F 35 r e q 30 u ii
;~;
e 25 n
c y 20
15
10
5
miles downstream miles upstream
Figure 2.

-6-
Humphries, Robert L. 1965. A study of the movements of channel catfish lctalurus lacustris punctatus,
in the Savannah River and one of its tributaries within the A. E. C. Savannah River operations area. U. S. Atomic Energy Comm., No. TID -21791 .
McCammon, George W. and D. A. La Faunce. 1961. Mortality rates and movement in the channel catfish population of the
Sacramento Valley. Calif. Fish. and Game, Vol. 47, No.1, pp. 5- 26.
McCammon, G. W. 1956. A tagging experiment with channel catfish lctalurus punctatus, in the lower
Colorado River. Calif. Fish and Game, Vol. 47, pp. 5-23.
Muncy, R. J. 1958. Movements of channel catfish in the Des Moines River, Boone County, Iowa.
Iowa State Coli. Jour. Sci., Vol. 23, No.4, pp. 563-571.
Steel, Robert G. D., and James H. Torrie 1960. Principles and Procedures of Statistics. McGraw-Hill Book Co. Inc.,
N.Y., 481 pp.
Stevens, Earl D., and 0. W. Tiemeier. 1961. Daily movements of channel catfish, lctalurus punctatus (Rafinesque), in a
farm pond. Kan. Acad. Sci., Trans., Vol. 64, No.3, pp. 218-224.
Welker, Bill 1967. Movements of marked channel catfish in the Little Sioux River. Trans.
Amer. Fish. Soc., Vol. 96, No.3, pp. 351-353.

-7-
PRELIMINARY INVESTIGATIONS ON THE BAIT PREFERENCE OF CHANNEL CATFISH AND CARP IN BAITED HOOP NETS
Don Kline and
J. K. Mayhew Fisheries Biologists
Various commercial preparations of bait are used to attract fish into hoop nets. Two of the most commonly used preparations are unmarketable cheese or clippings from cheese processing and soybean cake, a by-product of soybean oi I extraction. Observations during intensive netting of commercially valuable fish in the Des Moines River Commercial Fisheries Investigation (Project 4-11-R).l indicated wide variation occured in catch success when hoop nets were baited with different preparations. Experiments were initiated during the third year of investigations to determine the preference of different species of fish to different types of bait.
EXPERIMENTAL PROCEDURE
A one-half mile segment of the Des Moines River studyareJJnear Knoxville, Iowa was selected for the bait experiments. Environmental characteristics were similar throughout this segment of the stream. One side was bordered with a large sand bar, the other with a high bank. Drifts and fallen trees had diverted river away from the high bank forming a series of small, deep pools.
Three 24-inch hoop nets with 3/4 inch bar measure web were used in all experiments. These nets were set at approximatley 1/8 mile intervals and remained in the same locations throughout the summer. Baiting treatments were conducted in a 3 x 3 Latin Sqvar~, wbere one net was baited with cheese, one with soybean cake and one was unbaited for control. Each type of bait was rotated at one week intervals during a three week netting block. This design minimized the effect of net location and netting period. Fish were assumed to be equally available to all nets during a block of time. Nets were raised at daily interval:;. all fish counted and weighed and rebaited. Data were collected in three different netting: periods: 30 July- 19 August, 6 September- 27 September and 30 September- 18 October. The nets were fished for a total of 57 net days in the first and second periods, and 63 net days in the third period.
RESULTS
Total catch of fish in the experimental nets for the combined periods was 412 channel catfish, 184 carp and 53 river carpsucker. Evaluation of bait preference was completed
This paper is a contribution of Project 4-11-R; U. S. Bureau of Commercial Fisheries and Iowa State Conservation Commission cooperating.

-8-only for channel catfish and carp because samples of river carpsucker were inadequate and catch success for this species never exceeded 0.5 fish per net day.
Cheese was the most consistent bait for catching channel catfish (Table 1). Catch success for this species for the three netting periods was 3.3, 3.2 and 2.3 fish per net day, respectively. Highest catch rate of channel catfish was recorded with soybean cake in the first experimental block, but after this period catch success declined rapidly to 1.1 and 1 .6 fish per net day in the subsequent periods, respectively. Non-baited nets produced the lowest catch rate and ranged from 1. 8 channel catfish in the first period to no fish in the third period.
Table 1. Catch rate of channel catfish in experimental hoop nets fished with different type of bait (Catch values are expressed as number of fish caught per net day)
Type of treatment Period Cheese Soybean cake Non-baited
3.3 7,6 1.8
II 3.2 1.1 0.4
Ill 2.3 1.6 0.0
In analysis of variance in catch success revealed non-significant difference between the three experimental treatments (Table 2). Nets baited with soybean cake caught slightly more channel catfish than nets baited with cheese over the entire experiment, but the difference was non-significant at the 0.05 level of probability and resulted mainly from the extraordinarily high catch value of 7.6 fish per net day in the first period. By partitioning the treatment sum of squares suggested by Snedecor and Cochran (1967) F - ratio values of baited nets vs. non-baited nets is close to being significant (F = 5.13: (0, 100 < P <( 0.025), but remained slightly below the level required for rejection of the null hypothesis.
Table 2. Analysis of variance in catch success of channel catfish in hoop nets using different types of habit. •
Source of variation df Sum of squares Mean squares F
Total 8 15.25
Location 2 0.04 0.02 0.03
Period 2 3.10 1.55 2.77
Baits 2 11 '00 5.50 9.80
Residuals 2 1.11 .56 1
F = 19.00 required for significance at 0. 05 level for 2 and 2 df.

-9-
Most of the variation in catch success of channel catfish occured between the different types of bait. Net location showed only minor influence on catch success of channel catfish. Variation in catch success between netting periods was also non-significant, mainly because catch success was greater in the first period regardless of the treatment and decreased progressively in each successive period.
The catch of carp in baited hoop nets was rather small in comparison with channel catfish, and conse.quanf.liy it was difficult to reliably determine if this species preferred a certain bait. In general, all three bait treatments caught carp at about the same rate. Nonbaited nets caught carp at a rate of 2. 9 fish per net day, soybean cake caught 2. 8 fish per net day and cheese caught 2.7 fish per net day. Catch success of carp in individual netting blocks was also similar to channel catfish. Highest catch success, with one exception, was recorded in the first block with a systematic decline in catch rate with each successive period (Table 3). The catch of carp in control nets varied from 0.6 to 1 .6 fish per net day, soybean cake catch ranged from 0. 7 to 1 .4 fish per net day and catch with cheese bait varied from 0.7 to 1.3 fish per net day.
Table 3. Catch success of carp in baited hoop nets (Catch success values are expressed in fish per net day)
Type of treatment Period Cheese Soybean cake Non-baited
1.3 0.7 1.6
II 0.7 1.4 0.7
Ill 0.7 0.7 0.6
An analysis of variance (Table 4) in catch success for each bait showed non-signifl..,. cant difference between experimental treatments. Carp were not attracted to cheese or soybean cake, although there was no evidence that bait repelled carp. The location of nets was the most important sour:ce of variation in catch success, but most of this was the result of a large catch (43% of the total catch during the first period) of small carp on 18 August in the control net. This large catch undoubtedly affected rate of catch during the first period and accounted for a major proportion of the higher catch success in the control nets.

-10-
Table 4. Analysis of variance in catch success of carp in hoop nets using different types of bait
Sources of variation df Sum of squares Mean squares F 1
Total 8 1.51
Location 2 0.42 0.210 0.68
Periods 2 0.27 0.135 0.44
Baits 2 0.20 0.100 0.32
Residuals 2 0.62 0.310
1 F 19.00 required for significants at 0.05 level for 2 and 2 df
DISCUSSION
Preliminary results indicated the catch of channel catfish in hoop nets can be in..,:-·, creased by using either cheese or soybean cake for bait. However, the increase in catch success is not at a significant rate. Under these circumstances only increased effort would produce a significantly greater numerical catch. Catch success could be increased and sustained for longer periods by alternating different types of bait during different periods of the year, but not at a significant rate.
Carp were not attracted to any type of bait used in this study. Control nets that were not baited caught carp at approximately the same rate as those that were baited. Most carp are apparently caught incidental" with natural movement.
Investigations on the bait preference of fishes will continue in this project. In 1968, catch success was greatly reduced in comparison with previous years because of a large fish kill in the study area during the preceeding winter. The similarity in catch success between bait treatments might be attributed to the general lowering of catch success by reduction in population densities.
LITERATURE CITED
Snedecor, G. W. and W. G. Cochran. 1967 Statistical methods: Iowa State University Press. 593 p.

-11-
AQUATIC HABITAT OF THE MISSISSIPPI RIVER BORDERING IOWA
Don R. Helms Fisheries Biologist
The Mississippi River is composed of an intricate network of diverse aquatic habitats ranging from back water sloughs and lakes joined by narrow channels to the swift navigation channel and expansive pools above some of the dams. Because of the confusion in nomenclature of habitats, a uniform classification and inventory of the habitat types are essential and basic to biological studies.
The UMRCC has proposed a uniform classification separating aquatic habitats into seven different categories. These are tail waters, main channel, main channel border, side channel, slough, lake and pond. A brief description of each type follows, but detailed descriptions may be found in the Proceedings of the Twentieth Annual Meeting of the Upper Mississippi River Conservation Committee.
Tail Waters
These include areas immediately below the dams which are affected by the passage of water through gates of the dam and out of the locks. These areas change in size according to water stage, and the arbitrary lower boundary for fishery purposed has been set at a distance of one-half mile below the dams.
Main Channel
This includes only the portion of the river through which large commercial crafts can operate. It is defined by combinations of contraction works (wing dams), river banks, islands, and bouys and other markers. It has a minimum depth of 9 feet and a minimum width of 400 feet.
Main Channel Border
The zone between the 9-foot channel and the main river bank, islands, or submerged definitions of the old main river channel. It includes all areas in which wing dams occur along the main channel.
Side Channels
These include all departures from the main channel and main channel border in which there is current during normal river stage.
River Lakes and Ponds
This classification along with slough replaces the old term "back waters". River lakes and ponds in general are open expanses of water with little or no current. Several types of
-12-
lakes occur along the Mississippi. These are; lakes of formation due to fluviatile dams, lakes of mature flood plains and lakes due to behavior of higher organisms. Ponds differ from lakes only in size.
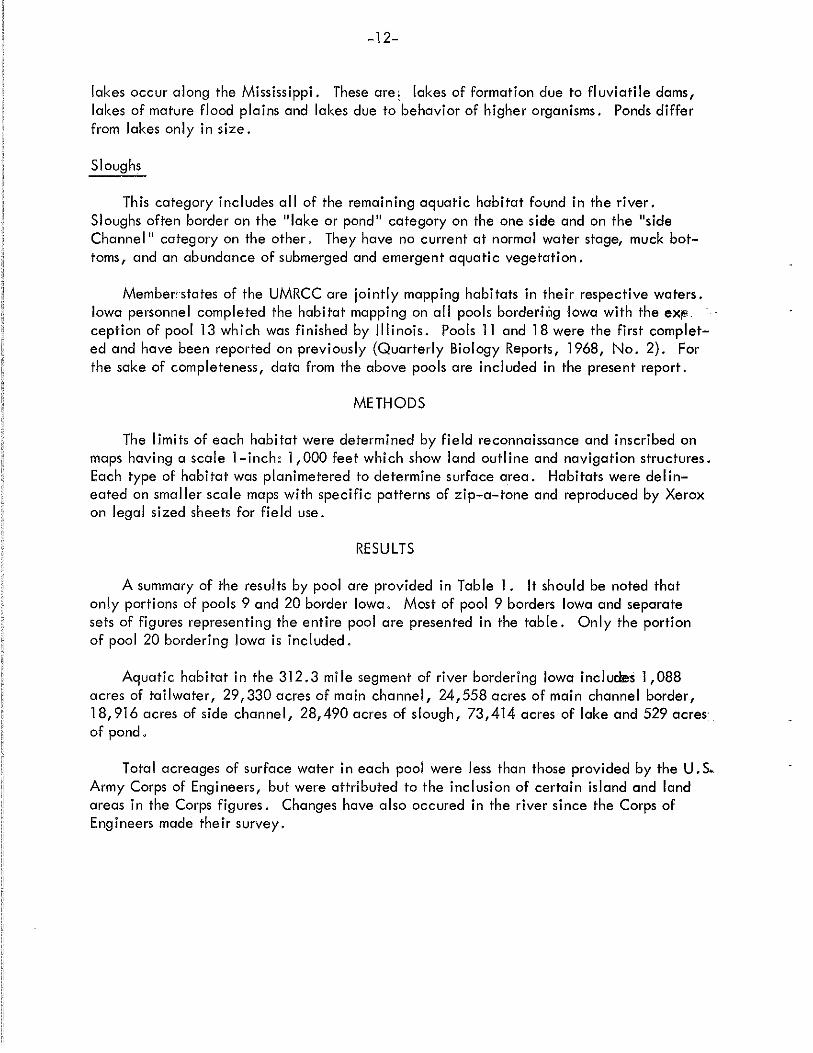
Sloughs
This category includes all of the remaining aquatic habitat found in the river. Sloughs often border on the "lake or pond" category on the one side and on the "side Channel" category on the other. They have no current at normal water stage, muck bottoms, and an abundance of submerged and emergent aquatic vegetation.
Member• states of the UMRCC are jointly mapping habitats in their respective waters. Iowa personnel completed the habitat mapping on all pools bordedog Iowa with the exf.' ception of pool 13 which was finished by illinois. Pools 11 and 18 were the first completed and have been reported on previously (Quarterly Biology Reports, 1968, No. 2). For the sake of completeness, data from the above pools are included in the present report.
METHODS
The limits of each habitat were determined by field reconnaissance and inscribed on maps having a scale l-inch: 1,000 feet which show land outline and navigation structures. Each type of habitat was planimetered to determine surface area. Habitats were delineated on smaller scale maps with specific patterns of zip-a-tone and reproduced by Xerox on legal sized sheets for field use.
RESULTS
A summary of the results by pool are provided in Table 1. It should be noted that only portions of pools 9 and 20 border Iowa. Most of pool 9 borders Iowa and separate sets of figures representing the entire pool are presented in the table. Only the portion of pool 20 bordering Iowa is included.
Aquatic habitat in the 312.3 mile segment of river bordering Iowa includll!s 1,088 acres of tail water, 29,330 acres of main channel, 24,558 acres of main channel border, 18,916 acres of side channel, 28,490 acres of slough, 73,414 acres of lake and 529 acres· of pond.
Total acreages of surface water in each pool were less than those provided by the U.S. Army Corps of Engineers, but were attributed to the inclusion of certain island and land areas in the Corps figures. Changes have also occured in the river since the Corps of Engineers made their survey.

Table 1, Acreage and percentage of habitats present in each pool of the Mississippi River bordering Iowa (% in parenthasis)
Main Main Channel Side Pool
Pool Tailwaters Channel Border Channel Slough Lake Pond Total
9* 104.4 2,206.3 1 ,633.1 1 ,331 .6 9' 847.1 12,772.7 27,895.2 (0.3) (7. 9) (5. 9) (4.8) (35. 3) (45. 8) (0.0)
9 1,862.2 1,376.1 1 '175 .4 8,109.6 12,772.7 25,296.0 (7 .4) (5.4) (4.6) (32. 1 ) (50.5) (0.0)
10 28.2 3,482. 0 2,971.9 1,579.2 5,567.6 2,308.5 64.6 16,002.0 (0.2) (21. 8) (18.6) (9. 9) (34. 8) (14.4) (0.4)
11 50.6 2,334.5 1 ,750 .3 1 ,504.2 1 '952.7 11,895.6 112.7 19,600.6 (0.3) (11. 9) (8. 9) (7. 7) (1 0. 0) (60. 7) (0.6)
12 116.9 2,845.5 2,725.6 1 '900.2 2,031 .2 1,765.3 85.5 11,470.2 I
(1.0) (24. 8) (23. 8) . :(.16.6) (17. 7) (15.4) (0. 8) -w I
13 85.5 2,722.9 2,732.3 1 ,309 .5 2,642.8 17,403.4 70.9 26,967.3 (0.3) (10.1) (1 0. 1 ) (4. 9) (9 .8) (64.5) (0.3)
14 71.6 2,470.4 2,314.7 1,286.3 1 '941 .4 2,326.3 10,410.7 (0.7) (23 .7) (22. 2) (12 .4) (18. 7) (22 .4) (0.0)
15 93.5 753.9 477.8 462.4 11.4 1,862.6 3,661 .6 (2 .6) (20.6) (13. 1) (12 .6) (. 3) (50. 9 (0. O)
continued

~~-~~-~-~·~----<'~··~""~'-~~-"'""'-·~~~~~~~~·~·· , ·---.. ··- -·-·~·,·-··--~- '"''----e-o-------,----- --,,-,---co~=cccc---,- - "----,-,--- ~'"'-='-='='''-""'• '"-"'"""'•" '~'"'"'""'"''"'""""'"'""'""""''- ·
Table 1. (continued)
Main Main Channel Side Pool
Pool Tail waters Channel Border Channel Slough Lake Pond Total
16 97.3 3,025.3 2,753.2 2,692.1 1 f 71 9. 3 1,344.7 11,631.9 (0. 8) (26. 0) (23. 7) (23. 1) (14. 8) (11 . 6) (0.0)
17 108.7 2,264.2 1,763.0 1,749.0 1,034.2 31.2 6,950.3 (1 .6) {32.7) (25. 5) (25. 3) (15. 0) (0.5) (0.0)
18 89.7 2,789. 9 2,578.3 1 '869. 9 1,129.3 3,999.7 195.5 12,652.3 (0.7) (22 .1) (20.4) (14. 8) (9 .0) (31 . 6) (1 .5)
19 92.8 4,269.8 2,555.8 3,292.0 2,343.4 17,710.6 30,264.4 (0 .3) ( 14. 1 ) .(8.4) (1 0. 9) (7.7) (~8.5) (0. 0)
I
20 253.6 509.7 558.9 96.2 1,418.4 -~
(17. 9) (35. 9) (39 .4) (6. 8) (0.0) (0.0) (0.0) '
Total 1 '088.4 29,330.2 24,557.9 18,916.4 28,489.5 73,414.0 529.2 176,325.7 (0.6) (16. 6) (13. 9) (1 0. 7) (16.2) (41 . 6) (0 .3)
* These figures are for the entire pool and are not included in the column totals.

-15-
AN EVALUATION OF WALLEYE FRY AND FINGERLING STOCKING IN BLACK HAWK LAKE
Terry Jennings Fisheries Biologist
Fry and fingerling stocking is a major part of Black Hawk Lake walleye management. Until this study the success of these programs in this lake had not been evaluated.
Black Hawk Lake is located in Sac County. It has a surface area of 957 acres. Approximately 100 acres at the west end of the lake has been dredged. The maximum depth of this area is 14 feet. The remainder of the lake has a maximum depth of 8 feet. However, much of the lake has a depth of 6 feet or less. Water runoff, wind, and excessive pleasure boating (Moen, 1964; Jennings, 1967) combine to keep the water turbid throughout the open water months. The lake is eutrophic and contains a relatively large population of fish. This population is dominated by gizzard shad. Young shad provide most of the available forage.
METHOD
No definite fry stocking schedule was established for this study. Two million were stocked in 1956 (Table 1 ). The next stocking occured in 1965 when one million were stocked. Except for the 1966 planting, all fingerlings were seined from nursery lakes during the fall and placed directly into the lake. In 1966,fish were obtained from a federal hatchery in South Dakota and stocked in June as fingerlings one to two inches. More fingerling walleye were stocked during the fall of 1964 and 1965, 10,125 and 18,406 respectively, than during any fall since 1956. These fish were marked so their impact upon the population of these year classes could be observed. Marking was accomplished by excising the right pectoral fin. No other stocked fingerlings were marked. Walleye were aged and assigned to year classes by standard methods. Scales were taken from all marked fish and from all fish which could have been in the 1964 and 1965 year classes.
Table 1. Black Hawk Lake walleye fry and fingerling stocking record- 1956- 1968.
Year Fry Stocked
1956 2,000,000 1957 0 1958 0 1959 0 1960 0 1961 0 1962 0 1963 0 1964 0 1965 1 ,000, 000 1966 0 1967 3,000,000 1968 2,500, 00() * One to two inch fingerlings stocked in June
Fingerlings Stocked
0 1 0, 000
0 5,100 2,175 3,679 5,850 3,518
1 0' 125 18,406 19,000*
0 0

-16-
RESULTS
If fry stocking benefited the walleye population, an increase in the number of young should be evident during stocking years. Increases in yearling and adults should be evident in subsequent years. In 1956, 1.0 young walleye were taken per seine haul (Table 2). This rate of capture is indicative of a high population., However, in 1957, 28 yearling were taken per haul and in 1958 the adult population nearly doubled. The large number of yearling can not be attributed to fingerling stocking. Apparently, fry stocking in 1956 successfully increased the population of that year class. Less success was observed from fry stocking during 1965, 1967 and 1968, No young were captured in 1965. In 1967 and 1968 0.5, and 0.4 young per haul were captured. Young were present during 1965, Apparently they were not abundant enough to be captured by seining. The years of highest reproduction were 1961 and 1962 when 2,0 and 4.67 young were taken per seine haul. These were years of no fry stocking.
Table 2, Average number of young, yearling, and adult walleye captured per mid-summer seine haul from Black Hawk Lake.*
Year
1956 1957 1958 1959 1960 1961 1962 1963 1964 1965 1966 1967 1968
Young captured per haul
1.0 0 0 0 0.25 2.0 4.67 0 0 0 0 0.5 0.4
Yearling captured per haul
0 28
0 0 0.25 2.67 0.67 2.67 0 0.33 5.0 0 0.2
Adults captured per haul
3.0 3.0 6.5 1.75 2.25 2.00 0.67 0.33 3.0 0.67 1.50 4.00 1.80
"*:-;;-Ba-s-e'd;-u-p_o_n--;d-a.,..ta_c_onll-ected during the last week of July or the first week of August.
In 1957, 10,000 fingerling walleye were stocked. None of these fish were observed in 1958 (Table 2). Between 1958 and 1959 the adult population declined 73%, and indication of little or no recruitment. Apparently survival of these stocked fish was very poor. No reliable conclusion can be made about fingerling stocking between 1959 and 1963. Data in Table 2 indicates few fish in the 1964 year class, The 1965 year class is much more abun.,dant. During June, 1966, 19,000 one to two inch fingerling walleye were stocked. No fish of this year class were observed as young or as yearlings.
Since 1965, 3 walleye of the 1964 year class have been observed (Table 3). One had been marked, or a marked percentage of 33%. From 1966 through 1968, 87 walleye from the 1965 year class were observed, About 80% of these fish had been stocked.

- J 7-
Table 3. Total and total number of marked walleye captured by all methods from the 1964 and 1965 year classes.
1964 Year Class 1965 Year Class -----Year Total No. Marked o/o Marked Total No. Marked o/o Marked
1965 1 0 1966 0 0 50 42 84 1967 2 1 50 22 18 82 1968 0· 0 15 10 67 TOTALS 3 -1 33 87 70 80
During 1967 and 1968, 58% and 45% respectively of all adult walleye captured were stocked fish. About 97% of these stocked fish belonged to the 1965 year class.
DISCUSSION
Fry stocking rates have varied between approximately 1,000 and 3,000 per acre. Generally, fry stocking did increase the number of young walleye during stocking years. With one exception, the increase was not large enough to influence future adult populations. The 1956 year class nearly doubled the adult population in 1958.
In order to better understand the contribution made by stocked fingerling walleye to individual year classes and the adult population, marked fish were stocked in 1964 and 1965. This study indicated the addition of larger fish is not the complete answer to maintaining a population. Survival of 1964 stocked fish was poor while the 1965 planting substantially increased that year class and in subsequent years the adult population.
Stocking density was not the principal difference between success and failure of the plantings. No data are available so the reasons for success are only a matter of conjuncture. Two possibilities or a combination of both are evident. First, it is possible survival of the 1965 year class was higher because a larger percentage were in better body condition. Secondly, test netting records indicafe a large hatch of yeilow bass occured in 1965. The addition of these fish to a forage base dominated by young shad would extend the time suitable forage was available to young predators. Thus with more food available the survival rate could have been higher.
Occasionally, good survival and a large year class results from the stocking program. Considering lake conditions and the fish most readily available for stocking, it is [Jnreal to expect much better results. If summer test netting indicates a lack of young walleye, fall fingerling stocking should continue. Numbers stocked will depend upon the amount of fish available. It is realized that rarely are yearling walleye available for spring stocking; but, if they are, they should be stocked in Black Hawk Lake. Since the first winter is a critical period for young predators in this lake, survival of spring stocked fish should be excellent. Normally, the number of fish available for spring stocking is small. For this reason added benefits could be realized by stocking them into a lake where they would comprise a larger percentage of the population than if they were stocked into a lake with a large walleye population.

-18-
ACKNOWLEDGEMENT
The author wishes to thank the Fisheries Section, particularly the personnel at the State Lake Fish Hatchery for their cooperation in making stocking records available and for their invaluable assistance in marking the fingerling walleye.
LITERATURE CITED
Jennings, Terry 1967. Fishing boat and pleasure boat numbers on several northwest Iowa Lakes. Iowa State Conservation Commission Quarterly Biology Reports 19 (1):14-21.
Moen, Tom 1964. Pleasure boat numbers as compared to fishing boats on several northwest Iowa lakes, 1961, '62 and 163. Iowa State Conservation Commission Quarterly Biology Reports 16 (1): 1-9.
-19-
IOWA'S 1968 WATERFOWL AND DOVE BANDING PROGRAM
Richard Bishop Game Biologist
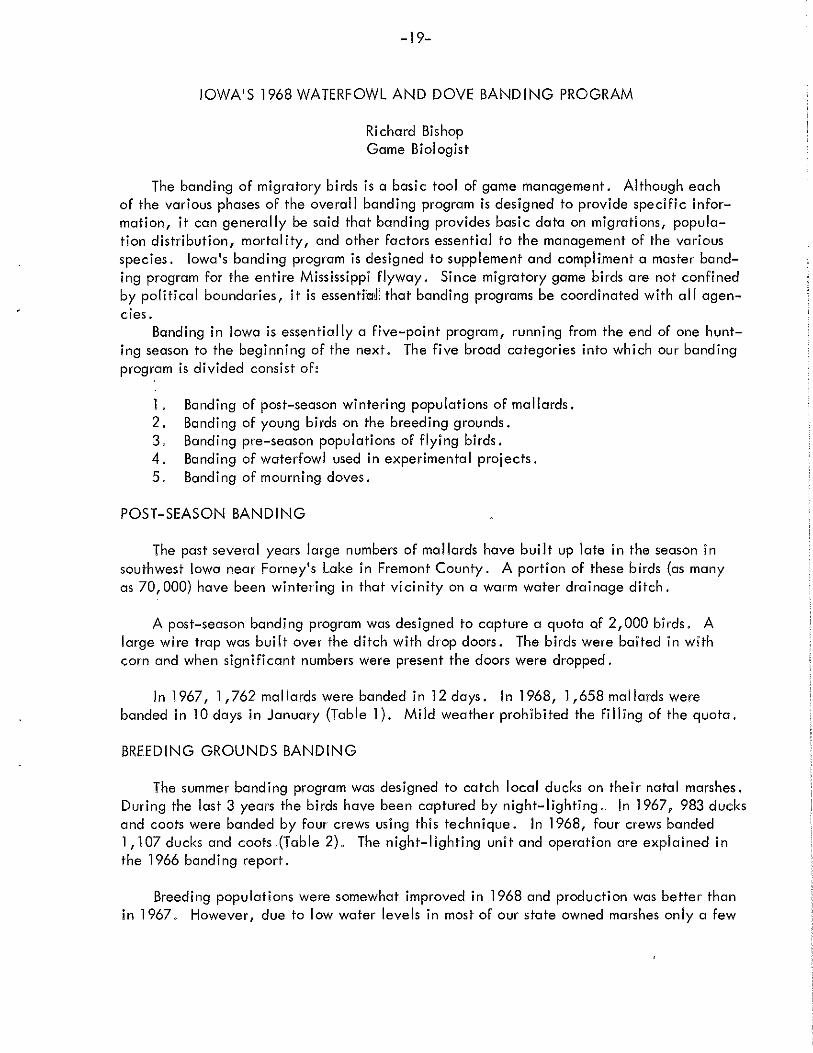
The banding of migratory birds is a basic tool of game management. Although each of the various phases of the overall banding program is designed to provide specific information, it can generally be said that banding provides basic data on migrations, population distribution, mortality, and other factors essential to the management of the various species. Iowa's banding program is designed to supplement and compliment a master banding program for the entire Mississippi flyway. Since migratory game birds are not confined by political boundaries, it is essenti'ad: that banding programs be coordinated with all agencies.
Banding in Iowa is essentially a five-point program, running from the end of one hunting season to the beginning of the next. The five broad categories into which our banding program is divided consist of:
1. Banding of post-season wintering populations of mallards. 2. Banding of young birds on the breeding grounds. 3. Banding pre-season populations of flying birds. 4. Banding of waterfowl used in experimental projects. 5. Banding of mourning doves.
POST-SEASON BANDING
The past several years large numbers of mallards have built up late in the season in southwest Iowa near Forney's Lake in Fremont County. A portion of these birds (as many as 70, 000) have been wintering in that vicinity on a warm water drainage ditch.
A post-season banding program was designed to capture a quota of 2,000 birds. A large wire trap was built over the ditch with drop doors. The birds were baited in with corn and when significant numbers were present the doors were dropped.
In 1967, 1,762mallardswerebanded in 12days. In 1968, 1,658mallardswere banded in 10 days in January (Table 1 ). Mild weather prohibited the filling of the quota.
BREEDING GROUNDS BANDING
The summer banding program was designed to catch local ducks on their natal marshes. During the last 3 years the birds have been captured by night-lighting. In 1967, 983 ducks and coots were banded by four crews using this technique. In 1968, four crews banded 1,107 ducks and coots .(Table 2). The night-lighting unit and operation are explained in the 1966 banding report.
Breeding populations were somewhat improved in 1968 and production was better than in 1967. However, due to low water levels in most of our state owned marshes only a few
-20-
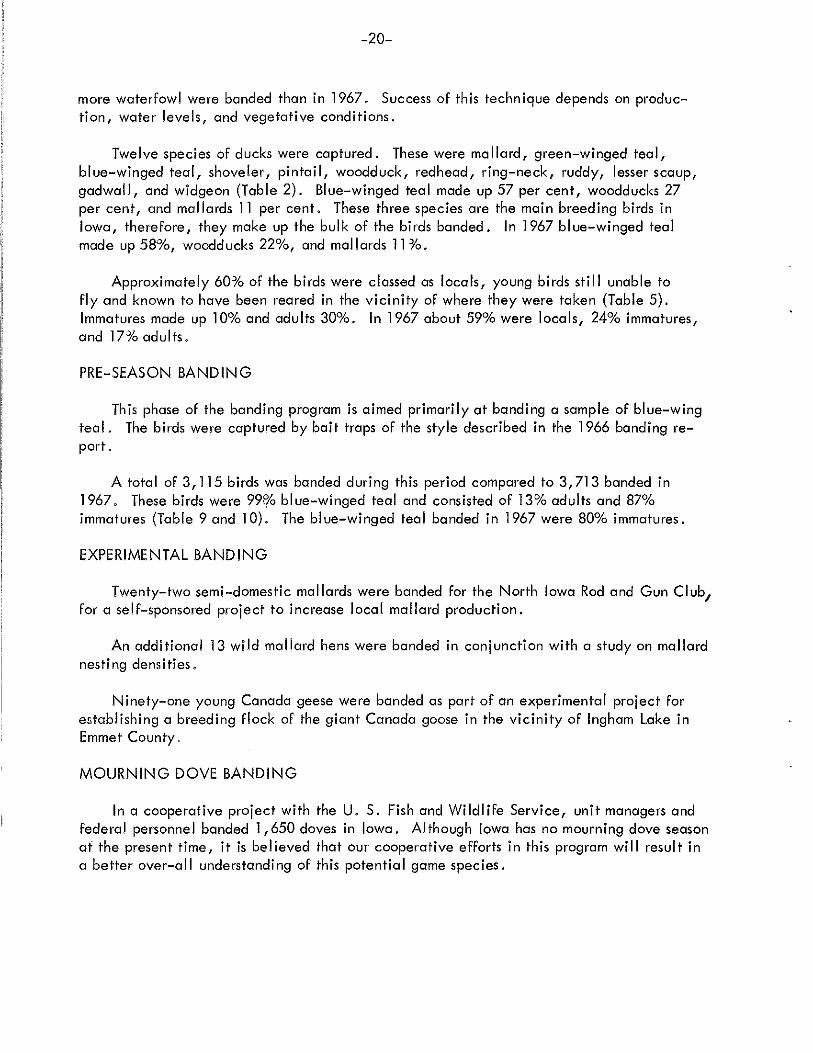
more waterfowl were banded than in 1967. Success of this technique depends on production, water levels, and vegetative conditions.
Twelve species of ducks were captured. These were rna liard, green-winged teal, blue-winged teal, shoveler, pintail, woodduck, redhead, ring-neck, ruddy, lesser scaup, gadwall, and widgeon (Table 2). Blue-winged teal made up 57 per cent, woodducks 27 per cent, and mallards 11 per cent. These three species are the main breeding birds in Iowa, therefore, they make up the bulk of the birds banded. In 1967 blue-winged teal made up 58%, woodducks 22%, and mallards 11 :Yo.
Approximately 60:Yo of the birds were classed as locals, young birds still unable to fly and known to have been reared in the vicinity of where they were taken (Table 5). lmmatures made up 10% and adults 30%. In 1967 about 59% were locals, 24% immatures, and 17% adults.
PRE-SEASON BANDING
This phase of the banding program is aimed primarily at banding a sample of blue-wing teal. The birds were captured by bait traps of the style described in the 1966 banding report.
A total of 3,115 birds was banded during this period compared to 3, 713 banded in 1967. These birds were 99P/o blue-winged teal and consisted of 13% adults and 87% immatures (Table 9 and 10). The blue-winged teal banded in 1967 were 80% immatures.
EXPERIMENTAL BANDING
Twenty-two semi-domestic mallards were banded for the North Iowa Rod and Gun Club1 for a self-sponsored project to increase local mallard production.
An additional 13 wild mallard hens were banded in conjunction with a study on mallard nesting densities.
Ninety-one young Canada geese were banded as part of an experimental project for establishing a breeding flock of the giant Canada goose in the vicinity of Ingham Lake in Emmet County.
MOURNING DOVE BANDING
In a cooperative project with the U. S. Fish and Wildlife Service, unit managers and federal personnel banded 1, 650 doves in Iowa. AI though Iowa has no mourning dove season af the present time, it is believed that our cooperative efforts in this program will result in a better over-all understanding of this potential game species.

-21-
SUMMARY
Post-season banding of wintering mallards in southwest Iowa accounted for 1,658 mallards,
The breeding grounds banding project in north central and northwest Iowa produced 1,178 birds, captured by night-lighting. Blue-winged teal made up 57% of the total, woodduck 27% and mallards 11%.
Pre-season banding of blue-winged teal by bait traps was quite successful. A total of 3,115 birds was banded and 99% were blue-winged teal.
Thirty-five mallards and 91 Canada geese were banded as part of experimental projects.
A total of 1,650 doves was banded in Iowa by state and federal personnel, These birds were captured mainly by bait traps.
A grand total of 7,723 birds was banded in 1968. These bandings include 13 species of ducks and 6 species of other birds, including mourning doves. (See Table 13).

-22-
Table 1. Post-Season Duck Banding Results, Southwest Iowa, 1968
COUNTY NAME OF AREA AHY-M AHY-F HY-M HY-F TOTALS
Fremont Knox Basin
Mallards 602 202 563 291 1658 Black Ducks 3 3 Baldpate 2 2
TOTALS 605 202 565 291 1663

-23-
Table 2. Total Birds Banded During Breeding Grounds Waterfowl Banding Operations- 1968
I
I i '
- _, -"' -"' i 0 g <I> 0 ~ u -o u - <I> i -o ,_ <I>, <I> :::> <I> - ~ ~ ,_' - -o 0 c
-6" 0 <I> 0 0
5: . ' ~ 0 -o <I> I u 3: a_ I ~ - 3;:, ~ 0 -"' 0) VI -o -o ~· 0
~· 0 c 0 -o c -o 0 - 0' ~
0 ·I -"' 5: QJ :::> 0 0 Oi 0 co' VI 0.. "' "' "' -' co u, ,_
COUNTY NAME OF ARE/>) I ' ' Calhoun South Twin Lake 1 15 2 15 1 10 43
Clay Mud Lake 1 18 4 160 11 3
I 196
Dickinson Garlock Slough 6 6 Dickinson Grover's Slough 24 8 29 2 3 53 7 I 12 1 229 Dickinson Hottes Lake 8 2 !109 1 52 I ' 162
I ' Dickinson Lily Lake 11
' 3 24 !2 40
Dickinson McClelland's 51. 17 52 40 I I 109
Emmet Private .Marsh 1 I I I 1 Emmet Ingham Lake 11 87 1 9 I 108 Emmet Jensen's Slough 1 1 ' I 2 '
I Emmet 12 Mile Lake 27 i
3 1 '. ·. 31
Hancock Eagle Lake 4 119 I
1
I I 24
Hancock E. Twin Lake 1 ! 5 3* 1 1 I 1 I 14 26
Kossuth Union Slough 2 I
~1 ** ' 43 ' ' I I Monona Badger Lake 3 i 3 ' I
I Pocahontas Little Creek Lk 1 ! 21 12 13 I 37 Pocahontas Five Island Lk 1 2 ' 13
I I 16 '·
! I I Palo Al.to Silver Lake 8 I I 8
Otter Creek i
2 I I Torno '
' i 2 '
' Winnebago Myre Slough I ' 17* '
I I
17 I
: I ' I
Worth Elk Creek 1 I I 1 I I
! I
1116 ' i i !
I TOTALS 18 [631 : 4 i6 296 1 1 I 1 1 i
1 l 4 1 14 11 04 '
* These woodducks were transplanted to Myre Slough.
** 34 more local woodducks were banded on Union Slough with bands assigned to the refuge.

-24-
Table 3, Ratio of young to adult by species*- all areas, breeding grounds banding, 1968
SPECIES
Mallard B. W, Teal Wood Duck
Y/A
5,4 2,4 2,2
Y/AF
14,0 6,0
10,0
* Other species not numberous enough to provide an adequate sample,
Table 4, Ratio of young B. W, Teal by area *, breeding grounds banding, 1968
COUNTY NAME OF AREA Y/A Y/AF
Clay Mud Lake 7,9 10,9 Dickinson Grover's Lake 1,6 5.0 Dickinson Hottes Lake 1,4 4.3 Dickinson McClelland's Sl, 6,4 15,0 Emmet Ingham Lake 4,5 14,4 Emmet 12MileLake 1,7 5,7
Average- All Areas 3,9 9,2
* Areas where 25 or more birds were captured,

-25-
Table5. Age and sex composition by species -all areas - breeding grounds banding, 1968
SPECIES AHY-M AHY-F AU HY-IVi HY-F LM LF LU TOTALS
Mallards 11 7 2 3 47 46 116 G. W. Teal 9 3 5 18 B. W. Teal .108 :76 .42 21 201 182 631 Shoveler 3 1 4 Pintai I 3 1 2 6 Woodduck 62 28 6 33 84 83 296 Redhead 2 4 5 11 Gadwall 2 1 1 4 R. N. Duck 1 Baldpate 1 Lesser Scaup 1 Ruddy Duck 1 Coot 7 7 14
TOTALS 199 120 8 55 59 337 318 8 1104
------------------------------------------------------~----------------------
Table 6. Mallard age and sex composition by area - breeding grounds banding, 1968
COUNTY NAME OF AREA AHY-M AHY-F HY-M HY-F LM LF TOTALS
Calhoun South Twin Lake 1 1 7 5 15 .
Clay Mud Lake 3 1 7 7 18 Dickinson Grover~s; Lake 2 5 9 7 24 Dickinson Hottes Lake 1 3 3 8 Dickinson Lily Lake 4 7 11 Dickinson McClelland's Sl. 8 9 17 Emmet Private Marsh 1 1 Emmet Ingham Lake 2 2 4 4 12 Hancock Eagle Lake 2 2 4 Hancock E. Twin Lake 1 Kossuth UnionS. NWR 2 Monona Badger Lake 3 3
TOTALS 11 7 2 3 47 46 116

-26-
Table 7. B. W. Teal age and sex composition by area - breeding grounds banding, 1968
COUNTY NAME OF AREA AHY-M AHY-F HY-M HY-F LM LF LU TOTALS
Calhoun South Twin Lake 7 5 3 15 Clay Mud Lake 5 13 13 6 63 60 160 Dickinson Grover's Lake 34 16 ·.r3 7 36 23 129 Dickinson Hottes Lake 29 15 15 3 34 23 109 Dickinson Lily Lake 1 2 3 Dickinson McClelland's L 4 3 2 2 21 20 52 Emmet Ingham Lake 11 5 35 37 88 Emmet 12 Mile Lake 7 3 1 4 12 27 Hancock Eagle Lake 1 6 4 2 4 19 Hancock E. Twin Lake 3 2 5 Pocahontas Little Clear Lk. 6 6 2 5 21 Pocahontas Five Island Lake 1 1 2 Worth Elk Creek 1 1
TOTALS 108 76 42 21 201 182 1 631
---------------------------------------------------------------------------------TableS. Wood duck age and sex composition by area -breeding grounds banding, 1968
COUNTY NAME OF AREA AHY-M AHY-F HY-M HY-F LM LF TOTALS
Calhoun South Twin Lk. 2 1 6 10 Clay Mud Lake 2 2 2 4 11 Dickinson Garlock Slougb 5 1 6 Dickinson Grover:'s Lake 26 7 16 2 53 Dickinson Hattes Lake 14 5 10 13 42 Dickinson Lily Lake 1 1T 1:2 24 Dickinson McClelland's 51 1 18 21 40 Emmet Ingham Lake 3 6 9 Emmet 12 Mile Lake 3 3 Hancock Eagle Lake 1 1 Hancock E. Twin Lake* 1 2 3 Kossuth UnionS. NWK** 6 5 4 24 1 1 41 Pocahontas Little Clear Lk. 3 1 1 4 4 13 Pocahontas Five Island Lk. 2 4 7 13 Palo Alto Silver Lake 1 7 8 Tama Otter Creek 2 2 Winnebago Myre Slough* 6 8 2 17
TOTALS 63 28 6 33 84 83 296

-27-
Table 9. Total birds banded during pre-season waterfowl banding operations- 1968
c OUNTY
c erro Gordo c .lay c lay c .lay E mmet Hancock Lucas Monona Winnebago .
-0 Q) ,_
3:
I (9
NAME OF AREA I
Ventura Marsh Dan Green 51. I
I Trumbull Lake i
Mud Lake Hi h Lake g i
E. Twin Lake . Colyn Area Ill Onawa Material Yardl Rice Lake ,
! TOTALS i ll
I
'
-0 Q) ,_
3: co
1031
579 189
1026 77 92
1 90
! ' I '
I I I I I ' ' I
"' -"" u ::>
'U 'U 0 0
3:
1 5 5 1 5
2
3085 1 19
I I
-0 ~
0 ,_
1032 5
584 190
1 031 77
103 l
92
3115
Table 10. B. W. Teal Age and Sex Composition by Area- Pre,-seasar\Bariding,.1968
COUNTY NAME OF AREA HY-M HY-F AHY-M AHY-F TOTALS
Cerro Gordo Ventura Marsh 489 402 84 56 1031 Clay Trumbull Lake 238 218 66 57 579 Clay Mud Lake 77 90 3 19 189 Emmet High Lake 544 380 74 28 1026 Hancock E. Twin Lake 28 41 2 6 77 Lucas Colyn Area 35 49 7 1 92 Monona Onawa Materials Yard 1 l Winnebago Rice Lake 56 26 2 6 90
TOTALS 1467 1206 239 173 3085
* Other species were not numerous enough to provide an adequate sample.

-28-
Table11. Total Mourning Doves Banded, Iowa- 1968
COUNTY NAME OF AREA NESTLINGS ADULTS IMMATURE$ TOTALS
Clay Mud Lake 179 228 408 Emmet Jack Creek 4 4 Emmet Ringstead 58 8 66 Fremont Forney's Lake 81 29 11 0 Guthrie Bays Branch 5 105 199 309 Lucas Colyn 1 unknown 109 48 158 Lucas Brown's Slough 72 62 134 Marion Red Rock 4 3 7 Tama Otter Creek 32 11 43 Warren Hooper Area 6 3 9 Winnebago Rice Lake 2 1 3 Worth Elk Creek 289 11 0 399
TOTALS 9 940 701 1,650
Table 12. Young Canada Geese Banded at Ingham Lake - 1968 Captive Flock Project
DATE L LF
6-11-68 32 38
6-13-68 3 6
7-8-68 2 3.
6-11-68* 4 3
TOTALS 41 50
*These seven goslings were captured during drive banding operations in W. Swan Lake.

-29-
Table 13. T ota I Birds Banded - 1 968
SPECIES BREEDING GROUNDS PRE-SEASON WINTER TRAPPING TOTAL
Black Duck 3 3 Mallard 116 1,658 .1,774 Gadwall 4 4 G. W. Teal 18 11 29 B. W. Teal 631 3,085 3,716 Shoveler 4 4 Pintail 6 6 Wood Duck 296 19 315 Baldpate 2 2 Redhead 11 11 R. N. Duck 1 1 Ruddy Duck 1 1 Lesser Sea up 1 1 Coot 14 14 Canada Goose 91* 91 Mourning Dove 9 1,641 1,650 R. W. Blackbird 46 46 Y. H. Blackbird 1 1 Quail** 19 19 Mallard, Exp. 35 35
TOTAL 1, 178 4,847 1,663 7,723
* Seven of these 91 immature Canada geese were drive trapped on West Swan Lake while the remainder were those geese produced in the goose pen at lngham-High.
** These 19 quai I were banded with State of Iowa Band.


-30-
QUAIL STUDIES ON TWO AREAS IN SOUTHERN IOWA, 1968
M. E. Stempel Game Biologist
and
Gene Hlavka Game Biologist
INTRODUCTION
Two quail study areas are located south of Highway 34 in Iowa's primary quail range (Stempel and Hlavka, 1966). The Wapello Area is situated southwest of Ottumwa in Adams, Green and Center Townships of Wapello County. Little Soap Creek drains the WapeLlo Area. Bottom lands and ridgetops are in grain or hay. Slopes are in brush or timber. The Decatur-Wayne Area comprises parts of Clay and Jefferson Townships in western Wayne County in addition to parts of High Point and Woodland Townships in eastern Decatur County. This former Iowa State University quail study area is located about 8 miles north of the Iowa-Missouri boundary in south central Iowa. Steele's Creek ditch drains this area. Grain crops are raised in the floodplain. For the most part the terrain in both areas is sloping to hilly. The soils are somewhat acid. There are numerous small ponds. "Up-anddown-hill" farming still continues; many gullies are caused by erosion. Tree and brush removal is occurring, coupled with the shift ir;, land husbandry toward I ivestock grazing.
On the study areas late winter covey counts, summer roadside whistling cock counts and early fall covey counts are conducted each year. Some of this survey data can be compared to statewide counts. In addition, a field record is kept of the number of rabbits and pheasants sighted.
METHODS OF CENSUSING
Game Biologists conduct the early fall and late winter covey counts with the aid of dogs., The fall counts commence when most of the soybeans are harvested and some of the corn fields are opened up. Covey searches are limited primarily to grain field edges and adjoining travel lanes or cover patches. Abandoned farmstead grounds are also scouted. When snow cover is present, coveys can be located by their trails. Other quail sign (calling, roosts, feathers, droppings, or tracks) and the actual walking time of the counts are recorded. Farmers are also asked for their estimates of the number of coveys on their farms.
From May through August at two-week intervals standard roadside whistle counts are conducted on each study area. The number of different cock quail heard calling at each of 10 stops (listening points) on a pre-selected route is recorded. Quail sightings while conducting the counts are also noted.

-31-
After each month of the quail hunting season, five farmers on each study area are interviewed about hunting activity on their farms. Questions are asked about the number and size of the hunting parties using the farm.
RESULTS OF 1968 STUDIES
Winter Studies
Late February-early March covey counts were conducted with the benefit of light snow cover on the Wapello Area. On the Decatur-Wayne Area wet, sticky snow cover was provided by a snow squall during the afternoon of February 28. On March 1, two days later, this snow cover had virtually vanished as the temperature climbed into the 40's. Just the preceding day the count was stopped because of the cold (3degrees F).
Forty coveys were located on both study areas in 1968, as compared to 36 coveys in 1967 (Table 1 ). Thirty-four coveys was the average for the preceding 2 years.
Spring and Summer Studies
Spring came early and quickly to Iowa in 1968. The mean diurnal temperature range was generally 25 to 30 degrees and quite in excess of the March normal. The unseasonable mildness of March continued through the third week of April, thereby producing_ the mildest March-Apri I period since 1946. The cool, dry and somewhat windy May reversed the unusually warm trend of March and April. June temperatures were above normal the first 10 days but near to or subnormal thereafter. July was cool and:·sunny. The greatest amount of rainfall recorded near the study areas in July in any one day was just over 2 in" ches. August temperatures were the warmest since 1962, but no recorded temperatures climbed higher than 100 degrees. Fog was unusually frequent in September, which went without free:z:ing shelter temperatures for the first time since 1905. October was characterized by seasonal temperatures Statewide. The first general freeze was reported on the 4th. (Climatological Data- Iowa, for months concerned).
In spite of varible weather, quail production was high in 1968. Calling by cock quail at a: significant rate over a period of 12 to 14 weeks indicates continuing nesting effort with resulting good production. In 1968 calling was underway in early May, remained at a high level from mid-June to the end of July, and continued at a significant rate through August (Figure 1). This calling period of 12 to 14 weeks was similar to that of 1966 and 1967. And 1966, 1967 and 1968 have all been years of outstanding quail production.
In 1968, 9 quail per 100 miles were sighted on both study area census routes. From 1966-68 the number of quai I sighted per 1 00 miles varied from 9 to 22. The average for this 3-year period was 15 per 100 miles. These sightings were recorded during the first hour after sunrise, a prime sighting period.

Table 1. Results of winter 1968 quail counts on the Wapello and Decatur-Wayne Areas, compared to the 1966-67 average of both areas
No. of coveys located Flush Sign
No. of quai I estimated Flush Sign
No. of hrs. spent walking
Hrs. per covey flush
Farmers estimates of number of coveys
T968*
Wapello Area Decatur-Wayne
26 14 13 13 13 1 - -
346 154 186 143 1oD u - --
12.3 23.0
1.0 1.8
6 6
1966.:..6/ August -* *
Both Areas Bol'h Areas
40 34 26 14 -
500 394 329 171 -
35.3 33.3
1.4 2.3
12 7
* On the Wapello Area most of count conducted with light snow cover; on the Decatur-Wayne Area, without snow cover
** No snow cover present during both years.
I w "' I

~ <!) ~
::> 0 ~
0 <!) ~
0 >..
""0 ::> ~ ~
~ a.. 0 ~ ~
I
0
' li 0
3:
~ ~
<+-0
..<:
~ u 0 <!)
~ c 0 OJ
i c
0
i u ""0 ~
0
' <!)
I ..<:
I 0
I ::> o-~
c <!) ~
~ ""0 <+-0 ~
<!) ..0 E ::J
z
70
60
50
40
30
20
10
-1-
-1-
I-
+
+
+
+ 6 7 m May
1-15
29 -21 /
,...--
/
/
May 16-31
53 ,_
27 -
/
v June 1-15
-33-
66 r-
50
/ /
/
' /
/
June 16-30
50 50
v /
/
[/
July 1-.JS
40 I--
2.3
[/
I/
/
July 16-31
26 23..-r-[/
v /
Aug. 1-15
Figure 1. The length and peak of the quail calling period as recorded by different observers on the Wapello and Decatur-Wayne Areas, 1968
26 r--v
8 v r
Aug. 16-31

-34-
Autumn Studies
On the Decatur-Wayne Area the fall covey count began on October 15 and was completed on the 29th. Similar dates for the Wapello Area were October 22 and 31st. MidOctober was too hot and windy for dog work. Because the counts are geared to the rate of crop harvest and the weather, they are usually completed after the opening day of the quai I season.
On the two areas 57 coveys were located (Table 2). This was 7 more coveys than last year and 2 more than the 1966-67 average. It took 1 . 1 hours to flush a covey, the same as the 1966-67 average. The farmer estimate of 34 coveys was 9 less than last year, 8 less than the 1966-67 average.
HUNTING ACTIVITY
The 1968-69 quai I season of 98 days opened on October 26 and closed on January 31 . This is the third consecutive year that the season length extended to around 100 days (1 00 days in 1967-68, 102 days in 1966-67). Nearly 30 percent of the hunting activity at 10 farms on the two study areas occurred in October (Table 3). November, December and January had 40, 16 and 14 percent of this activity, respectively. On the Decatur-Wayne Area the presence of ringneck pheasants is an added incentive to hunting. Some hunting without permission was reported on both areas.
DISCUSSION
From 1966-68 the winters in southern Iowa have been characterized by light snow cover. During these 3 winters the brood stock on both study areas increased from 32 to 40 coveys. Spring weather in 1968 was highly favorable for crops and wildlife, Although spring and summer weather has varied, there were over 12 weeks of significant quail calling during each of the past 3 years. Quail population levels have been outstandingly high. From 1966-68 the number of quai I sighted per 100 miles on the study area routes varied from 9 to 22. This variance of the sighting data does not correlate with quail population levels, no doubt because of the very small sample size.
Each fall there is some handicap in locating coveys because of unharvested grain fields. Furthermore, it is not always possible to use the same dog.
From 1966-68 the quai I hunters have had expanded opportunities through the 1 00-day (more or less) quail seasons. In one more year we will have 5 years of data to evaluate our techniques and some factors associated with quail populations.

··---------------
Table 2. Results of fall 1968 quail counts on the Wapello and Decatur-Wayne Areas, compared to the 1966-67 average of both areas.
No. of coveys located Flush Sign
No. of quail estimated Flush Sign
No. of hrs. spent walking
Hrs. per covey flush
Farmer estimate of number of coveys
r9o8 Wapello Arec:.
32 18 14
440 248 192
9.5
0.5
22
Decatur-Wayne
25 22
3 -308
271 :v
-
35.7
1.6
12
19o6--67-August Both Areas Both Areas
57 55 40 17
748 638 519 229 -
45.2 40.2
1.1 1.1
34 42 I w '-" I

Table 3. Summary of quail- hunting activity reported at five farms on each of two areas, Wapello and Decatur-Wayne, 1968-69
Percent of Hunting Wapello Area Decatur-W"Yne Ar~51_ Both Areas Activity on Both Areas
Parties No, of No. of No. of No. of No. of No. of 1968-69 1967-68 1966-67
Parties Hunters Parties Hunters Parties Hunters
October* 8 16 3 8 1 1 24 30 10 19
November ]D 23 5 17 15 40 40 41 27
December 4 9 2 2 6 11 16 31 27
January 0 0 5 10 5 10 14 18 27
I w a-I
TOTALS 22 48 15 37 37 85 100 100 100
* October 1968 had 6 quail -hunting days

-37-
SUMMARY
1. Quail counts were continued on both study areas, Wapello and Decatur-Wayne, in 1968.
2. The spring brood stock on both areas consisted of 40 coveys in 1968, 36 in 1967, 32 in 1966 and 20 in 1965.
3. More than 12 weeks of significant guail calling indicated good production in 1968.
4. f..ifty-seven coveys were located on both areas during fall 1968. This was 7 cove¥s more than last year and 2 more that the 1966-67 average.
5. The hours per covey flush in fall 1968 for both areas was 1.1, the same as the 1966-67 average.
6. Quail sighted per 100 miles driven on the census routes ..taried from 14 in 1966, 22 in 1967 to 9 in 1968, but the sample size was guile small.
7. Nearly 30 percent of the guail hunting activity on both study areas was in October 1968 (6 quail hun ling days). November, December and January had 40, 16 and 14 percent of the hunting activity, respectively.

-38-
MISCELLANEOUS DEER:MORTALITY, 1967
Paul D. Kline Game Biologist
METHODS
Deer mortality by means ofher than legal hunting has been recorded annually since 1951. Conservation officers are asked to submit a postal card report of each deer killed in their respective territories. Data in this report has been derived from the postal cards submitted in 1967.
RESULTS
Known mortality other than legal hunting totaled 1, 451 deer in 1967. Of these, 1,273 were killed in traffic accidents. The remainder were known victims of poaching, disease, dogs, etc.
More deer-vehicle collisions occured in Pottawattamie County (135) than in any other county (Table 1 ). Pottawattamie County has always been at or near the top in reporting these accidents. Polk County was second with 54, and Dallas County was third with 43.
Estimated damanges resulting from these collisions totaled $126,354.06, or an average of $99.26 per accident. This is a minimum figure as damages were not reported in some cases.
Sex of deer killed by miscellaneous means was reported in 1,333 instances. Of these, 751 were bucks. This gives a buck/doe ratio of 129/100. Many· more bucks than does are killed in auto accidents during the autumn rutting season, This probably stems from buck activity during that season and would account for the preponderance of bucks.
Of 1,209 deer killed in vehicle collisions, 888 (73.4%) occurred on state highways, 171 (14.1%) on hard surfaced county roads, and 150 (12.4%) on gravel roads. Probably these data reflect traffic volume and speed and not frequency of deer crossing. Types of crossings, whether or not marked "Deer Crossing", was recorded in 928 instances. Of these 184 (19. 8%) occurred at marked crossings. The remainder happened elsewhere. /
The spring deer population was estimated at 25,450 early in 1967. A loss of 1,273 (5.0%) in vehicle accidents is a significant mortality factor. Accomparison of miscellaneous deer losses for each year starting in 1951 appears in Table 2. Traffic mortality in 1967 was up 236% since 1959, 41.4% since 1963, and 19.3% over 1966.
-39-
DISCUSSION
It would appear that vehicle accidents involving deer are responsible for more deaths than any other cause except legal hunting. However, it must be remembered that every such accident involves people and probably property damage; hence, it will likely be reported. These can be little doubt that may fatal accidents befall deer, including disease and poaching, which never are known to the officers who file these reports.
Since we have had more than three times as many car-killed deer in 1967 as in 1959 it would lead us to conclude that the deer population had more than tripled during the intervening eight years. Possibly it has, but the evidence is not conclusive. This mortality factor is subject to too many variables to be considered an accurate barometer of populations. One of these is the system of reporting. There is no way to measure the totality of reporting or the changes in it through the years.
Probably total highway traffic, in miles has increased in recent years. This would increase chances of accidents and may partially <iictloUnHar greater numbers of deer killed on our highways. Most likely the realistic view of these data would be an acceptance of the long term trend of increased mortality as indicative of more deer, but rejection on the yearly trends as measure of increases in the deer population ...

-40-
Table 1. Miscellaneous deer kills, 1967.
County Number Reported K iII ed
Traffic Other Total
Adair 15 15 Adams 1 1 Allamakee 8 3 11 Appanoose 13 1 14 Aududon 10 10 Benton 4 4 Black Hawk 16 2 18 Boone 18 1 19 Bremer 2 1 3 Buchanan 2 2 4 Buena Vista 7 4 11 Butler 5 5 Calhoun 2 1 3 Carroll 8 3 11 Cass 20 20 Cedar 9 10 Cerro Gordo 0 Cherokee 11 4 15 Chickasaw 3 4 Clarke 7 7 Clay 1 1 Clayton 5 5 Clinton 15 3 18 Crawford 10 1 11 Dallas 43 3 46 Davis 15 5 20 Decatur 4 1 5 Delaware 5 5 Des Moines 35 6 41 Dickinson 13 13 Dubuque 13 13 Emmet 17 1 18 Fayette 12 2 14 Floyd 12 4 16 Franklin 8 8 Fremont 26 26 Greene 11 3 14 Grundy 1 1

-41-
Table 1, continued
County Number Reported Killed
Traffic Other Total
Guthrie 11 11 Hamilton 8 8 Hancock 5 5 Hardin 9 3 12 Harrison 28 3 31 Henry 9 2 11 Howard 4 4 Humboldt 5 6 Ida 6 6 Iowa 20 20 Jackson 24 3 27 Jasper 8 8 Jefferson 10 10 Johnson 21 22 Jones 9 10 Keokuk 9 9 Kossuth 13 13 Lee 35 14 49 Linn 6 2 8 Louisa 1 1 2 Lucas 6 6 Lyon 10 10 Madison 20 5 25 Mahaska 6 6 Marion 10 4 14 Marshall 10 10 Mills 27 8 35 M i:tX::he II 7 1 8 Monona 15 4 19 Monroe 11 3 14 Montgomery 14 3 17 Muscatine 3 3 O'Brien 0 Osceola 3 4 Page 18 18 Palo Alto 9 10 Plymouth 19 20 Pocahontas 5 6

-42-
Table 1. continued
County Number Reported Ki lied Traffic Other Total
Polk 54 3 57 Pottawattamie 135 10 145 Poweshiek 6 2 8 Ringgold 5 1 6 Sac 5 1 0 Scott 10 10 Shelby 16 1 17 Sioux 8 8 16 Story 10 10 Tama 13 1 14 Taylor 8 1 9 Union 6 1 7 Van Buren 21 7 28 Wapello 7 2 9 Warren 31 2 33 Washington 5 1 6 Wayne 7 2 9 Webster 6 2 8 Winne!:Jago 11 1 12 Winneshiek 17 4 21 Woodbury 28 10 38 Worth 13 1 14 Wright 10 1 11
Totals 1 ,273 178 1 ,451

-43-
Table 2. A comparison of miscellaneous deer kills 1951- 1967.
Year Traffic Total Miscellaneous Mortality Mortality
1951: 120 192
1952 173 256
1953 273 393
1954 229 310
1955 216 306
1956 286 419
1957 261 345
1958 314 438
1959 379 508
1960 546 753
1961 683 839
1962 726 939
1963 900 1,138
1964 914 1, 170
1965 1,022 1,224
1966 1,067 1,241
1967 1,273 1,451
-44-
TRENDS IN MAJOR CULTIVATED CROPS IN IOWA 1954 - 1967
R. C. Nomsen Game Biologist
Considerable changes have occurred in farming techniques and cropping practices in Iowa during the past ten years. Cash grain farms have replaced many of the diversified farms that were common several years ago - and most farm units have doubled or tripled in size. These changes have been more pronounced on the very fertile soils. Pheasants are farm game birds and also thrive best in the more fertile regions of Iowa. The long term trend of agriculture in Iowa undoubtedly has had an adverse affect on pheasants. The high cost of farmland plus the increasing production costs demand intensive use of land and modern machinery makes it possible.
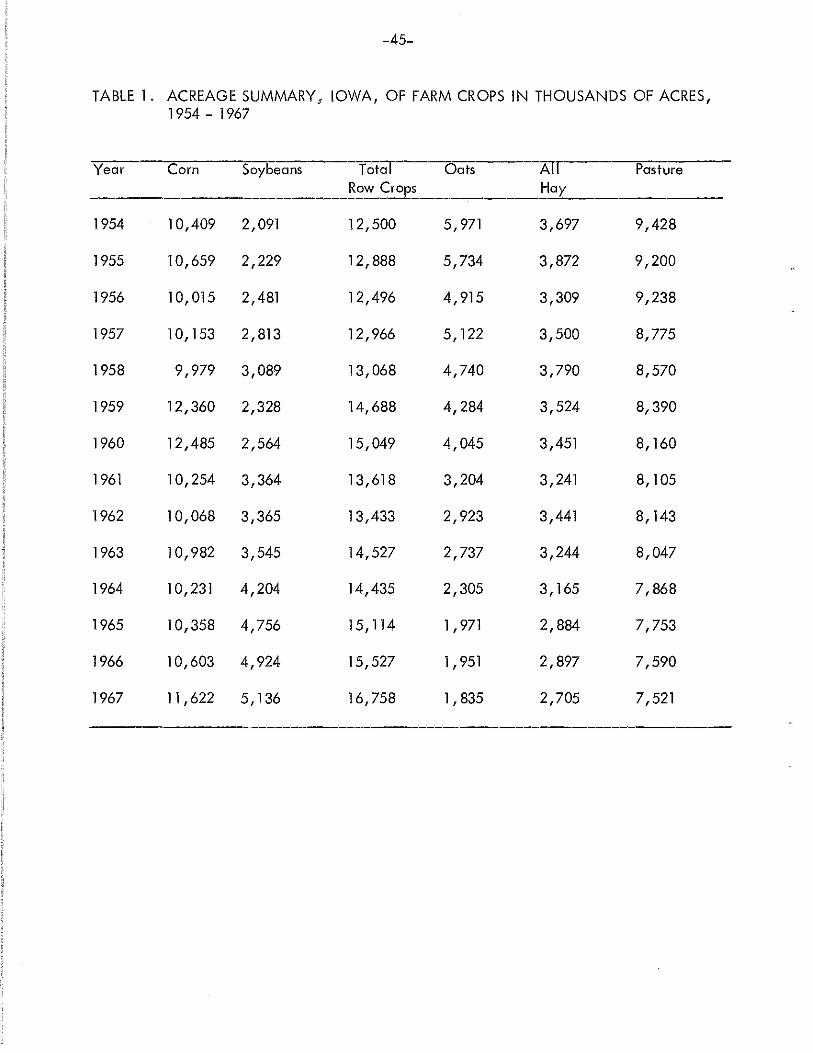
The acreage of safe nesting cover has declined considerably. Studies have shown that nests established in oat fields produce over half of the chicks hatched in Iowa. Oats acreage has dropped from 6 million acres in 1954 to only 1.8 million acres in 1967 (Table 1). Only 5.3 per cent of the cropland was harvested for grain compared with 17.3 per cent in 1954 (Table 2). Changes appeared to be greatest in regions 1, 2, 4 and 5. The acreage of oats harvested for grain on the Winnebago Research Area dropped from 402 acres (26.4%) in 1954 to only 65 acres (4.3%) in 1967.
Soybean acreage has increased 3 million acres during this period while corn increased by 1 million. Thus the 4 million acre increase in row crops was about equal to the 4.1 million acre loss of oats.
Changes in cropping practices also affect pheasant numbers and are not revealed in acreage data. One of the most important changes in the oorthern part of our range concerns the extremely light field cover during the winter. Nearly half of Iowa's 34~ million acres of cropland were planted to row crops in 1967. Soon after harvest, these fields were chopped, disced and plowed. Winter winds whipped the snow across the barren fields and into the available winter cover reducing their value as safe winter areas for pheasants. Marginal areas were soon Filled with drifting snow.
Wind erosion of top soU also causes loss of nesting sites in valuable strip cover such as roadside and ditch banks·. Considerable excellent early nesting cover along roadsides was filled with wind blown soil during the spring of 1968.
The.iiogmiclo pliea~>Jt:hasicjllr<OSpe:r.er:J:in: Iowa because :Iowa is a rich agricultural state. They continue to thrive in areas of the state where diversified Farming exists. However, it is quite apparent that many of the more fertile fields are too intensively farmed to provide the basic needs of this farmland game bird.
-45-
TABLE 1. ACREAGE SUMMARY, IOWA, OF FARM CROPS IN THOUSANDS OF ACRES, 1954- 1967
Year Corn Soybeans Total Oats All Pasture Row Crops Hay
1954 10,409 2,091 12,500 5, 971 3,697 9,428
1955 10,659 2,229 12,888 5,734 3,872 9,200
1956 10,015 2,481 12,496 4,915 3,309 9,238
1957 10,153 2,813 12,966 5,122 3,500 8,775
1958 9,979 3,089 13,068 4,740 3,790 8,570
1959 12,360 2,328 14,688 4,284 3,524 8,390
1960 12,485 2,564 15' 049 4,045 3,451 8,160
1961 10,254 3,364 13,618 3,204 3,241 8,105
1962 10,068 3,365 13,433 2,923 3,441 8,143
1963 10,982 3,545 14,527 2,737 3,244 8,047
1964 1 0' 231 4,204 14,435 2,305 3,165 7,868
1965 10,358 4,756 15,114 1 '971 2,884 7,753
1966 1 0' 603 4,924 15,527 1 '951 2,897 7,590
1967 11 '622 5,136 16,758 1 '835 2,705 7,521

-46-
TABLE 2. COMPARISON OF OATS ACREAGE BY AGRICULTURAL DISTRICTS 1954-1967 PER CENT OF CROPLAND IN OATS
District 1954 1967
1. NW 24.0% 5.6%
2. NC 21 '1% 5.1%
3. N E 17.2% 8.3%
4. we 19.6% 5.0%
5. c 18.8% 4.7%
6. EC 16.2% 7.4%
7. sw 15.1% 4.0%
8. sc 10.3% 3.6%
9. S E 12.1% 4.0%
STATE 17.3% 5.3%


-47-
Fall Mourning Dove Migration Patterns in Iowa - 1967 & 1968
Eugene D. Klonglan Asst. Supt. of Biology
INTRODUCTION
The mourning dove is an important resident game species in Iowa, which at present is not being utilized by the hunters of this state. Since it is a migratory species, it is. howeve~ subjected to hunting pressure in all states to the south of Iowa. Attempts have been made at various times in recent years to have the dove placed on the "open season list" but these have always failed. Because of the importance of the mourning dove on the national hunting scene, plans are being made on both federal and state levels to place increased emphasis on dove research -primarily as part of a program of accelerated research on all nonwaterfowl migratory species (doves, snipe, rails and woodcock are the ones included that are of interest to Iowa). States that do not hunt some of these species are taking part in the program, as well as those that do hunt them. Funds for this program have been quite limited because of budgeting problems on the national leveL However, the interest already aroused has resulted in preliminary efforts by many states toward increasing emphasis in these species.
The Migratory Bird Treaty Act provides that a hunting season on mourning doves cannot begin earlier than September 1. It is general knowledge that doves are already "on the move" in Iowa at that time and that their migration out of the state is practically completed by the end of October. Thus any hunting season held on doves in Iowa would necessarily involve a period when the birds are already leaving the state, and thus only a portion of the birds resident here during the summer would be subjected to hunting pressure within this state. However, no extensive quantitative measurements of this movement have been made. This need for more and better facts on one aspect of the status of doves in Iowa prompted, a preliminary study aimed at obtaining a better estimate of mourning dove fall migration patterns in the state.
PROCEDURE
Beginning August 1, 1967, a series of roadside mourning dove counts was initiated. IJ :Was felt that this survey method was the best available, consideri.ng the season, sample that could be obtained, time involved, and personnel able to work such counts into(:l:heir schedule. These counts were made during August, September and October of both 1967 and 1968. Five routes, all 30 miles in length, were used in 1967- one in north central Iowa, two in central Iowa, and two in southern Iowa. A sixth route. in north central Iowa, was added in 1968- thus giving two routes each in northern, central ond southern Iowa. In this manner it was hoped to detect migration time differences in a north - south direction through the state.
The 1967 survey was based primarily on evening counts. The objective was two counts per week for each route. if possible, with one definitely to be made. Several morning counts were also to be made in order to measure the difference between numbers of doves seen on the same route at the two different times. In 1968 this scheme was reversed, based' on the 1967 findings, with counts to be made in the morning. One count was to be made
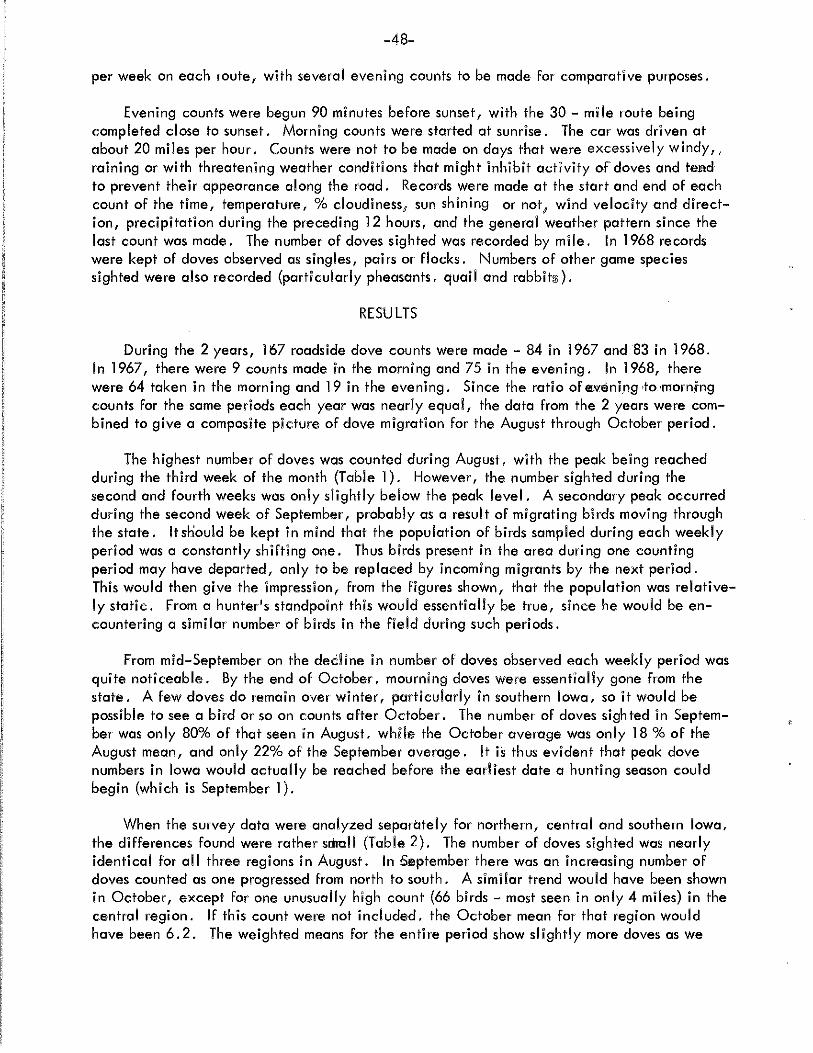
-48-
per week on each route, with several evening counts to be made For comparative purposes.
Evening counts were begun 90 minutes before sunset, with the 30- mile route being completed close to sunset. Morning counts were started at sunrise. The car was driven at about 20 miles per hour. Counts were not to be made on days that were excessively windy,, raining or with threatening weather conditions that might inhibit activity of doves and temd to prevent their appearance along the road. Records were made at the start and end of each count of the time, temperature, %cloudiness, sun shining or not, wind velocity and direction, precipitation during the preceding 12 hours, and the general weather pattern since the last count was made. The number of doves sighted was recorded by mile. In 1968 records were kept oF doves observed as singles, pairs or Flocks. Numbers of other game species sighted were also recorded (particularly pheasants, quail and rabbitffi).
RESULTS
During the 2 years, 167 roadside dove counts were made- 84 in 1967 and 83 in 1968. In 1967, there were 9 counts made in the morning and 75 in the evening. In 1968, there were 64 taken in the morning and 19 in the evening. Since the ratio ofaveni_ng•to•morni-ng counts For the same periods each year was nearly equal, the data From the 2 years were combined to give a composite picture of dove migration for the August through October period.
The highest number of doves was counted during August, with the peak being reached during the third week of the month (Table 1). However, the number sighted during the second and Fourth weeks was only slightly below the peak level. A secondary peak occurred during the second week of September, probably as a result oF migrating birds moving through the state. It snould be kept in mind that the population of birds sampled during each weekly period was a constantly shifting one. Thus birds present in the area during one counting period may have departed, only to be replaced by incoming migrants by the next period. This would then give the impression, From the figures shown, that the population was relatively static. From a hunter's standpoint this would essentially be true, since he would be encountering a similar number of birds in the field during such periods.
From mid-September on the dedine in number of doves observed each weekly period was quite noticeable. By the end of October, mourning doves were essentially gone From the state. A few doves do remain over winter, particularly in southern Iowa, so it would be possible to see a bird or so on counts aFter October. The number of doves sigh ted in September was only 80% of that seen in August, while the October average was only 18% oF the August mean, and only 22% of the September average. It is thus evident that peak dove numbers in Iowa would actually be reached before the earliest date a hunting season could begin (which is September 1 ).
When the survey data were analyzed separately For northern, central and southern Iowa, the diFFerences Found were rather sritoll (Table 2). The number of doves sighted was nearly identical for all three regions in August. In September there was an increasing number of doves counted as one progressed from north to south. A similar trend would have been shown in October, except for one unusually high count (66 birds- most seen in only 4 miles) in the central region. IF this count were not included, the October mean for that region would have been 6.2. The weighted means for the entire period show slightly more doves as we

-49-
Iqble 1 . Mourning dove roadside survey results, 1967 & 1968 combined, statewide.
No. of No. of Total DdYes·per Doves per Period <Thumts. Mites Doves Count Mile
August 1 - 7 15 450 624 41.6 1.39 8 - 15 15 450 759 50.6 1.69 16-23 14 420 .727. .5.1.9 1.73 24- 31 14 420 689 49.2 1.64
58 1740 2799 48.3 T6l
Sept. 1 - 7 13 390 560 43.1 1.44 8- 15 14 420 671 47.9 1.60 16- 23 11 330 408 37.1 1.24 24- 30 10 300 225 22.5 0.75
48 1440 1864 38.8 1:29
Oct. 1 - 7 10 300 208 20.8 0.69 8- 15 7 210 42 6.0 0.20 16- 23 8 240 ... 37 4.6 0.15 24- 31 8 240 4 0.5 0.02
33 990 291 8.8 0.29
-- -- --Totals 139 4170 4954 35.6 1.19

-50-
move south, but it is evident that hunters would be likely to find doves throughout the state during any hunting season that might be set.
A comparison of evening versus morning counts showed that the Former averaged only 61 per cent of the latter For the entire 3 - month period (Table 3). There was a distinct trend toward evening counts being a higher percentage of the morning counts as one progressed From August to October. The relationship between the two was more consistent early in the period and became quite erratic late in the period. For example1 in October. the higher ratio of evening to morning surveys hinged entirely on one evening count in which a single Flock of 76 birds was observed. Chances of seeing, or Failing to see1 such Flocks on a single count are probably greater later in the period, when no doves at all are sighted on many miles as compared to earlier in the period when birds are seen most miles.
Analysis of effects of those weather conditions that were measured in conjunction with the surveys will be done Following completion of the third. and Final, year of this project.

Table 2. Comparison oF dove survey statistics for northern, central and southern Iowa *
Nort11err1Towa----~------· ·--·-central Iowa
No. -No~ Doves/ No. No. Doves/ Pedod Counts Doves Count Counts Doves Count August ·1 - 7 4 169 42.2 7 369 52.7
8- 15 5 220 44.0 5 240 48.0 16- 23 3 163 54.4 6 290 48.3 24- 31 3 174 58.0 5 186 37.2
15 726 48.4 23 1085 47.2
Sept. l - 7 3 115 38.3 5 162 32.4 8- 15 3 113 37.7 6 305 50.8 16- 23 2 52 26.0 6 214 35.7 24- 30 2 51 25.5 4 87 21.8
10 331"" 33.1 2-1- 768 36.6
Oct. 1-7 2 21 l 0.5 5 122 24.4 8- 15 2 8 4.0 1 3 3.0 16- 23 3 30 10.0 2 4 2.0 24- 31 3 0 0.0 2 0 0.0
io 59 5:9 10 129 12.9
TOTALS 35 11 ],6 31.9 54 1982 36.7
X of Means 29.1 32.2
*North-ern-routes -nea_r_ Garner (run by Dick Nomsen) and Clear Lake (run by Ron AndreWs/ Central routes near Ames (run by Gene Klonglon) ond Nevada (run by Don Hackbarth Southern routes near Chariton (run by Gene Hlavka) and Ottumwa (run by Elden Stempel)
Southen1 Iowa No. No Doves/
Counts Doves Count 4 86 21.15 5 299 59.8 5 274 54 8 6 329 54 8
20 488 49.4
5 283 56.6 5 253 50.6 3 132 44.0 4 87 21.8 17 755 44.4
3 65 21.7 4 31 7.8 3 4 1.3 3 4 1.3 13 ~ 8:0 i..-"· - .
50 1847 36.9
33.9

-52-
Table 3. Comparison of mourning dove roadside counts made in evening vs. those made in morning.
Item . ·t-ug. Sept. Oct. Total
No. of "paired counts" compared 13 9 4 26
No. of doves on morning counts 1 013 517 81 1611
No. of doves on evening counts 545 339 100 984
Ratio- doves in p.m./doves in a.m. 1 .0:1 . 9 1 .0:1 . 5 1 .0:0.8 1 .0:1 .6
Per cent- doves in p.m. of doves in a.m. 54% 64% 123% 61 o/o
No. times p.m. count higher than a.m. 1 of 13 2 i:jf 9 2 of 4 5 of 26
Percent p.m. higher than a.m. 8% 22% 50% 19%

I
Made in United States of America Reprinted from THANSACTIONS OF THE AMEHICAN FISHIW!ES SoCIETY
Vol. 98, No. 1, January 1969 pp. 118 121
Age and Growth of Flathead Catfish in the Des Moines River, Iowa
J. K. MAYHEW

Age and Growth of Flathead Catfish in the Des Moines
River, lowa1
INTRODUCTION
Flathead catfish, Pylodicti.s olivaris (Rafinesque), occur in varying abundance in Iowa streams. Harlan and Speaker (1956: 112) listed this species as quite common in the Mississippi and Missouri rivers and large tributary streams in regions of highly oxygenated water. Cleary (1956: 309) found them distributed in the Des Moines, Cedar, Iowa, Wapsipinicon, Raccoon, Chariton, and Grand River systems. They were also recorded in several Iowa lakes and reservoirs.
Life history information on flathead catfish is limited. Muncy (1957) attributed this mainly to the difficulty in obtaining adequate numbers of fish. Even under optimum sampling conditions large catches of flathead catfish are infrequent. Annual fishery survey reports of the Iowa Conservation Commission reveal flathead catfish in streams comprise < I% of the sample number and weight. Their catch comprised ~ 2% of the commercial fish harvest in the Mississippi and Missouri rivers bordering Iowa for the past 17 years (Data obtained from statutorally required commercial fishermen reports, Iowa Conservation Commission).
This species, the only sizable game-fish in Iowa streams, is a major component of the recreational fishery. Angler catches of fish in excess of 20 lbs (9.1 kg) are frequently reported from the Des Moines River. Angling for flathead catfish is becoming increasingly popular. Presently a sizable group of fishermen expend considerable time and effort catching a few large fish. Most such fishermen willingly accept the low productivity of flathead catfish angling for the capture of a few exceptionally large fish. Consequently, the fishery assumes more aesthetic value than economic importance.
A 20-mile ( 32 km) section of the Des Moines River, which lies in a broad alluvial valley, winding from bluff to bluff in a series of sharp bends, near Knoxville in Marion County was examined. Width of the river varied from 200 to 500 ft (60--152 m). The stream was characterized by short riffles and long, sluggish pools with numerous protective drifts of lodged, floating logs, fallen trees, and debris. Many large sand bars were exposed during low flow. According to Harlan and Speaker (1956: 113), flathead catfish prefer this type of habitat. Within two years this segment of the Des Moines River will be impounded by a flood control reservoir.
Intensive netting with baited hoop nets in the summer and autumn of 1966 produced a catch of 455 flathead catfish, of which 302 were used for age and growth determinations. This study presents information on the lengthweight relationship, body-spine relationship, and growth in length and weight of these fish.
PROCEDURE
Pectoral spine samples were randomly obtained from fish collected throughout the entire netting period. Physical separation of the spine was accomplished by simultaneously twisting and depressing the spine toward the body of the fish at the articulating process. Most spines were removed without aid of pliers or forceps except for large fish when it was difficult to remove the spine without iniury to the fish or breakage. Soines were
SHORT PAPERS AND NOTES 119
""I --~--~
' '
f" '
""I -\ 600
j "' ~
'"'I j '" ~
" • ~ ~ ~ z
~ w • J 300 ~
"' 2000 w
j '" ~
~ ~
woof
g
J'" I '
YEAR OF LIFE
FIGURE I.-Growth of flathead catfish in len¥th and weight (solid line represents weight; broken hne represents length).
Spine samples were aged and growth calculated identical with the method used for channel catfish, lctalurus punctatus, by Sneed (1951). Large spines were difficult to crosssection properly because the thin dental separating saw blade of the sectioning device warped with friction heat, resulting in unevenly cut sections. This caused some distortion in microprojected images and resulted in inaccurate location of annuli on tab strips. These samples were omitted from the study.
VALIDITY OF ANNULI AS YEAR MARKS
The general appearance of spine sections was similar to the description given by Jenkins ( 1952). Magnified spine images possessed alternating broad opaque bands and narrow clear bands. Narrow bands were regarded as annuli caused by slower winter growth.
These marks were considered true annuli because: (l) there was a progressive increase in assigned age of fish with increased body length; ( 2) there was general agreement between modes in total length frequency distrihntion and moilal lengths assigned to vear
LENGTH-WEIGHT RELATIONSHIP
A length-weight relationship was determined from a randomly selected subsample of 175 fish divided into 25 mm length intervals. Determination of the length-weight equation was made by fitting a straight line to logarithmic transformed values of the two variables. The calculated equation log W = ~5.5819 + 3.2597 log L, where L = total length in millimeters and W = weight in grams best describes this relationship. Differences between calculated and observed weights were not significant (P > 0.05). Large deviations occurred only in size groups of fewer than three fish.
Coefficients of condition, K, were computed for each size group by using the reciprocal of the average total length multiplied by the mean weight. Mean K for the total sample was 1.23 with a range of 1.03 to 1.37.
BODY -SPINE RELATIONSHIP
Establishment of a mathematical relationship between total length and spine radius was desired for back calculation of growth. Magnified spine images (X 32) were measured in millimeters along a straight line from the estimated center of the lumen to the edge of the spine image in the largest lateral lobe.
Trial plots of spine radius (R) on total length (L) by 100 mm size groups indicated the body-spine relationship was curvilinear and best defined by the equation log (L- 9.0) = 0.4325 + 1.1115 log R. The calculated intercept (R = 0) was 9.11 mm and the correlation coefficient ( r) was 0.986.
Total length at each annulus was computed by construction of a nomograph to accommodate the body-spine regression. Curvilinearity of exponential values in this device were identical with log-log transformation of length and spine radius. Calculated length was automatically shifted by adjusting the marked center of the spine image on the tagboard strip to the calculated intercept.
CALCULATED GROWTH IN LENGTH

120 SHORT PAPERS AND NOTES
T.4.BLE I.-Calculated growth in total length (millimeters) for flathead catfish in the Des Moines River ( equivalent total length in inches in parentheses)
Ag' Number in gronp sample 2 3
208 165 (6.5)
11 36 145 254 (5.6) (10.0)
lll 22 117 287 381 (4.6) I 11.3 I (15.0)
IV 8 142 244 429 (5.6) 19.6) (16.9)
v 8 145 310 376 15.7) (12.2) (14.8)
VI 4 ~ 244 376 (9.6) ( 14.8)
VII 13 277 399 (10.9) ( 15.7)
VIII 8 ~ 396 ( 15.6)
Grand average lengths 142 269 393 (5.6) 110.61 (15.5)
Grand average increment 142 124 130 (5.6) (4.9) 15.1)
Sum of increments 142 266 396 (5.6) (10.5) ( 15.6)
~ Annulus eroded into lumen of spine.
were also captured, but the small sample size and inaccuracy in sectioning spine samples made it inadvisable to use these fish. After fish reach age VI, there was marked deterioration of the bony structure around the lumen. At this age the first annulus was either missing or was only partially complete. Erosion loss of this annulus was first detected when calculated total length of age VI and VII was less than age V fish. After close re-examination of the spine samples by size groups from the smallest to the largest fish, it was apparent that at least one annulus had eroded into the lumen. The second annulus also deteriorated by age VIII. Erosion begins at approximately age IV and apparently continues throughout the life of the fish. Jenkins ( 1952) noticed this factor in his study of flathead catfish growth in Oklahoma and attempted to minimize the occurrence of annulus erosion by using dorsal spines in a second collection of fish.
Estimates of general growth in body length were computed by grand averages of calculated total length and successive summation of average growth increments (Table 1). Both methods showed only minor variation in
Year of life
4 5 6 7 8
480 ( 18.9)
470 549 ( 18.5) (21.6)
475 561 607 ( 18.7) (22.1) (23.1)
462 549 599 671 ( 18.2) (21.6) (23.6) 126.4)
457 541 594 676 714 ( 18.0) 121.3) ( 23.4) (26.6) (28.1)
469 550 600 674 714 (18.5) (21.6) (23.6) (26.5) (28.1)
74 84 51 76 38 (2.9) (3.3) 12.0) (3.0) (1.5)
470 554 605 681 721 (18.5) (21.8) (23.8) (26.8) (28.4)
length at each annulus. Growth was greatest during the first 3 years of life (Figure 1), with a systematic decrease in length increment with increased age. Age group VII attained a higher growth increment, but this was attributed to a small sample.
Comparison of growth of flathead catfish in the lower Des Moines River with fish from the upper Des Moines River in Iowa, Oklahoma, Kansas, and the Mississippi River bordering Iowa revealed total length at each year of life was between the extreme ranges. Muncy (1957) found growth of flathead catfish in the upper Des Moines River was about 25% less at each annulus than in the present study. Early life growth of Oklahoma and Kansas flathead catfish (ages I through III) deter· mined by Jenkins (1952), McCoy (1953), and Minckley and Deacon (1959) agreed quite closely with this study, but in the later years of life growth was considerably faster in the former investigations. Schoumacher (1968) found growth rates of flathead catfish in the Mississippi bordering Iowa very rapid during the first four years of life, but after age VI calculated length was in close agreement with
I' 1 ' ~I "
SHORT PAPERS AND NOTES
TABLE 2.-Calculated weight at each year of life for flathead catfish in the Des Moines River
Calculated weight Increment of average
Year of life Grams Pounds Grams Pounds
1 28 0.06 28 0.06 2 227 0.50 199 0.44 3 757 1.67 530 1.17 4 1,345 2.96 588 1.30 5 2,282 5.02 937 2.06 6 2,980 6.55 698 1.53 7 4,337 9.53 1,357 2.98 8 5,251 11.54 914 2.01
this study. Most variation in growth occurs in younger fish age groups.
CALCULATED GROWTH IN WEIGHT
Calculated growth in weight (Table 2) was determined by applying the sum of the average increment of total length in Table l to the length-weight relationship. Annual increments of calculated weight (Figure 1) increased rapidly from 28 gm in the first year of life to 1,357 gm in the seventh year. Irregularities of weight increments in older age groups (VI and over) were attributed to insufficient samples. In general, calculated weight became progressively greater with increased age.
LITERATURE CITED
CLEARY, R. E. 1956. The distribution of fishes in Iowa. In Iowa Fish and Fishing by Harlan and Speaker. St. Cons. Comm., Des Moines, Iowa. 377 p.
HARLAN,]. R., AND E. B. SPEAKER. 1956. Iowa Fish and Fishing. St. Cons. Comm., Des Moines, Iowa. 377 p.
JENKINS, R. M. 1952. Growth of flathead catfish in Grand Lake (Lake 0' the Cherokees Oklahoma). Proc. Okla. Acad. Sci. 33: ll~20.
McCoY, H. A. 1953. The rate of growth of flathead catfish in 21 Oklahoma lakes. Proc. Okla. Acad. Sci. 34: 47-52.
MINCKLEY, W. L., AND J. A. DEACON. 1959. Biology of the flathead catfish in Kansas. Trans. Amer. Fish. Soc. 88: 344-355.
MuNcY, R. ]. 1957. Distribution and movement of channel and flathead catfish in the Des Moines River, Boone County, Iowa. Ph.D. thesis, Iowa State College, Ames, Iowa.
ScnoUMACHER, R. 1968. Some observations on flathead catfish in the Mississippi River bordering Iowa. Trans. Amer. Fish. Soc. 97: 65-66.
SNEED, K. E. 1950. A method of calculating the growth of channel catfish, lctalurus lacustris punctatus. Trans. Amer. Fish. Soc. 80: 174-183.
Iowa Conservation Commission Des Moines, Iowa
J. K. MAYHEW
121

Successful Renovation of a Small Natural Iowa Lake
TERRY JENNINGS 1
Abstract. Center Lake, having a smface area of 264 acres, is located in northwestern Iowa. During 1958 management problems in the form of stunted bullheads and carp along with very poor fishing, indicated the lake should be renovated. During October, 1958 liquid toxaphene was applied at a rate of 0.05 ppm. Apparently, a complete kill resulted.
During 1962 an estimate of the bluegill population was made. Nearly 1,100,000 bluegills or about 500 pounds per acre, were present at that time. The 1962 black crappie population was estimated at 250,000 or about 140 pounds per acre.
Based on a comprehensive creel census conducted on the lake during 1963, 1964, 1965, and 1966 approximately 124,200 angler trips totaling nearly 311,500 hours were made to the lake during the 4~year period. During these trips an estimated 1,054,853 fish totaling 291,305 pounds were creeled. An average year produced an estimated angler harvest of 275 pounds per acre. The high harvest rate occurred during 1964 when an estimated 480 pounds per acre were creeled.
Center Lake, having a surface area of 264 acres, is located in northwestern Iowa. This eutrophic lake of glacial origin has a maximum depth of about 14 feet. During periods of normal water levels, the shoal area is steeply sloping to about the 5-foot contour and is composed mainly of scattered boulders and sand. The remainder of the lake is composed of mud and silt. Because the shoreline is largely wooded and undeveloped, the littoral zone contains excellent habitat for fish in the form of dead limbs and fallen trees. Two sloughs connecting with the lake during periods of normal water levels make excellent spawning habitat for most fish present in the lake.
Moen ( 1962) aptly stated the management problems in Center Lake when he said,
Late in the summer of 1958 stunted bullheads ( 3 years old, averaging 3.7 inches in length) were present at a population of about 580 pounds per acre. Carp Carp were the next most abundant species, comprising 213 pounds per acre. Other species, including walleye, northern pike, largemouth bass, black crappies, bluegills, and common sucker, accounted for less than .an estimated 5 pounds per acre.
Based on these observations and very poor fishing, the decision was made to eliminate the existing fish population. It was decided the lake would be restocked for maximum production of largemouth bass and bluegills.
1 Fisheries Biologist, Iowa State Conservation Commission.
92

1671 LAKE RENOVATION 93
On October 1, 1958 the lake was treated with liquid toxaphene : a rate of 0.05 ppm. Apparently, a complete kill resulted. The 'xicity of the lake remained high throughout the winter. By lay, 1959, minnows in a live-box lived for 2 weeks, thus it as assumed the lake had detoxified.
RESTOCKING
Restocking of the lake began during June, 1959 with the addion of 60,000 largemouth bass advanced fry (Table 1).
able 1. Species, numbers and size of fish stocked into Center Lake, 1959-66.
~ar Date Species Number Size ---· !59 June Largemouth bass 60,000 Advanced fry
September Largemouth bass 22,000 Fingerlings !60 March Bluegill 9,000 Adults
July Yellow bullhead 200 Adults August Yell ow bullhead 10,000 Fingerhngs August Largemouth bass 35,000 Fingerlings
)62 June Largemouth bass 30,000 Advanced Fry 163 August Northern pike 53 Adults
September Largemouth bass 8,300 Fingerlings October Northern pike 45 Adults November N orthcrn pike 24 Adults November Northern pike 32 Fingerlings
}64 January Northern pike 34 Adults April Northern pike 259 Adults August Yellow bullliead 6,000 Fingerlings September Largemouth bass 10,000 Fingerlings October Largemouth bass 4,000 Fingerlings
}65 August Northern-muskie hybrids 18 Fingerlings September Largemouth bass 10,000 Fingerlings
luring the last week of July, a severe oxygen depletion, precipirted by dying algae, was experienced. Following this summerill no dead leargemouth bass were noted. It was assumed that ven though the water had not been toxic to minnows it had been lxic to the small stocked bass. Fingerling bass were stocked in eptember, 1959. Traw1ing in October indicated good survival f this stocking. With the successful establishment of a predator opulation, 9,000 adult bluegills were stocked during March, 960. Crappies were inadvertently stocked along with the blueills in 1960. Yellow bullheads and northern pike have been :ocked since.
PoPULATION Srz.Es AKD GnowTI-I RATES
Bluegill. Seine hauls late in the 1960 summer, using 500 feet of ne-fourth-inch web indicated a large number of young bluegills. ince this is a special study lake, it was thought desirable to have more definite knowledge of this year-class size. During Septemer, 1962, a simple Peterson-type estimate of the bluegill popula_on was made. Bluegills were captured for marking with an otter
94 IOWA ACADEMY OF SCIENCE [VoL 74
trawl. One week later the ratio of marked to unmarked fish captured through trawling operations indicated a population of 562,000 bluegills. Seining during this same period captured marked to unmarked bucgills at .a ratio indicating a population of 1,157,000 fish or about 500 pounds per acre. The population estimate obtained by seining was considered excessive, whereas trawling seemed to have produced a more realistic figure. Consequently, the size of this year class was estimated at between 500,000 and 600,000 (Moen op. cit.). Recent observations, however, indicate the population estimate obtained by seining was more nearly correct.
Growth rates for the 1960 year class of Center Lake bluegills were obtained by using the standard scale examination method (Table 2). These total lengths at each annulus are only slightly below those reported by Mayhew ( 1956) for blue gills in West Okoboji Lake.
Table 2. Mean total length in inches at each annulus for the 1960 yearclass of bluegills in Center Lake as determined from examination of scale samples.
Sample Size 108
1 2.1
Mean length at each annulus 2 3 4 5 6
4.5 5.3 6.2 6.8 7.1
Test netting failed to indicate the presence of young bluegills until 1964. During 1964 an abundance of them was sighted near the weedy .areas of the lake. One seine haul in an area considered as poor habitat for young bluegills captured nearly 5,500. Based on these observations, it was apparent they would present a management problem in the near future. Consequently, it was decided to try and selectively lower the population of these fish by applying light dosages of rotenone. Beginning early in September, 1964 and continuing for 9 days, 22.5 gallons of liquid rotenone was applied along the shoreline at a rate of 1 gallon per 1,000 shoreline feet, or a calculated application rate of about 0.05 ppm. Because of the many problem involved in making an accurate estimate of tl1e number of young bluegills destroyed, the range of the estimated number killed was quite wide, between 500,000 and 1,000,000. During these applications fewer than 100 adult fishinclucling largemouth bass, northern pike, bluegills, and crappies -died. The effectiveness of this technique was apparent during 1965 when seining captured only fair numbers of yearling bluegills. Small hatches of bluegills have been observed during 1965 and 1966.
Black Crappie. During 1960, test netting demonstrated the presence of one young crappie for each 4 to 5 young bluegills. This ratio of about 20% was found in subsequent samplings done dur-

l7] LAKE RENOVATION 95
~ 1961 and 1962 (Moen op. cit. ). By assuming the bluegill popttion in 1962 to be approximately 1,100,000, then the crappie pulation should have been nearly 250,000, or about 140 pounds r acre. The average total length of crappies was dete1mined from acll measurements taken near the end of each growing season. :e overall growth is about average for this species in other lakes the region (Table 3).
ble 3. Mean total length in inches for the 1960 and 1964 year-classes of black crappies from Center Lake as determined from actual meausurements taken near the end of each growing season.
Mean length at end of each growing season 1960 3.4
1961 1962 1963 1964 1965 6.4 7.3 8.2 8.4 9.3
1966 9.4 8.1 2.6 6.6
Seine hauls using 500 feet of one-fourth-inch web failed to cap:e significant numbers of young crappies until1964. Since these ung crappies were inhabiting the deeper portion of the lake at ~ time chenlical work was done on the young bluegills, they ~re not measurably affected by the treatment. There has been od survival of this year class and they are now clearly the most undant year class of crappie in the lake. Their growth during ~ first 3 years approximated that of the 1960 year class. Reproction for this species during 1965 and 1966 has been limited. ~1isceNaneous Species. The largemouth bass population is ex.lent with 3 year classes present, 1959, 1962 and 1964. Natural )roduction of this species has been limited until 1966. )everal attempts to establish a yelow bullhead population in nter Lake have been unsuccessful. [n recent years black bullheads have become well established the lake even though there is no record of them having been ·eked. In the near future this species is not expected to cause ~nagement problems, such as those experienced prior to reno:ion. )ince renovation, no carp were captured from the lake until ~ spring of 1966 when one young and one adult were taken.
ANGLER HARVESTS AND UTILIZATION
l"ollowing chemical treatment Center Lake was out of producn, as far as the fisherman was concerned, for over 3 years. rring the latter part of 1962 the bluegills and crappies had atned a size acceptable to anglers. Since angler utilization of the ;e was expected to increase, it seemed desirable to have an esmte of the total number of each species caught and of total :ling pressure. Consequently, a comprehensive creel census, 1ilar to that described by Rose in 1956, was used. This census
{\ l;
96 IOWA ACADEMY OF SCIENCE [Vol. 74
was first used on this lake in 1963 and has been employed each year since. The census period during the first 3 years extended from May through October. The 1966 census period encompassed only the months of May through September. Fishing pressure during the remainder of the year is too light to justify a full-scale census.
As expected, bluegill was the most abundant species creeled, comprising 71% of the total estimated 4-year catch. Nearly all of these fish came from the 1960 year class. (Table 4).
Black crappie were second in creel abundance accounting for nearly 17% of the estimated harvest. Prior to 1966 nearly all of the crappie caught were from the 1960 year class. During 1966 the bulk of the catch was composed of 1964 year class fish. Fishing for other species in the lake was quite poor. The small number. of largemouth bass caught can probably be explained by the lack of angling for this species. Most of the bass recorded were caught accidentally by bluegill and crappie fishermen.
One of the most enlightening aspects of this project is the total amount of fish creeled when expressed in pounds per acre. During 1963, 1964, 1965, and 1966 anglers harvested approximately 170, 480, 260, and 190 pounds per acre. The 480 pounds per acre angler harvest for 1964 may seem unreal but from personal observation this figure should be reasonably close. It was not uncommon to see parties creel 200 bluegills during an afternoon of fishing. The most striking figure here is not only the high harvest for 1964 but rather the consistency with which high yields occurred. During an average year 275 pounds of fish per acre were creeled from this lake.
Angling pressure was quite heavy during these census periods, totaling nearly 124,200 angling trips, or an average of about 31,000 trips per year. Nearly 311,000 hours were spent fishing in tllis lake, approximately 77,800 hours per year. Average fishing pressure amounted to 117 angling trips totaling 295 hours per acre per year.
One of the best means of determining fishing success is by examining the number of fish creeled per fishing hour. Fishing success has been excellent during the census period in each of the 4 years with observed fish per hour rates of 4.6, 4.12, 2.58 and 2.19 annually.
DISCUSSION
It is apparent the renovation of this lake has been highly successful as demonstrated by the many hours of high quality fishing dming the last 4 years. The 3.53 average fish-per-hour rate for tllis period is substantially better than the 2.07 and 1.27 rates observed for two otl1er lakes in this region during the same time.

19671 LAKE RENOVATION
~ ~0'1(0~~~ ~ .~ ~~~i2~~ ~ ~ ~~~~0')~~~ cii ;;> t-~ I~
C'IOCOCO"""(OICO CO~t-C'l ,.c:l "i" l!) 0'1 O)C') CO C') 0 ·--HC ,.....; rP 1n~1n~co~t- ,...., t-~ "i"~~~a5~
- 8~c-1 ~~~~ co~ ~ '"""
97 98 !OW A ACADEMY OF SCIENCE [Vol. 74
Prior to renovation there was no indication that fishing in this lake would improve in the near future. Thus, it is assumed, that without this project, angler utilization of this lake would have been insignificant during the past 4 years.
The bulk of the bluegills caught were from the 1960 year class. These fish ·were in good body condition but by some standards they were small. Even though these fish were small, they were readily caught and because of this they were highly desired hy people participating in this form of recreation.
ACKNOWLEDGEMENTS
The author wishes to thank the many individuals involved in collecting data for this project and the men who spent considerahle time editing this paper. Special thanks is extended to Mr. Tom Nloen who initiated this project, supervised and set up procedures for collection of data prior to my appointment in northwestern Iowa.
Literature Cited Mayhew, James. 1956. The bluegill, Lepomis macrichirus (Ra£inesque) in
West Okoboji Lake, Iowa. Iowa Acad. of Sci. 63:705-713. Moen, Tom. M. 1962. Center Lake progress report. Iowa State Conserv.
Comm. Quarterly Biology Reports 14( 3) :48-51. Rose, Earl T. 1956. The quantitative creel census methods at Spirit Lake.
Iowa State Conserv. Comm. Quarterly Biology Reports 8( 2): 21-30.