quarterly compliance report
TRANSCRIPT
i
Quarterly Compliance Report:
National Electricity and Gas Laws
October – December 2013
Published February 2014

ii
© Commonwealth of Australia 2013
This work is copyright. Apart from any use permitted by the Copyright Act 1968, no part may be
reproduced without permission of the Australian Competition and Consumer Commission. Requests
and inquiries concerning reproduction and rights should be addressed to the Director Publishing,
Australian Competition and Consumer Commission, GPO Box 3131, Canberra ACT 2601.
Inquiries about this report should be addressed to:
Australian Energy Regulator
GPO Box 520
Melbourne Vic 3001
Tel: (03) 9290 1444
Fax: (03) 9290 1457
Email: [email protected]
AER reference: 52621-D14/6367

3
Contents Executive summary ..................................................................................................... 4
Background .................................................................................................................. 6
1 Strategic compliance projects .......................................................................... 7
1.1 MT PASA data accuracy .................................................................................... 7 1.2 Electricity metering metrics ................................................................................ 8 1.3 Performance of ancillary services for regulation ............................................. 9 1.4 Trends in power system operating incident reports ..................................... 12 1.5 STTM demand forecasting ............................................................................... 13 1.6 Electricity transmission connections ............................................................... 17
2 Gas ..................................................................................................................... 18
Short Term Trading Market ....................................................................................... 18 2.1 Capacity and allocation data quality ............................................................... 18 2.2 Epic Energy—incorrect, missing and late STTM data ................................. 18 2.3 Jemena EGP—late capacity data ................................................................... 20 2.4 AGL—incorrect capacity data .......................................................................... 20 2.5 APA Group—late capacity data ....................................................................... 20 2.6 Incitec Pivot—late capacity data ..................................................................... 21 2.7 Facility operator audits ...................................................................................... 21 Bulletin Board .............................................................................................................. 22
3 Electricity ........................................................................................................... 23
3.1 Rebidding ............................................................................................................ 23 3.2 Hydro Tasmania—MT PASA data .................................................................. 24 3.3 Metering compliance issues ............................................................................. 24 3.4 Technical audits ................................................................................................. 25 3.5 Targeted compliance review ............................................................................ 26 3.6 Network compliance projects ........................................................................... 27 3.7 Jurisdictional derogations ................................................................................. 29
Appendix A: Shortened forms ................................................................................. 30
Appendix B: Previous targeted compliance reviews ........................................... 31

4
Executive summary The purpose of this Quarterly Compliance Report (QCR) is to outline the Australian Energy
Regulator’s (AER) compliance monitoring and enforcement activity under the National Electricity Law
(Electricity Law) and National Gas Law (Gas Law)—including the rules and regulations which sit
under those Laws. This QCR covers the period 1 October to 31 December 2013 (the December 2013
quarter).1
In this report we conclude several of our strategic compliance projects conducted throughout 2013,
including:
MT PASA data accuracy
electricity metering metrics
performance of ancillary services for regulation
trends in power system operating incident reports
STTM demand forecasting
electricity transmission connections.
Of particular note is the electricity transmission connections project. This project involved a survey of
parties that have sought to connect to the National Electricity Market transmission network to assess
the performance of Transmission Network Service Providers (TNSPs) in terms of timeliness, provision
of information, cost, design, availability of competitive procurement and responsiveness to connection
applicants’ commercial requirements. The survey was sent out in mid-2013 and we have completed a
review of the responses. Due to the scope of the project and complexity of its results, we are
considering the findings and will report on this matter further next quarter.
Chapter two details our compliance and enforcement work undertaken for the gas markets. We
highlight that there were four data errors for the short term trading market (STTM) during the quarter.
There are updates on several incidents of incorrect, missing or late STTM data involving Epic Energy.
Epic paid an infringement notice in relation to one of these incidents and has implemented a number
of measures to ensure the quality of data it provides to AEMO improves. We also report on Bulletin
Board errors, including the failure by one facility operator to submit firm nomination data to AEMO on
nine occasions due to a server error during the implementation of customer reporting system
changes.
Chapter three discusses a number of electricity matters, such as:
generator rebidding activities, including three warnings issued with respect to rebid reasons
a failure by Hydro Tasmania to update its projected assessment of system adequacy (PASA)
availability for its scheduled generating units
metering compliance issues where a network service provider has either failed to install a
meter before energising a site or failed to register the connection with AEMO
1 Previous QCRs are available on our website.

5
the conclusion of our technical standards compliance program audit of AGL’s Macarthur wind
farm, the first wind farm to be examined under this process
a targeted compliance review of Electricity Rules clause 7.8.2 relating to the protection of
energy data from direct local or electronic access.
During 2014 two new areas the AER will be examining relate to network businesses. One involves
analysis of transmission business annual planning reports. This project will involve engaging with
network businesses to ensure that future annual planning reports meet the requirements of the
Electricity Rules. The second project relates to distribution network reliability and performance,
particularly at times of high demand as experienced during the early parts of 2014.
For those readers from network businesses, sections 1.3 (electricity metering metrics), 1.6 (electricity
transmission connections) and 3.6 (network compliance projects) will be of particular relevance.

6
Background The AER is responsible for monitoring compliance and enforcement under legislation and rules
governing Australia’s wholesale energy markets, including those applying to Network Service
Providers. Section 15 of the Electricity Law and section 27 of the Gas Law set out our functions and
powers, which include:
monitoring compliance by energy industry participants2 and other persons
investigating breaches, or possible breaches, of provisions of the legislative instruments
under our jurisdiction.
Consistent with our statement of approach, we aim to promote high levels of compliance, and seek to
build a culture of compliance in the energy industry. A culture of compliance will:
reduce the risk of industry participants breaching their regulatory obligations
assist in ensuring industry participants can engage confidently in efficient energy markets.
As part of this process, we undertake a continuous compliance risk assessment of the National
Electricity Rules (Electricity Rules) and National Gas Rules (Gas Rules) to identify appropriate focus
areas and monitoring/compliance mechanisms. These mechanisms include our strategic compliance
projects, audits, the imposition of reporting requirements, market monitoring, and targeted compliance
reviews.3
In selecting the areas for review, we adopt the following principles:
consideration of risk (the greater the risk, the higher the priority)
a commitment to ensuring that both systemic issues and those with the potential for isolated
but significant impact are addressed.
In carrying out our monitoring functions, we aim for:
cost effectiveness for energy industry participants and the AER
transparency (subject to confidentiality requirements).
While most obligations under the Electricity and Gas Rules do not require registered participants to
establish specific compliance programs, we take into account a participant’s compliance framework
when determining responses to breaches. In assessing compliance culture, we consider whether
compliance programs and processes are effectively applied, up-to-date and tested regularly.
2 Entities registered by AEMO under Chapter 2 of the Electricity Rules or in accordance with Part 15A of the Gas Rules.
3 Provisions of the Gas Rules and Electricity Rules that have been targeted for review in previous quarters are listed in
Appendix B.

7
1 Strategic compliance projects
Since 2011, the AER has reported on a stream of strategic compliance projects. All projects have
involved identifying a particular compliance problem, inefficiency, harm or risk within the energy
wholesale markets and working toward solving the issue or reducing its severity or likelihood. Most
projects have had a tailored metric in order to measure the AER’s and industry’s success. An update
on all current strategic compliance projects is below.
1.1 MT PASA data accuracy
The medium term projected assessment of system adequacy (MT PASA), published by AEMO,
provides the medium term power system supply/demand balance prospects for the next 24 months.
Following the introduction of the carbon price in July 2012 and subsequent increased likelihood of
generators’ operating modes becoming much more dynamic, it became more important that electricity
generators provided timely and accurate information, such as availability, to the market across all time
horizons. If information in the MT PASA is not accurate, participants may make ill-informed decisions
and, in the extreme, there could be an adverse impact on reserve levels and the reliability of the
power system.
In the March 2013 QCR, we announced a strategic compliance project to review MT PASA data. The
project was established to compare projected and actual generator availability per generation
portfolio. While fluctuations were expected, the project sought to identify any significant systemic
discrepancies.
As part of this project, we reviewed MT PASA data against actual generator availability from
1 October 2012 to 30 June 2013. In particular, we identified ‘zero availability’ periods of greater than
seven days and compared these to the corresponding MT PASA data inputs. Seven days was
identified as an appropriate threshold because since outages lasting longer than this period should
generally be reflected in MT PASA.
Based on our review, we identified approximately 160 zero availability periods of greater than
seven days. In most cases, these periods were fully or partially reflected in MT PASA. However, we
also found four instances of zero availability for greater than 14 days which was not reflected in
MT PASA. These events related to CS Energy and Stanwell.
In December 2013, we wrote to CS Energy and Stanwell to seek information to justify inconsistencies
between the various forecasting systems. In January 2014, the two participants responded and
confirmed that they did not update the MT PASA during these outages. Both Stanwell and CS Energy
stated that they did not update MT PASA during the forced outage periods as they did not
comprehend the complexity of the respective forced outages or expect the affected units to be out of
service for as long as they were. However, CS Energy acknowledged that an inadvertent error led to
MT PASA not being updated for a reserve shutdown. Both businesses have confirmed they will
review their MT PASA processes to ensure compliance in the future.
In 2014, the AER will continue to monitor these businesses, as well as the rest of the market, to
ensure MT PASA is updated in accordance with the Electricity Rules. In particular, we will use the
tools and measures we have developed as part of this strategic compliance project to ensure the
ongoing accuracy of MT PASA data in the National Electricity Market (NEM).

8
1.2 Electricity metering metrics
As highlighted by the AEMC’s Power of Choice review,4 metering arrangements play a crucial role in
the current and future operation of the NEM. It is important to ensure participants comply with their
metering obligations under the Electricity Rules in order to facilitate effective and efficient metering
processes.
We currently have two projects focusing on this area—metering data quality and the upgrade of
metering installations.
Metering data quality
In consultation with AEMO, we monitor the quality of metering data provided to AEMO’s market
settlement and transfer solution (MSATS) system. The MSATS system captures important connection
point information, such as the customer’s relevant distribution loss factor and retailer of last resort. It
also captures actual and aggregated metering data. AEMO is currently developing new reporting
metrics and seeking to improve the performance of MSATS users using targeted compliance activities
and participant engagement. We will continue to assist AEMO in this process.
Figure 1.2 below shows the number of MSATS errors made by each Local Network Service
Provider (LNSP) in the last week of each month since April 2010. We have reviewed total error levels
across the six errors and will be contacting LNSPs who have shown a consistently high number of
errors over that period.
Figure 1.1 Total MSATS errors across all LNSPs
0
1000
2000
3000
4000
5000
6000
7000
Nu
mb
er
of
err
ors
Non-active NMIs with an activedata stream and non-zero data(interval consumption)
NMIs that have not had theirstatus updated to 'active'
NMIs that have not beenupdated to 'extinct' within 5business days
NMIs that do not have a
network tariff code
NMIs that are believed to have
an incorrect TNI code
Non-active NMIs with an active
data stream and non-zero data(basic consumption)
4 Available on the AEMC website.

9
Upgrade of metering installations
The Power of Choice review noted that interval meters play an important role in facilitating demand
side participation. The metering rules and metrology procedures establish a series of volume limits
and accuracy thresholds for various types of meters. When the amount of energy through the meter
exceeds that threshold, the meter should be upgraded.
In June 2013, AEMO advised the AER that there were at least 275 metering installations that exceed
the accumulation meter volume threshold of 160 MWh per annum. In response, we wrote to the
20 retailers and distributors who have responsibility for these meters to seek resolution of the matter.
The participant responses highlighted the complexity surrounding these regulatory arrangements. In
particular, when the 160 MWh per annum consumption threshold is exceeded, the retailer should
initiate a request in the MSATS system to become the responsible person for the connection point
and upgrade the meter. However, the distributor will remain the RP for the connection point in the
MSATS system until this occurs.
In their responses, distributors indicated their frustrations in engaging with retailers on this matter. To
resolve the issue, some distributors identified they had increased their communications with retailers
to ensure the meter upgrades occurred. One distributor also noted it was unable to apply a demand
tariff until the meter was upgraded to an interval meter. It stated that a demand tariff was generally
applied to connection points greater than 160 MWh per annum, however the tariff could not be
applied if an accumulation meter was in place since it did not provide the appropriate data streams.
Retailers acknowledged they were responsible for upgrading the meters. In their responses, they
identified the processes they would use to upgrade the meters. However, they also identified the
problems they have encountered in seeking to upgrade meters. These issues have included acquiring
customer consent to proceed with the upgrades.
As at 31 January 2014, there were 195 meters which are required to be upgraded. In 2014, we will
engage with retailers to ensure progress is continued to be made on this compliance matter.
We will continue to report on the progress of these projects.
1.3 Performance of ancillary services for regulation
Frequency Control Ancillary Services (FCAS) are used to maintain the power system frequency within
the frequency standards set by the Reliability Panel. These services alter the output of generation or
demand side participants to ensure supply and demand are always in balance.
One frequency control service is called ‘regulation’. There are two types of regulation services—raise
and lower. Regulation services manage the small imbalances between supply and demand. AEMO
continually monitors the power system frequency and sends control signals to generators providing
regulation services via a centrally managed generator control system in order to maintain the
frequency within the normal operating band of 49.85Hz to 50.15Hz. Providers of regulation services
often receive signals related to regulation services simultaneously with dispatch instructions for the
energy market. Providers of regulation services are paid based on the clearing price for the service
and the amount of service enabled.
In March 2013, we announced a strategic compliance project to assess whether providers of
regulation services actually deliver the services they are paid to provide. The project came about as a
result of some earlier work investigating the extent to which generators follow dispatch instructions.

10
Some generators had claimed that deviations from dispatch instructions are warranted if the
generator is enabled to provide regulation services. For example, some generators argued that if they
are providing 20MW of raise and lower regulation in addition to energy, they have a range of 40MW
around their energy target within which they are always complying. While variations from the energy
target will sometimes occur as regulation services are utilised, without assessing the generators’
performance in delivering regulation services in more detail it is difficult to validate those claims.
The project
As a first step, we asked AEMO to develop a methodology to examine the performance of providers
of regulation services and to review whether participants were delivering these services in a way that
was consistent with the FCAS specification, while meeting AEMO’s expectations.
If an initial performance review indicated that there were potential compliance concerns, we would
follow up with the relevant participant, to ensure that it was capable of delivering (and actually
delivered) the appropriate amount of regulation services at the appropriate time in accordance with
the Electricity Rules.5
Method for performance assessment of Regulation FCAS
During 2013, AEMO developed a methodology to assess the performance of regulation FCAS
providers. The process involved the following steps:
AEMO collected data on actual power output and targets for each regulation FCAS service
provider over a period of time, typically one month. To manage the extent of data involved, a
sampling rate of 60 seconds was used.
For each sample, AEMO would determine:
whether regulation FCAS was enabled for raise or lower regulating duty; and
whether the system frequency was above or below 50 Hz;
When the system frequency is less than 50 Hz, raise regulation FCAS providers are
considered compliant if their actual power output is greater than or equal to its automatic
generation control (AGC) target control signal
When the system frequency is greater than 50 Hz, lower regulation FCAS are considered
compliant if their actual power output is less than or equal to its AGC target control signal;
A compliance assessment of a generator would only be made if:
the amount of regulation FCAS enabled was greater than 1 MW
the system frequency at the time was more than 0.01 Hz away from 50 Hz; and
the actual power output was non-compliant by more the 10 per cent of the AGC target.
While a number of factors, such as inherent time delays between a regulation FCAS provider
receiving an AGC signal and responding to that signal and AEMO’s relatively low sampling rate, may
5 Clauses 3.8.7A (k)-(m), 4.9.8(d) and 4.9.9B.

11
limit the precision of this methodology, we consider it is an appropriate filtering tool to identify
regulation FCAS non-compliance that may need to be examined in greater detail.
Results of analysis September – November 2013
In December 2013 AEMO provided the AER with a report which covered the three months to
November 2013. The report highlighted that on average, the number of minutes where regulation
services were not appropriately delivered compared to the number of minutes where generators were
enabled to provide those services ranged between six per cent and almost 30 per cent. Generators in
some regions appear to have consistently performed worse than others with non-compliance as high
as almost 40 per cent in some instances. Figure 1.1 below shows the average proportion of time
generators were not delivering regulation services when required in each region of the NEM across
the three months to November 2013.
Figure 1.2 Average proportion of time regulation service providers are not delivering services
0%
5%
10%
15%
20%
25%
30%
September October November
Av
era
ge
pro
po
rtio
n o
f ti
me
NSW QLD SA VIC TAS
The report highlighted two examples where participants appear to have performed particularly
poorly—one incident where the participant failed to follow its dispatch instructions in the energy
market, while the other highlighted a more systemic failure to follow AGC targets in a timely manner.
We have written to both participants to understand the circumstances for the apparent poor
performance and to ensure that these service providers comply with the Electricity Rules and FCAS
specifications by effectively delivering the regulation services for which they are paid.
While this stage of the strategic compliance project is now complete, we will continue to refine the
monitoring criteria and receive monthly performance reports from AEMO. We will monitor regulation
FCAS performance and where appropriate take steps, in conjunction with AEMO, to ensure
compliance with the requirements of ancillary service arrangements and the Electricity Rules are
satisfied.

12
1.4 Trends in power system operating incident reports
The AER relies on various information sources to support our compliance monitoring activities. One
source of information is AEMO’s power system operating incident reports, which are published in
accordance with clause 4.8.15 of the Electricity Rules. These reports assess the response of network
businesses and market participant facilities following a power system event, such as non-credible
contingency, multiple contingency, periods where the power system is not secure, the frequency is
outside defined limits or customer load shedding is required.
During 2013 we conducted a strategic compliance project to review the material included in power
system incident reports. The purpose of this project was to enable us to gain insights into power
system incidents trends and identify issues that may warrant further focus by participants and to use
this information to guide our compliance monitoring activities.
As part of the review we collated information from each power system incident report and assessed
whether significant or systemic compliance issues existed and if so whether any action was required.
We also conducted a detailed analysis to detect and review participants’ performance and compliance
trends. Specifically, we were able to gain insights into:
the correlation between participants’ performance and power system events
the common causes of power system incidents
trends (improvements or systemic issues) of an operational nature over time.
AEMO reported a total of 330 power system incidents over the between 2006 and 2013. The region
with the highest occurrence of power system incidents was Queensland with 93, followed by
Victoria (73), New South Wales (58), South Australia (54), and Tasmania (52). Victoria, which has the
third largest transmission system recorded the second highest number of power system incidents, in
part due to an increased number of incidents in 2009 associated with the February bushfire which
affected a number of transmission assets. Of the total 330 power system incidents:
over 200 events were non-credible contingency events
around a third resulted in the loss of generation
a quarter resulted in the interruption to customer supplies.
We conducted a more detailed analysis to review maloperations, for example where the power
system equipment did not operate as designed, or where the event was the result of human error.
This aspect of the review aimed to provide early warning indicators of procedural or process failures
within the network or generator businesses. It considered incidents from 2010 until mid-2013. Key
findings were:
there were 37 maloperation events, the majority of these events were related to incorrect
protection settings and faulty logic of protection relays. In some regions there were repeated
faults on the same transmission asset. This may be an indication of shortcomings in the way
network businesses implement and maintain a compliance program in accordance with
clause 5.7.4 of the Electricity Rules. This clause requires a network business to ensure that
certain facilities (to the extent that the proper operation of a facility may affect power system
security) operate reliably and in accordance with their performance requirements under
schedule 5.1.

13
there were 22 operator error events. The majority of these errors occurred during equipment
maintenance, with a significant number of these related to incorrect isolation of equipment.
This raises the question of whether participants have appropriate maintenance procedures
and processes consistent with good industry practice.
The number of maloperations and human error raises a number of concerns. A requirement to report
the maloperation of protection equipment has recently been introduced into the service target
performance incentive scheme (STPIS) that applies to transmission network businesses.
We will use the findings of this review and future power system incident reports to further refine and
tailor our technical compliance audit framework for the requirements of Electricity Rules clauses 4.15
(electricity generators) and 5.7.4 (network service providers).
AEMO’s power system incident reports are an important source of information for the assessment of
the performance of the market participants in accordance with good electricity industry practice. While
this project has now concluded, we will continue to monitor power system incident reports as part of
our routine compliance monitoring.
1.5 STTM demand forecasting
Demand forecasts are a primary input for STTM scheduling and are used to calculate the ex ante
price. Poor demand forecasting leads to inefficiencies in dispatch whereby the ex ante price is set on
the basis of a higher or lower quantity of gas than is required. It can also lead to higher Market
Operator Service (MOS) payments in the STTM, for example where large amount of MOS (balancing
gas which is parked on or loaned from pipelines) is required as a result of poor forecasts adding to
market costs.
Gas rule 410(1) requires each STTM trading participant who expects to withdraw quantities of natural
gas from a hub on a gas day to submit ex ante bids or price taker bids (and any revisions to those
bids) in good faith to reflect the participant’s best estimate of the quantity it expects to withdraw on
that gas day (these bids in effect reflect each participant’s demand forecast).
In 2012, we commenced a project in response to ongoing occurrences of poor demand forecasting
from a number of STTM participants. A particular concern was the uneven distribution of under and
over forecasting of demand. We consider that a best estimate approach to demand forecasting as
required under the Gas Rules should result in an approximately even distribution of under and over
forecast demand days over time. We were also concerned by large avoidable demand forecast errors,
for example, those caused by system errors.
Accordingly, throughout 2013 we applied metrics to each STTM hub to identify patterns in demand
forecasting errors. Based on our monitoring we contacted participants in regard to large differences
between forecast and actual demand and observed trends in under and over forecasting. Previous
Quarterly Compliance Reports have presented information related to the demand forecasting
performance of a number of participants (Incitec Pivot, Adelaide Brighton Cement Limited, Origin
Energy and AGL Energy).

14
Adelaide hub
Since STTM market start there has been a reduction in the number of participant errors that
collectively exceed 6 TJ in the Adelaide hub (see figure 1.3).6 The pattern of over forecasting of hub
demand which we saw in late 2012 (when 90 per cent of days were over forecast with high average
errors) has not reoccurred, however there were some months in 2013 where around 80 per cent of
days were over forecast. The rolling average for the previous 12 months indicates that demand in the
Adelaide hub has been over forecast for around 60 per cent of days, (see figure 1.4).
Figure 1.3 Error as a proportion of total load and actual error volumes in the Adelaide hub7
-14%
-10%
-6%
-2%
2%
6%
10%
14%
-14
-10
-6
-2
2
6
10
14
Sep
10
Oct
10
No
v 10
De
c 1
0Ja
n 1
1Fe
b 1
1M
ar
11
Ap
r 1
1M
ay
11
Jun
11
Jul 1
1A
ug
11
Sep
11
Oct
11
No
v 11
De
c 1
1Ja
n 1
2Fe
b 1
2M
ar
12
Ap
r 1
2M
ay
12
Jun
12
Jul 1
2A
ug
12
Sep
12
Oct
12
No
v 12
De
c 1
2Ja
n 1
3Fe
b 1
3M
ar
13
Ap
r 1
3M
ay
13
Jun
13
Jul 1
3A
ug
13
Sep
13
Oct
13
No
v 13
De
c 1
3
Me
an E
rro
r
Erro
r (T
J)
Monthly mean (%) Error (TJ)
October 2012 had a
large proportion of over forecasting errors
Figure 1.4 Days over forecast each month and actual error magnitudes in the Adelaide hub
0%
20%
40%
60%
80%
100%
0
1
2
3
4
5
6
7
8
Sep2010
Nov2010
Jan2011
Mar2011
May2011
Jul2011
Sep2011
Nov2011
Jan2012
Mar2012
May2012
Jul2012
Sep2012
Nov2012
Jan2013
Mar2013
May2013
Jul2013
Sep2013
Day
s in
mo
nth
ove
r fo
reca
st (
%)
Erro
r m
agn
itu
de
(TJ
)
Average magnitude over forecast (TJ) Days over forecast (%) Rolling average (%)
Concerning periods in 2012
Sydney hub
Forecast errors in the hub have generally remained around 4 per cent of the collective demand of
participants in the Sydney hub throughout 2013. There has been a tendency towards
over forecasting, following the longer term trend towards even levels of under and over forecasting
across 2012 (see figure 1.6). Similar to Adelaide, the 12 month rolling average indicated mid-year that
6 This data excludes Adelaide Brighton Cement, to remove the effect of unplanned outages (refer to the December 2012
QCR for more information)
7 Error = Actual – Forecast

15
demand in the Sydney hub has been over forecast for around 60 per cent of days. This trend has
risen in recent months and is now around 70 per cent for the 2013 calendar year.
Figure 1.5 Error as a proportion of total load and actual error volumes in the Sydney hub
-5%
-4%
-3%
-2%
-1%
0%
1%
2%
3%
4%
5%
-50
-40
-30
-20
-10
0
10
20
30
40
50
Sep
10
Oct
10
No
v 10
De
c 1
0Ja
n 1
1Fe
b 1
1M
ar
11
Ap
r 1
1M
ay
11
Jun
11
Jul 1
1A
ug
11
Sep
11
Oct
11
No
v 11
De
c 1
1Ja
n 1
2Fe
b 1
2M
ar
12
Ap
r 1
2M
ay
12
Jun
12
Jul 1
2A
ug
12
Sep
12
Oct
12
No
v 12
De
c 1
2Ja
n 1
3Fe
b 1
3M
ar
13
Ap
r 1
3M
ay
13
Jun
13
Jul 1
3A
ug
13
Sep
13
Oct
13
No
v 13
De
c 1
3
Me
an E
rro
r
Erro
r (
TJ)
Monthly mean (%) Error (TJ)
Figure 1.6 Days over forecast each month and actual error magnitudes in the Sydney hub
0%
20%
40%
60%
80%
100%
02468
101214161820
Sep
201
0
Oct
201
0
No
v 20
10
De
c 2
01
0
Jan
20
11
Feb
201
1
Ma
r 2
01
1
Ap
r 2
01
1
Ma
y 2
011
Jun
20
11
Jul 2
01
1
Au
g 2
011
Sep
201
1
Oct
201
1
No
v 20
11
De
c 2
01
1
Jan
20
12
Feb
201
2
Ma
r 2
01
2
Ap
r 2
01
2
Ma
y 2
012
Jun
20
12
Jul 2
01
2
Au
g 2
012
Sep
201
2
Oct
201
2
No
v 20
12
De
c 2
01
2
Jan
20
13
Feb
201
3
Ma
r 2
01
3
Ap
r 2
01
3
Ma
y 2
013
Jun
20
13
Jul 2
01
3
Au
g 2
013
Sep
201
3
Oct
201
3
No
v 20
13
De
c 2
01
3
Day
s in
mo
nth
ove
r fo
reca
st
Erro
r m
agn
itu
de
(TJ
)
Average magnitude over forecast (TJ) Days over forecast (%) Rolling average (%)
Concerning periods in 2013
Brisbane hub
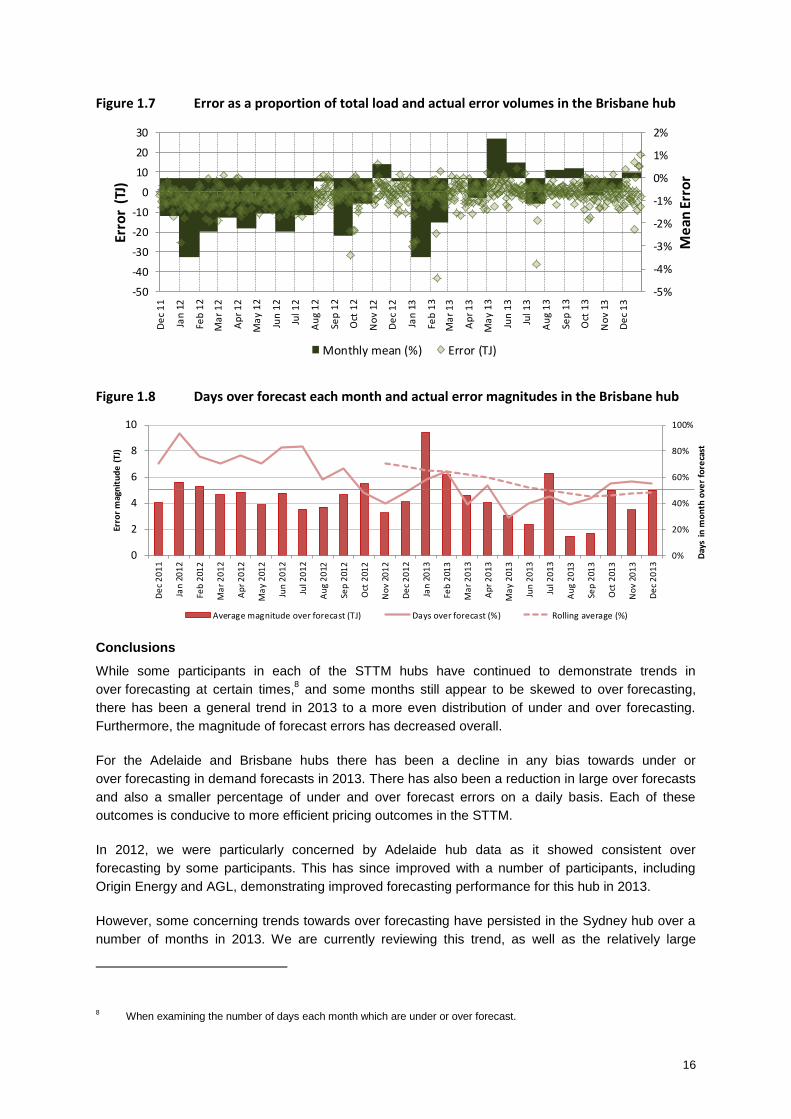
For the Brisbane hub there has been a significant long term reduction in the magnitude of absolute
errors and the number of days with large over forecasting errors (see figures 1.7 and 1.8). There has
been a reduction in the trend of over forecasting, with the rolling average for the last 12 months
indicating that demand has been over forecast for around 45 per cent of days in the Brisbane hub.
16
Figure 1.7 Error as a proportion of total load and actual error volumes in the Brisbane hub
-5%
-4%
-3%
-2%
-1%
0%
1%
2%
-50
-40
-30
-20
-10
0
10
20
30
De
c 1
1
Jan
12
Feb
12
Ma
r 1
2
Ap
r 1
2
Ma
y 1
2
Jun
12
Jul 1
2
Au
g 1
2
Sep
12
Oct
12
No
v 12
De
c 1
2
Jan
13
Feb
13
Ma
r 1
3
Ap
r 1
3
Ma
y 1
3
Jun
13
Jul 1
3
Au
g 1
3
Sep
13
Oct
13
No
v 13
De
c 1
3
Me
an E
rro
r
Erro
r (
TJ)
Monthly mean (%) Error (TJ)
Figure 1.8 Days over forecast each month and actual error magnitudes in the Brisbane hub
0%
20%
40%
60%
80%
100%
0
2
4
6
8
10
De
c 2
01
1
Jan
20
12
Feb
201
2
Ma
r 2
01
2
Ap
r 2
01
2
Ma
y 2
012
Jun
20
12
Jul 2
01
2
Au
g 2
012
Sep
201
2
Oct
201
2
No
v 20
12
De
c 2
01
2
Jan
20
13
Feb
201
3
Ma
r 2
01
3
Ap
r 2
01
3
Ma
y 2
013
Jun
20
13
Jul 2
01
3
Au
g 2
013
Sep
201
3
Oct
201
3
No
v 20
13
De
c 2
01
3
Day
s in
mo
nth
ove
r fo
reca
st
Erro
r m
agn
itu
de
(TJ
)
Average magnitude over forecast (TJ) Days over forecast (%) Rolling average (%)
Conclusions
While some participants in each of the STTM hubs have continued to demonstrate trends in
over forecasting at certain times,8 and some months still appear to be skewed to over forecasting,
there has been a general trend in 2013 to a more even distribution of under and over forecasting.
Furthermore, the magnitude of forecast errors has decreased overall.
For the Adelaide and Brisbane hubs there has been a decline in any bias towards under or
over forecasting in demand forecasts in 2013. There has also been a reduction in large over forecasts
and also a smaller percentage of under and over forecast errors on a daily basis. Each of these
outcomes is conducive to more efficient pricing outcomes in the STTM.
In 2012, we were particularly concerned by Adelaide hub data as it showed consistent over
forecasting by some participants. This has since improved with a number of participants, including
Origin Energy and AGL, demonstrating improved forecasting performance for this hub in 2013.
However, some concerning trends towards over forecasting have persisted in the Sydney hub over a
number of months in 2013. We are currently reviewing this trend, as well as the relatively large
8 When examining the number of days each month which are under or over forecast.

17
average over forecast error volumes of between 6.3 TJ and 12.7 TJ. As part of this review, we will
examine the performance of individual participants with regard to provisional and ex ante forecasts.
We encourage participants to continue to refine their demand forecasting methodologies. We will
continue to monitor participant demand forecasts and will publish charts of forecasting errors (similar
charts to those set out above) in Quarterly Compliance Reports from time to time. Where we are
concerned with demand forecasts we will contact individual participants for further explanation and
not hesitate to take enforcement action where demand forecasts do not reflect best estimates or
should gaming of demand forecasts be apparent. In the future, we hope to extend our analysis of
demand forecasts to include those relating to the Victorian gas market.
1.6 Electricity transmission connections
Our electricity transmission connections strategic compliance project commenced in December 2011.
The project arose in response to concerns raised by connection applicants about the transmission
network connection process. It involves a survey of parties that have sought to connect to the NEM
transmission network.
The survey sought to assess compliance by Transmission Network Service Providers (TNSP) with the
Electricity Rules and to determine how satisfied connecting customers were with the connection
process. It focused on the performance of network businesses in terms of timeliness, provision of
information, cost, design, availability of competitive procurement and responsiveness to the
connecting customer’s commercial needs.
We developed the survey in consultation with the TNSPs and sent it to connecting customers in
June 2013. Responses to the survey were due by August 2013 and we have now completed a review
of the responses. Due to the scope of the project and the complexity of its results, we are considering
the findings and will report on this matter further next quarter.

18
2 Gas
We are responsible for monitoring, investigating and enforcing compliance with the Gas Law and
Rules, including but not limited to, the Short Term Trading Market (STTM), the Victorian gas market
and the Bulletin Board.
This part of the report provides an update on investigations, compliance matters and projects in the
gas markets.
Short Term Trading Market
Part 20 of the Gas Rules sets out participants’ responsibilities within the STTM, which encompasses
three gas trading hubs: Adelaide, Sydney and Brisbane. The rules outline how wholesale gas is
traded and include requirements for pipeline operators to submit pipeline capacity and allocation
(gas flow) data.
2.1 Capacity and allocation data quality
This quarter we continued to monitor the quality of STTM data. Figure 2.1 below illustrates the
performance of STTM participants in submitting capacity and allocation data from the start of the
STTM to December 2013. Data failures are categorised as relating to either ‘missing/late’ or
‘erroneous’ data. We are concerned about the number of data failures since mid-2013, after the
period of no errors from mid-2012 to early 2013.
Figure 2.1 Data failures since STTM commencement
0
1
2
3
4
5
6
7
8
Nu
mb
er
of
da
ta f
ailu
res
Missing/late data Erroneous data
2.2 Epic Energy—incorrect, missing and late STTM data
In the previous QCR we noted four incidents in which Epic Energy, as the facility operator for the
Moomba to Adelaide Pipeline (MAP), failed to submit accurate and timely data to AEMO. Below we
provide an update in relation to those four incidents and introduce a further incident involving Epic
which occurred during the quarter.
19
Incorrect MAP allocation data
Epic provided incorrect pipeline data for the MAP to AEMO on 13 days over June and July 2013 due
to a loose connection with an input resistor that connects into a terminal at one of the meter runs at
the Gepps Cross Meter Station. This caused a meter to display flow readings, even though there was
no actual gas movement.
Epic experienced an identical issue in 2012. In response it advised the AER that it had initiated a
change control process to put in place alarms to identify when erroneous data might be generated.
Later in 2012, Epic told the AER the alarms had been implemented.
Epic’s ownership changed in 2013 as part of an acquisition of pipeline assets by the APA Group and
a subsequent divestment of the Epic business which operates the MAP.
Following the errors in June and July 2013, Epic’s new management informed the AER that the
alarms had not in fact been implemented. Epic has since told the AER it will now implement such
alarms for its systems.
The AER believes the recent errors would likely not have occurred if Epic had implemented the
alarms in 2012. We consider that the lack of appropriate systems to alert Epic when incorrect flows
were being recorded along with Epic’s failure to address this issue after it has been identified
constitute a breach of Good Gas Industry Practice (GGIP), as defined in the Gas Rules.
On this basis, the AER issued Epic an infringement notice in December 2013, which Epic paid on
9 January 2014. We published a detailed investigation report into the matter.
Following the latest incident, Epic has introduced two main measures to improve compliance:
implementation of alarm management software; and introducing a different model of Flow Computer,
in which the Resistors are internal to improve connection integrity. Alarm Management Forum is
scheduled to be completed by the end of January 2014.
Missing MAP allocation data
On 5 August 2013, Epic failed to submit pipeline allocation data for the MAP to AEMO. Epic explained
that this incident was as a result of a failure of the automatic submission of data due to the expiry of a
password within Epic’s Customer Reporting System (CRS). Manual submission was also incorrect
due to files being submitted in the incorrect order and fault with the file naming convention. Following
this incident, Epic advised that it has implemented a new system to track the expiry of CRS
passwords. It also updated its procedures to recognise file ordering conventions and it provided
training to ensure operators are familiar with the relevant procedures.
Late capacity data
On 8 August 2013, Epic failed to submit facility hub capacity data for the MAP to AEMO by the
9:30am cut-off. Epic advised that the file transfer application that delivers the files to AEMO site failed
to operate correctly. In addition, Epic Pipeline Controller incorrectly interpreted a ‘Generate’ status on
a report as reflecting a successful submission. Following this incident, Epic advised that the issue with
the file transfer scheduler was resolved immediately once it has identified the issue. Epic also noted
that it has provided training regarding the interpretation of the file status.
Late submission of MAP allocation data
In the previous QCR we reported that Epic failed to submit accurate allocation files by the cut-off time
on 4 September 2013 because its CRS was programmed to reject values greater than 10TJ.

20
Following this incident, Epic reviewed the issue together with the CRS vendor to identify a permanent
solution, which is expected to be implemented in February 2014.
Late submission of capacity data
This quarter, on 8 October 2013, Epic failed to submit facility hub capacity data for the MAP to AEMO
by the 9:30am cut-off. Epic explained that following the transfer of its CRS from Melbourne to its new
operations base in Adelaide, the CRS server failed to operate due to a problem with the File Transfer
Protocol (FTP) transfer system. Following the CRS failure, there was also a problem with the manual
backup submission due to an expired hyperlink. In response, Epic took remedial measures to address
this issue including updating the backup system, addressing the hyperlink issue immediately following
the incident and providing refresher and ongoing training to staff on manual processes.
2.3 Jemena EGP—late capacity data
On 6 October 2013, Jemena EGP automatically submitted the facility hub capacity file for gas days
7, 8, and 9 October 2013 as per its normal data submission process. The previous day Jemena EGP
requested its external IT service provider to amend the automatic submission time of the capacity file
to allow for daylight savings. The IT changes were not actioned and Jemena incorrectly submitted its
capacity file at 6am AEST. This meant Jemena failed to meet the timing requirement under the Gas
Rules to submit capacity files between 6:30am AEST (the start of the Sydney STTM gas day) and
9:30am AEST. Jemena has advised of a number of remedial measures including reconfiguring the
daily facility hub capacity submission timing so that the event should not reoccur.
2.4 AGL—incorrect capacity data
As reported in the previous QCR, AGL submitted incorrect capacity information to AEMO for its
Camden facility for the 1 April 2013 gas day.
Following this incident and pursuant to an undertaking provided to the AER, AGL undertook an
operational review (a lean six sigma review which focused on the consistency of process and
understanding across the trading team as well as opportunities for cultural and system improvements)
and as a result has implemented a number of measures which aim to prevent further STTM data
issues. AGL reported on recommendations to the AER in November 2013 and has implemented
some of the recommended changes, such as improving communication between operations staff at
the Camden facility and the Melbourne trading team. In addition, a number of system changes will be
implemented.
2.5 APA Group—late capacity data
On 14 October 2013, APT Petroleum Pipelines (APA Group) failed to submit D-1 facility hub capacity
data before the 11am cut-off for the Roma to Brisbane Pipeline for the 15 October 2013 gas day due
to a fault in its automated processes. APA explained that it was not able to complete the manual
generation and upload of the file before the cut-off time (they were 25 seconds late) due to an
unexpected staff absence.
APA advised that it has implemented a number of measures to reduce the likelihood of reoccurrence
in the future, including changes to improve the speed of creating and submitting data and to allow
more time for potential manual submission requirements, system alerts when files are not successfully
received by AEMO, and refreshing relevant staff on STTM reporting obligations.

21
2.6 Incitec Pivot—late capacity data
Incitec Pivot (Incitec) did not submit an offer for the D-3 schedule for the 4 December 2013 gas day
in the Brisbane hub. This contributed to the D-3 provisional price reaching $13.50/GJ. Incitec
subsequently submitted offers at the D-2 and D-1 schedules.
Rule 410(1) of the National Gas Rules requires STTM participants to submit in good faith ex ante
offers that reflect best estimates of the quantities of natural gas they expect to supply.
In response to our inquiries, Incitec explained that the failure was due to staffing issues. It has taken
the following steps to prevent similar issues from occurring:
adjusting the nominations and bid/offer recording spreadsheet to contain valid bids and offers
(recorded with relevant id numbers) for at least five days out from D-1
amending internal procedures to formally document that the relevant trader must submit bids
and offers at the usual load level for the entire month ahead.
We will continue to monitor Incitec’s submission of bids and offers to ensure future compliance.
2.7 Facility operator audits
Since 2011, we have been progressively undertaking compliance audits of STTM participants. This
series of audits, which looks at compliance with information and data obligations under Part 20 of the
Gas Rules, is an ongoing effort to improve the culture of compliance with STTM obligations across the
industry. This quarter we completed the fifth and final audit under this process, examining SEA Gas
with respect to the SEA Gas pipeline.
The audit involved four steps:
issuing SEA Gas an audit questionnaire
reviewing SEA Gas’s response to ascertain whether it adequately met the aim of the audit
a site visit to the SEA Gas head office to discuss questions and issues that arose from SEA
Gas’s response
issuing SEA Gas with an audit report outlining conclusions and recommendations.
Following the audit meeting on 11 December 2013, we were satisfied that the processes and systems
which SEA Gas has in place, if implemented and maintained appropriately, are sufficient to satisfy the
applicable information and data obligations under Part 20 of the Gas Rules. We were particularly
impressed with the electronic alert systems that SEA Gas has gradually built up since STTM market
start and consider the processes for maintaining and updating these systems to be industry best
practice.
Our key findings were:
Due to the limited size of the operations of SEA Gas and its technologically advanced pipeline
infrastructure (relative to many other pipelines in Australia), SEA Gas has been able to
automate systems to both meet STTM obligations and to monitor compliance obligations and
issues as they arise.

22
SEA Gas could improve its processes around communication with the AER on compliance
issues. For example, by requiring staff to proactively report any compliance issues as soon as
they are discovered.
This audit concludes our series of STTM information and data audits.
Bulletin Board
Part 18 of the Gas Rules sets out participants’ responsibilities regarding the Bulletin Board. These
obligations aim to facilitate greater transparency in gas production and gas pipeline flows to assist gas
trading. The obligations also require participants to identify and report any potential conditions where
curtailment of gas use might be necessary.
Participants submit daily pipeline nominated and forecast delivery data as required by gas rule 173.
During the quarter, one facility operator failed on a total of nine occasions to submit firm nomination
Bulletin Board data to AEMO on the relevant gas day. The missing nominations were due to a server
error during the implementation of customer reporting system changes. This issue was notified to the
AER shortly after occurring.
Participants submit daily production and pipeline flow data as required by gas rules 166 and 174.
During the quarter, three facility operators failed on a total of eight occasions to submit daily flow
Bulletin Board data to AEMO.
We will continue to track non-compliance with Bulletin Board requirements and pursue any systemic
breaches.

23
3 Electricity
We are responsible for monitoring, investigating and enforcing compliance under the Electricity Law
and Rules.
This part of the report provides an update on investigations, compliance matters and projects in the
electricity market.
3.1 Rebidding
Scheduled generators and market participants operating in the National Electricity Market (NEM)
submit electricity offers and bids for each half hour trading interval. The offers and bids include
available capacity for up to 10 price bands, and can be varied through rebidding.9
We adopted a new strategy in relation to enforcing generator rebidding reason requirements in
2010.10
Generators that submit offer, bid and/or rebid information that does not meet the requirements
of the Electricity Rules will receive two warnings. On the third warning within six months, we will
consider issuing an infringement notice. A participant’s warning count is set to zero after six months.
Figure 3.1 shows that since 2010 the number of rebids detected by our internal compliance system
has fallen markedly. The number of rebids which required further review has also fallen significantly.
Figure 3.1 Rebids auto-triggered and reviewed per week
0
200
400
600
800
1000
1200
Jan 1
0
Ma
r 10
Ma
y 10
Jul 10
Sep
10
Nov 1
0
Jan 1
1
Ma
r 11
Ma
y 11
Jul 11
Sep
11
Nov 1
1
Jan 1
2
Ma
r 12
Ma
y 12
Jul 12
Sep
12
Nov 1
2
Jan 1
3
Ma
r 13
Ma
y 13
Jul 13
Sep
13
Nov 1
3
Reb
ids
Auto triggered Reviewed
Compliance bulletin published
9 Market participants must provide to AEMO, at the same time as a rebid is made, a brief, verifiable and specific reason for
the rebid, plus the time at which the reason for the rebid occurred. Equivalent requirements apply where AEMO is advised, under clause 3.8.19 of the Electricity Rules, that a unit, service or load is inflexible. Clause 3.8.22A of the Electricity Rules requires that dispatch offers, dispatch bids and rebids are made in ‘good faith’.
10 In June 2012, we published an updated Compliance Bulletin No. 3 to make it clear that, for the purposes of administering
the three stage process and issuing warnings, we will rely on the cumulative count of non-compliant bids for all generating units under the same portfolio. In other words, where a parent company employs a common trading team for the bidding of multiple generating units in its portfolio, irrespective of whether these generators are different registered participants, we will count any non-compliant bids by that trading team together.

24
During the December quarter, we issued three warnings. One was an initial warning with respect to a
rebid which did not contain a time adduced in the reason nor was the reason verifiable or specific.
The second warning was with respect to a rebid which saw a generator’s ramp rate reduced to below
the allowed minimum of 3MW/minute without a technical reason. The third was with respect to a rebid
which made plant inflexible and the reason did not contain a technical reason.
Participants notified us that there was an error in their rebids on 11 occasions during the quarter and
one participant had its warning count reset to zero.
3.2 Hydro Tasmania—MT PASA data
The Electricity Rules requires each scheduled generator or market participant to provide projected
assessment of system adequacy (PASA) availability for each scheduled generating unit, scheduled
load or scheduled network service in accordance with a timetable determined by AEMO.
On 15 January 2014, Hydro Tasmania reported to the AER that it had failed to update its PASA
availability in accordance with AEMO’s timetable from 4 November 2013 to 26 November 2013. It
stated that a system change created two faults, including stopping the automatic submission of
medium term PASA (MT PASA) data and causing a failure in the ‘health check’ of the system. Hydro
Tasmania has reported to the AER that remedial actions have been implemented to ensure the error
doesn’t reoccur.
We will continue to monitor the performance of Hydro Tasmania regarding its MT PASA inputs in
2014. We take this opportunity to remind other participants of the importance of providing accurate
MT PASA information to AEMO.
3.3 Metering compliance issues
We have become aware of three separate occasions where a network service provider has either
failed to install a meter before energising a site or failed to register the connection with AEMO.
In July 2013, AEMO notified the AER that Powerlink and Ergon Energy had each commissioned
metering installations but not registered them with AEMO in accordance with the connection
requirements under clause 5.3.7(g) of the Electricity Rules. In response to AER requests, Powerlink
and Ergon Energy agreed to take remedial actions in relation to this matter, including a review of their
policies and procedures for registering metering installations.
In October 2013, Energex energised a new connection point without a meter, thereby failing to meet
the requirements under clause 7.3 of the Electricity Rules. Energex also undertook to investigate the
matter and review its policies and procedures for metering installations and connections of sites.
More recently, we have been made aware of a further metering installation issue which is still under
investigation. We will report on this matter in due course.
These recent instances of non-compliance highlight potential issues with the current adequacy of
internal metering installation procedures. The AER considers it essential that appropriate procedures
and checks are in place so that the requirements applying to metering installations are appropriately
met. We will continue to monitor this issue closely in conjunction with AEMO to determine whether
there is a systemic failure by industry in this area and what, if any, action we might take.

25
3.4 Technical audits
Auditing is one mechanism we use to verify and assess compliance by registered participants with
their obligations. The audits aim to ensure participants have robust and effective compliance
programs in place that are consistent with Good Energy Industry Practice.
We conduct regular technical compliance audits in the electricity sector of generators and network
service providers. These audits generally focus on the Electricity Rules clauses 4.15 and 5.7.4,
particularly the requirement on electricity generators and network service providers to institute and
maintain a compliance program in accordance with prescribed requirements.
In particular, the mandated compliance program must:
include procedures to monitor the performance of the plant in a manner that is consistent with
good electricity industry practice
provide reasonable assurance of ongoing compliance with applicable performance standards
registered with AEMO.
AGL Hydro Partnership’s Macarthur wind farm was the first wind generator to be examined under this
process. This technical compliance audit was concluded this quarter, with the following key findings:
AGL has well established governance arrangements and a compliance culture that is
supported at all levels of the organisation
the creation of a group-wide Office of the Chief Engineer who is responsible to assist on
technical matters, is a positive measure to boost technical expertise within the company
group11
relative to thermal plants, and not uncommon for wind farms, there is a significant reliance on
third parties (for example, the turbine manufacturer) for operational matters according to the
type of turbine technology used, and associated maintenance and warranty programs.
In relation to the third finding, we remind registered participants that they are responsible for meeting
compliance obligations, regardless of the use of third party providers. It is the registered participant
who would be subject to any regulatory action in the event of a breach of the Electricity Rules.
During this audit process, we identified a number of areas for further enhancement to the technical
compliance arrangements for Macarthur, which AGL has agreed to address. The critical enhancement
is the finalisation of the procedures that are being developed and are required in support of the
compliance program for generator performance standards. In this regard, the AER also reminds
generators that these procedures are mandated under clause 4.15(c)(2) of the Electricity Rules.
Overall, this technical audit has confirmed that, AGL Hydro Partnership—through its parent company,
AGL Energy Limited—has established and is continuing to develop a compliance program for
Macarthur that should provide a reasonable assurance of ongoing compliance with registered
performance standards.
11 This compares to the more common model observed by the AER of engineering expertise at each plant, supported by
centralised compliance oversight

26
The next technical compliance audit will examine the South Australian transmission network service
provider, ElectraNet.
3.5 Targeted compliance review
Targeted compliance reviews form an important part of our monitoring program. The reviews explore
participants’ compliance practices and aim to improve stakeholder understanding of obligations. A list
of the provisions targeted under this process since the June 2011 quarter is provided in appendix B of
this report.
This quarter we conducted a review of the Electricity Rule 7.8.2 which requires the Responsible
Person (RP) to ensure that energy data held in its metering installations is protected from direct local
or electronic access. In accordance with clause 7.8.2(c),12
the RP must have suitable password and
security controls in place to ensure this data is adequately protected. These controls are, in turn,
managed by a Metering Provider (MP) as defined in the Electricity Rules.
In accordance with Chapter 7 of the Electricity Rules, the metrology procedure and procedures
authorised under the Electricity Rules an RP is the person responsible for the:
provision, installation, and maintenance of a metering installation; and
collection of metering data from each metering installation for which it is responsible, the
processing of that data and the delivery of the processed data to the metering database and
to parties entitled to that data under rule 7.7(a), except as otherwise specified in clause
7.2.1A(a).
As part of this review, we wrote to a number of participants who are defined as RPs under the
Electricity Rules. We requested each business to review its arrangements for compliance with clause
7.8.2(a). Responses from ERM Power, Energy Australia and Aurora Energy are summarised below.
Systems and procedures in place to meet the requirement to protect energy data
As required, ERM Power engages AEMO-accredited MPs. ERM states the AEMO accreditation
specifically requires MPs to keep meter data secure as contemplated by clause 7.8.2 of the Electricity
Rules. Previously ERM Power relied solely on AEMO accreditation and its audit program, however it
recently commenced a review to have its contracts mandate:
compliance with 7.8.2(c) as a requirement of the MP
MPs to supply their AEMO audit outcomes to ERM, and specifically advise any non-
compliance
MPs to formally advise any issues with physical access and any actions taken to remedy
these.
EnergyAustralia’s contracts with MPs and Meter Data Providers (MDP) note the regulatory
requirements of the Electricity Rules and the Service Level Procedures. EnergyAustralia does not
require the passwords from MPs or MDPs as it only utilises metering data (not energy data).
12 This clause is classified as a civil penalty provision

27
EnergyAustralia currently utilises two billing systems with controls on who has access to the meter
data. Customers can access their own metering data from an online portal via a process that
authenticates the customer’s right of access for the NMI associated with their premise.
Aurora Energy acts as the Financially Responsible Market Participant (FRMP) and its distribution
business acts as the Metering Provider B (MPB). Aurora MPB uses random string password
protection on all remote read meters. Market participants have specific usernames, and the security
level allowed is based on the participant’s role. Passwords are maintained in a secure register with
access limited to relevant staff.
Outsourcing or other arrangements with respect to tasks undertaken under this clause, and
measures taken to ensure that third parties achieve ongoing compliance
ERM ensures compliance of its MPs through their required AEMO accreditation and by mandating the
three additional requirements in its contracts with them.
EnergyAustralia relies on AEMOs independent auditing of MPs and MDPs to ensure these parties
meet their obligations. It also relies on the MP and MDP to inform the FRMP of customers wanting to
access metering data, as required under clause 7.7a of the Electricity Rules. If customers are
requesting metering data through an energy advisor, EnergyAustralia requires a letter of authorisation
from the customer before it releases any data.
Aurora Energy outsources the management of some meter installations to MPs. All parties that
Aurora contracts with are registered providers under the Electricity Rules. Agreements held with these
parties include requirements to perform services in accordance with the Electricity Rules. Penalties
and other enforcement measures are available to Aurora under these agreements where relevant
laws and rules are not adhered to. Aurora also maintains regular contact with external providers to
ensure their roles are executed in line with these requirements.
Instances where relevant requirements were not met
Participants were asked whether there have been instances when the above requirements have not
been met. All responded that to their knowledge there had been no such cases.
AER findings
The AER considers that the processes put in place by these RPs, if maintained appropriately, should
adequately protect energy data from direct local or electronic access. We consider it good practice for
agreements with service providers to include references to legislative requirements and encourage all
RPs to have regular contact with their service providers to ensure that these requirements are met.
3.6 Network compliance projects
Next quarter we will commence two projects focusing on the activities of network businesses—one in
transmission and the other in distribution. An introduction for each project is below.
Review of transmission business annual planning reports
The Electricity Rules require transmission businesses to undertake an annual planning review, over a
minimum planning horizon of ten years, and to publish an annual planning report (APR) setting out
the results of the planning review. Together with the national transmission network development

28
plan (NTNDP)13
and the regulatory investment test for transmission (RIT-T),14
the APR forms part of
the transmission network planning and expansion framework set out in chapter 5 of the Electricity
Rules and is intended to promote an economically efficient and transparent network planning and
investment.15
Transmission businesses are required in the APR to provide a snapshot of the state of the current
network, including an outline of emerging network constraints and proposed solutions. Transmission
businesses are also required to outline opportunities for non-network investment and provide details
on all proposed network augmentations and replacements of transmission network assets.
We consider that it is important that the quality of information provided in transmission businesses’
APRs meets the requirements of the Electricity Rules and promotes efficient and transparent
investment in a transmission network. Therefore, in the upcoming year we will be assessing the
quality of information provided in past APRs and engaging with transmission businesses to ensure
that future APRs meet the requirements of the Electricity Rules.
Distribution reliability performance
The effective performance of distribution businesses and their networks is essential for the safe and
reliable delivery of electricity to customers. It is particularly important that distribution networks
perform as anticipated at times of high demand, when it is likely that the distribution network is under
the most stress.
Electricity networks in the NEM are designed to operate normally through events that are reasonably
foreseeable (for example, demand peaks that would likely occur once or more in a ten year period). If
the event is outside what would normally be expected to occur, the networks are designed to shed
load or disconnect customers in a safe, predictable and controlled manner. While the weather events
in January were exceptional in terms of the consecutive temperatures recorded, the overall network
loads in South Australia and Victoria were below previous peaks (2009).
The recent period of extreme weather in Southern Australia in January provides a good opportunity
for the AER to examine the performance of the Victorian and South Australian distribution businesses
in terms of their preparedness for the extreme conditions, the types and frequency of events the
network businesses faced as a result of the conditions and how they responded to these events. We
will work with the distribution businesses to examine the period in detail to identify potential
compliance issues and valuable lessons that can be learnt from the period.
Both the Essential Services Commission of South Australia and the Essential Services Commission of
Victoria have previously undertaken network reviews of heatwave events. We intend to liaise with
these agencies to provide continuity and integrate these prior learnings.
13
The NTNDP, published annually by AEMO, covers all network limitations, and possible options for relieving them, which are part of, or materially affect, the transfer capability across national transmission flow paths. The minimum planning outlook in the NTNDP is 20 years.
14 The RIT-T is a cost-benefit test which transmission businesses must undertake to assess the credible options (including
non-network options) to address an identified need on their network where the cost of one of the options exceeds $5 million. The preferred option is the one which maximises the economic benefit to all those who produce, consume and transport electricity in the NEM.
15 Distribution businesses have similar obligations to prepare APRs.

29
3.7 Jurisdictional derogations
Chapter 9 derogations exempt Victorian smelter traders, New South Wales power traders and
Queensland nominated generators (for the purposes of exempted generator agreements) from
complying with the Electricity Rules to the extent there exists:
any inconsistency between the Rules and a contractual requirement under the relevant
agreement between the government and other entities
any other specified exemption in the jurisdictional derogations.16
The relevant participants must give us notice of any act or omission which partly or wholly constitutes
non-compliance with the Electricity Rules. No instances of non-compliance were reported this quarter.
As reported in the June 2013 QCR, the AER discovered that following the transition of Gladstone
Power Station to CS Energy, no performance standards compliance program had been put in place
for Gladstone. While this power station is covered by a Chapter 9 derogation under an exempted
generation agreements in Queensland, CS Energy is responsible for its compliance with performance
standards.
CS Energy has completed a review of the existing performance standards and formed a view on
which standards apply to Gladstone. CS Energy is currently drafting a performance standards
compliance program which follows the reliability panel template and will reference the appropriate
testing methods, procedures and testing results held by participants for Gladstone. We will continue to
liaise with CS Energy on the progress of its compliance program.
16
Refer to Electricity Rules clauses 9.4.3 (smelter trader: Vicpower Trading), 9.12.3 (power traders: Delta Electricity and Macquarie Generation) and 9.34.6 (nominated generators: CS Energy and Stanwell Corporation).

30
Appendix A: Shortened forms
Shortened form Full title
ACCC Australian Competition & Consumer Commission
AEMO Australian Energy Market Operator
AER Australian Energy Regulator
AMI Advanced Metering Infrastructure
CATS Consumer Administration and Transfer Solution
Electricity Law National Electricity Law (Schedule to the National Electricity Act)
Electricity Rules The National Electricity Rules made under Part 7 of the Electricity Law
FCAS Frequency Control Ancillary Service
Gas Law National Gas Law (Schedule to the National Gas Act)
Gas Regulations The National Gas (South Australia) Regulations made under the National Gas Act
Gas Rules The National Gas Rules made under Part 9 of the Gas Law
GEIP Good Energy Industry Practice
GJ Gigajoule
LCA Linepack capacity adequacy
MAP Moomba to Adelaide pipeline
MOS Market Operator Service
MSATS Market Settlement and Transfer Solution
MT PASA Medium Term Projected Assessment of System Adequacy
MW Megawatt
MWh Megawatt hour
National Electricity Act National Electricity (South Australia) Act 1996 (South Australia)
National Gas Act National Gas (South Australia) Act 2008 (South Australia)
NEM National Electricity Market
NMI National Meter Identifier
QCR The AER’s quarterly compliance report
RIT-T Regulatory investment test for transmission
RP Responsible Person
SCADA Supervisory control and data acquisition
STTM Short Term Trading Market
SWN System Wide Notice
TJ Terajoule

31
Appendix B: Previous targeted compliance reviews
Below is a summary of the Electricity Rules and Gas Rules provisions we have targeted in recent quarters
Quarter ending Industry Rule Description
June 2011 Gas 172 Provision of linepack capacity adequacy indicators for the Bulletin Board
378 Obligation to update information registered with AEMO
435 Requirement to provide good faith, best estimate contingency gas offers
September 2011 Gas 300 Obligation to protect metering installations from unauthorised interference
403 Obligation to investigate the circumstances of a MOS shortfall
410 Obligation to make good faith, best estimate price taker bids (demand forecasts)
December 2011 Gas 180 Obligation to publish peak demand day information
219 Obligation to notify AEMO of injection and withdrawal quantities
254 Obligation to provide and maintain security (prudential requirements)
March 2012 Gas 336 Emergency procedures awareness
September 2012 Gas 213(2)(b) and (c)
Injection and withdrawal bids in the Victorian gas market
March 2013 Electricity 4.15 Compliance with performance standards
June 2013 Electricity 8.6.6 AEMO requirements for confidential information
December 2013 Electricity 7.8.2 Security controls for energy data