quarterly digest of statistics · zimbabwe in maps - a census atlas 10 years 2012 population...
TRANSCRIPT

4th Quarter 2015
P.O. Box CY342, Causeway, Harare
Tel: (263-04) 706681/8 or (263-04) 703971/7 Fax: (263-04) 762494
E-mail: [email protected] Website: www.zimstat.co.zw
Price: US $ 2.00 February, 2016
QUARTERLY DIGEST OF
STATISTICS


- i -
Contents
Table Page
Migration
1.0 Recorded Migration through Official Ports 1
Visitors
2.0 Visitors and Returning Residents 2
Health
3.1 Percentage of Weightings of Children 0-4 Years Lying below the Line (the third percentile) 3
3.2 Number and Percentage of Live Births Less than 2.5 kg 3
3.3 Vaccination Coverage of Children under One Year by Type 4
3.4 Health Facilities in Zimbabwe by Type of Institution 5
3.5 Hospital Services (General in-patients) 5
3.6 Utilisation of Maternity Hospitals 5
3.7 Reported Aids New Cases by Sex 5
3.8 Top Five Causes of Out-patient Attendances 6
Accidents
4.0 Occupational Injuries and Road Accidents 7
Crime
5.0 Crime Statistics, Offences Including Attempts 8
Labour Statistics
6.0 Employees and Earnings by Industrial Sector 12
6.1 Employees and Earnings in Specific Urban Areas 12
Agriculture Labour
6.2 Number of Employees in Agriculture and Wages paid by Sector and Quarter 13
Price Statistics
7.0 Consumer Price Index 14
7.1 Poverty Datum Lines 15
National Accounts
8.0 Gross Domestic Product (GDP) Income Approach (US$) 17
8.1a Gross Domestic Product (GDP) at Current Prices (US$) 18
8.1b Gross Domestic Product (GDP) at Constant Prices (US$) 19
8.2a Gross Domestic Product (GDP) Expenditure Approach at Current Prices (US$) 20
8.2b Gross Domestic Product (GDP) Expenditure Approach at Constant Prices (US$) 21

- ii -
Balance of Payments
9.0 Balance of Payments 22
External Trade
10.0 Summary of External Trade, US$ 23
10.1 Domestic Exports Classified by Principle Countries, US$ 24
10.2 Imports Classified By Principal Countries, US$ 27
10.3 Domestic Exports Classified by HS Chapters 30
10.4 Imports Classified by HS Chapters 39
Agriculture
11.0 Summary of Sales of Principal Crops and Livestock 49
11.1 Volume of Crop Sales to/through Marketing Authorities 49
11.2 Value of Crop Sales to/through Marketing Authorities 50
11.3 Value of Livestock Slaughtering and Milk Production 50
11.4 Volume of Livestock Slaughtering and Milk Production 51
11.5 Short-term Credit Extended to Farmers 51
Mining
12.0 Mineral Production 52
Electrical Energy
13.0 Electrical Energy Produced and Distributed 54
13.1 Electrical Energy Used by Major Industrial Divisions 54
Construction
14.0 Building Material Price Index 55
14.1 Monthly Average Retail Price of Petrol, Diesel, Paraffin/Kerosene and Gas 56
Manufacturing
15.0 Volume of Manufacturing Index (VMI) 57
16.0 Principal Indicators - Gross Output, Intermediate Consumption and Value Added Classified by
Industrial Group; CIP Zimbabwe: USD 58
Transport
17.1 Railways Analysis of Revenue including Operations in Botswana 60
17.2 Airport Traffic excluding Transit Passengers 61
Commercial Banks
18.0 Assets of Commercial Banks, US$ Million 62
18.1 Liabilities of Commercial Banks, US$ Million 63
18.2 Advances of Commercial Banks by Sector, US$ Thousand 64

- iii -
Other Financial Institutions
19.0 Assets of Accepting Houses, US$ Million 65
19.1 Liabilities of Accepting Houses, US$ Million 66
19.2 Assets of Building Societies, US$ Million 67
19.3 Liabilities of Building Societies, US$, Million 68
Public Debt and Government Finance
20.0 Zimbabwe External Debt Outstanding by Debtor (Including all arrears but excluding penalties)
US$ million 69
Consolidated Banking
21.0 Monetary Aggregate, US$ Thousands 70
Interest Rates
22.0 Bank Deposit Rates (percent per annum) 72
22.1 Lending Rates (percent per annum) 72
Stock Exchange
23.0 Zimbabwe Stock Exchange Statistics 73
24.0 Selected International Exchange Rates 74
25.1 Sectoral Analysis of Commercial Banks Deposits, US$ Thousands 75
25.2 Broad Money Survey US$ Thousands 76
Explanatory Notes 77
- iv -
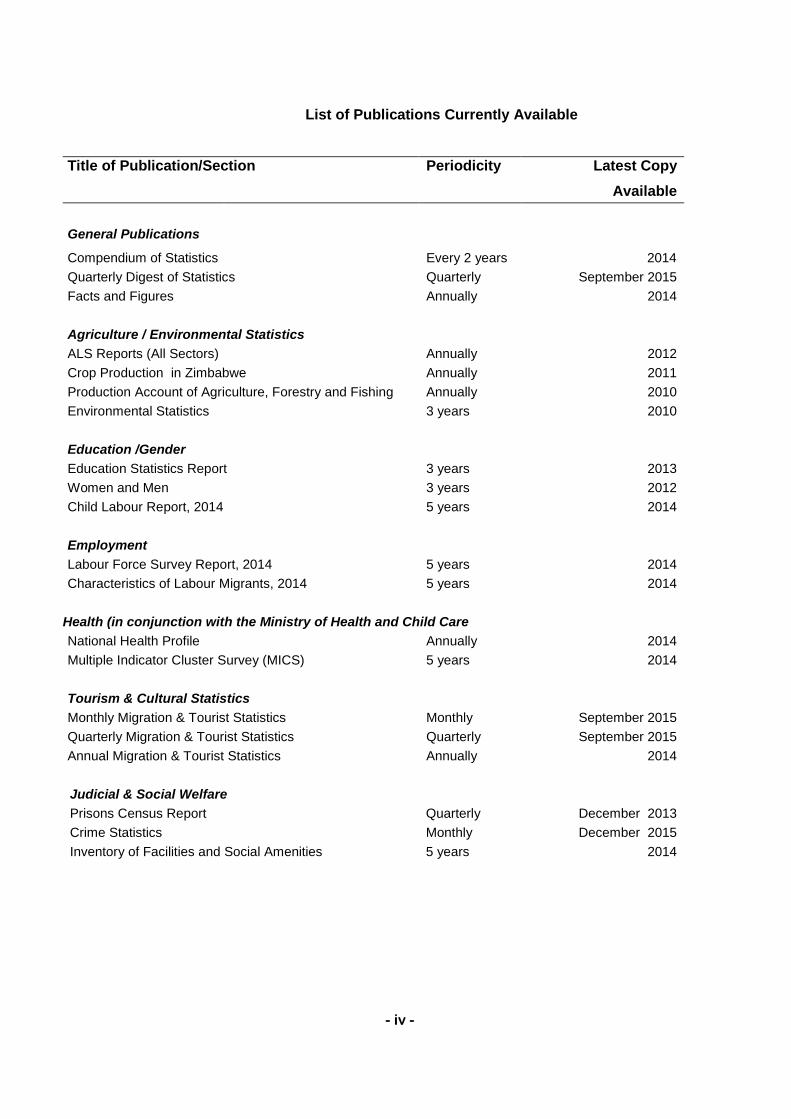
List of Publications Currently Available
Title of Publication/Section Periodicity Latest Copy
Available
General Publications
Compendium of Statistics Every 2 years
yearsyears
2014
Quarterly Digest of Statistics Quarterly September 2015
Facts and Figures Annually 2014
Agriculture / Environmental Statistics
ALS Reports (All Sectors) Annually 2012
Crop Production in Zimbabwe Annually 2011
Production Account of Agriculture, Forestry and Fishing Annually 2010
Environmental Statistics 3 years 2010
Education /Gender
Education Statistics Report 3 years 2013
Women and Men 3 years 2012
Child Labour Report, 2014 5 years 2014
Employment
Labour Force Survey Report, 2014 5 years 2014
Characteristics of Labour Migrants, 2014 5 years 2014
Health (in conjunction with the Ministry of Health and Child Care
National Health Profile Annually 2014
Multiple Indicator Cluster Survey (MICS) 5 years 2014
Tourism & Cultural Statistics
Monthly Migration & Tourist Statistics Monthly September 2015
Quarterly Migration & Tourist Statistics Quarterly September 2015
Annual Migration & Tourist Statistics Annually 2014
Judicial & Social Welfare
Judicial & Social Welfare
Prisons Census Report Quarterly December 2013
Crime Statistics Monthly December 2015
Inventory of Facilities and Social Amenities 5 years 2014

- v -
Title of Publication/Section Periodicity Latest Copy
Available
National Accounts
Poverty, Income, Consumption and
Expenditure Survey (PICES)
5 years
2011/12
Poverty and PDL Analysis in Zimbabwe Annually 2011/12
National Accounts Report Annually 2009-14
Population Statistics
Zimbabwe Demographic & Health Survey (ZDHS) 5 years 2010/11
Census Preliminary Report 10 years 2012
Census Provincial Profiles 10 years 2012
Census National Report 10 years 2012
Zimbabwe in Maps - A Census Atlas 10 years 2012
Population Projections Thematic Report 10 years August 2015
Descriptive Child and Youth Equity Atlas: Zimbabwe 10 years 2015
Intercensal Demographic Survey 10 years 2008
Migration Profile 5 years 2010
Mortality Report Annually 2007
Census District Data Sheets
10 years June 2015
Mortality Thematic report
10 years August 2015
Nuptiality and Fertility Thematic report
10 years August 2015
Labour Force Characteristics Thematic August 2015
Prices
Consumer Price Index Monthly December 2015
Building Materials Price Index Quarterly December 2015 Producer Price Index Quarterly June 2015 Civil Engineering Price Index Monthly September 2015
Quarterly Prices Bulletin Quarterly September 2015
Poverty Datum Lines Monthly November 2015
Production
Business Tendency Survey 3 Times/Year May – August 2014
Census of Industrial Production Annually 2013
Volume of Manufacturing Index Quarterly June 2015
Electrical Energy Produced Monthly August 2015
Mineral Production Monthly June 2015
Transport
Railways Analysis of Revenue 3 Times/Year July 2015
Airport Traffic excluding Transit Passengers Annually October 2015
Trade Statistics
Quarterly Bulletin of Trade Statistics Quarterly December 2015
Statement of External Trade Annually 2014

- vi -
Notes
Explanations of Symbols
Symbol
*
**
+
-
0
Meaning
Amended
Available on an annual basis
Provisional
Any of the following: Data not available
Missing value
Not received
No figure
When figure is zero or insignificant

Table 1.0 Recorded Migration through Official Ports ♣
Period Immigrants Emigrants Net migration
2012 548 58 346 -57 8942013 244 - -2014 260 - -2015 1 604 - -
2013 January 11 - -February 121 - -March 33 - -
April 16 - -May 6 - -June 7 - -
July - - -August - - -September - - -
October 22 - -November 19 - -December 9 - -
2014 January 2 - -February 7 - -March 82 - -
April 68 - -May 49 - -June 38 - -
July 5 - -August 5 - -September 4 - -
October - - -November - - -December - - -
2015 January - - -February 109 - -March 166 - -
April 187 - -May 202 - -June 167 - -
July 245 - -August 119 - -September 178 - -
October 68 - -November 133 - -December 30 - -
Source : ZIMSTAT Migration and Tourism Report
Note: ♣ This table is known to be an incomplete record of all migration. This is because of :
(a) The omission of cross-border movements at points other than the official ports, and
(b) Evidence that some residents who declare that they are leaving for less than twelve months in fact stay away
permanently or rather longer than a year.
- Data not available
- 1 -

Table 2.0 Visitors and Returning Residents
Period
In On For On For Total
Transit Business Education Holiday Shopping
2010 458 973 143 066 11 230 748 067 23 910 1 385 246 - 1 921 3112011 458 164 224 946 20 830 823 147 25 170 1552 257 - 2 235 7942012 536 257 297 196 16 532 826 101 68 267 1 744 653 - 2 363 6072013 632 420 339 538 12 022 800 549 160 176 1 944 705 - 2 935 0922014 703 030 371 588 18 719 786 903 48 237 1 928 477 - 3 125 7292015 741 278 165 410 13 307 1 057 325 82 320 2 059 640 - 3 553 011
2013 January 39 764 54 681 886 41 177 5 070 141 578 - 189 904February 42 778 43 808 489 34 336 2 331 123 742 - 171 752March 49 798 85 430 580 34 369 12 069 182 246 - 229 149
April 51 166 17 594 798 88 424 4 644 162 626 - 210 124May 51 007 18 836 2 352 78 963 4 926 156 084 - 248 384June 51 121 17 904 646 82 482 4 073 156 226 - 221 809
July 52 506 14 490 958 74 733 10 991 153 678 - 231 002August 59 344 16 282 1 164 89 617 3 429 169 836 - 269 940September 55 675 12 151 922 77 613 3 902 150 263 - 234 060
October 57 286 18 545 1 324 74 006 6 654 157 815 - 252 711November 52 718 18 080 1 521 71 488 6 783 150 590 - 254 742December 69 257 21 737 382 53 341 95 304 240 021 - 421 515
2014 January 53 369 49 474 540 26 712 12 795 142 890 - 212 717February 42 467 5 599 1 127 54 402 5 699 109 294 - 188 847March 87 617 11 231 1 990 58 162 7 196 166 196 - 206 974
April 53 642 16 500 2 682 91 353 1 008 165 185 - 266 600May 54 376 14 610 2 748 72 886 252 144 872 - 230 676June 39 794 19 648 1 745 102 849 1 106 165 142 - 245 124
July 62 382 71 431 2 029 44 415 3 765 184 022 - 263 372August 44 339 31 027 1 099 44 990 4 795 126 250 - 345 273September 61 428 59 083 465 36 720 2 746 160 442 - 225 461
October 55 651 59 193 1 988 31 510 2 995 151 337 - 225 461November 48 439 9 182 1 921 80 701 3 908 144 151 - 256 692December 99 526 24 610 385 142 203 1 972 268 696 - 458 532
2015 January 43 199 7 220 310 56 360 2 161 109 250 - 330 416February 54 034 8 226 768 58 668 10 104 131 800 - 205 484March 62 470 9 080 816 70 861 8 124 151 351 - 295 871
April 64 272 12 165 1 011 108 068 4 526 190 042 - 323 743May 61 675 8 849 417 100 660 7 271 178 872 - 305 945June 49 183 8 374 822 87 757 1 680 147 816 - 270 122
July 69 692 12 331 1 753 95 370 10 304 189 450 - 297 606August 67 785 15 176 633 106 250 2 827 192 671 - 305 402September 75 827 16 860 1 130 88 325 3 562 185 704 - 278 544
October 59 408 17 450 2 012 89 062 8 561 176 493 - 271 435November 59 168 18 697 2 422 78 872 9 437 168 596 - 272 964December 74 565 30 982 1 213 117 072 13 763 237 595 - 395 479
Source : ZIMSTAT Migration and Tourism Report
Note: - Data not available
Visitors from other countries
Staying for less
than one night
included in Total Absent for one night
or more
Residents returning
from visits to other
countries
- 2 -
Period
0-5 6-11 12-23 24-59 0-59 0-5 6-11 12-23 24-59 0-59
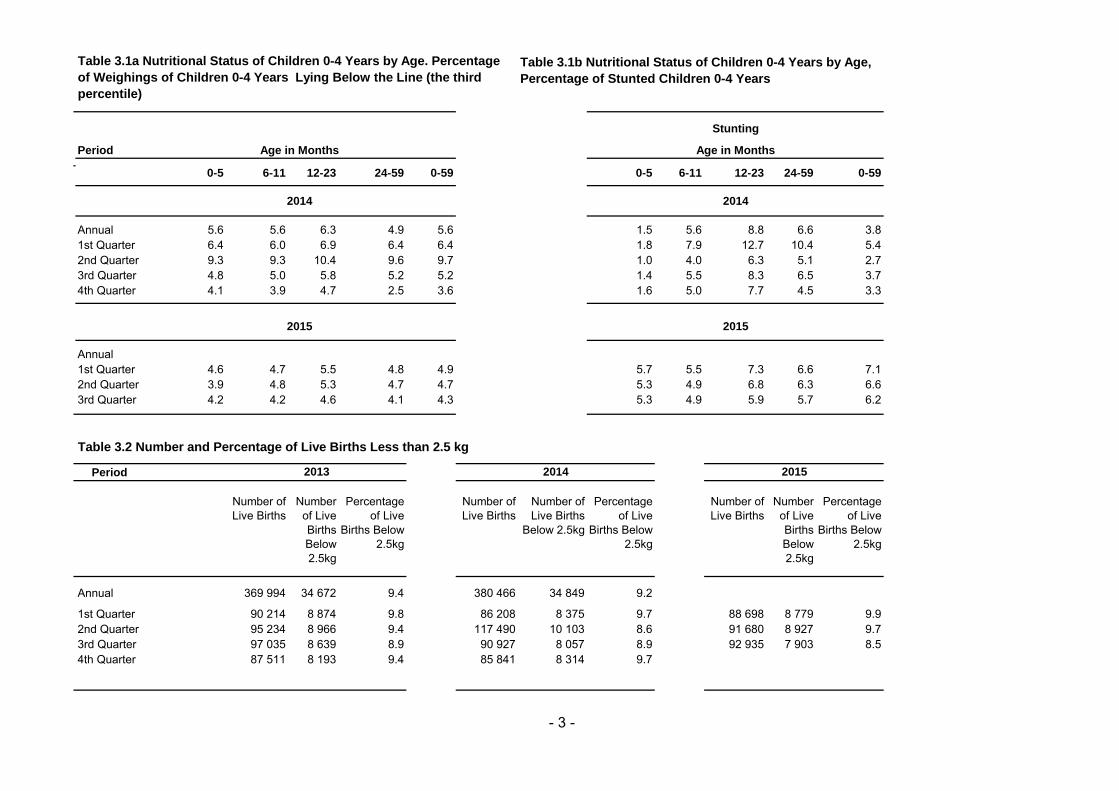
Annual 5.6 5.6 6.3 4.9 5.6 1.5 5.6 8.8 6.6 3.8 1st Quarter 6.4 6.0 6.9 6.4 6.4 1.8 7.9 12.7 10.4 5.4 2nd Quarter 9.3 9.3 10.4 9.6 9.7 1.0 4.0 6.3 5.1 2.7 3rd Quarter 4.8 5.0 5.8 5.2 5.2 1.4 5.5 8.3 6.5 3.7 4th Quarter 4.1 3.9 4.7 2.5 3.6 1.6 5.0 7.7 4.5 3.3
Annual 1st Quarter 4.6 4.7 5.5 4.8 4.9 5.7 5.5 7.3 6.6 7.12nd Quarter 3.9 4.8 5.3 4.7 4.7 5.3 4.9 6.8 6.3 6.63rd Quarter 4.2 4.2 4.6 4.1 4.3 5.3 4.9 5.9 5.7 6.2
Table 3.2 Number and Percentage of Live Births Less than 2.5 kg
Period
Number of Live Births
Number of Live Births Below 2.5kg
Percentage of Live
Births Below 2.5kg
Number of Live Births
Number of Live Births
Below 2.5kg
Percentage of Live
Births Below 2.5kg
Number of Live Births
Number of Live Births Below 2.5kg
Percentage of Live
Births Below 2.5kg
Annual 369 994 34 672 9.4 380 466 34 849 9.2
1st Quarter 90 214 8 874 9.8 86 208 8 375 9.7 88 698 8 779 9.92nd Quarter 95 234 8 966 9.4 117 490 10 103 8.6 91 680 8 927 9.73rd Quarter 97 035 8 639 8.9 90 927 8 057 8.9 92 935 7 903 8.54th Quarter 87 511 8 193 9.4 85 841 8 314 9.7
Age in Months
2014
2013
Table 3.1b Nutritional Status of Children 0-4 Years by Age,
Percentage of Stunted Children 0-4 Years
2014
Table 3.1a Nutritional Status of Children 0-4 Years by Age. Percentage
of Weighings of Children 0-4 Years Lying Below the Line (the third
percentile)
2015
Age in Months
2014
Stunting
2015
2015
- 3 -

Table 3.3 Vaccination Coverage of Children Under One Year by Type
Population
Under 1 year NumberCoverage
% NumberCoverage
% Number Coverage % NumberCoverage
% NumberCoverage
% NumberCoverage
%
2011 415 486 484 937 116.7 459 121 110.5 434 452 104.6 420 253 101.1 605 392 145.7 413 995 99.62012 415 486 454 637 109.4 478 635 115.2 441 825 106.3 409 928 98.7 341 318 82.1 407 850 98.22013 432 896 474 436 109.6 440 581 101.8 421 248 97.3 415 299 95.9 385 975 89.16 414 599 95.82014 437 185 434 239 99.3 432 165 98.9 411 910 94.2 402 413 92.0 381 198 87.19 404 791 92.6
2014
1st Quarter 437 185 113 914 26.1 110 103 25.2 104 642 23.9 100 448 22.98 94 977 21.7 105 465 24.12nd Quarter 437 185 108 094 24.7 109 300 25.0 105 142 24.0 101 982 23.33 111 352 25.5 103 664 23.73rd Quarter 437 185 108 839 24.9 106 850 24.4 102 986 23.6 102 869 23.53 88 320 20.2 101 113 23.14th Quarter 437 185 103 392 23.6 105 912 24.2 99 140 22.7 97 114 22.21 86 549 19.8 94 549 21.6
2015
1st Quarter 441 557 107 683 24.4 106 900 24.2 101 136 22.9 99 855 22.61 101 219 22.9 103 001 23.32nd Quarter 441 557 106 136 24.0 105 575 23.9 100 844 22.8 99 614 22.56 104 298 23.6 94 656 21.43rd Quarter 441 557 93 558 21.2 101 248 22.9 96 582 21.9 95 329 21.59 98 079 22.2 91 699 20.8
Population
Under 1 year NumberCoverage
% NumberCoverage
% Number Coverage % NumberCoverage
% NumberCoverage
% NumberCoverage
% NumberCoverage
%
2011 415 486 457 255 110.1 431 781 103.9 422 396 101.72012 415 486 489 208 117.7 453 233 109.1 428 731 103.22013 433 285 437 562 101.1 422 639 97.6 411 330 95.0 433 143 100.0 411 325 94.9 399 012 92.12014 437 185 429 653 98.3 409 225 93.6 399 173 91.3 428 148 97.9 408 508 93.4 397 467 90.9 390 528 89.3
2014
1st Quarter 437 185 109 694 25.1 104 417 23.9 100 475 23.0 108 533 24.8 103 594 23.7 99 414 22.7 102 336 23.42nd Quarter 437 185 108 940 24.9 104 395 23.9 101 340 23.2 108 474 24.8 104 399 23.9 100 655 23.0 98 941 22.63rd Quarter 437 185 105 906 24.2 102 018 23.3 102 054 23.3 106 055 24.3 102 181 23.4 102 425 23.4 97 933 22.44th Quarter 437 185 105 113 24.0 98 395 22.5 95 304 21.8 105 086 24.0 98 334 22.5 94 973 21.7 91 318 20.9
2015
1st Quarter 441 557 106 399 24.1 100 336 22.7 99 336 22.5 106 228 24.1 99 440 22.5 99 369 22.5 99 370 22.52nd Quarter 441 557 106 082 24.0 101 278 22.9 98 991 22.4 104 191 23.6 100 064 22.7 98 841 22.4 91 479 20.73rd Quarter 441 557 104 671 23.7 96 238 21.8 94 817 21.5 100 026 22.7 96 168 21.8 94 904 21.5 87 350 19.8
Source: Ministry of Health and Child Care
Pentavalent 2
BCG Initial
Pentavalent 3
Polio 2
Period
Pneumococcal 1
Period
Vitamin APolio 1
Pentavalent 1 Primary Course Pneumococcal 2 Pneumococcal 3
Polio 3 Measles
- 4 -

Table 3.4 Health Facilities in Zimbabwe by Type of Institution
Year Primary
Level
Secondary
Level (1st
referral)
Tertiary
Level (2nd
referral)
Quartenary
Level (3rd
referral)
Other Total
Facilities
Total No. of
Beds
No. of Beds
per 10 000
People
2012 1 331 179 7 14 - 1 531 53 959 412013 1 331 179 7 14 - 1 531 53 959 402014 1 527 179 7 14 - 1 727 53 959 402015 1 527 179 7 14 - 1 727 53 960 39
Table 3.5 Hospital Services (General in-patients)
Admissions Discharges Deaths Bed
Occupancy
In-patient
Daily
Average
Average Stay
days
Percentage
Occupancy
No. of
outpatient
attendances
2012 189 971 187 746 19 486 1 421 524 520 4.2 25.1 3 576 0632013 244 431 210 584 16 033 1 657 229 670 1.1 29.3 3 980 5452014 225 325 206 267 23 499 1 522 419 617 1.0 26.9 4 030 080
2014 1st Quarter 60 836 54 423 6 020 404 298 667 1.0 28.6 1 097 3112nd Quarter 57 920 52 749 6 031 387 144 635 1.0 27.4 1 056 1163rd Quarter 52 565 48 826 5 807 372 754 576 1.0 26.4 997 2134th Quarter 54 004 50 269 5 641 358 223 592 1.0 25.3 879 440
2015 1st Quarter 56 106 51 227 5 592 372 786 615 6.6 29.1 945 2492nd Quarter 54 352 51 535 5 627 353 918 596 6.2 27.6 919 7413rd Quarter 47 465 43 949 5 019 331 944 520 6.8 25.9 782 040
Table 3.6 Utilisation of Maternity Hospitals
Year Admissions Discharges Deaths Bed
Occupancy
In-patient
Daily
Average
Average Stay
days
Percentage
Occupancy
2012 214 190 194 723 872 640 194 1 754 1.1 40.22013 275 448 245 073 1 121 696 450 1 908 1.1 43.82014 229 319 226 273 1 275 713 303 1 954 1.0 44.8
2014 1st Quarter 59 762 55 905 385 178 382 1 955 1.1 44.82nd Quarter 57 824 57 170 303 173 027 1 896 1.0 43.53rd Quarter 56 637 57 754 274 185 154 2 029 1.0 46.54th Quarter 55 096 55 444 313 176 740 1 937 1.0 44.4
2015 1st Quarter 53 381 55 216 413 177 335 1 943 3.2 47.82nd Quarter 54 655 57 155 294 179 025 1 962 3.1 48.33rd Quarter 51 074 51 971 248 168 141 1 843 3.2 45.4
Table 3.7 Reported AIDS New Cases by Sex
Year Male Female Total
2012 140 038 229 815 369 8532013 138 960 222 380 361 3402014 144 546 234 785 379 331
2014 1st Quarter 33 776 56 978 90 7542nd Quarter 36 873 60 348 97 2213rd Quarter 31 722 52 689 84 4114th Quarter 42 175 64 770 106 945
2015 1st Quarter 29 135 39 489 68 6242nd Quarter 27 894 47 205 75 0993rd Quarter 27 106 42 837 69 943
Source: Ministry of Health and Child Care
Type of Institution
Year
- 5 -

Table 3.8 Top Five Causes of Out-Patients Attendences
Disease/Conditions No. of cases No of cases
as a % of
new cases
Disease/Conditions No. of cases No of cases
as a % of
new cases
ARI 1 268 096 38.7 ARI 651 309 24.5
Skin Diseases - Scabies 215 251 6.6 Skin Diseases 207 354 7.8
Diarrhoea 196 591 6.0 Diarrhoea & Dysentery 199 343 7.5
Burns, RTA & Other Injuries 134 087 4.1 Burns, RTA & Other Injuries 138 882 5.2
Diseases of the Eye 115 672 3.5 Disease of the Eye 103 667 3.9
All Other New Diseaseas 1 349 105 41.1 All Other New Diseaseas 1 358 949 51.1
Total New Cases 3 278 802 100.0 Total New Cases 2 659 504 100.0
Disease/Conditions No. of cases No of cases
as a % of
new cases
Disease/Conditions No. of cases No of cases
as a % of
new cases
ARI 3 693 683 29.7 ARI 742 682 24.6
Skin Diseases 959 885 7.7 Skin Diseases 251 403 8.3
Diarrhoea & Dysentery 812 509 6.5 Diarrhoea & dysentery 190 701 6.3
Burns, RTA & Other Injuries 570 841 4.6 Burns, RTA & Other Injuries 155 107 5.1
Disease of the Eye 535 931 4.3 Malaria (Confirmed) 110 883 3.7
All Other New Diseaseas 5 861 283 47.1 All Other New Diseaseas 1 573 610 52.0
Total New Cases 12 434 132 100.0 Total New Cases 3 024 386 100.0
Disease/Conditions No. of cases No of cases
as a % of
new cases
Disease/Conditions No. of cases No of cases
as a % of
new cases
ARI 873 039 29.4 ARI 858 879 32.0
Skin Diseases 206 629 7.0 Diarrhoea & dysentery 176 814 6.6
Diarrhoea & dysentery 154 101 5.2 Skin Diseases 149 829 5.6
Burns, RTA & Other Injuries 145 406 4.9 Burns, RTA & Other Injuries 130 421 4.9
Malaria (Confirmed) 139 939 4.7 Disease of the Eye 101 125 3.8
All Other New Diseaseas 1 449 890 48.8 All Other New Diseaseas 1 265 464 47.2
Total New Cases 2 969 004 100.0 Total New Cases 2 682 532 100.0
Note: ARI = Acute Respiratory Infection ENT = Ear, Nose and Throat
Source: Ministry of Health and Child Care
Annual 2014 1st Quarter 2015
3rd Quarter 2014 4th Quarter 2014
2nd Quarter 2015 3rd Quarter 2015
- 6 -

Table 4.0 Occupational Injuries and Road Accidents
Period Occupational Injuries
Number of Personsclaims submitted killed
2010 4 434 882011 4 314 902012 4 910 1032013 5 287 932014 5 391 109
2014 January 450 11February 489 13March 500 10
April 394 6May 486 4June 429 16
July 406 8August 410 10September 497 12
October 502 6November 445 4December 383 9
Source: NSSA Road Accidents
Total number Number Numberof accidents of dead of injured
2010 28 037 1 121 -2011 31 620 1 265 -2012 30 911 2 094 14 965*2013 40 165 2 797 17 7592014 42 713 2 042 14 759
Note: - Data not available * Ammended
Source: Police General Head Quarters (PGHQ)
- 7 -

Table 5.0 Crime Statistics, Offences including Attempts
Period
Infanticide Abortion Assault
(common)
Assault
(Grievous
bodly harm)
Assault
(indecent)
Culpable
homicide
Murder Rape
2010 73 89 64 338 137 2 484 337 638 4 4502011 108 91 64 531 93 1 610 828 764 5 4462012 80 112 66 813 159 2 718 1 137 901 5 4122013 93 106 47 009 73 2 866 1 307 830 5 7172014 173 114 61 455 106 1 661 1 121 1 015 7 5512015 156 96 69 641 235 1 989 1 150 1 387 7 752
2015 January 11 8 5 425 6 142 73 84 674February 5 5 5 098 10 141 82 71 560March 7 7 5 975 20 141 105 85 657
April 11 10 5 356 9 180 86 88 524May 18 8 5 531 5 125 105 59 560June 11 7 5 180 11 145 93 97 574
July 20 10 5 352 59 177 96 77 639August 14 9 5 947 4 165 101 495 635
September 8 8 6 134 8 165 83 76 765
October 11 8 6 873 84 203 121 77 782November 18 6 6 268 3 188 98 76 662December 22 10 6 502 16 217 107 102 720
Table 5.0 Crime Statistics, (Contd.)
Period Arson
♣
Fraud Malicious
injury to
property
Receiving
stolen
property
House
breaking and
theft
Theft of car Theft from
car
Theft of
stock
Theft
(other)
2010 20 2 624 5 801 10 199 25 014 1 263 5 256 8 810 69 5232011 974 8 027 8 438 584 32 555 1 615 4 272 10 573 62 7912012 1 115 8 622 9 453 332 31 337 388 2 788 10 080 70 1872013 1 074 9 151 9 093 281 23 676 421 2 726 8 280 58 6272014 920 10 052 9 234 347 31 768 419 3 384 9 576 81 7022015 1 160 11 207 10 547 505 34 352 364 3 624 9 964 86 847
2015 January 60 702 768 29 2 837 28 318 920 6 586February 32 742 773 39 2 676 36 292 670 6 481March 55 998 815 45 3 025 24 239 798 7 538
April 45 957 765 34 2 689 29 259 685 6 909May 92 865 757 36 2 700 26 210 581 7 096June 56 898 802 51 2 844 24 307 673 6 897
July 108 997 815 43 2 700 27 251 855 6 977August 112 923 921 30 2 835 35 315 903 7 121September 119 982 1 004 32 2 965 27 277 913 7 455
October 157 1 117 1 050 51 2 985 37 515 916 7 808November 231 992 1 000 49 3 007 31 340 959 7 612December 93 1 034 1 077 66 3 089 40 301 1 091 8 367
Note: ♣ Some of the data on Arson was reported under Malicious injury to property during 2009-2011Source: Police General Head Quarters (PGHQ)
- 8 -

Table 5.0 Crime Statistics (Contd.)
Period Robbery Armed Other Broadcasting Control of Criminal law Criminal Customs
robbery common Act goods amendment procedure and excise
♣ law ^^ and evidence
2010 6 965 0 3 015 523 134 22 54 8672011 6 211 736 3 930 608 63 4 557 0 5792012 6 286 1 161 8 123 889 144 3 803 7 1 3852013 6 925 554 6 652 5 027 104 5 17 1 2022014 7 775 631 8 507 5 366 179 0 2 1 3112015 5 453 404 7 946 3 806 73 5 12 1 187
2015 January 608 30 1 373 617 1 0 0 85February 600 25 350 441 7 0 0 104March 589 42 698 393 7 0 8 88April 510 26 558 292 4 0 0 100May 468 25 580 371 6 0 0 90June 435 29 610 433 17 0 0 164
July 531 37 619 272 4 0 0 129August 459 40 707 289 3 0 0 130September 420 73 725 259 4 0 0 99
October 430 49 835 271 5 0 0 107November 403 28 891 168 15 5 4 91December 482 34 947 177 7 0 0 108
Table 5.0 Crime Statistics (Contd.)
Period Dangerous drugs
Exchange Firearms
Possession Cultivate Supply Smoke Act
2010 2 831 280 142 0 48 6562011 2 980 305 314 53 225 4962012 3 481 209 344 11 1 5452013 3 462 200 292 0 4 4962014 4 409 188 58 0 1 4782015 311 230 9 4 499 3 402
2015 January 58 26 1 389 0 44February 30 30 1 315 0 45March 26 28 1 437 0 37
April 17 15 0 380 0 33May 21 12 0 331 2 35June 15 11 0 393 0 42
July 32 9 1 339 0 44August 12 6 2 379 1 25September 30 30 0 475 0 36
October 24 28 2 375 0 0November 26 20 0 309 0 27December 20 15 1 377 0 34
Note: ♣ Some of the data on Armed Robbery was reported under Robbery during 2009-2011^^
Source: Police General Head Quarters (PGHQ)
For the period August 2011 to 2012 some of the crimes under Criminal Law were reported under Miscellaneous Offence, Common Law and Law and Order Maintenance Act( other)
- 9 -

Table 5.0 Crime Statistics (Contd.)
Period Forests Harmful liquids Immigration Income tax Road motor
transportation
Possession Other
of arms
2010 1 602 893 100 479 445 1 596 2 764 114 5752011 602 240 77 658 110 184 551 40 1142012 557 178 426 545 133 10 85 119 8452013 452 174 38 925 225 2 6 104 6812014 563 176 31 442 85 0 12 96 8282015 383 170 16 457 127 0 8 125 102
2015 January 21 14 84 5 0 7 12 235February 17 16 2 267 15 0 1 11 399March 34 8 3 704 3 0 0 10 962
April 24 34 9 698 34 0 0 11 277May 20 16 87 3 0 0 12 977June 30 26 108 9 0 0 13 842
July 28 10 81 10 0 0 13 921August 48 11 77 4 0 0 11 137September 60 17 209 1 0 0 14 067
October 101 18 142 43 0 0 13 285November 50 17 144 6 0 0 14506December 18 46 248 2 0 0 14894
Table 5.0 Crime Statistics (Contd.)
Liquor Miscellaneous Municipal Parks and Precious
Period offence Act by-laws wildlife stones
Drunk Shebeens Other
2010 7 721 425 2 353 21 209 11 130 1 266 2 6202011 6 026 1 587 7 273 4 638 17 332 998 1 2082012 6 496 1 541 5 607 3 414 14 854 1 263 2 7222013 5 454 1 105 4 367 3 224 10 949 985 1 8762014 5 442 1 114 5 625 1 473 16 758 1 139 1 4542015 7 674 1 496 7 395 4 798 4 353 1 493 1 657
2015 January 596 79 650 218 237 86 167February 354 53 639 264 359 90 122March 574 92 678 393 304 120 136
April 472 112 679 760 364 94 88May 490 91 656 938 426 86 148June 568 90 620 689 367 140 133
July 383 98 617 749 379 144 139August 636 158 598 111 550 167 123September 889 234 694 142 376 132 150
October 1 022 169 482 158 513 146 122November 878 166 388 184 203 186 110December 812 154 694 192 275 102 219
Source: Police General Head Quarters (PGHQ)
Law and order
maintenance Act
- 10 -

Table 5.0 Crime Statistics (Contd.)
Period
No driver's licence No insurance Reckless Negligent Speeding Drunk
driving driving while driving
2010 819 2 678 29 209 2 201 24 330 2 8642011 5 030 8 745 517 2 646 14 484 85 232 4682012 12 194 26 327 264 2 779 25 202 68 800 5992013 12 137 30 518 266 2 979 26 873 47 546 8542014 18 315 32 518 378 3 775 32 398 51 498 1212015 13 800 28 033 418 5 619 37 419 34 782 87
2015 January 1 044 2 146 43 334 2 801 4 018 1February 960 2 081 11 283 2 560 3 291 10March 1 142 2 590 92 376 3 224 2 650 5
April 628 1 964 34 334 3 163 3 255 2May 1 115 2 422 90 400 2 532 2 310 53June 1 164 2 310 16 416 2 901 2 582 2
July 1 078 2 211 43 437 3 272 2 149 0August 2 248 3 055 23 447 3 291 2 702 5September 1 554 2 325 21 492 3 134 3 158 2
October 1 273 2 450 13 653 3 348 3 047 4November 773 1 967 13 671 3 396 2 797 1December 821 2 512 19 776 3 797 2 823 2
Table 5.0 Crime Statistics (Contd.)
Period
Breathalyser Other moving Construction Vehicle All other
offences vehicle equipment & licensing Act
offences use regulation
2010 1 434 7 287 0 4 356 7 6102011 169 25 494 0 20 221 31 0832012 58 72 031 0 39 051 64 1232013 26 71 426 0 40 001 66 1672014 78 80 840 0 42 424 87 4632015 29 91 080 0 42 615 95 657
2015 January 0 5 891 0 4 705 7 986February 10 5 356 0 3 719 9 428March 0 9 419 0 3 618 8 915
April 0 7 770 0 3 687 5 733May 0 6 975 0 3 829 8 948June 0 7 058 0 3 050 6 580
July 0 7 615 0 3 268 6 485August 1 6 674 0 3 608 7 572September 10 7 792 0 3 425 9 391
October 0 7 742 0 3 399 8 129November 0 8 810 0 3 206 6 564December 8 9 978 0 3 101 9 926
Source: Police General Head Quarters (PGHQ)
Driving
without due
care
Road Traffic Act [RTA]
Road Traffic Act [RTA]
- 11 -
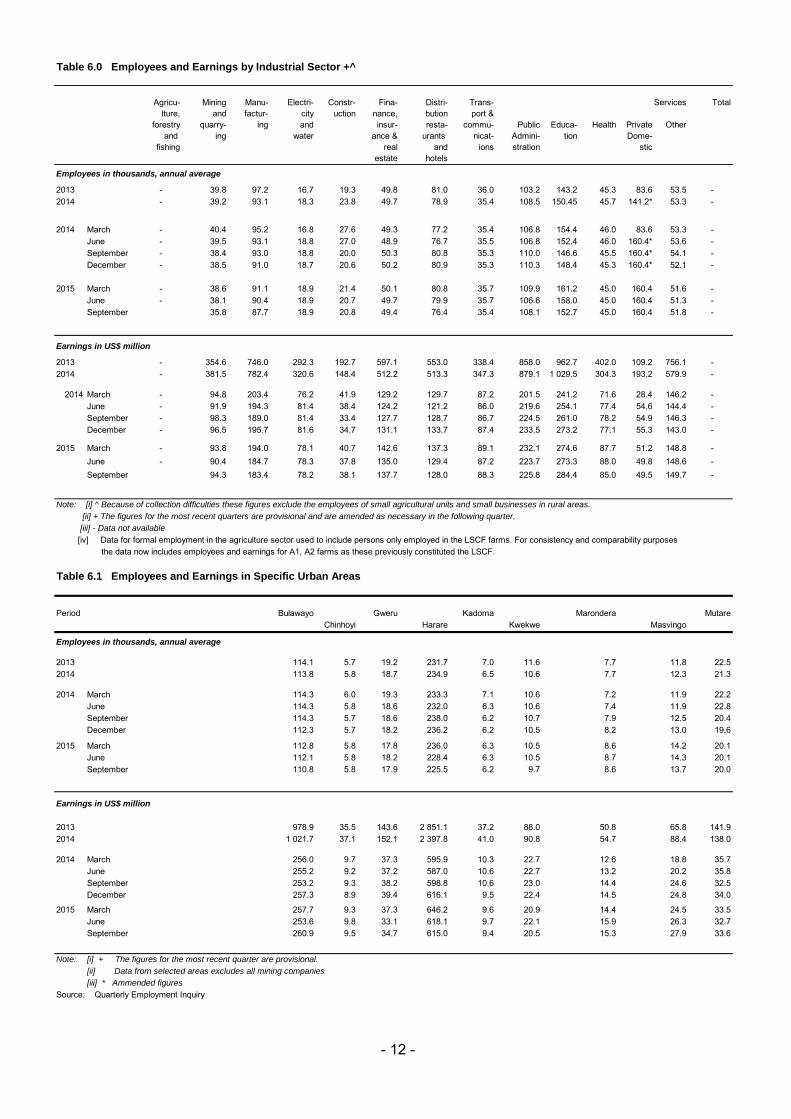
Table 6.0 Employees and Earnings by Industrial Sector +^
Agricu- Mining Manu- Electri- Constr- Fina- Distri- Trans- Totallture, and factur- city uction nance, bution port &
forestry quarry- ing and insur- resta- commu- Public Educa- Health Private Otherand ing water ance & urants nicat- Admini- tion Dome-
fishing real and ions stration sticestate hotels
2013 - 39.8 97.2 16.7 19.3 49.8 81.0 36.0 103.2 143.2 45.3 83.6 53.5 -2014 - 39.2 93.1 18.3 23.8 49.7 78.9 35.4 108.5 150.45 45.7 141.2* 53.3 -
- -2014 March - 40.4 95.2 16.8 27.6 49.3 77.2 35.4 106.8 154.4 46.0 83.6 53.3 -
June - 39.5 93.1 18.8 27.0 48.9 76.7 35.5 106.8 152.4 46.0 160.4* 53.6 -September - 38.4 93.0 18.8 20.0 50.3 80.8 35.3 110.0 146.6 45.5 160.4* 54.1 -December - 38.5 91.0 18.7 20.6 50.2 80.9 35.3 110.3 148.4 45.3 160.4* 52.1 -
2015 March - 38.6 91.1 18.9 21.4 50.1 80.8 35.7 109.9 161.2 45.0 160.4 51.6 -June - 38.1 90.4 18.9 20.7 49.7 79.9 35.7 106.6 158.0 45.0 160.4 51.3 -September 35.8 87.7 18.9 20.8 49.4 76.4 35.4 108.1 152.7 45.0 160.4 51.8 -
Earnings in US$ million - -2013 - 354.6 746.0 292.3 192.7 597.1 553.0 338.4 858.0 962.7 402.0 109.2 756.1 -2014 - 381.5 782.4 320.6 148.4 512.2 513.3 347.3 879.1 1 029.5 304.3 193.2 579.9 - - - - -
2014 March - 94.8 203.4 76.2 41.9 129.2 129.7 87.2 201.5 241.2 71.6 28.4 146.2 -June - 91.9 194.3 81.4 38.4 124.2 121.2 86.0 219.6 254.1 77.4 54.6 144.4 -September - 98.3 189.0 81.4 33.4 127.7 128.7 86.7 224.5 261.0 78.2 54.9 146.3 -December - 96.5 195.7 81.6 34.7 131.1 133.7 87.4 233.5 273.2 77.1 55.3 143.0 - - -
2015 March - 93.8 194.0 78.1 40.7 142.6 137.3 89.1 232.1 274.6 87.7 51.2 148.8 -June - 90.4 184.7 78.3 37.8 135.0 129.4 87.2 223.7 273.3 88.0 49.8 148.6 -September 94.3 183.4 78.2 38.1 137.7 128.0 88.3 225.8 284.4 85.0 49.5 149.7 -
Note: [i] ^ Because of collection difficulties these figures exclude the employees of small agricultural units and small businesses in rural areas.
[ii] + The figures for the most recent quarters are provisional and are amended as necessary in the following quarter.
[iii] - Data not available
[iv] Data for formal employment in the agriculture sector used to include persons only employed in the LSCF farms. For consistency and comparability purposes the data now includes employees and earnings for A1, A2 farms as these previously constituted the LSCF.
Table 6.1 Employees and Earnings in Specific Urban Areas
Period Bulawayo Gweru Kadoma Marondera MutareChinhoyi Harare Kwekwe Masvingo
Employees in thousands, annual average
2013 114.1 5.7 19.2 231.7 7.0 11.6 7.7 11.8 22.52014 113.8 5.8 18.7 234.9 6.5 10.6 7.7 12.3 21.3
2014 March 114.3 6.0 19.3 233.3 7.1 10.6 7.2 11.9 22.2June 114.3 5.8 18.6 232.0 6.3 10.6 7.4 11.9 22.8September 114.3 5.7 18.6 238.0 6.2 10.7 7.9 12.5 20.4December 112.3 5.7 18.2 236.2 6.2 10.5 8.2 13.0 19.6
2015 March 112.8 5.8 17.8 236.0 6.3 10.5 8.6 14.2 20.1June 112.1 5.8 18.2 228.4 6.3 10.5 8.7 14.3 20.1September 110.8 5.8 17.9 225.5 6.2 9.7 8.6 13.7 20.0
Earnings in US$ million
2013 978.9 35.5 143.6 2 851.1 37.2 88.0 50.8 65.8 141.92014 1 021.7 37.1 152.1 2 397.8 41.0 90.8 54.7 88.4 138.0
2014 March 256.0 9.7 37.3 595.9 10.3 22.7 12.6 18.8 35.7June 255.2 9.2 37.2 587.0 10.6 22.7 13.2 20.2 35.8September 253.2 9.3 38.2 598.8 10.6 23.0 14.4 24.6 32.5December 257.3 8.9 39.4 616.1 9.5 22.4 14.5 24.8 34.0
2015 March 257.7 9.3 37.3 646.2 9.6 20.9 14.4 24.5 33.5June 253.6 9.8 33.1 618.1 9.7 22.1 15.9 26.3 32.7September 260.9 9.5 34.7 615.0 9.4 20.5 15.3 27.9 33.6
Note: [i] + The figures for the most recent quarter are provisional.
[ii] Data from selected areas excludes all mining companies
[iii] * Ammended figures
Source: Quarterly Employment Inquiry
Services
Employees in thousands, annual average
- 12 -

Number of Employees
Communal Model A
Old
Resetllment
Schemes A1 A2 SSCF LSCF National Total
2 010 376 747 40 543 422 105 145 512 141 937 6 401 100 692 792 745 2 011 369 825 34 812 129 294 124 591 6 353 86 099 665 622 2 012 232 785 30 196 107 226 342 964 8 488 80 197 771 659
2 010
March 493 009 59 548 63 640 205 622 168 165 8 636 146 721 1 054 139June 334 908 47 223 50 246 152 084 128 867 6 609 131 233 778 717September 253 010 16 181 17 781 86 949 124 038 4 284 62 683 541 240December 426 062 39 219 41 722 137 391 146 678 6 073 62 132 796 884
2 011 March 509 335 47 484 52 884 168 008 146 802 8 158 83 994 1 007 872June 384 544 35 295 38 525 128 066 111 406 4 925 89 516 774 151September 215 597 11 047 13 028 55 063 93 580 2 056 85 424 472 115December - - - 166 040 146 576 10 271 85 461 408 348
2 012
March 352 512 - 39 294 157 921 510 593 9 666 84 511 1 115 203June 173 616 - 21 688 83 474 279 078 6 250 79 606 622 024September 78 184 - 16 902 43 771 170 329 4 507 72 643 369 434December 326 827 - 42 899 143 736 411 857 13 527 84 028 979 975
Wages & Salaries (US$)
Communal Model A
Old
Resetllment
Schemes A1 A2 SSCF LSCF National Total
2 010 52 245 662 6 271 443 7 054 095 33 077 528 57 701 017 1 504 884 50 783 417 199 783 880 2 011 44 448 758 4 766 272 5 647 946 36 097 912 42 432 650 1 073 510 57 916 891 179 327 911 2 012 53 095 439 8 358 345 37 512 116 191 780 090 4 339 218 78 072 052 364 798 915
2 010
March 12 989 998 1 905 774 2 143 086 9 526 329 15 784 554 498 954 13 949 499 54 153 566June 10 997 546 1 647 964 1 860 696 8 559 707 14 113 201 357 727 12 960 296 48 157 067September 12 834 118 1 117 552 1 263 348 6 604 382 13 285 158 288 196 12 245 994 45 966 906December 15 424 000 1 600 153 1 786 965 8 387 110 14 518 103 360 007 11 627 628 51 506 340
2 011 March 16 065 797 2 292 537 2 644 275 9 634 529 16 789 680 482 332 21 798 364 68 416 228June 16 213 308 1 639 607 1 962 251 10 123 514 14 159 520 385 526 18 713 684 62 563 279September 12 169 653 834 128 1 041 420 5 365 216 11 483 450 205 652 17 404 843 48 348 404December - - - 10 974 653 11 502 797 843 157 19 253 875 42 574 481
2 012
March 15 185 825 - 2 719 044 11 597 713 55 588 231 1 095 795 20 980 189 104 447 753June 11 031 242 - 1 355 448 8 396 036 43 199 232 825 809 18 920 564 82 372 883September 8 611 704 - 1 171 689 5 402 887 33 711 741 723 312 17 780 208 66 229 852December 18 266 668 - 3 112 164 12 115 480 59 280 886 1 694 302 20 391 091 111 748 427
Note: These figures include permanent and casual workersSource: Agriculture and Livestock Survey
Table 6.2 Number of Employees in Agriculture and Wages paid, by Sector and Quarter, 2010 - 2012.
- 13 -
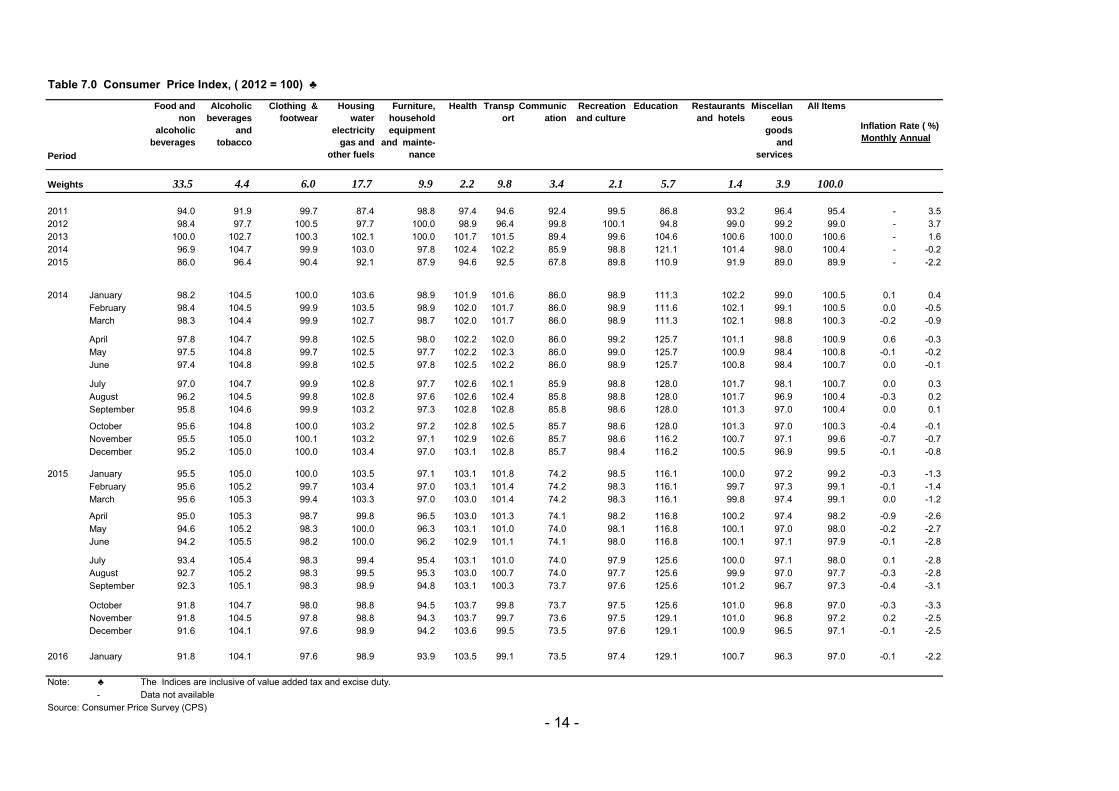
Table 7.0 Consumer Price Index, ( 2012 = 100) ♣
Period
Food and
non
alcoholic
beverages
Alcoholic
beverages
and
tobacco
Clothing &
footwear
Housing
water
electricity
gas and
other fuels
Furniture,
household
equipment
and mainte-
nance
Health Transp
ort
Communic
ation
Recreation
and culture
Education Restaurants
and hotels
Miscellan
eous
goods
and
services
All Items
Inflation
Monthly
Rate ( %)
Annual
Weights 33.5 4.4 6.0 17.7 9.9 2.2 9.8 3.4 2.1 5.7 1.4 3.9 100.0
2011 94.0 91.9 99.7 87.4 98.8 97.4 94.6 92.4 99.5 86.8 93.2 96.4 95.4 - 3.52012 98.4 97.7 100.5 97.7 100.0 98.9 96.4 99.8 100.1 94.8 99.0 99.2 99.0 - 3.72013 100.0 102.7 100.3 102.1 100.0 101.7 101.5 89.4 99.6 104.6 100.6 100.0 100.6 - 1.62014 96.9 104.7 99.9 103.0 97.8 102.4 102.2 85.9 98.8 121.1 101.4 98.0 100.4 - -0.22015 86.0 96.4 90.4 92.1 87.9 94.6 92.5 67.8 89.8 110.9 91.9 89.0 89.9 - -2.2
2014 January 98.2 104.5 100.0 103.6 98.9 101.9 101.6 86.0 98.9 111.3 102.2 99.0 100.5 0.1 0.4February 98.4 104.5 99.9 103.5 98.9 102.0 101.7 86.0 98.9 111.6 102.1 99.1 100.5 0.0 -0.5March 98.3 104.4 99.9 102.7 98.7 102.0 101.7 86.0 98.9 111.3 102.1 98.8 100.3 -0.2 -0.9
April 97.8 104.7 99.8 102.5 98.0 102.2 102.0 86.0 99.2 125.7 101.1 98.8 100.9 0.6 -0.3May 97.5 104.8 99.7 102.5 97.7 102.2 102.3 86.0 99.0 125.7 100.9 98.4 100.8 -0.1 -0.2June 97.4 104.8 99.8 102.5 97.8 102.5 102.2 86.0 98.9 125.7 100.8 98.4 100.7 0.0 -0.1 July 97.0 104.7 99.9 102.8 97.7 102.6 102.1 85.9 98.8 128.0 101.7 98.1 100.7 0.0 0.3August 96.2 104.5 99.8 102.8 97.6 102.6 102.4 85.8 98.8 128.0 101.7 96.9 100.4 -0.3 0.2September 95.8 104.6 99.9 103.2 97.3 102.8 102.8 85.8 98.6 128.0 101.3 97.0 100.4 0.0 0.1
October 95.6 104.8 100.0 103.2 97.2 102.8 102.5 85.7 98.6 128.0 101.3 97.0 100.3 -0.4 -0.1November 95.5 105.0 100.1 103.2 97.1 102.9 102.6 85.7 98.6 116.2 100.7 97.1 99.6 -0.7 -0.7December 95.2 105.0 100.0 103.4 97.0 103.1 102.8 85.7 98.4 116.2 100.5 96.9 99.5 -0.1 -0.8
2015 January 95.5 105.0 100.0 103.5 97.1 103.1 101.8 74.2 98.5 116.1 100.0 97.2 99.2 -0.3 -1.3February 95.6 105.2 99.7 103.4 97.0 103.1 101.4 74.2 98.3 116.1 99.7 97.3 99.1 -0.1 -1.4March 95.6 105.3 99.4 103.3 97.0 103.0 101.4 74.2 98.3 116.1 99.8 97.4 99.1 0.0 -1.2
April 95.0 105.3 98.7 99.8 96.5 103.0 101.3 74.1 98.2 116.8 100.2 97.4 98.2 -0.9 -2.6May 94.6 105.2 98.3 100.0 96.3 103.1 101.0 74.0 98.1 116.8 100.1 97.0 98.0 -0.2 -2.7June 94.2 105.5 98.2 100.0 96.2 102.9 101.1 74.1 98.0 116.8 100.1 97.1 97.9 -0.1 -2.8
July 93.4 105.4 98.3 99.4 95.4 103.1 101.0 74.0 97.9 125.6 100.0 97.1 98.0 0.1 -2.8August 92.7 105.2 98.3 99.5 95.3 103.0 100.7 74.0 97.7 125.6 99.9 97.0 97.7 -0.3 -2.8September 92.3 105.1 98.3 98.9 94.8 103.1 100.3 73.7 97.6 125.6 101.2 96.7 97.3 -0.4 -3.1
October 91.8 104.7 98.0 98.8 94.5 103.7 99.8 73.7 97.5 125.6 101.0 96.8 97.0 -0.3 -3.3November 91.8 104.5 97.8 98.8 94.3 103.7 99.7 73.6 97.5 129.1 101.0 96.8 97.2 0.2 -2.5December 91.6 104.1 97.6 98.9 94.2 103.6 99.5 73.5 97.6 129.1 100.9 96.5 97.1 -0.1 -2.5
2016 January 91.8 104.1 97.6 98.9 93.9 103.5 99.1 73.5 97.4 129.1 100.7 96.3 97.0 -0.1 -2.2
Note: ♣ The Indices are inclusive of value added tax and excise duty. - Data not available
Source: Consumer Price Survey (CPS)
- 14 -

Table 7.1: Food Poverty Datum Lines per person per month
2012 29.34 30.94 31.46 32.04 36.09 36.71 32.66 33.00 32.67 33.68 32.79 - 4.22013 28.95 30.00 28.48 31.11 39.86 37.12 29.66 31.21 32.66 31.65 31.90 - -4.12014 28.93 30.18 29.30 31.65 39.29 36.53 28.85 30.15 30.25 31.71 31.49 - 1.362015 28.45 30.11 29.40 30.73 37.65 35.28 28.09 29.79 32.31 31.18 31.17 - -1.02
2014 March 28.97 29.80 29.15 31.71 40.86 35.87 29.25 30.61 30.45 31.89 31.63 -0.63 3.19June 29.67 30.66 30.08 33.38 39.53 37.54 29.43 30.00 30.49 31.79 31.93 0.73 -0.62September 28.67 30.20 29.16 31.16 38.14 36.59 28.21 29.70 29.95 31.62 31.19 -0.73 0.00December 28.19 30.29 28.91 30.90 37.92 36.01 28.30 29.63 29.49 31.42 30.96 -0.09 -1.43
2015 March 28.86 30.32 29.57 31.66 39.08 36.94 28.74 28.91 31.51 31.37 31.53 0.20 -0.32June 28.88 31.01 29.84 30.80 37.81 35.57 28.07 30.72 31.04 31.33 31.39 -0.28 -1.70September 28.04 30.02 29.34 29.81 36.78 34.13 27.27 30.00 33.33 31.13 30.83 -0.71 -0.98
October 27.88 29.56 28.77 29.53 36.99 33.63 27.28 29.77 33.21 30.54 30.59 -0.89 -1.37November 27.87 29.49 28.70 30.14 36.66 34.02 27.98 29.56 33.21 30.67 30.71 0.41 -0.88December 28.20 29.42 28.52 30.52 36.44 33.35 28.23 29.59 33.09 30.19 30.65 -0.20 -0.99
2016 January 28.40 29.32 28.58 31.08 36.98 33.79 28.23 29.05 33.46 29.43 30.71 0.19 -2.11
Table 7.2: Food Poverty Datum Lines for 5 persons per household per month
Manicaland Mashonaland Central
Mashonaland East
Mashonaland West
Matabeleland North
Matabeleland South
Midlands Masvingo Harare Bulawayo Zimbabwe %) Quarterly (%) Annual
2012 146.72 154.68 157.32 160.20 180.45 183.53 163.31 164.98 163.37 168.42 163.96 - 4.22013 144.75 150.01 142.41 155.56 199.28 185.61 148.31 156.07 163.30 158.24 159.48 - -4.22014 144.67 150.88 146.50 158.24 196.44 182.65 144.25 150.75 151.27 158.55 157.45 - 1.362015 142.24 150.57 147.00 153.65 188.23 176.40 140.43 148.97 161.55 155.88 155.83 - -1.02
2014 March 144.84 149.01 145.75 158.57 204.29 179.36 146.24 153.07 152.26 159.45 158.17 -0.63 3.19June 148.36 153.29 150.39 166.88 197.64 187.69 147.17 149.99 152.43 158.96 159.64 0.73 -0.62September 143.35 151.02 145.78 155.78 190.71 182.97 141.04 148.48 149.73 158.10 155.94 -0.73 0.00December 140.93 151.43 144.57 154.52 189.61 180.05 141.51 148.15 147.45 157.12 154.81 -0.09 -1.43
2015 March 144.30 151.61 147.87 158.28 195.42 184.70 143.72 144.57 157.54 156.83 157.66 0.20 -0.32June 144.40 155.03 149.21 153.98 189.04 177.86 140.34 153.58 155.18 156.67 156.94 -0.28 -1.70September 140.20 150.08 146.68 149.05 183.91 170.65 136.36 149.98 166.67 155.63 154.17 -0.71 -0.98December 141.00 147.10 142.62 152.61 182.20 166.77 141.14 147.97 165.43 150.95 153.27 -0.20 -0.99
2016 January 142.01 146.59 142.91 155.38 184.91 168.96 141.14 145.24 167.32 147.15 153.56 0.19 -2.11
Note: * new basket as from May 2013 onwards, see page 78 for details
(%) AnnualMasvingo Harare Bulawayo Zimbabwe %) Quarterly Mashonaland East
Mashonaland West
Matabeleland North
Matabeleland South
MidlandsManicaland Mashonaland Central
- 15 -

Table 7.3: Total Consumption Poverty Lines per person per month
2012 95.05 100.21 101.92 103.78 116.90 118.90 105.80 106.88 105.84 109.11 106.22 - 3.302013 91.40 94.71 89.92 98.21 125.74 117.13 93.64 98.53 103.08 101.22 100.81 - -6.622014 92.86 97.01 94.06 101.63 126.12 117.80 92.59 96.65 97.36 101.67 101.15 - 3.042015 88.98 97.15 92.35 96.49 117.33 113.67 88.79 96.16 95.42 100.46 98.19 - -2.92
2014 March 92.86 95.53 93.44 101.65 130.92 114.96 93.75 98.13 97.61 102.22 101.39 -0.63 6.15June 95.12 98.28 96.41 106.98 126.66 120.30 94.35 96.15 97.72 101.90 102.34 0.73 1.60September 92.45 97.67 93.96 100.66 122.77 118.80 90.96 95.42 96.88 101.15 100.58 -0.12 -0.46December 90.05 97.91 92.81 99.02 122.57 119.59 90.50 94.36 96.52 101.75 99.96 0.03 -1.12
2015 March 90.22 97.83 92.80 99.18 121.26 118.74 90.91 91.07 92.41 101.16 99.01 -0.34 -2.35June 90.29 100.04 93.64 96.49 117.30 114.34 88.76 100.81 91.03 101.06 98.96 0.13 -3.30September 87.66 96.85 92.05 93.40 114.12 109.71 86.25 98.44 97.77 100.39 96.98 -0.71 -3.52December 88.16 94.93 89.50 95.63 113.06 107.21 89.27 97.13 97.04 97.37 96.65 -0.20 -3.31
2016 January 88.29 94.74 89.48 96.10 113.50 107.55 89.19 96.49 97.33 96.52 96.63 - 0.02 - 3.27
Table 7.4: Total Consumption Poverty Lines for 5 persons per household per month
2012 475.27 501.04 509.59 518.92 584.51 594.50 529.00 534.42 529.19 545.54 531.11 - 3.302013 456.98 473.55 449.62 491.03 628.68 585.63 468.21 492.63 515.39 506.11 504.03 - -6.622014 464.30 485.06 470.28 508.16 630.58 588.99 462.97 483.24 486.80 508.37 505.73 - 3.042015 444.89 485.76 461.77 482.46 586.63 568.33 443.97 480.81 477.12 502.32 490.96 - -2.92
2014 March 464.29 477.66 467.19 508.26 654.61 574.80 468.77 490.65 488.06 511.09 506.97 -0.63 6.15June 475.59 491.39 482.07 534.89 633.29 601.48 471.76 480.76 488.58 509.50 511.69 0.73 1.60September 462.26 488.34 469.82 503.31 613.87 594.01 454.82 477.09 484.39 505.74 502.90 -0.12 -0.46December 450.25 489.55 464.07 495.12 612.84 597.97 452.49 471.82 482.58 508.75 499.81 0.03 -1.12
2015 March 451.12 489.15 463.98 495.89 606.32 593.71 454.53 455.35 462.06 505.78 495.05 -0.34 -2.35June 451.45 500.19 468.18 482.43 586.51 571.72 443.82 504.03 455.15 505.29 494.81 0.13 -3.30September 438.30 484.24 460.26 466.98 570.61 548.55 431.24 492.22 488.83 501.94 484.88 -0.71 -3.52December 440.81 474.63 447.50 478.14 565.30 536.06 446.36 485.64 485.19 486.84 483.25 -0.20 -3.31
2016 January 441.44 473.69 447.39 480.48 567.51 537.77 445.96 482.46 486.67 482.60 483.16 - 0.02 - 3.27
Note: - Data not available* new basket as from May 2013 onwards, see page 78 for details
Zimbabwe %) Quarterly (%) AnnualMashonaland West
Matabeleland North
Matabeleland South
Midlands Masvingo BulawayoManicaland Mashonaland Central
Mashonaland East
HarareMatabeleland South
Midlands Masvingo
Harare
Zimbabwe %) Quarterly (%) Annual BulawayoManicaland Mashonaland Central
Mashonaland East
Mashonaland West
Matabeleland North
- 16 -

Gross Domestic Income in US$ 2011 2012 2013 2014
Compensation of Employees 4 722 955 244 5 771 999 643 6 383 299 643 7 043 890 947
Gross Operating Surplus 3 782 001 716 3 983 102 269 4 207 198 883 4 302 640 690
Mixed Income 748 656 971 711 664 164 774 689 877 825 568 257
Net other taxes on production 151 470 358 171 328 177 185 199 312 184 073 876
Taxes on production 151 470 358 171 328 177 185 199 312 184 073 876
Subsidies on production 0 0 0 0
GDP at Basic prices 9 405 084 289 10 638 094 253 11 550 387 715 12 356 173 771
Net taxes on products 1 551 251 566 1 754 621 209 1 939 839 421 1 840 738 763
Taxes on products 1 551 142 322 1 754 621 209 1 939 839 421 1 840 738 763
Subsidies on products 0 0 0 0
GDP at market prices 10 956 335 855 12 392 715 462 13 490 227 136 14 196 912 535
Net primary income from abroad - 210 400 000 - 217 900 000 - 225 667 348 - 1 116 374 607
Primary income received from abroad 88 200 000 94 900 000 102 108 957 293 304 242
Primary income paid abroad 298 600 000 312 800 000 1 288 298 338 1 409 678 849
Gross National Income 10 745 935 855 12 174 815 462 13 264 559 788 13 080 537 928
Table 8.0 Gross Domestic Product (GDP) Income Approach at Current Prices, in
United States Dollars
- 16 - - 17 -
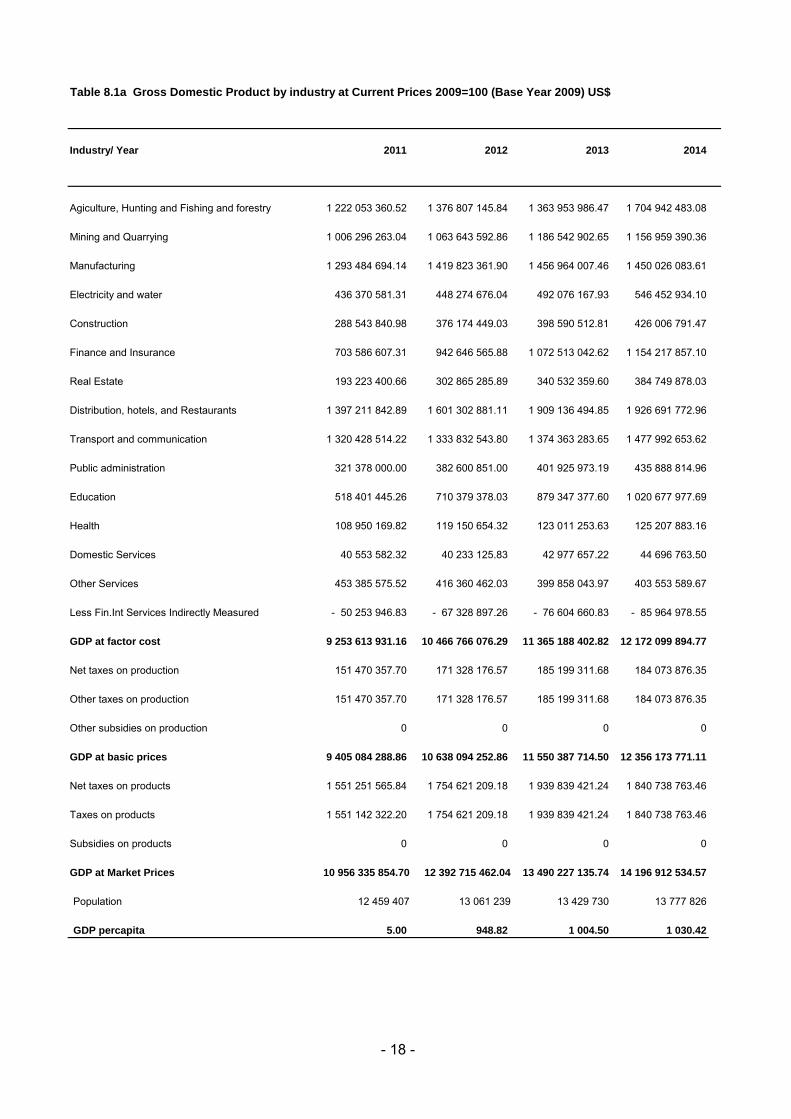
Table 8.1a Gross Domestic Product by industry at Current Prices 2009=100 (Base Year 2009) US$
Industry/ Year 2011 2012 2013 2014
Agiculture, Hunting and Fishing and forestry 1 222 053 360.52 1 376 807 145.84 1 363 953 986.47 1 704 942 483.08
Mining and Quarrying 1 006 296 263.04 1 063 643 592.86 1 186 542 902.65 1 156 959 390.36
Manufacturing 1 293 484 694.14 1 419 823 361.90 1 456 964 007.46 1 450 026 083.61
Electricity and water 436 370 581.31 448 274 676.04 492 076 167.93 546 452 934.10
Construction 288 543 840.98 376 174 449.03 398 590 512.81 426 006 791.47
Finance and Insurance 703 586 607.31 942 646 565.88 1 072 513 042.62 1 154 217 857.10
Real Estate 193 223 400.66 302 865 285.89 340 532 359.60 384 749 878.03
Distribution, hotels, and Restaurants 1 397 211 842.89 1 601 302 881.11 1 909 136 494.85 1 926 691 772.96
Transport and communication 1 320 428 514.22 1 333 832 543.80 1 374 363 283.65 1 477 992 653.62
Public administration 321 378 000.00 382 600 851.00 401 925 973.19 435 888 814.96
Education 518 401 445.26 710 379 378.03 879 347 377.60 1 020 677 977.69
Health 108 950 169.82 119 150 654.32 123 011 253.63 125 207 883.16
Domestic Services 40 553 582.32 40 233 125.83 42 977 657.22 44 696 763.50
Other Services 453 385 575.52 416 360 462.03 399 858 043.97 403 553 589.67
Less Fin.Int Services Indirectly Measured - 50 253 946.83 - 67 328 897.26 - 76 604 660.83 - 85 964 978.55
GDP at factor cost 9 253 613 931.16 10 466 766 076.29 11 365 188 402.82 12 172 099 894.77
Net taxes on production 151 470 357.70 171 328 176.57 185 199 311.68 184 073 876.35
Other taxes on production 151 470 357.70 171 328 176.57 185 199 311.68 184 073 876.35
Other subsidies on production 0 0 0 0
GDP at basic prices 9 405 084 288.86 10 638 094 252.86 11 550 387 714.50 12 356 173 771.11
Net taxes on products 1 551 251 565.84 1 754 621 209.18 1 939 839 421.24 1 840 738 763.46
Taxes on products 1 551 142 322.20 1 754 621 209.18 1 939 839 421.24 1 840 738 763.46
Subsidies on products 0 0
GDP at Market Prices 13 490 227 135.74 14 196 912 534.57
Population
0
10 956 335 854.70
12 459 407
0
12 392 715 462.04
13 061 239 13 429 730 13 777 826
GDP percapita 5.00 948.82 1 004.50 1 030.42
- 18 -
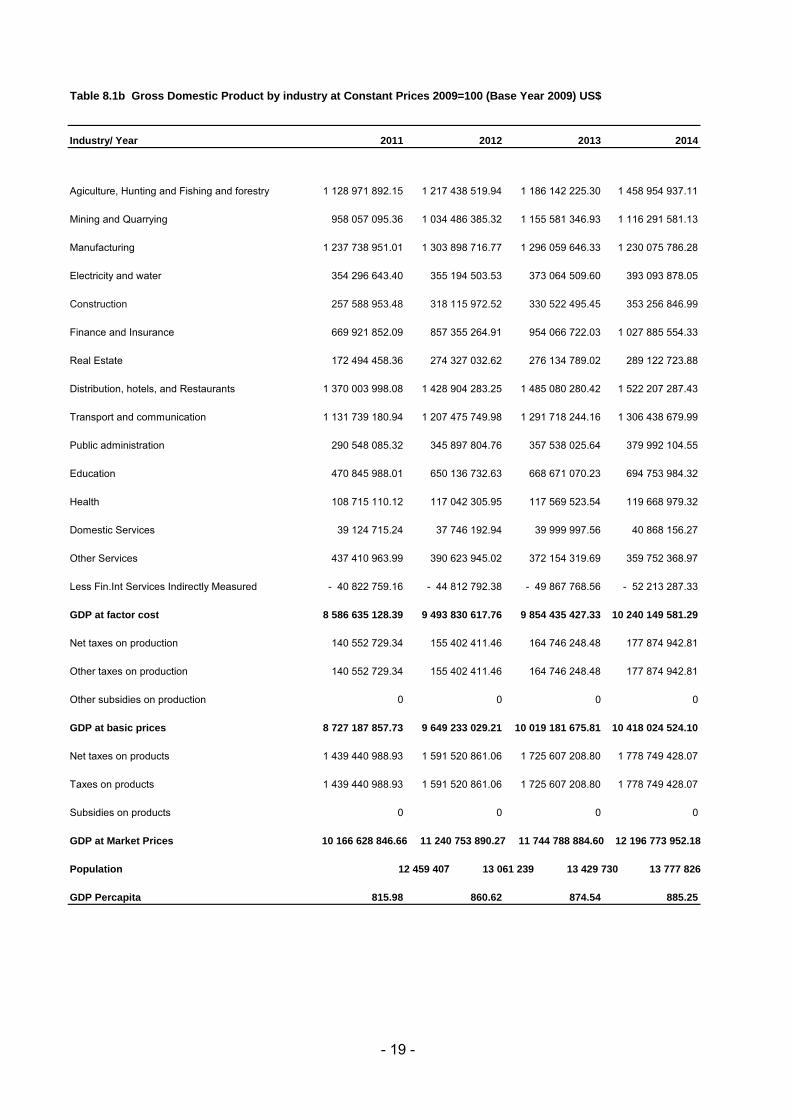
Table 8.1b Gross Domestic Product by industry at Constant Prices 2009=100 (Base Year 2009) US$
Industry/ Year 2011 2012 2013 2014
Agiculture, Hunting and Fishing and forestry 1 128 971 892.15 1 217 438 519.94 1 186 142 225.30 1 458 954 937.11
Mining and Quarrying 958 057 095.36 1 034 486 385.32 1 155 581 346.93 1 116 291 581.13
Manufacturing 1 237 738 951.01 1 303 898 716.77 1 296 059 646.33 1 230 075 786.28
Electricity and water 354 296 643.40 355 194 503.53 373 064 509.60 393 093 878.05
Construction 257 588 953.48 318 115 972.52 330 522 495.45 353 256 846.99
Finance and Insurance 669 921 852.09 857 355 264.91 954 066 722.03 1 027 885 554.33
Real Estate 172 494 458.36 274 327 032.62 276 134 789.02 289 122 723.88
Distribution, hotels, and Restaurants 1 370 003 998.08 1 428 904 283.25 1 485 080 280.42 1 522 207 287.43
Transport and communication 1 131 739 180.94 1 207 475 749.98 1 291 718 244.16 1 306 438 679.99
Public administration 290 548 085.32 345 897 804.76 357 538 025.64 379 992 104.55
Education 470 845 988.01 650 136 732.63 668 671 070.23 694 753 984.32
Health 108 715 110.12 117 042 305.95 117 569 523.54 119 668 979.32
Domestic Services 39 124 715.24 37 746 192.94 39 999 997.56 40 868 156.27
Other Services 437 410 963.99 390 623 945.02 372 154 319.69 359 752 368.97
Less Fin.Int Services Indirectly Measured - 40 822 759.16 - 44 812 792.38 - 49 867 768.56 - 52 213 287.33
GDP at factor cost 8 586 635 128.39 9 493 830 617.76 9 854 435 427.33 10 240 149 581.29
Net taxes on production 140 552 729.34 155 402 411.46 164 746 248.48 177 874 942.81
Other taxes on production 140 552 729.34 155 402 411.46 164 746 248.48 177 874 942.81
Other subsidies on production 0 0 0 0
GDP at basic prices 8 727 187 857.73 9 649 233 029.21 10 019 181 675.81 10 418 024 524.10
Net taxes on products 1 439 440 988.93 1 591 520 861.06 1 725 607 208.80 1 778 749 428.07
Taxes on products 1 439 440 988.93 1 591 520 861.06 1 725 607 208.80 1 778 749 428.07
Subsidies on products 0 0 0 0
GDP at Market Prices
Population
10 166 628 846.66 11 240 753 890.27 11 744 788 884.60 12 196 773 952.18
12 459 407 13 061 239 13 429 730 13 777 826
GDP Percapita 815.98 860.62 874.54 885.25
- 19 -

2013 2014 2013 2014 2013 2014
Final Consumption Expenditure 15 765 368 543.90 15 929 098 096.99 117 112 9 1
Private Consumption 12 114 803 713.49 11 521 668 088.62 90 81 5 -5
Consumption of Private Non- Profit Bodies 788 604 716.03 992 265 966.30 6 7 39 26
Government Consumption Expenditure 2 861 960 114.38 3 415 164 042.07 21 24 21 19
Gross Capital Formation 1 758 183 493.86 1 879 216 750.05 13 13 4 7
Gross fixed Capital Formation 1 752 817 375.86 1 873 381 533.99 13 13 -16 7
Changes in Stocks 5 366 118.00 5 835 216.06 0 0 -101 9
Domestic Expenditure 17 687 117 069.39 17 808 314 847.04 131 125 9 4
Net Exports of Goods and Services - 4 033 324 902.02 - 3 611 402 312.47 -30 -25 7 -10
Exports of Goods and Services 3 971 985 668.81 3 841 893 304.50 29 27 -3 -3
less Imports of Goods and Services 8 005 310 570.83 7 453 295 616.96 59 52 2 -7
Gross Domestic Product at Market Prices 13 490 227 135.74 14 196 912 534.57 100 100 9 5
Net Property Income from Abroad - 1 034 020 787.25 - 1 116 374 606.97 -8 -8 7 8
Primary Income Received from Abroad 272 065 796.35 293 304 242.46 2 2 -29 8
Primary income paid abroad 1 306 086 583.60 1 409 678 849.43 10 10 -3 8
Gross National Income 12 456 206 348.49 13 080 537 927.61 92 92 9 5
US$
Table 8.2a Gross Domestic Product(GDP) Expenditure Approach at Current Prices 2009=100 (Base
Year 2009) US$
Percentage
Contribution
Percentage Growth
Rate
- 20 -

2013 2014 2013 2014 2013 2014
Final Consumption Expenditure 13 842 009 048.33 13 711 996 795.52 118 112 1 (1)
Private Consumption 10 594 605 722.80 9 757 295 081.85 90 80 (4) (8)
Consumption of Private Non- Profit Bodies 701 512 696.34 910 215 464.48 6 7 37 30
Government Consumption Expenditure 2 545 890 629.19 3 044 486 249.20 22 25 19 20
Gross Capital Formation 1 594 706 280.17 1 797 715 045.18 14 15 69 13
Gross fixed Capital Formation 1 589 839 107.83 1 792 228 273.69 14 15 22 13
Changes in Stocks 4 867 172.34 5 486 771.49 0 0 (101) 13
Domestic Expenditure 15 398 662 592.34 15 509 711 840.71 131 127 5 0
Net Exports of Goods and Services -3 691 926 443.90 -3 312 775 349.46 (31) (27) 9 (10)
Exports of Goods and Services 3 635 779 234.68 3 524 207 034.61 31 29 (1) (3)
less Imports of Goods and Services 7 327 705 678.58 6 836 982 384.08 62 56 3 (7)
Gross Domestic Product at Market Prices 11 744 788 884.60 12 196 936 491.24 100 100 4 4
Net Property Income from Abroad - 946 496 694.60 -1 024 061 558.02 (8) (8) 9 8
Primary Income Received from Abroad 249 036 944.07 269 050 906.06 2 2 (29) 8
Primary income paid abroad 1 195 533 638.66 1 293 112 464.08 10 11 (2) 8
Gross National Income 10 798 292 190.01 11 172 874 933.23 92 92 4.1 3.5
Table 8.2b Gross Domestic Product(GDP) Expenditure Approach at Constant Prices 2009=100 (Base Year
2009) US$
Percentage
Distribution
Percentage Growth
RateUS$
- 21 -

Table 9.0: Balance of Payments, Summary Data, US$ Million: 2012–2014
2012 2013 2014
CURRENT ACCOUNT (excl.official transfers) -3 049.4 -3 425.6 -2 931.4
TRADE BAL f.o.b -2 902.0 -3 114.6 -2 666.6
Exports f.o.b 3 808.2 3 694.2 3 621.3 Imports f.o.b 6 710.2 6 808.9 6 287.9
NON FACTOR SERVICE(Net) - 867.1 - 928.5 - 937.5
Receipts 268.1 277.8 283.6 Payments 1 135.2 1 206.3 1 221.1
INCOME(Net) - 959.0 -1 017.6 -1 108.2
Interest - 123.5 - 143.3 - 202.4 Receipts 3.3 3.5 3.6 Payments:Public & Pvt Sectors 126.8 146.8 206.0
Actual Repaid 16.2 95.9 8.0
Other Income (Net) - 835.5 - 874.3 - 905.8
Receipts 378.2 267.2 289.0 Payments 1 213.7 1 141.5 1 194.9TRANSFERS(Net) 1 678.7 1 635.1 1 781.0
Receipts 1 697.0 1 658.5 1 806.6 o/w Humanitarian Assistance 944.6 783.2 800.0 o/w Diaspora Remittances 646.3 764.2 890.5 Payments 18.3 23.3 25.7
CAPITAL ACCOUNT (Incl. Official Transfers) 1 721.8 2 723.4 2 579.8
Grants 737.5 251.0 369.4 Direct Investment (Net) 349.9 373.1 300.6 Portfolio Investment (Net) 99.2 114.2 96.3
Long Term Capital (net) - Loans 10.4 1 057.9 1 122.4
Government - 156.6 43.2 212.6 Receipts 0.0 199.2 343.0 o/w World Bank 0.0 0.0 0.0 ADB 0.0 0.0 0.0 Payments (scheduled) 156.6 156.0 130.4 o/w World Bank 28.6 25.1 28.6
Actual Repaid 20.3 101.6 39.5
ADB 0.0 1.6 2.8 Public Enterprises - 19.9 0.0 0.0
Receipts 0.0 0.0 0.0 Payments (scheduled) 19.9 0.0 0.0 Private Sector 186.9 1 014.7 909.8
Receipts 467.4 1 329.7 1 164.8 Payments (scheduled) 280.5 315.0 255.0
Short term capital (net) -Loans 524.9 927.2 691.0
Government 0.0 0.0 0.0 Public Enterprises 0.0 0.0 0.0 Private 343.4 663.0 696.2 Change in DMBs NFA 181.5 264.2 - 5.1 Currency in Circulation Unrecorded capital inflows 0.0 0.0 0.0
Errors and omissions 1 578.3 335.9 0.0
Overall Balance 250.7 - 366.4 - 351.6
Source : Reserve Bank of Zimbabwe
Note: 1) All figures are net. The table does not show gold monetization, valuation factors, use of IMF resources, extraordinary financing and net errors and omissions2) Includes timing adjustments, internal freights, gold sales and gold scrap agreements.3) Includes statistical discrepancy.
- 22 -

Table 10.0 Summary of External Trade, US$
Period Total Domestic Re- Total
Imports Exports Exports Exports
2012 7 462 913 437 3 837 939 047 44 347 181 3 882 286 2282013 7 704 061 789 3 415 830 544 91 360 741 3 507 191 2842014 6 379 758 045 3 009 022 932 54 713 678 3 063 736 6102015 6 002 596 473 2 682 046 588 22 049 360 2 704 095 948
2014 January 487 819 583 272 446 906 5 750 837 278 197 743February 478 794 480 189 376 242 3 089 537 192 465 779March 499 943 511 154 425 938 1 987 855 156 413 793
April 491 606 257 173 426 948 5 568 630 178 995 578May 510 058 768 176 321 470 7 918 203 184 239 672June 528 100 342 232 646 488 5 360 800 238 007 288
July 537 979 154 266 190 706 3 728 007 269 918 713August 547 848 520 316 223 627 2 962 523 319 186 149September 577 647 430 228 201 160 2 203 294 230 404 453
October 636 661 409 365 402 375 7 347 265 372 749 640November 560 678 583 408 408 332 3 121 255 411 529 587December 522 620 007 225 952 742 5 675 472 231 628 214
2015 January 519 568 575 263 637 149 3 383 208 267 020 357February 474 425 593 259 663 008 1 068 997 260 732 006March 499 402 078 186 468 557 1 967 279 188 435 836
April 438 407 701 183 168 868 2 545 620 185 714 488May 452 935 239 135 199 747 2 301 902 137 501 649June 532 342 522 191 467 704 1 429 321 192 897 025
July 541 630 925 221 671 275 3 919 360 225 590 634August 512 236 536 157 243 526 924 477 158 168 003September 583 699 859 222 380 399 1 123 268 223 503 667
October 515 834 076 233 710 937 2 495 540 236 206 477November 449 204 776 407 735 436 386 978 408 122 415December 482 908 592 219 699 981 503 409 220 203 391
- 23 -

Table 10.1: Domestic Exports Classified by Principal Countries, US$
Year
Period \
Partner South Africa United Arab Emirates Mozambique Zambia China Botswana Belgium Italy Israel
Democratic Republic
of Congo United States
2012 2 649 420 120 481 900 344 278 375 251 85 139 499 85 042 438 48 311 303 47 586 107 41 010 409 31 562 574 16 342 791 16 251 0952013 2 534 082 035 229 095 525 364 643 066 110 201 773 30 903 125 43 621 720 26 661 213 588 067 39 596 679 11 540 948 2 169 0242014 2 014 941 833 96 055 778 574 122 147 95 070 080 12 378 194 27 519 674 125 011 189 1 920 026 9 528 693 4 393 756 2 561 4522015 1 908 710 584 147 837 273 407 619 485 86 967 575 4 435 851 30 657 053 18 807 343 401 034 13 687 803 3 688 132 2 311 055
2014 January 148 189 361 7 237 408 50 497 102 5 908 958 23 290 2 824 622 51 477 136 542 850 2 642 506 28 539 180 750February 105 950 822 14 794 381 54 554 390 6 158 060 1 851 045 1 381 687 2 451 582 134 240 0 11 325 226 016March 97 491 043 34 994 43 630 099 9 473 267 45 503 1 769 366 2 439 474 621 1 719 0 147 423
April 118 733 186 5 677 688 34 091 000 8 265 709 22 285 1 756 042 1 885 20 2 409 131 70 170 102 248May 119 303 663 2 863 470 32 261 738 8 020 284 48 031 2 576 237 6 467 595 248 636 2 008 106 573 000 158 096June 147 621 298 11 550 647 56 936 395 8 199 013 137 111 3 466 631 2 118 238 050 117 231 657 303 320 619
July 183 316 910 8 576 053 56 497 684 8 836 057 103 122 1 990 726 90 670 0 2 349 406 679 319 77 707August 202 230 994 7 824 965 50 259 785 7 970 374 3 872 837 2 132 524 37 699 898 7 277 580 638 368 355 722September 161 285 324 6 739 368 43 196 695 8 282 985 33 150 2 839 886 872 646 5 950 0 420 161 119 933
October 268 911 986 5 081 987 55 411 354 8 009 225 6 139 818 2 221 709 12 877 938 148 413 5 411 110 253 892November 328 004 007 5 709 146 48 579 558 8 932 438 90 002 2 173 984 6 698 416 118 133 10 414 341 403 765December 133 903 241 19 965 672 48 206 348 7 013 711 12 000 2 386 259 6 368 867 1 836 0 490 120 215 280
2015 January 196 790 040 13 380 108 41 575 035 5 666 032 37 750 1 722 277 107 870 15 1 639 627 448 500 308 618February 206 982 777 12 562 075 27 401 543 8 408 559 384 1 532 230 2 621 201 113 523 326 649 241 950March 113 703 197 19 058 028 25 791 466 8 744 658 47 290 3 145 646 1 580 36 9 411 724 373 753 247 217
April 111 692 251 32 679 875 26 539 088 5 908 570 40 005 1 203 220 0 2 560 0 328 713 195 153May 87 473 576 1 850 047 32 809 750 6 445 996 10 052 1 374 817 2 587 0 10 526 462 036 144 422June 110 481 106 14 489 867 42 844 479 7 899 522 140 662 3 370 622 5 467 695 13 204 49 119 611 572 154 061
July 134 516 705 12 810 388 51 264 853 8 527 650 585 001 2 913 495 13 128 12 460 258 664 232 87 213August 86 780 163 8 338 433 41 122 967 6 814 216 139 500 3 749 581 223 439 8 498 1 258 402 450 755 102 395September 152 867 271 7 333 776 40 824 040 8 061 371 606 5 323 522 4 329 864 3 450 36 911 21 921 190 941
October 175 796 330 9 556 555 32 478 033 6 935 952 308 2 747 225 2 892 922 95 400 12 405 0 234 015November 358 784 607 4 101 060 24 015 415 6 429 414 3 426 888 2 034 204 4 158 702 275 045 695 307 0 150 549December 172 842 560 11 677 060 20 952 816 7 125 637 7 405 1 540 213 1 606 935 2 613 0 0 254 520
- 24 -

Year
Period \
Partner
2012201320142015
2014 JanuaryFebruaryMarch
AprilMayJune
JulyAugustSeptember
OctoberNovemberDecember
2015 JanuaryFebruaryMarch
AprilMayJune
JulyAugustSeptember
OctoberNovemberDecember
Germany Switzerland Malawi Netherlands Namibia Hong Kong India United Kingdom Singapore Portugal Lesotho
16 010 048 14 798 865 5 422 819 5 233 225 2 385 871 2 242 512 2 229 708 1 984 474 1 449 094 907 786 894 720 576 484 59 561 6 905 799 995 377 7 966 627 58 808 12 926 1 519 918 13 406 100 8 858
4 405 592 515 138 4 723 133 3 166 767 8 974 696 2 371 217 675 055 1 678 705 299 178 0 526 105 647 990 271 962 3 332 484 4 577 900 13 725 158 1 336 470 146 662 1 614 120 3 430 670 0
415 982 2 200 174 002 124 049 1 507 648 32 110 0 45 865 245 631 0 0 285 702 0 192 855 364 611 433 829 37 460 283 79 064 49 111 0 5 364 278 024 1 550 114 039 363 426 77 907 0 68 98 035 5 0 0
317 254 2 321 616 655 352 879 437 829 70 700 0 157 737 3 459 0 0 558 746 10 453 452 24 936 371 179 1 610 0 34 565 4 0 0 519 544 0 462 960 193 823 768 894 26 000 152 94 881 0 0 0
306 683 0 368 496 364 707 1 006 870 1 002 380 0 84 370 0 0 3 900 188 397 41 127 253 858 285 409 1 152 559 14 001 0 15 054 953 0 357 343 597 538 6 100 432 627 206 445 730 648 75 004 8 266 164 833 5 0 137 355
885 032 288 821 651 435 254 900 997 122 1 088 352 8 610 373 714 10 0 0 37 632 151 862 602 788 283 340 971 137 23 600 3 725 446 427 0 0 0 15 058 21 147 399 965 348 243 519 074 0 653 951 84 160 0 0 22 142
7 503 3 900 246 406 117 613 953 101 0 16 210 32 973 0 0 0 88 518 17 196 298 230 100 1 028 246 0 1 588 52 221 5 0 0
252 469 0 282 544 951 356 1 396 663 10 500 5 239 444 10 0 0
102 382 0 287 947 588 424 795 320 491 728 1 093 113 801 1 246 0 0 12 966 0 235 882 326 201 992 220 0 10 610 133 345 855 0 0 72 776 68 727 318 981 242 494 1 955 191 2 463 6 657 82 564 0 0 0
15 231 0 284 376 1 219 261 2 611 411 475 577 59 658 138 359 1 314 670 0 2 344 53 746 368 801 256 360 1 125 765 6 511 13 185 113 790 0 0 0
35 488 136 146 401 473 259 251 642 698 13 600 11 001 183 160 0 0 0
29 791 4 091 394 595 259 364 750 888 183 0 133 842 0 0 0 17 665 4 689 110 806 110 358 779 808 317 908 26 624 151 846 0 0 0 10 857 645 204 376 17 118 693 848 18 000 31 238 775 0 0 0
Table 10.1: Domestic Exports Classified by Principal Countries, US$ continued
- 25 -

Year
Period \
Partner
2012201320142015
2014 JanuaryFebruaryMarch
AprilMayJune
JulyAugustSeptember
OctoberNovemberDecember
2015 JanuaryFebruaryMarch
AprilMayJune
JulyAugustSeptember
OctoberNovemberDecember
Japan Kenya Jordan Congo Canada Swaziland Sweden
United Republic of
Tanzania Total Principal Countries Other Countries World:
877 475 810 791 375 338 270 119 260 829 252 248 248 787 238 536 3 837 835 175 1 459 082 3 839 294 257 225 473 248 898 1 531 164 612 314 305 266 719 329 685 66 128 3 412 838 391 2 992 153 3 415 830 544 336 955 433 019 15 675 456 683 57 030 532 617 101 171 793 966 2 993 565 525 15 457 407 3 009 022 932 207 498 731 944 22 663 297 166 136 650 1 030 083 22 704 694 091 2 653 922 833 28 123 756 2 682 046 588
0 0 0 0 25 500 7 162 0 0 272 132 670 314 237 272 446 906 100 223 944 0 85 000 11 500 13 864 0 0 189 296 234 80 008 189 376 242
0 18 725 0 31 780 900 11 196 0 44 413 154 110 542 315 396 154 425 938
0 1 040 0 80 011 3 800 22 075 1 710 910 173 197 746 229 201 173 426 948 0 308 0 27 200 3 500 35 291 0 67 762 176 107 419 214 051 176 321 470
96 070 20 0 181 750 6 100 0 17 530 65 302 231 679 442 967 047 232 646 488
7 820 87 231 5 675 13 685 0 0 80 319 20 220 265 870 011 320 695 266 190 706 0 59 493 0 31 403 1 600 163 921 0 1 350 315 559 792 663 835 316 223 627
20 15 698 0 0 0 188 643 0 3 061 226 362 340 1 838 819 228 201 160
0 210 0 0 4 130 90 090 0 8 700 364 118 563 1 283 812 365 402 375 6 624 6 443 0 5 854 0 375 1 612 0 403 665 218 4 743 114 408 408 332
226 320 19 908 10 000 0 0 0 0 582 248 221 465 550 4 487 193 225 952 742
60 50 871 0 0 6 480 130 833 0 25 435 263 267 256 369 893 263 637 149 0 92 557 0 0 460 1 703 0 185 157 259 449 382 213 627 259 663 008
7 625 60 845 0 7 079 20 750 96 349 0 90 183 850 325 2 618 232 186 468 557 0 0
0 15 925 0 0 8 088 6 300 0 0 181 001 688 2 167 180 183 168 868 800 14 410 0 0 3 934 142 647 4 253 8 575 132 470 507 2 729 240 135 199 747 21 62 692 3 340 0 9 540 181 184 1 407 9 397 188 539 345 2 928 360 191 467 704
0 0 0 7 333 0 4 444 2 185 244 588 1 253 55 591 216 964 187 4 707 088 221 671 275 0 9 356 0 805 1 945 226 480 15 000 4 782 151 187 218 6 056 308 157 243 526 0 68 316 19 323 263 909 80 222 0 0 913 221 109 173 1 271 226 222 380 399
0 0 72 580 18 860 0 20 929 3 045 0 0 400 910 232 838 222 872 716 233 710 937
126 411 11 260 0 0 0 0 791 1 602 405 730 962 2 004 474 407 735 436 0 319 518 0 0 0 0 0 1 640 217 514 568 2 185 413 219 699 981
Table 10.1: Domestic Exports Classified by Principal Countries, US$ continued
- 26 -

Table 10.2: Imports Classified by Principal Countries, US$
Year
Period \
Partner South Africa United Kingdom United States Zambia China Mozambique Kuwait India Botswana Japan
United Arab
Emirates
2012 3 207 226 887 1 262 652 414 558 166 376 492 315 074 354 547 929 177 515 520 152 722 818 150 423 652 112 894 016 93 170 505 86 862 2182013 3 658 807 516 1 415 675 361 167 340 708 262 112 917 438 415 918 200 455 012 1 724 787 156 700 917 175 939 444 139 354 678 102 076 6672014 2 735 521 816 208 428 734 76 799 361 179 722 110 398 815 981 148 428 175 549 885 131 688 857 148 001 936 154 852 795 106 900 4912015 2 305 231 335 98 022 056 69 708 075 277 478 385 458 159 911 170 816 437 4 193 549 237 689 736 54 976 085 129 804 492 79 700 977
2014 January 181 989 265 89 988 236 5 984 943 14 916 153 31 530 426 12 782 123 0 6 955 866 12 711 326 11 978 504 8 550 739February 233 587 844 11 115 165 5 256 970 10 876 931 23 556 039 10 954 865 0 9 827 616 7 811 654 10 055 185 8 691 017March 211 406 149 9 301 607 8 625 032 13 750 936 25 239 504 10 669 012 0 10 402 774 13 026 424 11 408 275 8 714 104
April 188 585 775 10 703 996 8 209 936 10 445 573 19 792 915 15 910 423 53 7 345 243 13 663 997 12 451 098 8 430 484May 199 122 138 8 803 615 7 544 626 12 322 146 29 883 221 14 947 246 50 16 167 776 13 521 105 13 536 291 7 117 185June 236 639 667 9 464 420 4 630 777 23 057 692 26 807 806 12 604 713 1 493 10 919 365 9 336 388 12 808 584 6 821 941
July 245 644 897 10 378 036 5 289 719 21 459 049 39 958 561 13 067 724 16 761 9 336 856 7 806 757 14 896 691 9 546 842August 231 829 729 10 156 653 7 370 275 17 301 270 45 383 944 10 545 634 0 6 317 371 7 569 214 14 475 962 12 928 960September 266 362 346 10 997 912 6 513 483 17 878 077 56 806 281 13 088 175 167 495 11 961 814 10 878 175 14 140 448 7 205 620
October 271 337 524 16 145 605 7 769 878 16 101 454 35 037 452 11 587 009 98 019 20 958 344 31 873 550 17 848 206 12 364 814November 244 301 284 8 489 567 4 860 393 12 043 165 33 034 374 11 066 742 239 397 11 527 949 10 031 538 10 481 228 7 459 227December 224 715 197 12 883 923 4 743 328 9 569 664 31 785 457 11 204 510 26 617 9 967 883 9 771 807 10 772 323 9 069 559
2015 January 187 736 875 10 201 346 7 485 204 14 001 217 37 110 072 14 221 681 232 237 33 003 229 5 003 280 10 315 824 7 169 518February 196 176 895 8 324 769 5 137 540 14 220 519 27 340 974 13 975 139 290 888 14 837 019 4 576 178 8 506 636 6 162 465March 200 199 873 8 323 571 6 040 510 13 896 954 34 548 111 15 431 529 249 457 21 884 108 4 354 592 10 765 204 5 822 297
April 169 161 618 7 880 481 6 578 715 15 111 840 29 331 972 12 130 245 411 807 5 941 715 4 247 338 9 150 823 4 537 111May 189 340 457 11 270 763 5 396 538 19 824 023 38 927 414 11 759 709 612 710 5 071 405 4 929 764 11 194 374 7 662 831June 190 885 776 7 837 101 5 466 017 25 782 829 46 497 573 17 430 594 557 46 647 774 4 813 041 10 958 816 8 718 360
July 201 621 112 7 297 818 5 850 990 30 667 767 37 802 456 16 083 454 188 171 32 429 152 4 361 098 14 099 932 8 489 921August 208 469 623 7 659 927 5 711 055 28 473 125 35 313 298 18 228 603 1 080 284 19 501 441 4 803 908 14 252 700 6 472 392September 178 051 007 8 858 093 5 220 245 32 772 554 36 464 379 12 614 691 673 637 33 728 968 5 450 669 8 804 459 5 304 024
October 200 855 813 6 480 033 4 733 675 29 619 055 52 015 847 11 857 885 99 880 10 353 925 3 588 186 10 119 655 6 818 755November 193 136 302 6 946 612 7 234 501 26 355 656 38 501 425 13 253 481 185 945 7 973 806 3 632 788 10 906 708 6 261 634December 189 595 984 6 941 542 4 853 085 26 752 846 44 306 391 13 829 426 167 976 6 317 194 5 215 243 10 729 363 6 281 669
- 27 -

Year
Period \
Partner
2012201320142015
2014 JanuaryFebruaryMarch
AprilMayJune
JulyAugustSeptember
OctoberNovemberDecember
2015 JanuaryFebruaryMarch
AprilMayJune
JulyAugustSeptember
OctoberNovemberDecember
Table 10.2: Imports Classified by Principal Countries, US$ continued
Germany Sweden Hong Kong Malawi Switzerland Mauritius Pakistan Singapore France Korea, Republic of Kenya Ireland
66 652 341 64 588 355 45 603 568 43 963 238 41 278 556 38 004 042 35 361 220 32 201 406 29 951 092 27 506 375 25 042 599 24 781 472 67 168 377 36 488 518 58 694 602 45 914 728 65 144 705 43 892 074 53 180 523 62 776 694 40 235 736 29 845 072 23 078 707 24 950 149 61 752 151 71 942 049 53 936 564 45 119 872 74 512 062 53 563 927 34 611 521 1 168 028 201 41 420 884 28 477 799 16 109 517 21 042 871 36 168 913 36 717 256 90 192 531 44 405 987 24 880 866 47 930 541 22 291 434 1 338 228 911 27 230 605 25 875 032 12 020 339 14 542 084
12 447 615 14 369 379 4 263 671 3 451 894 4 668 077 7 090 105 681 747 17 933 900 6 573 198 1 740 416 1 217 720 2 689 518 3 800 377 389 258 2 994 598 2 402 116 3 334 196 3 945 617 3 467 777 91 686 263 4 198 269 2 041 611 1 731 064 2 488 963 5 104 833 984 111 3 617 828 2 751 664 2 060 191 5 993 785 2 478 423 109 915 266 2 317 759 1 680 032 2 452 403 1 273 020
5 259 440 26 908 977 4 079 801 4 712 383 5 047 943 3 486 996 4 515 654 101 218 425 1 897 445 2 926 296 1 087 913 2 371 372 3 195 705 2 219 987 4 466 496 3 822 815 5 635 399 2 442 334 6 393 384 109 732 323 1 050 075 3 401 393 2 302 904 1 754 903 4 421 213 10 875 163 4 106 183 3 352 772 6 757 853 3 308 963 4 354 254 103 156 867 3 802 064 1 911 729 941 563 1 448 525
6 291 794 1 695 239 4 337 598 2 869 506 2 516 730 2 756 120 440 676 102 028 000 2 625 541 1 154 371 1 828 099 1 725 767 5 595 101 1 637 190 5 191 261 3 147 426 7 179 107 7 094 079 1 160 225 114 166 397 2 739 789 2 298 462 768 137 1 146 358 4 888 686 597 535 5 545 381 3 440 195 8 821 470 4 062 340 1 099 661 84 654 125 5 372 609 1 372 661 843 115 778 147
5 519 577 1 734 008 3 507 801 3 240 005 12 075 006 2 001 199 476 109 109 747 871 4 025 139 5 046 878 762 392 2 865 094 1 611 539 1 284 036 3 235 463 5 903 831 9 941 603 8 718 333 2 070 446 124 126 809 3 736 079 1 728 486 1 358 224 850 097 3 616 271 9 247 166 8 590 484 6 025 266 6 474 485 2 664 056 7 473 166 99 661 956 3 082 918 3 175 464 815 982 1 651 108
3 683 906 2 035 126 5 579 603 3 577 081 3 666 393 3 592 987 3 744 902 122 548 770 3 416 727 4 775 006 1 338 885 1 983 003 3 737 818 3 023 013 3 379 318 3 470 615 2 373 488 1 965 708 2 132 133 96 182 745 1 443 741 1 732 240 1 331 181 1 732 385 5 101 083 917 869 3 228 431 3 785 616 2 220 564 2 982 101 2 434 657 111 302 971 2 960 396 1 789 456 1 147 860 2 119 282
2 749 495 6 390 138 20 320 204 2 775 464 1 301 908 2 113 384 3 560 493 104 991 258 3 448 382 918 975 1 027 015 828 972 2 865 737 7 149 684 2 850 109 3 354 009 666 259 3 595 392 1 431 040 86 790 589 2 120 144 1 073 006 1 240 698 477 287 1 185 040 2 912 848 6 884 307 3 731 374 1 119 494 5 922 537 1 395 435 103 239 984 3 937 972 1 469 381 487 845 1 251 847
2 180 541 1 596 012 27 733 670 3 659 892 3 307 926 2 945 344 1 079 710 97 955 451 687 914 3 628 089 903 996 833 720 2 315 424 981 405 4 211 722 4 484 484 1 460 378 9 991 675 1 463 736 101 247 000 1 711 928 1 596 606 494 292 486 249 4 555 883 6 758 128 3 614 620 3 869 624 1 649 249 3 239 018 860 688 195 117 375 2 106 544 1 207 078 1 040 247 1 539 779
4 665 878 2 248 676 3 870 354 3 824 572 2 555 222 5 914 930 1 186 236 115 080 383 2 799 886 4 397 165 642 825 845 847 1 548 340 516 673 3 656 211 3 445 083 2 063 426 3 028 487 687 020 84 862 604 1 097 815 1 337 801 1 694 637 938 799 1 579 768 2 187 684 4 863 981 4 428 173 2 496 559 2 638 980 2 315 385 118 909 783 1 499 156 1 950 230 670 859 1 504 914
- 28 -

Year
Period \
Partner
2012201320142015
2014 JanuaryFebruaryMarch
AprilMayJune
JulyAugustSeptember
OctoberNovemberDecember
2015 JanuaryFebruaryMarch
AprilMayJune
JulyAugustSeptember
OctoberNovemberDecember
Table 10.2: Imports Classified by Principal Countries, US$ continued
Italy Denmark Ukraine Swaziland Netherlands Russian Federation Thailand Total Principal Countries Other Countries World
24 476 305 23 203 907 22 605 972 21 837 723 19 262 754 19 196 931 18 692 503 7 272 707 768 211 285 965 7 483 993 732 42 231 763 49 313 049 2 682 139 24 854 714 35 917 782 13 572 541 20 906 737 7 459 452 538 244 609 251 7 704 061 789 22 222 715 34 960 849 2 411 618 27 316 868 22 894 899 38 666 401 52 778 669 6 161 479 580 218 278 465 6 379 758 045 18 843 094 30 445 367 8 697 819 36 317 631 15 688 039 24 814 135 56 210 388 5 797 282 010 205 314 462 6 002 596 473
4 135 723 2 739 978 1 246 579 2 095 564 2 420 389 1 394 005 2 521 684 471 068 741 16 750 841 487 819 583 2 338 177 1 395 305 1 125 934 1 290 743 3 190 504 1 465 798 1 129 220 466 149 074 12 645 405 478 794 480 1 470 209 1 378 730 0 2 489 125 5 407 697 3 653 409 4 505 593 482 077 895 17 865 616 499 943 511
1 520 974 3 456 692 3 958 1 732 733 1 348 176 1 628 936 3 444 698 472 188 306 19 417 952 491 606 257 2 182 491 7 872 011 0 3 426 783 1 121 032 1 745 725 3 471 956 489 203 116 20 855 652 510 058 768 862 811 2 953 592 4 485 2 365 586 1 447 844 444 652 4 824 531 514 433 495 13 666 847 528 100 342
1 684 584 3 240 328 9 257 2 555 785 945 666 639 692 4 920 077 521 666 722 16 312 432 537 979 154 1 169 398 2 193 404 16 354 3 139 766 1 084 914 2 343 847 3 845 912 529 796 138 18 052 382 547 848 520 1 496 974 2 412 805 4 822 1 924 137 1 926 093 5 601 678 4 396 764 555 239 023 22 408 406 577 647 430
1 655 759 2 933 867 230 2 305 415 1 432 022 10 807 947 8 123 519 619 381 692 17 279 717 636 661 409 2 314 613 1 478 540 0 3 187 878 1 667 017 5 432 438 8 073 992 540 254 290 20 424 293 560 678 583 1 391 003 2 905 598 0 803 352 903 546 3 508 275 3 520 722 500 021 087 22 598 920 522 620 007
2 972 170 2 458 066 976 813 2 819 167 1 338 229 186 489 3 855 933 501 029 736 18 538 839 519 568 575 1 245 536 1 392 334 3 364 619 1 945 435 1 910 944 666 306 5 302 162 437 880 744 36 544 849 474 425 593 661 425 2 112 163 3 830 926 2 283 852 1 176 941 25 186 3 565 083 475 162 071 24 240 007 499 402 078
532 889 3 845 280 524 616 1 166 804 1 048 568 0 4 526 265 426 553 771 11 853 929 438 407 701 6 520 513 733 352 96 2 609 078 1 630 258 9 043 497 2 584 625 442 725 359 10 209 881 452 935 239 494 428 7 321 497 188 745 962 1 180 130 4 299 871 4 926 312 517 544 891 14 797 631 532 342 522
414 140 5 037 701 81 3 462 417 1 908 188 2 892 424 5 491 500 524 610 585 17 020 340 541 630 925 564 815 1 869 217 0 5 074 181 685 499 4 443 460 5 514 069 498 562 494 13 674 042 512 236 536
1 834 726 1 853 833 0 3 471 555 2 122 289 1 804 017 5 262 841 569 850 218 13 849 641 583 699 859
1 936 703 981 678 329 3 350 187 1 025 887 183 224 5 469 499 497 522 190 18 311 887 515 834 076 737 770 1 815 502 152 4 329 466 489 923 1 268 687 6 300 687 434 207 939 14 996 837 449 204 776 927 979 1 024 744 0 5 059 528 1 171 182 976 3 411 413 471 632 012 11 276 580 482 908 592
- 29 -

Table 10.3 Domestic Exports Classified by HS Chapters in US$
Year Period \ HS01:Live
animals.
02:Meat and edible meat
offal.
03:Fish and crustaceans,
mollusc and other aquatic
invertebrates
04:Dairy produce; bird's eggs; natural honey;
edible products of animal origin, not elsewhere specified or included
05:Products of animal
origin, not elsewhere
specified or included
06:Live trees and other plants, bulbs, roots, and the like;
cut flowers and ornamental foliage
07:Edible vegetables and
certain root and tubers
08:Edible fruits and nuts; peel of
citrus fruit or melon
09:Coffee, tea, mate and
spices 10:Cereals
11:Products of the milling industry; malt; starches;
inulin; wheat gluten
2012 1 997 371 1 157 376 6 598 135 3 742 185 107 801 114 709 1 073 052 7 195 992 21 418 710 2 241 249 109 6032013 2 168 276 474 402 8 773 101 2 006 530 137 324 573 485 1 395 866 11 289 617 23 643 018 2 138 060 513 6092014 2 970 036 652 157 15 299 399 949 682 51 354 3 533 706 4 000 114 13 349 085 22 164 580 1 218 699 1 536 7582015 3 892 232 250 740 12 518 211 419 638 89 906 3 509 273 3 515 169 16 203 568 23 202 517 1 905 633 5 577 387
2014 January 261 071 64 040 1 132 259 1 680 0 606 773 52 146 2 660 2 850 981 24 262 0February 206 788 76 780 882 344 65 990 0 358 451 48 954 114 164 2 310 251 0 55 000March 341 459 0 1 042 796 193 360 0 375 471 1 178 941 882 919 2 542 433 980 0
April 298 449 20 700 979 179 244 704 32 155 468 945 62 288 2 763 677 2 829 614 73 787 86 653May 54 590 37 165 1 518 221 149 709 1 279 165 388 11 653 2 657 357 1 724 130 181 503 5June 243 413 56 310 1 405 470 63 419 0 188 540 236 708 2 257 682 1 564 106 5 750 1 105
July 155 520 85 148 1 492 345 41 052 2 217 384 597 191 205 1 866 034 1 659 134 53 220 217 603August 346 596 22 967 1 133 906 13 0 252 207 162 511 1 242 414 1 175 044 147 685 307 118September 207 909 4 060 1 563 938 0 0 182 493 251 100 917 915 1 352 791 140 689 221 724
October 339 674 63 533 1 419 165 130 938 0 69 145 932 008 72 141 1 703 046 4 211 269 942November 350 604 96 304 1 237 959 42 515 15 703 211 261 830 690 324 373 1 594 437 395 635 351 000December 163 963 125 149 1 491 818 16 303 0 270 437 41 910 247 749 858 612 190 979 26 608
2015 January 444 827 35 831 1 304 008 4 080 19 142 117 613 37 215 6 723 1 485 408 61 936 110February 306 911 0 1 471 310 0 0 426 078 79 922 916 573 2 867 823 41 107 155March 508 051 0 1 564 642 55 843 0 1 060 352 267 697 1 804 619 2 740 076 40 322 90 592
April 301 339 47 219 996 207 58 268 0 319 318 431 910 2 333 576 2 342 812 1 177 269 365May 255 009 0 866 111 36 960 21 853 414 717 17 787 1 976 553 2 019 195 228 145 924 208June 219 171 6 628 1 164 526 27 720 0 321 976 57 922 3 924 380 2 673 449 583 328 724 266
July 731 213 73 008 1 210 737 14 321 0 370 462 1 185 737 1 405 903 1 973 024 32 504 135 889August 266 884 8 498 711 617 29 517 0 137 308 304 385 1 420 510 1 521 093 21 237 815 930September 319 224 0 954 165 101 101 0 50 403 477 929 1 688 053 1 610 354 17 150 1 967 504
October 245 333 4 620 719 422 47 506 40 975 155 133 62 939 543 482 1 415 062 185 559 412 501November 154 951 74 938 681 270 19 900 7 787 120 783 509 897 175 379 1 675 321 208 783 194 457December 139 318 0 874 196 24 422 150 15 130 81 831 7 816 878 900 484 385 42 410
- 30 -

Year Period \ HS
2012201320142015
2014 JanuaryFebruaryMarch
AprilMayJune
JulyAugustSeptember
OctoberNovemberDecember
2015 JanuaryFebruaryMarch
AprilMayJune
JulyAugustSeptember
OctoberNovemberDecember
Table 10.3 Domestic Exports Classified by HS Chapters in US$ continued
12:Oil seeds and oleaginous fruits;
miscellaneous grains, seeds and fruit; industrial or medicinal plants; straw
and fodder
13:Lac; gums, resins and other vegetable saps
and extracts
14:Vegetable plaiting materials; vegetable
products not elsewhere specified or included
15:Animal or vegetable fats and
oils and their cleavage products;
prepared edible fats, animal or vegetable
waxes.
16:Preparations of meats, of fish
or of crustaceans,
mollusc or other aquatic
invertebrates
17:Sugar and sugar
confectionery
18:Cocoa and cocoa
preparations
19:Preparations of cereals, flour, starch or milk;
pastrycooks' products
20:Preparation of vegetables, fruit,
nuts or other parts of plants
21:Miscellaneous edible
preparations
22:Beverages, spirits and
vinegar
5 471 882 11 880 4 985 407 6 986 514 294 599 106 654 758 147 585 2 167 369 3 079 210 2 304 925 7 845 317 9 913 750 0 7 728 702 3 812 628 187 555 93 597 662 10 609 2 774 492 5 637 319 2 825 329 11 746 775 5 176 906 9 040 5 242 488 2 814 621 155 826 153 076 753 24 314 3 301 390 3 309 859 1 285 573 4 427 656 6 857 398 0 2 926 825 1 221 764 64 392 101 755 431 92 396 2 745 884 4 906 422 954 518 4 053 118
225 514 0 0 265 947 20 000 12 292 808 0 415 257 68 790 296 466 713 509 51 633 9 040 15 763 66 918 20 773 20 834 219 1 000 150 273 402 030 159 171 427 626
156 334 0 0 1 080 240 7 500 7 136 642 10 446 169 513 595 994 71 916 330 923
227 457 0 0 259 387 0 69 995 0 405 055 461 603 11 536 401 119 200 535 0 0 59 391 15 853 10 540 613 10 192 594 254 749 87 152 211 718 809 295 0 0 162 064 0 22 078 854 500 408 533 57 568 11 608 313 510
202 820 0 2 358 446 189 259 10 000 15 710 499 360 132 180 202 821 100 420 461 750 1 695 995 0 1 070 891 163 191 19 200 13 878 755 145 218 169 283 688 102 895 349 917 238 611 0 1 012 730 186 511 15 000 9 028 115 1 400 173 927 246 976 75 101 291 813
209 535 0 741 668 118 090 31 500 12 573 934 2 165 355 209 274 684 138 165 248 162 744 457 0 42 990 196 887 10 000 10 801 453 3 888 402 200 231 796 104 357 354 318 414 721 0 0 66 734 6 000 18 130 867 4 400 278 480 229 159 126 787 323 289
77 664 0 0 186 605 0 17 228 444 36 453 185 662 199 107 56 600 164 496 128 539 0 0 366 901 10 500 3 507 247 0 239 146 590 385 91 804 221 495
1 636 328 0 1 13 156 11 700 587 269 75 462 882 836 383 22 127 380 758
415 956 0 0 0 52 1 930 692 40 113 776 524 976 126 199 357 231 993 793 0 161 325 64 077 12 000 9 276 098 0 357 066 537 905 103 246 232 874 396 759 0 492 750 122 141 30 000 13 046 441 51 009 303 934 219 358 115 114 374 761
1 604 826 0 190 476 143 017 0 19 514 267 0 223 769 479 288 87 952 414 924 109 913 0 487 200 91 845 0 14 419 444 0 60 056 231 125 137 078 291 005 781 309 0 487 200 224 661 140 14 403 173 0 230 071 273 141 132 267 474 244
139 747 0 779 520 9 360 0 7 102 662 0 88 450 343 459 1 398 244 087 161 737 0 328 353 0 0 507 872 800 296 285 289 398 7 894 424 137 410 827 0 0 0 0 231 822 4 019 184 786 381 897 72 840 473 106
- 31 -

Year Period \ HS
2012201320142015
2014 JanuaryFebruaryMarch
AprilMayJune
JulyAugustSeptember
OctoberNovemberDecember
2015 JanuaryFebruaryMarch
AprilMayJune
JulyAugustSeptember
OctoberNovemberDecember
Table 10.3 Domestic Exports Classified by HS Chapters in US$ continued
23:Residues and waste from
the food industries;
prepared animal fodder.
24:Tobacco and manufactured
tobacco substitutes
25:Salt, sulphur; earths and
stone; plastering materials, lirne
and cement26:Ores, slag
and ash
27:Mineral fuels, mineral oils and products of their
distillation; bituminous substances; mineral
waxes
28:Inorganic chemicals; organic or inorganic
compounds of precious metals, of rare earth
metals, of radioactive elements or isotopes
29:Organic chemicals
30:Pharmaceutical
products 31:Fertilisers
32:Tanning or dyeing extracts; tannin and their derivatives;
dyes pigments and other colouring matter; paints and
varnishes; putty and other mastic; inks
18 115 700 826 568 794 46 156 241 367 276 604 37 710 382 572 082 126 639 2 549 484 1 564 145 1 905 141 11 889 440 908 142 030 55 830 638 337 048 199 33 146 693 1 174 179 359 886 1 983 387 7 740 438 1 626 936 8 047 672 839 555 289 62 357 111 361 251 838 13 755 282 2 086 869 256 727 2 350 274 2 011 355 2 228 497 4 795 969 893 562 748 58 261 338 221 635 862 41 532 259 2 165 815 1 359 261 2 403 376 4 487 310 2 411 485
150 710 60 883 646 3 118 349 30 355 001 636 791 76 314 86 092 169 029 0 137 211 552 700 25 867 507 4 957 820 20 646 087 438 424 115 310 2 544 112 763 0 208 252 535 441 10 940 604 4 188 423 27 486 820 87 674 133 548 26 056 184 215 0 100 049
948 595 19 293 937 4 203 514 27 751 285 587 476 235 933 9 727 98 925 712 560 253 274 446 769 31 507 433 3 589 994 31 441 739 901 182 267 887 18 599 138 097 14 040 271 842 363 084 55 006 131 5 776 577 32 814 704 1 288 557 162 041 41 628 112 842 0 310 280
734 518 54 505 043 7 768 364 32 547 812 1 549 796 106 976 17 181 303 098 28 080 262 000 413 764 83 699 985 5 353 241 32 774 523 1 944 429 118 776 19 028 245 645 288 058 85 286
1 130 519 63 526 786 4 914 267 35 325 916 1 194 406 148 127 13 731 475 661 122 080 140 803
1 205 516 154 017 481 7 070 426 34 200 665 1 645 528 282 112 17 666 183 605 214 621 178 688 1 055 176 236 337 926 6 293 330 25 352 241 1 717 079 357 920 2 147 447 242 136 138 956 510 880 43 968 810 5 122 805 30 555 045 1 763 940 81 926 4 473 178 947 389 780 141 857
335 660 88 973 992 3 780 742 26 103 071 1 595 045 366 123 4 482 40 882 1 159 590 317 854 798 305 119 463 130 4 318 544 24 527 338 1 196 409 74 468 11 354 408 278 234 910 107 941 781 900 15 480 434 5 064 196 30 446 421 3 161 874 264 443 9 537 102 198 50 201 914
552 510 11 349 319 4 638 655 27 501 507 3 102 105 95 910 2 123 269 145 120 210 161 314 358 650 15 618 337 2 758 683 12 872 850 3 964 849 132 004 5 864 79 398 37 440 502 711 609 186 27 115 701 5 305 758 19 890 472 5 589 012 191 673 124 504 281 460 3 150 87 886
159 736 48 132 840 5 450 520 14 733 013 8 058 078 191 629 392 627 258 167 293 550 166 878 67 420 60 583 926 5 552 217 12 634 722 7 454 915 114 428 4 925 69 977 113 670 160 631
334 390 52 752 512 3 675 522 13 928 819 1 722 958 164 762 127 991 452 752 1 843 110 272 161
325 288 89 049 138 5 843 310 11 615 441 1 325 292 151 073 151 242 84 595 410 712 198 725 413 200 288 778 530 5 229 209 13 273 510 2 363 021 263 985 76 200 208 545 126 468 113 380 59 725 76 264 887 6 643 981 14 108 698 1 998 701 155 316 448 411 147 978 144 450 120 089
- 32 -

Year Period \ HS
2012201320142015
2014 JanuaryFebruaryMarch
AprilMayJune
JulyAugustSeptember
OctoberNovemberDecember
2015 JanuaryFebruaryMarch
AprilMayJune
JulyAugustSeptember
OctoberNovemberDecember
Table 10.3 Domestic Exports Classified by HS Chapters in US$ continued
33:Essential oils and resinoid;
perfumery, cosmetic or toilet
preparations
34:Soap, organic surface active agents, washing and lubricating prep., artificial
or prepared waxes, polishing or scouring prep., candles and similar, modelling pastes, dental waxes and
prep. with basis of plaster
35:Albuminoidal substances;
modified starches; glues;
enzymes
36:Explosives; pyrotechnic
products; matches; pyrophoric alloys;
certain combustible preparations
37:Photographic and
cinematographic goods
38:Miscellaneous chemical
products
39:Plastics and articles
thereof
40:Rubber and articles
thereof
41:Raw hides and skins (other
then furskins) and leather
42:Articles of leather; saddlery and harness;
travel goods, handbags and similar containers;
articles of animal gut (other than silk-worn gut)
567 982 731 392 39 246 44 290 5 980 2 367 929 4 879 685 9 253 608 32 012 354 590 775 835 169 1 360 047 92 647 11 050 0 1 768 152 7 469 671 7 052 880 35 690 850 484 662 685 004 305 153 54 076 352 675 2 411 3 592 470 7 300 618 4 054 124 37 927 784 359 186 858 768 44 024 18 948 521 350 900 2 300 147 5 559 685 1 615 572 11 059 651 210 923
79 310 146 860 6 842 0 0 191 480 568 586 198 259 7 630 934 3 795 14 343 34 3 418 0 0 196 493 509 144 554 221 1 302 418 1 826 1 263 207 0 182 400 0 114 695 827 174 580 155 3 290 488 4 631
51 214 143 714 1 087 65 655 0 341 151 353 214 217 534 549 638 75 679 4 561 10 558 4 161 0 0 643 380 366 134 748 736 2 410 147 0
55 734 36 1 392 0 0 464 293 453 546 320 815 1 910 083 3 886
7 130 1 199 5 200 24 610 0 420 549 431 558 390 293 695 630 7 534 133 389 135 15 174 0 2 411 581 299 561 635 308 967 734 147 81 608 47 280 60 5 570 0 0 207 090 647 532 198 842 2 468 778 27 110
64 728 1 089 2 406 40 445 0 214 876 1 235 728 113 760 4 365 003 16 490 135 154 1 070 3 802 0 0 143 040 641 970 233 375 7 491 412 46 964 90 898 192 5 024 39 565 0 74 125 704 396 189 166 5 079 104 89 663
42 586 691 1 021 52 614 0 209 647 480 681 40 125 393 126 5 139 27 089 4 529 3 884 100 800 0 408 989 436 687 284 424 591 463 15 603 32 869 1 099 5 885 21 736 0 67 650 327 256 16 313 1 706 394 6 423
27 401 54 2 476 114 175 0 243 161 302 727 18 573 1 007 110 7 242 46 179 559 0 0 0 258 278 590 889 79 618 975 361 5 064
107 231 98 0 2 020 0 517 780 284 134 472 060 1 290 959 9 748
39 718 0 779 0 0 133 818 659 116 187 888 1 055 589 18 070 74 685 5 418 0 0 187 118 583 937 217 030 447 485 17 706
250 953 15 027 50 53 005 900 200 548 643 054 114 065 621 922 6 359
121 162 0 849 59 000 0 30 537 368 048 4 805 624 250 39 446 42 458 27 122 59 000 0 39 864 432 409 26 306 1 359 978 38 897 46 438 21 936 3 466 59 000 0 2 756 450 748 154 367 986 014 41 225
- 33 -

Year Period \ HS
2012201320142015
2014 JanuaryFebruaryMarch
AprilMayJune
JulyAugustSeptember
OctoberNovemberDecember
2015 JanuaryFebruaryMarch
AprilMayJune
JulyAugustSeptember
OctoberNovemberDecember
Table 10.3 Domestic Exports Classified by HS Chapters in US$ continued
43:Furskins and artificial
fur; manufactures
thereof
44:Wood and articles of wood;
wood charcoal
45:Cork and articles of
cork
46:Manufactures of straw, of esparto or
of other plaiting materials;
basketware and wickerwork
47:Pulp of wood or of other fibrous
cellulosic material; waste and scrap of
paper or paperboard
48:Paper or paperboard;
articles of paper pulp, of paper or
paperboard
49:Printed books, newspapers, pictures and other products of the printing industry;
manuscripts, typescripts and plans 50:Silk
51:Wool, fine and coarse animal hair,
horsehair yarn and woven
fabric 52:Cotton
53:Other vegetable
textile fibres; paper yarn and
woven fabrics of paper yarn
54:Man-made
filaments
85 773 28 193 040 0 13 049 554 816 10 248 447 106 046 0 21 233 226 238 936 20 887 20 572 26 929 347 0 8 041 703 074 12 631 103 115 876 0 578 119 347 701 0 43 970 33 822 25 159 168 0 850 929 936 11 694 144 170 400 8 7 106 79 414 154 37 800 214 719 10 669 30 980 511 26 402 6 274 1 708 636 11 368 701 151 121 5 108 60 59 107 581 0 192 403
996 1 788 627 0 42 63 690 499 494 15 170 0 0 725 043 0 19 826 1 560 1 479 699 0 42 49 074 645 332 3 347 0 0 1 211 143 0 20 332
0 1 676 655 0 18 91 181 802 028 22 937 0 0 1 815 053 0 19 524
2 048 1 803 244 0 136 84 709 938 330 8 385 8 7 105 1 628 962 0 9 157 0 2 419 159 0 334 70 414 745 258 11 241 0 0 589 569 0 1 030 1 2 176 038 0 0 85 581 1 181 428 27 813 0 0 3 267 790 0 16 738
1 500 3 011 022 0 65 87 672 1 132 010 3 370 0 0 15 472 370 37 800 9 844 3 048 2 192 840 0 0 73 366 1 395 298 7 151 0 1 21 707 431 0 34 575 688 2 376 099 0 0 67 008 1 098 906 11 851 0 0 12 382 221 0 30 366
15 041 2 744 810 0 213 102 227 1 281 139 9 303 0 0 9 245 942 0 29 265 2 613 1 834 286 0 0 82 061 1 264 129 43 978 0 0 6 363 611 0 22 206 6 327 1 656 689 0 0 72 954 710 791 5 855 0 0 5 005 020 0 1 856
0 1 488 834 0 0 103 881 437 327 4 240 0 0 2 323 963 0 15 328 1 200 1 704 056 0 0 106 746 619 641 1 680 0 0 2 425 667 0 10 594
0 1 834 012 0 0 105 547 810 922 7 438 0 60 2 529 861 0 11 656
1 032 1 905 253 0 0 84 603 700 210 19 124 0 0 3 515 323 0 19 471 0 1 850 718 0 264 84 178 962 150 5 140 5 108 0 1 375 287 0 17 093
1 178 2 198 985 0 20 99 330 820 111 18 957 0 0 1 897 000 0 15 057
2 361 3 577 703 0 2 400 35 273 1 315 961 47 879 0 0 6 388 316 0 23 574 582 3 171 509 0 0 50 611 1 800 746 11 180 0 0 11 346 526 0 20 942
1 216 2 986 064 0 0 119 340 1 113 221 5 087 0 0 9 130 913 0 19 870
264 4 148 585 9 592 0 55 976 1 158 394 16 737 0 0 8 676 962 0 21 481 0 3 640 513 16 810 0 68 843 985 282 10 679 0 0 4 169 446 0 14 066
2 837 2 474 278 0 3 590 794 308 644 737 2 980 0 0 5 328 316 0 3 270
- 34 -

Year Period \ HS
2012201320142015
2014 JanuaryFebruaryMarch
AprilMayJune
JulyAugustSeptember
OctoberNovemberDecember
2015 JanuaryFebruaryMarch
AprilMayJune
JulyAugustSeptember
OctoberNovemberDecember
Table 10.3 Domestic Exports Classified by HS Chapters in US$ continued
55:Man-made staple fibres
56:Wadding felts and non wovens;
special yarn; twine, cordage, ropes and cables and articles
thereof
57:Carpets and other
textile floor covering
58:Special woven fabrics;
tufted textile fabrics; lace;
tapestries;trimmings;
embroidery
59:Impregnated, coated, covered or
laminated textile fabrics; textile articles
of a kind suitable for industrial use
60:Knitted or crocheted
fabrics
61:Articles of apparel and
clothing accessories,
knitted or crocheted
62:Articles of apparel and
clothing accessories, not
knitted or crocheted
63:Other made up textile articles;
sets; worn clothing and worn
textile articles;rags
64:Footwear, gaiters and the
like; parts of such articles
65:Headgear and parts
thereof
268 305 1 811 981 77 900 192 132 2 026 31 708 399 466 2 285 499 2 631 501 2 388 266 258 090 22 713 1 580 749 230 118 904 10 556 139 550 203 033 2 730 593 2 236 125 1 932 995 254 338 76 973 2 308 720 195 4 653 28 574 442 320 341 570 3 280 220 1 825 265 1 657 009 87 568 43 873 2 306 132 2 130 11 795 34 269 1 229 747 495 736 6 772 052 2 832 585 2 011 263 92 939
0 319 225 0 0 1 999 28 600 1 734 282 814 77 152 70 706 9 534 0 195 763 0 0 0 51 192 17 060 133 434 87 795 182 768 0
855 129 211 105 1 36 45 090 11 294 322 117 45 426 410 785 8 240
25 565 306 402 90 334 0 40 946 4 516 201 517 135 367 119 882 1 194 1 337 225 689 0 2 556 3 742 0 54 314 151 372 101 365 2 985 345
0 229 200 0 0 5 386 0 21 545 246 873 259 844 180 900 0
0 152 456 0 250 3 300 23 894 140 583 325 339 370 158 211 127 2 832 0 24 916 0 660 6 770 55 647 22 264 150 928 322 507 15 698 580
25 705 292 157 0 852 0 62 317 38 540 248 647 165 020 32 671 6 672
0 30 410 0 0 4 000 76 588 10 725 425 554 62 774 250 160 27 320 0 250 532 0 0 3 341 58 046 5 968 279 832 72 269 113 015 14 697
23 511 152 759 0 0 0 0 13 028 511 793 125 590 66 314 16 153
0 110 285 0 0 0 739 127 2 240 36 122 346 685 5 683 269 5 467 212 297 0 0 9 273 76 331 6 092 611 441 159 287 104 279 26 397 8 031 273 139 0 400 1 787 78 274 35 489 735 834 180 867 133 488 8 940
0 116 833 2 005 0 0 3 500 126 625 440 883 222 468 105 722 6 362 3 330 183 718 0 0 6 700 143 815 2 415 493 441 161 447 87 284 5 266 2 253 170 659 0 0 826 62 868 27 532 566 198 81 480 106 253 11 332
2 250 271 874 0 1 781 200 2 500 106 571 803 741 559 774 98 498 7 720 2 250 117 142 0 0 0 67 404 15 743 574 044 350 207 72 976 814
0 77 423 100 4 339 15 382 53 923 7 841 929 333 258 751 839 792 478
1 125 197 157 0 1 550 100 2 000 43 174 605 199 185 327 0 8 005 0 274 934 25 1 550 0 5 37 314 632 410 143 797 87 326 15 637
19 167 300 670 0 2 175 0 0 84 698 343 406 182 494 369 963 1 722
- 35 -

Year Period \ HS
2012201320142015
2014 JanuaryFebruaryMarch
AprilMayJune
JulyAugustSeptember
OctoberNovemberDecember
2015 JanuaryFebruaryMarch
AprilMayJune
JulyAugustSeptember
OctoberNovemberDecember
Table 10.3 Domestic Exports Classified by HS Chapters in US$ continued
66:Umbrellas, sun umbrellas, walking-sticks,
seat sticks, whips, riding
crops and parts thereof
67:Prepared feathers and down and articles made
of feathers or of down; artificial
flowers; articles of human hair
68:Articles of stone, plaster,
cement, asbestos, mica
or similar materials
69:Ceramic products
70:Glass and glassware
71:Natural or cultured pearls, precious or semi-
precious stones, precious metals, metals clad with
precious metal and articles thereof; imitation jewellery;
coin72:Iron and
steel73:Articles of
iron or steel74:Copper and articles thereof
75:Nickel and articles thereof
76:Aluminium and articles
thereof
78:Lead and articles thereof
80 2 063 822 1 816 856 541 074 191 160 1 436 312 037 134 154 528 8 878 078 4 088 733 352 474 808 627 362 0 2 400 632 2 340 493 660 310 634 417 969 571 141 159 384 134 11 768 679 4 523 886 411 246 397 834 472 680 877
10 2 039 542 1 043 712 541 164 372 839 905 000 241 282 865 246 10 613 143 5 081 917 4 295 427 618 478 1 994 386 290 1 919 900 516 616 586 498 514 466 846 017 163 164 892 668 7 017 748 3 657 410 22 173 687 6 260 556 2 141 663
0 168 261 66 178 62 559 24 111 113 867 665 25 885 697 866 898 20 0 17 308 100 554 0 149 150 56 481 9 726 7 256 68 964 568 25 119 128 671 579 10 950 4 140 245 26 512 101 824
10 275 504 132 274 38 371 21 770 48 592 360 28 160 813 2 157 719 44 643 0 58 833 54 739
0 150 274 60 974 65 767 22 913 71 101 083 23 347 701 657 078 723 238 0 16 709 110 304 0 44 465 149 868 72 866 20 966 60 112 766 12 525 907 555 257 226 253 0 88 151 227 052 0 174 164 108 565 24 715 35 583 60 624 392 25 141 143 1 227 741 353 784 0 37 669 109 449
0 180 952 171 946 39 659 30 323 85 500 181 24 499 629 622 051 871 563 0 36 263 270 685 0 101 891 49 622 65 085 19 047 106 453 177 25 544 612 897 797 209 757 0 70 657 229 873 0 158 757 1 735 27 688 50 074 54 413 493 22 150 512 907 485 296 402 0 56 649 180 334
0 247 221 148 101 82 443 61 231 90 429 879 26 919 287 731 342 307 033 0 61 491 165 215 0 388 903 93 121 28 972 41 632 69 110 460 22 060 181 784 216 321 654 0 105 267 444 358 0 0 4 846 23 313 37 933 75 830 217 21 510 636 533 981 1 716 619 155 182 42 969 0
0 87 210 26 494 29 087 31 373 70 905 250 15 799 898 348 779 122 574 22 166 328 14 929 141 012 0 127 165 13 650 70 631 126 027 68 021 881 15 460 530 424 131 538 214 0 35 906 232 597
70 240 828 20 205 18 262 18 017 87 015 053 13 229 356 1 874 293 317 953 0 181 546 81 473
215 137 798 116 340 43 887 21 053 97 433 834 14 057 997 231 648 108 729 0 315 670 136 313 0 99 846 41 929 13 514 62 929 54 521 106 13 213 643 619 604 142 276 0 170 397 336 555 0 128 335 14 152 83 131 21 670 73 759 635 17 349 311 682 486 195 404 0 179 285 133 151
0 141 635 62 136 66 408 23 963 78 030 273 14 266 070 570 548 50 541 7 359 266 278 0 0 146 111 21 537 68 828 20 949 9 686 516 14 368 857 548 444 153 108 0 151 528 454 786 0 45 082 12 687 60 032 33 892 84 084 239 14 338 599 460 744 89 521 0 298 709 39 926
5 358 650 166 765 56 698 57 551 73 549 146 13 037 543 389 606 1 517 543 0 1 259 267 247 824 0 307 530 19 627 30 256 56 047 64 431 799 8 724 104 656 366 159 401 0 705 669 252 635 0 99 710 1 094 45 764 40 995 84 578 431 11 046 761 211 097 262 146 0 2 681 372 85 390
- 36 -

Year Period \ HS
2012201320142015
2014 JanuaryFebruaryMarch
AprilMayJune
JulyAugustSeptember
OctoberNovemberDecember
2015 JanuaryFebruaryMarch
AprilMayJune
JulyAugustSeptember
OctoberNovemberDecember
Table 10.3 Domestic Exports Classified by HS Chapters in US$ continued
79:Zinc and articles thereof
80:Tin and articles thereof
81:Other base metals;
cements; articles thereof
82:Tools, implements,
cutlery, spoons and forks, of base metal;
parts thereof of base metal
83:Miscellaneous articles
of base metal
84:Nuclear reactors,
boilers, machinery and
mechanical appliances;
parts thereof
85:Electrical machinery and equipment and parts thereof;
sound recorders and reproducers, television image
and sound recorders and reproducers, and parts and accessories of such articles
86:Railway or tramway locomotives, rolling-stock and
parts thereof; railway or tramway track fixtures and
fittings and parts thereof; mechanical (incl. electro-
mechanical) traffic signalling equipment of all kinds
87:Vehicles others than
railway or tramway rolling-stock, and parts and accessories
thereof
88:Aircraft, spacecraft and
parts thereof
89:Ships, boats and
floating structures
4 607 2 677 1 195 851 561 349 16 171 610 11 662 575 47 602 4 564 647 15 058 769 327 848 202 247 33 822 31 026 772 380 715 844 16 342 831 8 975 542 23 093 5 581 404 14 921 191 376 795
0 0 3 070 484 473 284 588 904 19 188 042 11 915 761 429 110 3 919 698 7 216 047 279 451 0 0 5 600 150 237 237 128 11 478 659 10 677 758 140 753 3 377 693 4 957 931 363 941
0 0 43 200 17 070 0 666 712 532 124 3 483 171 939 0 41 758 0 0 0 12 721 18 365 1 387 300 813 352 2 000 498 081 8 250 0 0 0 52 800 48 301 15 012 1 742 287 341 609 600 136 761 0 7 999
0 0 480 000 21 333 14 104 1 089 247 1 873 130 6 000 260 338 162 367 9 000 0 0 821 545 14 275 19 972 948 316 629 676 0 365 448 1 654 700 23 200 0 0 438 772 4 802 93 615 2 559 676 1 122 063 13 553 349 849 1 694 000 17 729
0 0 512 967 95 896 7 753 2 418 889 577 545 9 350 492 927 184 577 14 740 0 0 290 700 65 966 83 240 1 459 677 1 415 618 146 985 331 872 445 000 146 259 0 0 205 500 33 441 41 320 1 127 091 1 508 238 44 340 294 587 1 514 400 0
0 0 225 000 50 428 92 839 1 908 539 1 085 215 198 144 361 913 1 171 303 0 0 0 0 80 252 102 489 1 654 507 932 591 4 655 279 110 255 000 11 000 0 0 0 28 797 100 195 2 225 801 1 084 600 0 376 874 126 450 7 765
0 0 0 5 691 3 587 595 288 841 171 0 224 319 13 677 2 300 0 0 0 13 556 5 865 478 865 1 756 047 0 182 628 1 400 10 500 0 0 0 1 555 6 974 904 176 784 954 21 836 195 637 1 605 000 6 000
0 0 0 19 015 29 235 792 374 642 222 0 208 992 5 300 19 600 0 0 0 12 516 110 753 1 058 373 868 164 0 225 386 34 000 0 0 0 0 30 349 1 854 630 154 1 548 508 6 000 156 356 1 533 619 11 250
0 0 0 9 683 1 658 1 477 551 1 008 810 0 351 486 125 804 12 690 0 0 0 1 100 13 994 866 173 936 637 621 227 525 65 901 18 675 0 0 5 600 1 151 4 048 809 962 724 520 1 960 408 328 1 373 965 222 668
0 0 0 4 031 50 920 1 463 804 765 286 0 529 915 128 992 38 460 0 0 0 39 766 5 960 1 045 200 195 228 21 895 133 907 70 074 0 0 0 0 11 824 2 278 1 356 740 606 210 88 441 533 216 200 21 798
- 37 -

Year Period \ HS
2012201320142015
2014 JanuaryFebruaryMarch
AprilMayJune
JulyAugustSeptember
OctoberNovemberDecember
2015 JanuaryFebruaryMarch
AprilMayJune
JulyAugustSeptember
OctoberNovemberDecember
Table 10.3 Domestic Exports Classified by HS Chapters in US$ continued
90:Optical, photographic, cinematographic, measuring,
checking, precision, medical or surgical instruments and
apparatus; parts and accessories thereof
91:Clocks and
watches and parts
thereof
92:Musical instruments;
parts and accessories
of such articles
93:Arms and ammunition;
parts and accessories
thereof
94:Furniture; bedding, mattresses, mattress supports, cushions and
similar stuffed furnishing; lamps and lighting fittings, NES or incl.;
illuminated signs or name-plates and the like; prefabricated buildings
95:Toys, games and
sports requisites; parts and
accessories thereof
96:Miscellaneous
manufactured articles
97:Works of art, collectors'
pieces and antiques
98:Other personnal
effects99:Migrants' effects All Products
620 515 53 9 489 300 10 533 898 481 201 683 056 13 211 478 112 775 0 3 837 939 047 637 253 719 120 325 2 000 12 263 255 693 856 667 477 15 057 034 238 932 42 967 3 415 830 544 617 108 158 300 4 730 11 801 063 861 532 565 958 12 541 146 159 499 124 969 3 009 022 932 681 591 3 725 3 325 13 322 7 673 065 727 874 411 318 13 390 922 161 611 1 033 671 2 682 046 588
38 512 0 0 0 1 427 590 58 010 174 315 566 298 530 8 095 272 446 906 75 792 0 0 0 555 075 61 915 335 857 693 3 229 5 704 189 376 242 28 376 138 0 0 1 015 216 59 544 91 434 1 142 229 1 170 3 158 154 425 938
61 830 20 0 580 1 061 284 67 178 793 1 134 450 20 640 298 173 426 948 47 069 0 300 0 1 292 205 71 856 43 680 1 102 329 13 870 19 896 176 321 470 15 434 0 0 1 500 853 255 74 239 1 637 913 429 0 6 528 232 646 488
127 261 0 0 0 2 010 440 137 680 26 665 1 025 549 300 16 126 266 190 706 2 588 0 0 0 1 173 054 75 685 7 369 973 106 2 866 13 633 316 223 627
73 804 0 0 0 427 393 85 403 56 161 966 988 21 338 10 942 228 201 160
28 844 0 0 0 745 030 24 74 394 1 193 858 17 041 13 341 365 402 375 85 119 0 0 0 566 772 89 415 35 770 1 817 710 7 815 14 959 408 408 332 32 479 0 0 2 650 673 751 80 582 53 405 847 509 70 700 12 289 225 952 742
82 700 0 0 0 233 303 3 27 199 742 600 16 172 7230 263 637 149 23 117 200 0 0 817 747 69 064 21 165 862 410 1 550 7672 259 663 008 66 107 0 0 3 842 760 149 70 040 70 194 1 480 178 2 107 955538 186 468 557
29 170 0 2 200 0 367 760 97 310 36 062 951 789 2 773 6339 183 168 868 155 809 0 0 0 493 967 85 143 14 506 735 724 10 594 0 135 199 747 48 199 0 0 1 392 389 923 118 161 37 943 1 551 267 28 681 8986 191 467 704
33 745 0 200 0 862 074 103 850 100 788 1 110 824 6 460 8735 221 671 275 95 804 3 525 0 300 1 288 123 123 610 1 236 1 015 589 3 870 7639 157 243 526
105 882 0 925 0 1 185 363 411 594 1 074 593 54 008 6966 222 380 399
7 190 0 0 0 480 660 59 370 42 875 1 408 795 3 833 10454 233 710 937 14 049 0 0 7 788 289 765 666 8 328 1 747 226 20 658 7809.58 407 735 436 19 820 0 0 0 504 231 246 50 430 709 927 10 905 6302 219 699 981
- 38 -

Table 10.4 Imports Classified by HS Chapters in US$
Year Period \ HS01:Live
animals.
02:Meat and edible meat
offal.
03:Fish and crustaceans, mollusc and
other aquatic invertebrates
04:Dairy produce; bird's eggs; natural
honey; edible products of animal origin, not
elsewhere specified or included
05:Products of animal
origin, not elsewhere
specified or included
06:Live trees and other plants, bulbs, roots, and the like;
cut flowers and ornamental foliage
07:Edible vegetables and certain root and
tubers
08:Edible fruits and nuts; peel of
citrus fruit or melon
09:Coffee, tea, mate
and spices 10:Cereals
11:Products of the milling industry; malt;
starches; inulin; wheat gluten
2012 6 765 292 15 507 050 20 205 477 43 718 434 2 226 985 1 669 096 16 068 994 12 663 782 4 228 188 466 237 367 72 882 1222013 6 055 890 7 700 085 24 831 004 55 929 965 2 209 138 1 148 376 15 367 724 9 765 518 4 798 562 324 924 125 45 722 0122014 6 772 296 9 345 480 23 360 380 37 102 071 2 877 787 719 179 10 391 475 8 636 254 4 887 568 331 649 255 54 845 2522015 8 262 819 7 362 361 23 675 165 28 219 900 2 855 645 620 737 10 407 251 12 096 489 4 985 774 409 869 734 57 360 514
2014 January 322 204 400 074 1 637 797 3 066 074 324 103 83 578 2 353 070 653 115 179 276 33 005 724 5 736 007February 297 279 370 664 1 477 975 2 441 870 223 415 52 787 798 337 672 798 391 643 30 817 191 4 927 926March 319 612 459 968 1 808 864 4 875 258 178 926 36 178 815 963 917 453 220 407 41 928 499 6 420 266
April 586 919 1 002 573 1 609 066 2 605 111 195 868 35 758 2 177 016 739 631 303 043 31 187 842 5 350 204May 159 830 676 865 2 031 704 3 410 141 193 423 34 982 644 344 827 768 381 065 28 507 787 4 325 955June 565 179 850 131 2 837 510 3 017 104 193 712 90 536 674 219 606 784 742 750 31 179 791 4 026 853
July 656 224 1 008 461 1 805 588 2 960 948 236 576 26 235 821 198 607 396 492 935 18 889 442 4 341 556August 721 572 1 501 233 2 156 970 3 664 464 282 571 130 182 508 876 582 043 746 167 19 993 031 3 921 232September 1 077 736 1 149 454 2 023 130 3 180 542 174 877 52 767 318 854 684 176 379 337 18 474 591 2 720 911
October 765 806 676 192 2 179 106 2 414 263 266 894 87 651 438 569 800 659 280 183 24 515 270 3 826 261November 848 750 729 297 2 018 810 2 210 864 432 343 41 276 239 936 812 154 437 949 24 188 307 4 959 833December 451 184 520 569 1 773 860 3 255 433 175 079 47 247 601 092 732 277 332 814 28 961 781 4 288 249
2015 January 304 412 428 850 1 657 068 3 124 480 122 612 13 975 540 544 524 116 357 650 29 605 348 4 597 499February 853 332 465 539 2 016 911 2 506 943 176 041 79 438 1 138 825 773 792 315 832 28 044 757 4 827 025March 624 965 726 102 1 982 334 2 505 143 272 819 75 299 562 366 1 070 355 510 578 30 785 212 5 216 063
April 507 046 1 058 279 1 952 658 2 844 614 239 694 2 665 254 316 1 199 856 334 965 28 348 572 4 654 935May 399 280 1 159 321 2 205 828 1 961 976 286 654 51 342 544 963 1 212 822 554 579 33 420 668 4 254 350June 739 529 553 236 2 111 073 2 974 473 262 211 63 408 769 032 838 053 449 699 34 359 590 4 550 028
July 1 399 532 654 703 2 249 802 2 250 003 367 469 27 266 1 227 725 1 135 597 609 494 39 457 914 5 962 197August 1 164 905 499 719 2 043 924 2 826 407 182 387 63 747 781 382 1 014 966 239 741 36 247 138 4 629 105September 391 073 491 309 2 353 858 2 291 661 196 306 111 062 1 436 554 1 143 727 529 384 38 409 073 4 434 893
October 855 649 590 231 1 833 365 1 965 715 367 739 67 683 898 918 1 145 552 484 614 45 445 207 3 879 236November 530 305 478 941 1 741 038 1 700 489 58 790 38 314 1 578 311 1 058 434 349 998 34 216 003 6 259 256December 492 792 256 131 1 527 306 1 267 996 322 922 26 537 674 316 979 217 249 241 31 530 252 4 095 928
- 39 -

Year Period \ HS
2012201320142015
2014 JanuaryFebruaryMarch
AprilMayJune
JulyAugustSeptember
OctoberNovemberDecember
2015 JanuaryFebruaryMarch
AprilMayJune
JulyAugustSeptember
OctoberNovemberDecember
Table 10.4 Imports Classified by HS Chapters in US$ continued
12:Oil seeds and oleaginous fruits;
miscellaneous grains, seeds and fruit;
industrial or medicinal plants; straw and
fodder
13:Lac; gums, resins and
other vegetable saps
and extracts
14:Vegetable plaiting materials;
vegetable products not elsewhere
specified or included
15:Animal or vegetable fats and oils and their
cleavage products; prepared edible fats, animal or vegetable
waxes.
16:Preparations of meats, of fish or of
crustaceans, mollusc or other
aquatic invertebrates
17:Sugar and sugar
confectionery
18:Cocoa and cocoa
preparations
19:Preparations of cereals, flour, starch or milk;
pastrycooks' products
20:Preparation of vegetables, fruit,
nuts or other parts of plants
21:Miscellaneous edible
preparations
13 097 300 571 132 23 667 223 836 418 14 524 953 80 231 900 7 271 267 45 403 126 38 186 845 63 471 929 18 063 092 556 475 14 133 113 863 082 11 499 016 113 062 969 6 510 961 44 171 069 26 163 257 49 002 068 24 558 598 421 883 122 103 818 209 6 518 428 42 355 800 6 800 146 44 092 021 32 597 126 53 308 495 31 613 764 309 679 7 120 137 017 722 4 945 003 36 802 253 6 200 508 36 474 710 27 775 187 49 335 101
1 293 063 110 623 0 3 896 650 292 953 4 474 753 567 675 2 286 979 1 590 260 3 807 583 1 058 265 45 083 0 8 362 935 763 857 4 045 511 222 260 2 942 903 1 878 003 3 304 351 1 431 184 66 933 0 6 531 024 936 048 1 978 283 486 330 3 346 990 2 479 534 4 154 779
2 886 354 16 015 0 8 101 977 375 110 1 270 992 546 343 3 589 385 2 316 350 2 923 452 1 601 898 7 587 0 7 435 572 444 908 1 855 941 424 702 4 472 153 2 558 684 4 024 530 1 821 966 34 802 122 9 193 608 669 626 2 297 710 619 666 3 314 443 2 357 008 4 769 189
849 091 12 122 0 11 478 744 696 141 2 890 936 781 049 5 093 630 3 523 980 5 688 726 1 427 373 31 121 0 11 556 036 519 235 4 695 469 332 276 3 800 728 3 056 981 4 364 401 1 285 492 20 132 0 9 399 840 694 739 6 321 434 653 184 3 115 401 2 822 311 4 363 048
5 032 552 33 603 0 9 864 539 616 996 4 934 594 699 209 3 430 231 3 187 477 4 876 331 3 793 691 12 054 0 9 557 979 211 329 3 890 411 738 395 4 193 171 3 418 994 5 987 237 2 077 669 31 809 0 8 439 305 297 487 3 699 765 729 055 4 506 008 3 407 546 5 044 868
2 016 150 7 533 0 7 049 513 197 339 3 429 895 601 356 3 275 549 3 461 729 6 530 343 2 587 768 28 039 0 9 085 214 793 620 2 917 614 518 068 3 069 262 4 630 638 5 671 388 1 926 326 68 788 0 14 160 881 431 830 2 852 852 427 207 3 188 963 1 639 368 4 531 245
1 342 919 4 767 0 10 608 480 188 181 3 044 602 286 384 2 924 637 1 946 805 3 717 909 2 658 075 18 729 39 10 760 274 625 807 4 857 754 449 975 3 018 045 2 100 343 3 223 676 2 180 186 17 195 1 114 14 659 638 810 535 5 356 436 485 252 3 113 184 2 217 369 3 638 190
2 685 855 12 703 16 13 664 712 519 879 1 701 103 294 428 3 512 203 2 234 918 4 316 877 4 759 251 11 483 0 15 307 859 485 901 2 619 823 494 501 3 189 388 2 219 900 4 060 132 3 344 894 7 894 5 564 10 510 290 24 239 3 662 039 1 001 378 2 475 514 1 927 417 3 396 819
1 348 749 20 792 0 9 705 327 425 271 1 090 394 388 575 2 832 665 1 478 390 3 509 111 3 983 515 60 535 386 9 910 829 227 479 2 287 431 583 738 2 580 437 1 691 805 3 310 950 2 780 075 51 221 0 11 594 705 214 923 2 982 310 669 647 3 294 863 2 226 503 3 428 461
- 40 -

Year Period \ HS
2012201320142015
2014 JanuaryFebruaryMarch
AprilMayJune
JulyAugustSeptember
OctoberNovemberDecember
2015 JanuaryFebruaryMarch
AprilMayJune
JulyAugustSeptember
OctoberNovemberDecember
Table 10.4 Imports Classified by HS Chapters in US$ continued
22:Beverages, spirits and
vinegar
23:Residues and waste from the food industries; prepared
animal fodder.
24:Tobacco and manufactured
tobacco substitutes
25:Salt, sulphur; earths and stone;
plastering materials, lirne and cement
26:Ores, slag and ash
27:Mineral fuels, mineral oils and products of their
distillation; bituminous substances; mineral
waxes
28:Inorganic chemicals; organic or inorganic
compounds of precious metals, of rare earth metals,
of radioactive elements or isotopes
29:Organic chemicals
30:Pharmaceutical products 31:Fertilisers
44 128 474 59 150 384 160 648 745 41 170 548 654 993 1 532 064 346 73 365 295 31 878 100 193 755 273 330 650 271 43 071 238 134 270 152 74 191 028 25 358 141 1 671 705 1 617 409 234 66 060 213 30 134 485 220 170 933 1 077 043 118 56 313 023 62 452 452 54 479 455 29 110 844 610 985 1 567 430 493 58 422 962 35 551 914 258 328 157 269 314 285 52 220 442 55 050 773 8 382 560 25 155 801 596 091 1 583 696 643 52 763 121 28 850 455 231 398 125 169 047 420
2 466 410 5 344 261 615 091 2 125 772 24 609 120 125 855 5 424 796 2 241 884 14 315 402 18 076 846 2 636 380 5 865 634 1 400 329 2 752 886 38 229 115 129 914 4 870 823 2 001 039 49 164 041 10 887 992 2 789 019 4 317 924 716 507 2 302 719 66 730 129 661 527 3 626 873 2 044 756 23 450 062 8 827 546
4 173 557 4 786 810 273 348 1 715 832 93 689 129 513 667 4 669 848 2 039 105 14 629 174 14 945 033 4 084 382 5 085 070 2 728 655 2 004 252 13 968 138 924 116 5 498 628 3 330 030 27 566 410 8 876 174 3 979 693 4 424 889 10 416 549 3 073 587 84 113 133 397 025 4 329 122 4 711 345 21 879 572 12 941 127
4 088 469 4 747 760 12 537 705 3 030 697 2 988 127 850 785 4 790 486 3 201 148 28 967 771 18 335 347 4 072 279 6 288 402 7 600 928 2 462 715 12 357 143 321 785 5 363 219 3 328 070 8 372 913 20 470 218 6 258 997 5 082 952 9 569 090 2 392 132 16 265 111 126 253 4 173 266 3 042 051 14 363 122 81 906 685
5 838 498 5 751 332 4 677 243 2 658 516 203 515 145 202 688 4 952 724 3 144 030 31 051 619 38 559 980 8 350 563 5 534 349 2 474 225 2 434 468 53 393 148 780 032 5 586 758 3 116 184 9 167 173 23 376 131 7 574 774 5 223 069 1 469 785 2 157 269 1 131 124 396 846 5 136 420 3 352 273 15 400 898 12 111 207
4 000 665 4 247 826 795 256 2 882 773 118 905 141 461 542 3 037 155 3 142 826 43 652 067 13 384 339 3 880 959 3 629 881 861 031 2 199 299 1 168 114 862 310 4 783 907 2 928 098 21 706 366 11 816 206 4 035 841 2 912 637 399 142 2 134 839 98 920 133 973 414 4 782 598 2 198 175 23 122 969 6 930 427
3 855 505 2 504 237 740 893 1 597 280 1 749 123 534 887 4 032 950 2 224 776 11 720 599 9 893 161 4 587 963 4 246 921 460 579 1 711 316 44 360 107 847 514 4 779 935 2 182 742 7 838 195 17 377 577 4 017 800 2 753 989 836 901 1 871 107 69 467 123 462 156 5 754 974 2 735 533 29 227 090 18 039 192
4 310 173 4 528 507 1 444 066 2 384 545 31 117 730 771 4 234 817 2 616 659 35 476 093 20 253 568 7 282 349 4 896 015 1 133 251 2 291 327 29 473 122 856 500 4 989 869 2 242 541 19 267 432 22 410 787 5 235 133 4 650 202 492 211 1 591 369 60 842 217 117 267 4 288 861 2 306 493 14 039 392 9 465 292
3 072 940 6 227 259 509 913 1 913 943 26 009 133 480 183 3 605 515 1 868 337 6 497 948 10 092 800 4 183 592 7 247 961 183 731 2 085 289 72 282 104 787 347 4 776 506 2 647 724 9 549 686 13 877 999 3 757 522 7 205 340 525 586 2 492 713 72 887 142 582 752 3 696 035 1 756 553 9 300 288 15 506 071
- 41 -

Year Period \ HS
2012201320142015
2014 JanuaryFebruaryMarch
AprilMayJune
JulyAugustSeptember
OctoberNovemberDecember
2015 JanuaryFebruaryMarch
AprilMayJune
JulyAugustSeptember
OctoberNovemberDecember
Table 10.4 Imports Classified by HS Chapters in US$ continued
32:Tanning or dyeing extracts; tannin and their
derivatives; dyes pigments and other colouring matter; paints and varnishes; putty
and other mastic; inks
33:Essential oils and resinoid;
perfumery, cosmetic or toilet
preparations
34:Soap, organic surface active agents, washing and lubricating prep., artificial or prepared waxes, polishing
or scouring prep., candles and similar, modelling pastes, dental waxes and
prep. with basis of plaster
35:Albuminoidal substances;
modified starches; glues; enzymes
36:Explosives; pyrotechnic products; matches; pyrophoric
alloys; certain combustible preparations
37:Photographic and
cinematographic goods
38:Miscellaneous chemical
products39:Plastics and articles thereof
40:Rubber and articles thereof
26 802 069 72 840 545 106 668 851 9 156 919 33 122 471 8 696 520 86 308 381 206 141 988 110 185 333 26 655 303 71 744 317 114 910 933 9 464 761 32 880 135 9 599 121 87 349 929 222 613 842 99 312 257 26 621 132 71 430 316 99 896 841 10 457 187 32 106 429 9 096 617 89 784 330 222 603 240 96 831 358 24 629 809 65 503 380 95 111 293 9 331 678 30 694 411 9 323 215 100 462 459 203 351 957 82 519 304
1 553 552 4 346 087 4 108 324 597 957 1 732 693 577 545 5 046 722 14 671 450 6 084 882 1 916 941 4 620 912 4 953 083 628 996 2 026 239 765 254 4 748 969 15 024 836 7 218 395 1 677 380 5 504 258 7 992 133 769 125 3 314 442 880 866 3 843 104 17 212 093 6 717 461
1 937 177 5 121 094 8 099 838 1 026 791 2 718 254 775 507 4 862 130 16 278 757 7 724 078 2 101 078 6 086 281 7 258 860 728 024 2 850 511 742 821 6 999 318 17 583 101 8 955 832 2 442 157 6 511 346 10 095 467 1 001 213 2 671 258 746 954 8 467 194 18 883 260 9 088 124
2 208 798 6 725 708 13 088 978 1 084 797 3 254 329 758 157 8 361 785 19 439 816 8 136 587 2 547 377 6 910 814 7 924 526 1 120 752 4 870 825 665 584 7 483 520 20 003 385 8 449 249 2 448 972 6 700 185 8 151 138 607 133 1 729 335 770 896 8 694 414 18 068 271 8 926 044
2 369 628 5 597 802 9 371 600 869 559 2 112 527 853 910 10 912 415 23 040 316 7 421 207 3 275 316 7 074 394 10 148 334 1 232 906 2 145 941 914 983 10 308 931 22 132 567 10 410 705 2 142 756 6 231 434 8 704 559 789 934 2 680 076 644 137 10 055 827 20 265 388 7 698 795
1 465 676 5 583 734 5 690 712 692 343 1 139 488 604 525 5 765 051 18 265 362 9 199 175 1 734 126 5 688 642 7 555 197 777 576 2 510 571 985 397 7 677 042 15 974 353 6 378 136 2 099 634 5 863 388 8 133 858 1 393 498 4 119 895 1 015 989 8 532 701 15 888 942 8 062 758
2 195 438 3 159 072 7 822 747 657 539 3 352 359 483 841 4 952 769 14 596 852 6 660 283 1 925 634 4 345 678 7 575 125 668 531 1 572 188 879 975 5 949 293 14 973 833 5 729 643 2 155 648 2 779 498 6 613 171 770 765 1 258 640 757 899 6 781 456 15 055 772 7 544 687
2 402 101 6 723 891 8 124 987 844 530 4 843 972 1 221 436 7 726 854 16 401 689 7 357 237 2 077 925 6 970 038 8 470 834 513 004 2 236 548 492 661 15 709 841 15 916 564 5 685 746 2 279 887 5 869 182 8 092 763 653 093 2 290 895 792 406 9 066 409 16 939 167 6 033 222
2 243 596 6 156 052 8 716 582 710 039 3 211 798 725 854 11 533 242 19 626 708 7 637 634 2 208 505 6 432 963 10 170 295 875 240 1 924 986 593 541 7 406 178 19 076 449 6 220 247 1 841 638 5 931 240 8 145 023 775 521 2 233 072 769 689 9 361 622 20 636 266 6 010 536
- 42 -

Year Period \ HS
2012201320142015
2014 JanuaryFebruaryMarch
AprilMayJune
JulyAugustSeptember
OctoberNovemberDecember
2015 JanuaryFebruaryMarch
AprilMayJune
JulyAugustSeptember
OctoberNovemberDecember
Table 10.4 Imports Classified by HS Chapters in US$ continued
41:Raw hides and skins
(other then furskins) and
leather
42:Articles of leather; saddlery and harness;
travel goods, handbags and similar containers; articles
of animal gut (other than silk-worn gut)
43:Furskins and artificial fur;
manufactures thereof
44:Wood and articles of
wood; wood charcoal
45:Cork and articles of
cork
46:Manufactures of straw, of esparto or of
other plaiting materials; basketware and
wickerwork
47:Pulp of wood or of other fibrous
cellulosic material; waste and scrap of
paper or paperboard
48:Paper or paperboard;
articles of paper pulp, of paper or
paperboard
49:Printed books, newspapers, pictures and
other products of the printing industry;
manuscripts, typescripts and plans 50:Silk
2 340 826 2 912 180 367 24 381 102 33 838 76 571 816 148 130 968 507 19 323 432 60 897 2 500 326 2 807 397 503 20 162 305 11 337 104 570 995 716 114 220 719 20 068 839 38 506 1 747 385 2 606 828 1 690 20 140 655 12 204 99 536 700 631 114 358 936 18 010 313 30 645 2 587 012 2 483 906 9 738 18 782 407 5 561 57 413 840 390 97 451 148 15 157 289 15 611
128 091 214 544 0 899 721 1 098 9 014 67 351 7 890 155 1 754 871 960 39 173 155 199 263 1 203 741 190 10 783 26 144 7 188 611 1 434 362 416
257 131 154 415 110 1 661 781 137 10 212 53 789 7 811 423 1 659 944 0
92 769 126 442 85 1 735 973 95 936 130 184 8 952 964 1 403 956 1 745 121 189 216 119 318 1 756 620 3 962 3 055 19 805 9 058 681 2 771 313 2 498 181 813 192 219 188 1 858 684 172 3 359 76 975 11 383 913 1 069 515 71
162 394 231 975 0 1 870 281 79 12 018 86 716 10 758 966 1 513 121 2 963 184 487 232 532 10 1 520 586 136 3 428 28 525 10 953 450 1 014 673 0 174 699 232 372 226 1 869 388 1 713 2 535 50 620 10 095 426 1 124 406 2 520
141 340 308 157 0 1 538 436 1 372 29 001 39 328 9 638 688 1 037 782 2 027 145 835 257 265 0 2 238 742 2 067 10 554 46 763 10 743 912 1 711 152 2 403 118 465 285 589 491 1 986 700 1 184 4 639 74 431 9 882 746 1 515 219 15 044
98 343 145 716 0 882 404 3 10 881 48 130 9 533 328 1 790 476 629 96 072 286 343 1 632 1 549 914 51 4 052 90 668 6 205 376 1 149 527 0
204 305 178 104 445 1 745 473 0 5 001 52 817 8 513 895 1 196 915 58
313 003 175 713 1 586 1 292 849 697 7 345 113 758 7 180 081 1 091 161 1 398 180 645 127 966 0 1 550 421 855 439 94 157 8 392 880 1 689 610 6 213 138 852 166 686 17 1 764 307 253 5 529 76 374 8 299 753 1 005 182 410
224 609 269 227 764 2 087 534 1 794 1 220 69 932 9 150 986 1 077 435 0 223 017 182 011 2 577 1 389 195 887 1 447 49 761 11 689 709 1 153 234 0 344 330 153 597 2 717 1 482 003 925 7 046 5 605 7 981 840 2 165 653 341
343 083 276 190 0 1 516 684 0 10 218 109 879 7 479 427 651 002 3 633 173 601 276 251 0 1 990 803 77 3 285 52 411 6 615 820 986 683 797 247 152 246 103 0 1 530 820 18 951 76 899 6 408 051 1 200 409 2 132
- 43 -

Year Period \ HS
2012201320142015
2014 JanuaryFebruaryMarch
AprilMayJune
JulyAugustSeptember
OctoberNovemberDecember
2015 JanuaryFebruaryMarch
AprilMayJune
JulyAugustSeptember
OctoberNovemberDecember
Table 10.4 Imports Classified by HS Chapters in US$ continued
51:Wool, fine and coarse animal hair, horsehair
yarn and woven fabric 52:Cotton
53:Other vegetable textile fibres; paper
yarn and woven fabrics of paper
yarn54:Man-made
filaments55:Man-made
staple fibres
56:Wadding felts and non wovens;
special yarn; twine, cordage, ropes and cables and articles
thereof
57:Carpets and other
textile floor covering
58:Special woven fabrics; tufted
textile fabrics; lace; tapestries;trimming
s; embroidery
59:Impregnated, coated, covered or laminated textile fabrics; textile
articles of a kind suitable for industrial use
60:Knitted or crocheted
fabrics
61:Articles of apparel and
clothing accessories,
knitted or crocheted
61 135 10 631 128 1 906 602 14 492 057 39 522 632 8 748 893 4 700 678 2 941 394 6 244 784 3 964 672 9 717 820 84 386 13 870 718 1 176 152 13 998 370 41 469 260 8 046 856 2 931 104 2 173 172 5 670 042 2 289 436 16 013 116 40 259 5 601 023 996 673 9 819 499 36 052 197 8 543 347 2 080 593 2 600 232 5 354 122 2 271 444 12 682 034 41 528 6 667 207 715 650 6 824 402 25 573 249 2 580 071 1 366 369 1 822 435 5 062 641 1 691 557 10 804 140
1 639 407 080 91 754 826 672 3 004 786 163 806 358 505 34 386 331 111 152 890 492 420 345 727 575 148 114 998 538 2 504 587 208 825 168 699 121 552 405 383 284 294 844 506
7 188 294 386 4 649 1 180 385 1 971 878 157 412 200 928 688 454 385 123 200 166 1 248 717
1 015 254 203 141 536 597 379 1 845 999 214 678 201 011 133 119 482 484 160 618 3 293 337 893 463 586 53 290 518 951 3 463 017 201 765 33 303 262 206 362 758 231 280 599 353
11 204 437 794 78 793 655 443 2 676 678 2 500 826 246 586 230 860 414 566 125 178 502 974
2 198 316 526 27 170 1 427 842 2 867 264 153 302 73 093 152 415 360 536 248 819 858 452 284 238 428 42 435 454 203 2 761 862 3 868 289 167 477 304 180 494 691 189 125 960 494
3 097 416 705 4 193 725 699 4 413 720 302 075 148 268 187 812 602 910 204 985 1 129 383
542 435 354 19 852 1 748 978 3 833 058 301 078 215 319 210 313 608 496 204 618 817 349 970 309 545 171 959 432 121 3 219 120 342 220 45 734 145 495 366 228 169 910 1 058 245
10 883 1 299 839 212 928 253 289 3 490 227 129 073 221 669 129 439 539 835 99 562 876 804
7 716 761 983 202 871 574 378 3 012 139 125 979 58 032 131 382 575 778 250 756 632 962 7 588 315 150 85 646 630 902 2 456 350 162 525 168 824 159 605 195 681 222 933 996 503 3 063 778 051 92 683 525 215 2 698 772 343 950 53 403 374 843 434 568 131 743 1 231 893
9 923 237 732 60 558 782 391 1 323 004 148 552 73 145 105 483 310 816 84 836 1 174 288 710 287 681 24 026 298 169 1 457 874 224 118 70 631 152 111 407 896 115 051 923 292
4 527 885 997 5 363 524 789 2 840 962 309 899 193 909 197 138 385 324 255 852 943 885
2 563 941 710 13 971 743 117 1 846 770 245 090 185 828 157 387 352 543 201 653 941 404 315 543 131 10 275 624 524 1 778 566 252 932 42 548 78 731 404 655 57 239 724 401
3 767 310 778 32 032 337 327 1 184 425 273 646 130 780 119 070 373 261 61 231 670 144
1 141 526 204 7 658 1 018 948 2 705 154 167 474 149 286 107 515 462 581 147 420 1 030 469 43 679 481 45 026 370 155 2 975 180 166 130 82 819 174 591 431 033 113 222 800 868
174 399 309 135 540 394 486 1 294 054 159 775 157 163 64 578 728 504 49 620 734 032
- 44 -

Year Period \ HS
2012201320142015
2014 JanuaryFebruaryMarch
AprilMayJune
JulyAugustSeptember
OctoberNovemberDecember
2015 JanuaryFebruaryMarch
AprilMayJune
JulyAugustSeptember
OctoberNovemberDecember
Table 10.4 Imports Classified by HS Chapters in US$ continued
62:Articles of apparel and
clothing accessories, not
knitted or crocheted
63:Other made up textile articles; sets;
worn clothing and worn textile
articles;rags
64:Footwear, gaiters and the
like; parts of such articles
65:Headgear and parts
thereof
66:Umbrellas, sun umbrellas, walking-sticks, seat sticks, whips, riding crops
and parts thereof
67:Prepared feathers and down and articles made of feathers or of
down; artificial flowers; articles of
human hair
68:Articles of stone, plaster,
cement, asbestos, mica or similar
materials69:Ceramic
products70:Glass and
glassware
71:Natural or cultured pearls, precious or semi-precious
stones, precious metals, metals clad with precious metal and
articles thereof; imitation jewellery; coin
10 596 531 28 845 137 19 338 876 1 088 421 533 009 2 670 697 12 115 125 33 937 389 20 021 429 1 004 532 19 758 002 27 683 822 17 681 491 7 217 399 636 653 2 757 705 10 529 442 35 357 057 20 841 848 945 741 11 696 179 28 118 859 20 271 962 1 728 057 617 238 2 499 804 11 400 758 36 909 379 18 985 777 3 340 671
9 456 257 23 879 671 17 640 903 1 143 636 608 874 3 344 639 10 559 688 31 780 981 19 716 623 33 041 280
383 093 1 423 693 698 004 68 957 93 874 102 078 559 746 2 872 277 1 779 835 19 580 683 205 2 659 583 1 768 760 47 252 22 160 202 877 734 049 2 494 172 1 193 345 89 367
1 089 078 2 456 235 1 476 112 117 762 71 511 241 668 1 053 546 2 133 915 1 296 582 39 002
1 396 175 3 073 927 1 081 118 751 178 11 666 175 313 801 779 2 251 007 1 702 559 46 618 985 137 2 629 979 1 697 624 78 119 9 227 193 526 837 758 1 962 011 2 092 329 46 499 871 895 5 217 524 1 212 202 99 621 4 521 192 613 941 614 2 767 823 1 076 593 26 310
1 023 701 1 963 555 1 335 081 84 306 40 433 135 866 1 354 256 4 511 234 1 387 078 38 236 939 619 1 667 249 1 897 922 88 094 85 674 229 658 1 149 260 3 363 942 1 099 804 28 324
1 262 991 1 714 296 2 583 623 87 177 77 948 222 197 732 172 3 811 942 1 796 759 137 459
1 126 515 1 835 486 2 098 648 143 563 42 020 207 872 1 168 998 2 755 303 1 500 793 98 418 1 185 498 1 685 943 2 015 134 77 759 79 952 322 162 1 215 357 4 014 053 2 524 937 432 994
749 272 1 791 389 2 407 735 84 269 78 253 273 975 852 224 3 971 700 1 535 164 2 337 864
448 297 1 359 111 1 867 207 95 088 51 505 157 999 1 084 229 2 244 282 2 188 736 427 509 535 678 1 055 959 1 787 361 120 613 38 891 222 199 615 405 2 890 691 1 901 557 21 732 095
1 170 185 3 389 830 1 855 586 116 229 10 807 349 988 1 047 209 3 020 784 1 505 783 8 817 372
988 649 1 926 041 1 424 995 60 981 8 476 345 835 662 072 2 709 686 1 304 551 32 954 820 006 2 014 742 1 379 994 89 961 10 421 188 449 808 988 2 307 194 960 620 43 714 709 012 3 238 273 1 197 821 83 423 18 624 169 646 1 119 673 2 513 652 1 201 563 98 618
945 368 2 122 007 1 676 711 191 862 8 339 263 853 852 136 3 110 704 1 289 732 1 463 237 854 869 2 468 971 1 072 908 70 558 24 040 279 512 846 385 2 415 024 2 432 016 51 267
1 014 577 1 223 215 1 262 042 58 217 35 809 261 585 695 107 2 846 205 1 343 340 86 453
771 024 1 340 540 1 289 088 91 853 137 764 237 610 757 542 2 297 000 2 132 089 30 612 701 929 1 463 698 1 172 979 109 503 137 444 472 774 1 025 731 3 018 222 2 260 776 197 987 496 663 2 277 285 1 654 210 55 350 126 754 395 190 1 045 210 2 407 538 1 195 859 59 463
- 45 -

Year Period \ HS
2012201320142015
2014 JanuaryFebruaryMarch
AprilMayJune
JulyAugustSeptember
OctoberNovemberDecember
2015 JanuaryFebruaryMarch
AprilMayJune
JulyAugustSeptember
OctoberNovemberDecember
Table 10.4 Imports Classified by HS Chapters in US$ continued
72:Iron and steel
73:Articles of iron or steel
74:Copper and articles
thereof75:Nickel and
articles thereof
76:Aluminium and articles
thereof78:Lead and
articles thereof
79:Zinc and articles thereof
80:Tin and articles thereof
81:Other base metals; cements;
articles thereof
82:Tools, implements, cutlery, spoons and
forks, of base metal; parts thereof of base
metal83:Miscellaneous
articles of base metal
129 189 650 147 684 949 16 114 046 33 037 241 20 453 816 918 295 500 104 101 776 222 107 23 687 767 17 294 419 124 811 088 119 783 006 8 624 750 112 028 551 14 690 223 619 416 503 457 120 594 81 373 22 231 691 14 521 202 127 209 965 111 828 119 10 835 147 71 485 567 20 289 421 174 148 203 259 93 934 174 595 21 454 632 13 793 138 122 751 675 115 825 073 5 045 004 1 033 197 19 544 024 113 574 129 063 85 538 329 829 24 789 762 12 571 866
8 785 176 7 557 049 1 875 197 8 313 516 2 746 767 2 205 157 085 12 865 13 441 1 139 407 972 570 8 745 505 10 797 337 785 453 2 461 003 979 161 13 645 11 294 9 246 20 615 1 382 994 815 087 8 441 996 11 494 287 2 534 160 7 183 626 1 279 036 331 0 7 210 17 374 1 539 457 1 223 061
8 451 288 7 935 577 274 515 6 108 497 1 010 964 326 6 364 10 373 3 943 1 696 393 722 773 8 408 173 8 632 555 1 023 648 6 224 438 1 376 270 104 10 163 0 14 833 1 480 766 1 049 353
11 747 355 8 834 547 440 719 1 787 439 1 125 202 171 2 502 1 874 26 450 1 791 628 1 290 536
7 776 640 7 107 430 310 825 1 276 128 2 193 881 1 379 4 346 11 360 248 1 978 465 1 422 709 11 646 784 8 337 451 580 610 785 491 2 453 457 134 2 580 8 308 25 587 1 615 412 1 139 703 11 006 932 7 423 281 334 041 4 043 532 2 235 645 148 485 12 748 17 958 1 897 044 1 390 854
15 898 515 11 699 353 884 535 25 408 143 1 450 607 128 948 1 222 10 011 18 539 2 062 879 1 520 554 16 346 736 12 972 532 853 201 4 230 851 1 784 750 1 052 7 219 4 079 150 3 062 946 1 175 900
9 954 865 9 036 721 938 242 3 662 903 1 653 681 25 706 0 5 861 15 458 1 807 241 1 070 038
10 438 481 5 435 822 346 542 714 512 2 311 892 79 128 185 4 358 4 349 2 421 400 708 152 10 489 541 10 013 081 938 566 486 1 049 751 4 135 26 284 10 383 31 419 1 735 231 797 603 10 158 964 9 507 122 456 999 1 130 922 560 5 046 9 709 4 892 1 231 1 666 417 1 327 052
11 371 566 7 664 277 316 199 259 581 1 767 603 443 6 667 14 039 13 963 1 127 132 915 723 8 772 578 8 003 562 251 549 3 199 1 386 847 363 0 483 9 038 1 862 546 1 043 923 9 348 853 11 340 585 283 181 5 274 1 781 354 3 464 579 6 288 21 506 2 800 883 1 138 235
10 237 230 10 203 065 692 436 8 061 1 620 116 7 923 1 804 0 53 328 2 348 322 1 103 275 10 832 753 9 116 671 284 502 13 365 1 690 311 61 4 031 3 109 1 947 2 520 016 1 458 089 11 724 319 9 021 802 330 177 1 605 1 694 213 11 000 1 072 6 868 222 1 894 035 899 025
11 744 161 14 975 386 217 179 8 431 2 581 181 1 705 72 608 8 026 9 760 3 230 914 1 163 707 11 335 962 9 052 133 528 639 13 409 1 954 254 257 5 610 19 601 171 255 1 660 606 1 053 884
6 297 267 11 491 569 399 036 4 144 783 943 50 512 7 491 11 811 1 522 260 963 197
- 46 -

Year Period \ HS
2012201320142015
2014 JanuaryFebruaryMarch
AprilMayJune
JulyAugustSeptember
OctoberNovemberDecember
2015 JanuaryFebruaryMarch
AprilMayJune
JulyAugustSeptember
OctoberNovemberDecember
Table 10.4 Imports Classified by HS Chapters in US$ continued
84:Nuclear reactors, boilers,
machinery and mechanical
appliances; parts thereof
85:Electrical machinery and equipment and parts thereof;
sound recorders and reproducers, television image and sound
recorders and reproducers, and parts and accessories of such
articles
86:Railway or tramway locomotives, rolling-stock and parts thereof;
railway or tramway track fixtures and fittings and parts thereof; mechanical
(incl. electro-mechanical) traffic signalling equipment of all kinds
87:Vehicles others than railway or tramway
rolling-stock, and parts and accessories thereof
88:Aircraft, spacecraft and
parts thereof
89:Ships, boats and floating
structures
90:Optical, photographic, cinematographic, measuring, checking, precision, medical or surgical instruments and
apparatus; parts and accessories thereof
641 365 663 393 524 168 3 247 387 1 107 466 291 10 398 326 620 631 74 817 734 654 966 301 427 596 332 2 684 743 717 487 442 3 847 758 826 413 98 596 282 595 925 346 388 946 704 3 364 621 542 512 423 8 911 559 510 671 104 010 166 559 396 650 402 970 850 2 997 659 459 694 895 8 419 186 122 687 76 832 871
57 817 622 36 097 687 696 706 42 419 323 4 224 213 16 805 7 355 282 47 302 355 24 043 395 85 691 36 131 300 298 844 283 465 8 760 887 47 525 330 22 719 620 117 163 41 664 804 907 420 1 833 9 238 105
36 870 751 48 871 876 391 695 40 758 697 243 016 7 449 4 765 335 48 707 816 22 570 909 490 079 41 223 461 123 646 38 203 13 688 658 46 881 270 31 192 954 111 651 37 328 471 499 106 61 171 7 966 828
47 017 312 22 683 805 300 842 51 556 560 826 645 1 646 17 066 313 51 465 019 36 949 347 639 202 51 883 580 333 118 28 122 9 755 750 52 375 778 44 104 201 98 630 49 040 469 356 336 23 743 5 690 184
53 243 122 34 629 136 131 411 67 931 276 362 410 20 066 5 054 885 54 123 707 30 439 105 199 108 36 078 371 601 434 19 045 6 239 709 52 595 264 34 644 668 102 444 46 496 112 135 370 9 123 8 428 229
42 018 140 30 496 875 122 486 47 258 222 185 683 15 562 5 612 934 38 347 860 25 617 792 177 768 37 075 911 925 478 331 4 601 166 47 336 785 29 147 845 95 690 33 763 753 536 495 34 173 5 954 117
36 344 018 31 334 806 117 117 39 325 738 1 291 314 1 134 5 574 685 35 898 242 58 996 556 215 466 30 829 520 340 469 6 481 4 114 513 66 374 330 34 872 061 263 063 45 582 040 1 194 576 1 999 6 693 340
60 453 576 32 120 861 377 986 42 543 683 686 966 17 865 6 631 646 38 922 673 29 020 400 619 131 36 633 933 541 393 675 12 053 406 43 049 301 36 871 102 265 498 49 031 397 1 590 848 972 4 481 576
60 165 093 38 612 975 139 636 31 614 248 437 664 2 828 5 918 278 45 853 720 30 171 979 125 349 30 345 754 345 701 22 230 4 122 850 44 632 912 25 707 598 478 470 35 690 695 342 599 18 439 11 074 361
- 47 -

Year Period \ HS
2012201320142015
2014 JanuaryFebruaryMarch
AprilMayJune
JulyAugustSeptember
OctoberNovemberDecember
2015 JanuaryFebruaryMarch
AprilMayJune
JulyAugustSeptember
OctoberNovemberDecember
Table 10.4 Imports Classified by HS Chapters in US$ continued
91:Clocks and watches and parts thereof
92:Musical instruments; parts
and accessories of such articles
93:Arms and ammunition; parts
and accessories thereof
94:Furniture; bedding, mattresses, mattress
supports, cushions and similar stuffed furnishing;
lamps and lighting fittings, NES or incl.; illuminated
signs or name-plates and the like; prefabricated
buildings
95:Toys, games and sports
requisites; parts and accessories
thereof
96:Miscellaneous manufactured
articles
97:Works of art, collectors' pieces
and antiques
98:Other personnal
effects99:Migrants'
effects All Products
609 530 678 256 483 731 40 992 294 7 184 056 11 197 216 198 363 111 828 275 - 7 483 993 732 741 506 406 467 494 826 40 734 544 5 661 088 24 895 739 169 703 39 523 919 10 102 018 7 704 061 789 580 420 490 076 345 994 38 583 341 6 389 941 30 511 047 191 319 25 219 146 20 504 571 6 379 758 045 395 394 304 492 408 019 34 803 766 4 760 458 30 940 709 123 550 24 855 001 17 353 032 6 002 596 473
13 530 18 149 23 240 2 681 460 263 461 1 509 682 21 326 1 857 800 834 327 487 819 583 41 755 10 001 17 065 2 142 986 323 013 1 929 774 2 909 1 804 044 1 483 641 478 794 480 68 633 26 248 13 971 4 919 149 194 447 2 472 965 10 624 1 898 496 1 413 505 499 943 511
24 337 22 901 55 015 2 726 602 471 000 2 540 955 28 137 2 226 569 1 116 347 491 606 257 44 473 69 268 1 743 2 527 032 439 178 3 031 854 12 949 1 970 107 785 570 510 058 768 25 448 60 672 5 387 2 274 426 634 390 2 365 348 31 213 2 281 101 5 267 252 528 100 342
48 200 34 011 7 140 2 970 366 249 664 3 529 617 9 847 2 158 869 961 944 537 979 154 77 471 34 000 84 300 4 214 636 521 354 2 073 005 19 746 2 155 085 1 789 544 547 848 520 32 315 41 811 35 068 3 472 436 499 523 2 111 873 21 800 2 328 922 1 993 199 577 647 430
53 502 71 177 33 992 3 735 880 323 102 3 117 409 2 494 2 116 313 1 127 730 636 661 409 83 139 82 709 14 615 3 525 618 1 913 926 2 968 294 16 267 1 997 026 1 722 935 560 678 583 67 617 19 128 54 456 3 392 750 556 883 2 860 271 14 007 2 424 814 2 008 577 522 620 007
33 494 20 022 4 242 2 323 941 277 275 3 849 294 37 486 1 725 881 1 378 988 519 568 575 9 995 41 512 34 459 2 358 514 287 859 4 390 479 3 073 1 857 169 1 463 649 474 425 593
21 558 26 585 40 439 3 237 727 284 096 2 310 444 9 345 1 828 645 1 605 967 499 402 078
29 898 39 321 26 559 3 163 360 312 188 1 870 775 4 233 1 549 626 563 955 438 407 701 27 622 18 358 6 397 1 846 434 226 835 3 242 643 23 843 1 841 748 875 690 452 935 239 62 632 20 351 68 724 3 579 699 485 289 2 470 075 1 833 1 971 305 980 515 532 342 522
37 938 14 100 48 140 3 176 801 228 570 2 479 693 1 007 2 072 353 1 114 373 541 630 925 19 977 8 919 25 626 4 452 375 550 117 2 166 049 4 868 2 362 634 890 436 512 236 536 23 297 15 554 19 868 2 867 821 525 276 1 861 516 11 860 2 102 368 1 521 159 583 699 859
66 916 14 695 26 584 2 458 586 879 399 2 144 234 3 103 2 267 327 5 080 831 515 834 076 21 093 29 067 97 387 2 909 830 314 855 1 905 824 18 308 2 565 238 1 093 158 449 204 776 40 976 56 009 9 595 2 428 677 388 697 2 249 681 4 592 2 710 708 784 311 482 908 592
- 48 -

Table 11.0: Summary of Sales of Principal Crops and Livestock to/through Marketing Authourities, US$
Period Crops Livestock & Milk Crops and livestock
2012 785 745 687 156 180 646 941 926 3332013 2 166 944 304 176 797 676 2 297 112 3442014 814 284 458 159 032 244 973 316 7022015 561 668 564 178 700 017 739 913 452
2014 January 324 802 14 271 075 14 595 877February 607 755 12 644 139 13 251 894March 509 021 13 857 298 14 366 319
April 236 887 499 14 668 621 251 556 120May 203 387 007 14 568 265 217 955 272June 99 912 543 14 307 561 114 220 104
July 49 393 777 15 008 902 64 402 679August 100 393 110 14 061 955 114 455 065September 101 877 064 12 897 325 114 774 389
October 14 620 800 11 098 004 25 718 804November 6 117 184 10 027 908 16 145 092December 253 896 11 621 192 11 875 088
2015 January 0 13 675 928 13 675 928February 0 13 282 252 13 282 252March 0 14 461 884 14 461 884
April 165 425 147 14 222 160 179 647 307May 198 361 206 14 364 632 212 725 839June 116 118 819 15 597 046 131 715 865
July 41 184 818 16 300 743 57 485 561August 37 786 406 15 383 728 53 170 134September 1 000 729 14 718 140 15 263 739
October 1 791 440 15 325 315 17 116 755November 0 14 473 360 14 473 360December 0 16 894 829 16 894 829
Note: ♣ Value of milk is recorded under commercial areas. - Data not available
Table 11.1 Volume of Crop Sales to/through Marketing Authorities in tonnes
Intake Year♣ Maize Groundnuts Sorghum Rapoko/ Soya Sugar Coffee Wheat Cotton Flue-cured Burley # Sunflower(unshelled) Millet beans beans tobacco tobacco
2010/11 216 746 3 208 184 23 28 - 0 249 904 123 503 681 340 481 1 0 2011/12 81 384 1 130 274 0 1 129 147 0 3 516 0 109 772 26 8 2012/13 23 568 1 070 241 0 1 611 32 0 8 138 0 58 298 826 0 1 2013/14 220 366 1 074 14 626 1 164 275 1 141 0 19 374 0 176 295 0 5 2014/15 57 834 21 67 3 52 0 0 83 0 198 681 727 0 0
2014 January 0 0 0 0 0 0 0 0 0 0 0 0February 0 0 0 0 0 0 0 0 0 215 0 0March 0 0 0 0 0 0 0 0 0 160 0 0
April 116 7 0 0 0 0 0 0 0 72 676 - 0May 7 500 578 46 0 35 43 0 0 0 63 895 - 0June 22 357 377 100 2 44 149 0 4 0 29 136 - 1.0
July 57 818 74 173 0 68 286 0 0 0 8 288 - 0August 47 139 23 1 468 2 90 303 0 0 0 1 846 - 1.0September 61 284 11 6 728 191 1 306 0 655 0 79 - 2
October 21 055 1.0 5 082 377 3 47 0 9 050 0 0 0 0November 3 079 3.0 968 529 34 7 0 9 239 0 0 0 1December 18 0 61 63 0 0 0 426 0 0 0 0
2015 January 0 0 0 0 0 0 0 0 0 0 - 0February 0 0 0 0 0 0 0 0 0 0 - 0March 0 0 0 0 0 0 0 0 0 17 907 441 - 0
April 33 0 0 0 0 0 0 0 0 55 330 754 - 0May 3 819 1 0 3 0 0 0 0 0 65 110 172 - 0June 13 417 13 1 0 52 0 0 0 0 37 431 955 - 0
July 13 192 7 0 0 0 0 0 2 0 13 287 963 - 0August 15 352 0 0 0 0 0 0 0 0 9 568 941 - 0September 7 460 0 11 0 0 0 0 81 0 44 501 - 0
October 4 561 0 55 0 0 0 0 0 0 0 - - November 0 0 0 0 0 0 0 0 0 0 - - December 0 0 0 0 0 0 0 0 0 0 - -
Note: ♣ The intake year from April to March# Monthly burly tobacco figures could not be obtained from TIMB - Data not available
Total
- 49 -Source: TIMB, GMB, Min. of Agriculture
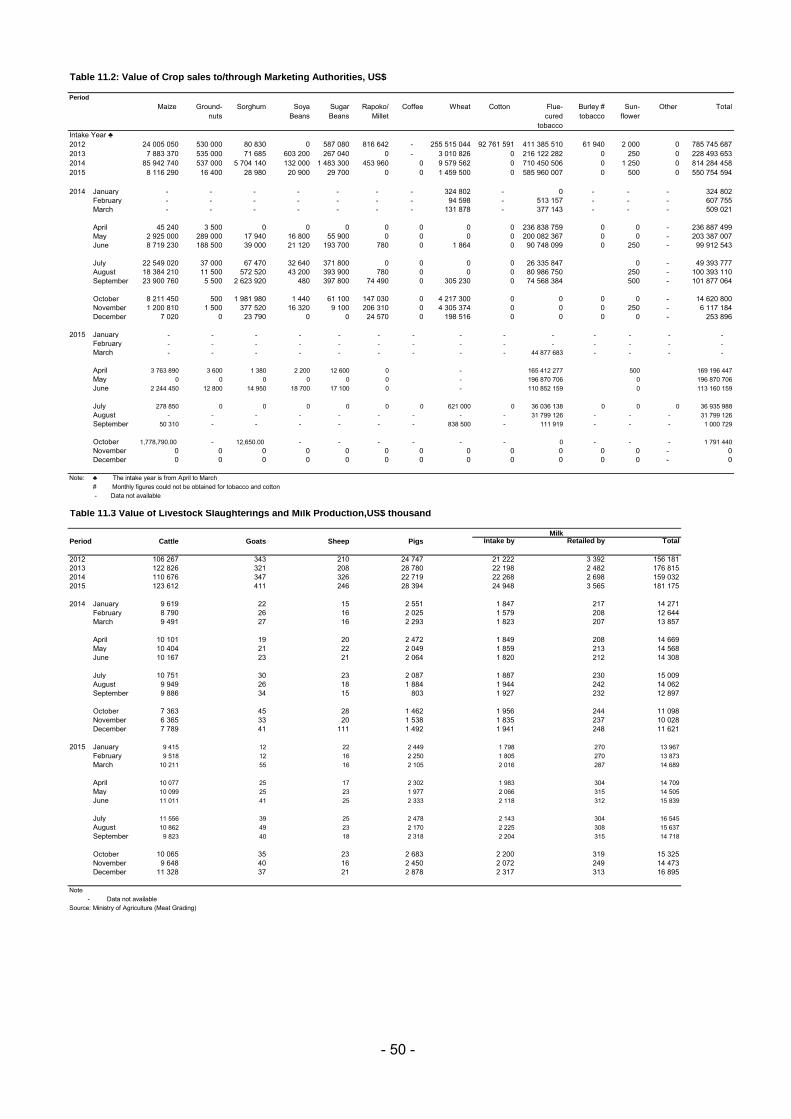
Table 11.2: Value of Crop sales to/through Marketing Authorities, US$
Period
Maize Ground- Sorghum Soya Sugar Rapoko/ Coffee Wheat Cotton Flue- Burley # Sun- Other Totalnuts Beans Beans Millet cured tobacco flower
tobaccoIntake Year ♣2012 24 005 050 530 000 80 830 0 587 080 816 642 - 255 515 044 92 761 591 411 385 510 61 940 2 000 0 785 745 6872013 7 883 370 535 000 71 685 603 200 267 040 0 - 3 010 826 0 216 122 282 0 250 0 228 493 6532014 85 942 740 537 000 5 704 140 132 000 1 483 300 453 960 0 9 579 562 0 710 450 506 0 1 250 0 814 284 4582015 8 116 290 16 400 28 980 20 900 29 700 0 0 1 459 500 0 585 960 007 0 500 0 550 754 594
2014 January - - - - - - - 324 802 - 0 - - - 324 802February - - - - - - - 94 598 - 513 157 - - - 607 755March - - - - - - - 131 878 - 377 143 - - - 509 021
April 45 240 3 500 0 0 0 0 0 0 0 236 838 759 0 0 - 236 887 499May 2 925 000 289 000 17 940 16 800 55 900 0 0 0 0 200 082 367 0 0 - 203 387 007June 8 719 230 188 500 39 000 21 120 193 700 780 0 1 864 0 90 748 099 0 250 - 99 912 543
July 22 549 020 37 000 67 470 32 640 371 800 0 0 0 0 26 335 847 0 - 49 393 777August 18 384 210 11 500 572 520 43 200 393 900 780 0 0 0 80 986 750 250 - 100 393 110September 23 900 760 5 500 2 623 920 480 397 800 74 490 0 305 230 0 74 568 384 500 - 101 877 064
October 8 211 450 500 1 981 980 1 440 61 100 147 030 0 4 217 300 0 0 0 0 - 14 620 800November 1 200 810 1 500 377 520 16 320 9 100 206 310 0 4 305 374 0 0 0 250 - 6 117 184December 7 020 0 23 790 0 0 24 570 0 198 516 0 0 0 0 - 253 896
2015 January - - - - - - - - - - - - - - February - - - - - - - - - - - - - - March - - - - - - - - - 44 877 683 - - - -
April 3 763 890 3 600 1 380 2 200 12 600 0 - 165 412 277 500 169 196 447May 0 0 0 0 0 0 - 196 870 706 0 196 870 706June 2 244 450 12 800 14 950 18 700 17 100 0 - 110 852 159 0 113 160 159
July 278 850 0 0 0 0 0 0 621 000 0 36 036 138 0 0 0 36 935 988August - - - - - - - - - 31 799 126 - - - 31 799 126September 50 310 - - - - - - 838 500 - 111 919 - - - 1 000 729
October 1,778,790.00 - 12,650.00 - - - - - - 0 - - - 1 791 440November 0 0 0 0 0 0 0 0 0 0 0 0 - 0December 0 0 0 0 0 0 0 0 0 0 0 0 - 0
Note: ♣ The intake year is from April to March# Monthly figures could not be obtained for tobacco and cotton - Data not available
Table 11.3 Value of Livestock Slaughterings and Milk Production,US$ thousand
MilkPeriod Cattle Goats Sheep Pigs Intake by Retailed by Total
2012 106 267 343 210 24 747 21 222 3 392 156 1812013 122 826 321 208 28 780 22 198 2 482 176 8152014 110 676 347 326 22 719 22 268 2 698 159 0322015 123 612 411 246 28 394 24 948 3 565 181 175
2014 January 9 619 22 15 2 551 1 847 217 14 271February 8 790 26 16 2 025 1 579 208 12 644March 9 491 27 16 2 293 1 823 207 13 857
April 10 101 19 20 2 472 1 849 208 14 669May 10 404 21 22 2 049 1 859 213 14 568June 10 167 23 21 2 064 1 820 212 14 308
July 10 751 30 23 2 087 1 887 230 15 009August 9 949 26 18 1 884 1 944 242 14 062September 9 886 34 15 803 1 927 232 12 897
October 7 363 45 28 1 462 1 956 244 11 098November 6 365 33 20 1 538 1 835 237 10 028December 7 789 41 111 1 492 1 941 248 11 621
2015 January 9 415 12 22 2 449 1 798 270 13 967February 9 518 12 16 2 250 1 805 270 13 873March 10 211 55 16 2 105 2 016 287 14 689
April 10 077 25 17 2 302 1 983 304 14 709May 10 099 25 23 1 977 2 066 315 14 505June 11 011 41 25 2 333 2 118 312 15 839
July 11 556 39 25 2 478 2 143 304 16 545August 10 862 49 23 2 170 2 225 308 15 637September 9 823 40 18 2 318 2 204 315 14 718
October 10 065 35 23 2 683 2 200 319 15 325November 9 648 40 16 2 450 2 072 249 14 473December 11 328 37 21 2 878 2 317 313 16 895
Note - Data not available
Source: Ministry of Agriculture (Meat Grading)
- 50 -

Table 11.4: Volume of Livestock Slaughterings and Milk Production
C.S.C. Butchers C.S.C. Butchers C.S.C. Butchers Colcom Butchers Intake by Retailed by ' 000 head and grading ' 000 head and grading ' 000 head and grading ' 000 head and grading Processors producers
centres centres centres centres 000 litres 000 litres ' 000 head ' 000 head ' 000 head ' 000 head
2012 14.90 242.15 0.00 9.81 0.00 5.25 82.51 40.00 48 726.0 7 203.002013 16.35 244.67 0.00 11.49 0.00 5.20 99.25 46.58 49 148.9 5 516.692014 13.72 233.50 0.17 12.90 0.03 7.31 71.17 52.59 49 484.5 5 994.622015 18.48 239.05 0.00 19.41 0.04 6.42 78.28 61.77 50 473.79 7 071.05
2014 January 1.03 19.02 0.00 0.87 0.02 0.37 9.15 3.87 4 104.7 482.18February 1.07 17.25 0.16 0.89 0.01 0.39 6.45 3.88 3 508.6 463.00March 0.96 18.81 0.00 1.09 0.00 0.40 7.36 4.34 4 050.9 460.02
April 0.94 20.10 0.00 0.75 0.00 0.49 7.77 4.85 4 109.0 462.79May 1.07 20.60 0.00 0.82 0.00 0.55 5.69 4.77 4 132.2 472.56June 1.01 20.17 0.01 0.91 0.01 0.52 5.99 4.54 4 044.8 470.42
July 0.96 21.44 0.00 1.20 0.01 0.58 6.25 4.40 4 194.4 511.83August 1.43 19.30 0.00 1.05 0.00 0.45 5.37 4.24 4 319.6 536.95September 1.31 19.29 0.00 1.35 0.00 0.38 0.00 4.10 4 282.9 515.42
October 1.22 19.82 0.00 1.50 0.00 0.57 5.85 4.17 4 346.6 541.75November 1.34 16.84 0.00 1.10 0.00 0.41 5.16 5.38 4 078.4 526.96December 1.38 20.88 0.00 1.38 0.00 2.21 6.14 4.08 4 312.3 550.75
2015 January 0.64 18.97 0.00 1.29 0.00 0.34 6.38 4.36 4 154.10 535.55February 1.62 18.21 0.00 1.95 0.00 0.76 5.26 4.09 3 630.17 485.04March 0.96 20.31 0.00 2.20 0.01 0.47 6.80 3.94 4 031.51 574.19
April 0.90 20.09 0.00 1.58 0.00 0.57 5.97 4.36 3 966.95 607.05May 1.53 19.51 0.00 1.16 0.00 0.52 5.69 4.89 4 132.91 629.94June 1.61 21.33 0.00 1.63 0.01 0.62 6.70 5.21 4 235.28 624.57
July 1.91 22.17 0.00 1.56 0.01 0.63 7.15 5.50 4 286.67 607.72August 1.85 20.78 0.00 1.96 0.00 0.57 5.36 5.71 4 450.44 616.49September 2.21 18.26 0.00 1.62 0.00 0.45 6.70 5.13 4 408.50 629.00
October 1.70 19.27 0.00 1.40 0.00 0.58 7.99 5.70 4 399.79 638.00November 1.80 18.30 0.00 1.58 0.00 0.40 6.54 5.96 4 143.9 497.00December 1.75 21.85 0.00 1.50 0.00 0.53 7.75 6.94 4 633.6 626.49
Note: - Data not available
Table 11.5 Short-Term Credit Extended to Farmers, US$ thousand
Period Commercial Banks Merchant Banks Total
(Advances) (Advances)
(US$) (US$) (US$)
2012 3 495 775.00 537 293.28 5 501 421.562013 5 855 325.72 807 925.20 6 663 250.922014 6 471 262.10 53 299.70 6 533 581.202015 6 368 853.60 0.00 6 368 853.60
2014 January 489 585.30 24 456.90 514 042.20February 519 154.60 28 842.80 547 997.40March 503 868.10 - 503 868.10
- April 540 156.20 - 540 156.20May 546 733.90 - 546 733.90June 536 188.90 - 536 188.90
- July 575 645.30 - 575 645.30August 548 866.70 - 548 866.70September 539 818.80 - 539 818.80
October 530 544.70 - 530 544.70November 574 859.50 - 574 859.50December 565 840.10 - 574 859.50
2015 January 541 656.50 - 541 656.50February 538 722.00 - 538 722.00March 549 118.00 - 549 118.00
April 556 457.40 - 556 457.40May 577 258.60 - 577 258.60June 576 485.10 - 576 485.10
July 589 866.70 - 589 866.70August 580 775.30 - 580 775.30September 598 430.00 - 598 430.00
October 609 537.00 - 609 537.00November 650 547.00 - 650 547.00December -
Source: Reserve Bank of Zimbabwe* Figures amended
Goats slaughterings Milk Production Pig slaughterings Sheep slaughterings Cattle slaughteringsPeriod
- 51 -

Table 12.0 Mineral Production, Excludes Production from Sand and Stone Quarries
Period Month mt US$'000 mt US$'000 000 mt US$'000 mt US$'000 mt US$'000 kg US$'000 mt US$'000 kg US$'000
2009 4 970.8 1 567.3 193 673.7 18 375.7 1 667.3 57 973.9 39.0 473.7 3 571.8 15 412.5 4 965.7 157 180.6 2 463.0 718.7 208.9 1 462.12010 2 031.0 1 308.8 516 776.1 56 877.4 2 500.2 91 165.1 57.6 685.0 4 629.0 28 512.2 9 619.8 380 437.9 741.0 271.9 254.0 2 643.02011 0.0 0.0 599 079.4 73 128.2 2 562.1 103 880.8 174.0 4 254.3 6 554.6 50 934.0 12 949.3 655 689.4 7 252.0 4 753.3 398.4 7 709.52012 29.5 23.6 408 475.8 48 968.0 1 593.6 75 768.7 194.5 2 827.6 6 665.3 39 192.9 14 743.0 782 751.8 7 022.0 4 048.2 412.0 8 989.72013 377.0 313.6 355 142.0 35 846.9 3 114.2 96 312.6 318.9 3 485.7 8 284.6 44 225.1 14 001.3 621 966.0 6 934.0 3 727.4 519.6 8 232.42014 - - 408 422.0 40 264.1 5 782.6 88 289.3 357.8 4 590.5 8 261.4 39 993.8 15 385.7 615 794.4 6 853.0 3 667.5 544.4 5 270.6
2014 January - - 28 207.0 3 163.4 525.1 7 697.1 24.5 289.6 698.1 3 627.8 1 108.7 43 961.3 442.0 244.9 64.3 327.5February - - 36 794.0 3 586.7 513.6 7 388.1 32.9 326.5 689.3 3 338.4 1 059.5 42 730.4 544.0 255.7 70.5 322.3March - - 39 839.0 3 915.0 526.8 8 087.8 29.8 378.0 641.0 3 039.6 1 168.8 48 943.1 550.0 306.4 37.9 346.4
April - - 46 781.0 4 176.1 0.0 0.0 26.8 373.1 639.7 3 127.6 1 147.5 47 487.2 536.0 298.6 39.3 414.6May - - 31 181.0 3 143.3 607.8 9 537.3 32.4 412.2 731.2 3 773.9 1 170.6 47 869.7 604.0 336.4 45.3 490.0June - - 37 057.0 3 392.3 480.2 6 348.0 34.5 401.2 773.9 3 808.7 1 145.5 46 471.2 613.0 341.4 49.2 552.9
July - - 30 085.0 2 994.7 491.4 7 259.0 30.1 378.5 635.1 3 188.3 1 357.3 56 222.1 668.0 372.1 38.3 462.4August - - 32 256.0 2 988.6 576.4 7 838.1 31.0 423.0 704.0 3 540.4 1 314.9 54 206.1 601.0 334.8 42.9 536.3September - - 25 774.0 2 708.2 557.7 8 447.1 31.9 438.1 672.5 2 379.4 1 532.7 60 734.8 537.0 299.1 39.6 505.0October - - 32 577.0 3 198.2 500.5 8 768.0 28.0 404.6 621.7 3 125.4 1 358.2 52 982.2 619.0 342.9 34.7 436.7November - - 32 480.0 3 368.8 524.5 8 706.1 28.6 383.4 716.8 3 522.9 1 317.6 49 236.8 578.0 271.7 42.3 456.5December - - 35 391.0 3 628.9 478.6 8 212.8 27.1 382.3 738.1 3 521.5 1 704.4 64 949.4 561.0 263.7 40.1 420.0
2015 January - - 18 123.0 2 001.0 570.0 9 579.3 28.2 395.1 706.6 3 147.1 1 231.5 48 614.8 360.0 173.5 39.0 408.4February - - 23 894.0 2 070.2 489.8 8 413.5 32.2 395.8 702.5 2 936.5 1 292.7 50 673.6 525.0 326.0 39.5 418.2March - - 15 273.0 1 557.4 320.8 6 142.0 37.0 455.1 697.1 2 883.8 1 656.2 62 380.6 657.0 408.0 37.4 445.8
April - - 8 956.0 1 075.4 195.0 4 280.0 27.7 354.3 695.2 2 957.1 1 479.3 56 464.0 540.0 300.8 39.7 466.9May - - 13 795.0 1 325.5 186.8 5 056.1 30.3 382.6 624.5 2 753.5 1 465.2 55 972.0 547.0 304.7 33.7 411.8June - - 15 779.0 1 533.5 203.4 5 583.2 22.7 351.9 510.7 2 365.7 1 744.0 66 010.0 716.0 398.3 25.0 356.7
2014 Jan-June - - 219 859.0 21 376.8 3 224.8 47 559.1 181.0 2 180.6 4 173.2 20 715.9 6 800.6 277 463.0 3 289.0 1 783.3 306.6 2 453.72015 Jan-June - - 221 737.0 21 208.1 3 191.1 47 121.0 186.6 2 269.5 4 110.2 20 276.5 7 049.2 289 723.7 3 515.0 1 910.5 280.5 2 588.6
Note: - Data not availableSource: Chamber of Mines
Asbestos Chrome Coal Cobalt Copper Gold Graphite Iridium
- 52 -

Period Month
200920102011201220132014
2014 JanuaryFebruaryMarch
AprilMayJune
JulyAugustSeptemberOctoberNovemberDecember
2015 JanuaryFebruaryMarch
AprilMayJune
2014 Jan-June2015 Jan-June
Table 12.0 Mineral Production, Excludes Production from Sand and Stone Quarries
Other minerals 1
Total
mt US$'000 mt US$'000 '000 mt US$'000 mt US$'000 mt US$'000 kg US$'000 US$'000 US$'000
4 857.5 62 204.0 5 354.4 41 186.8 - - 6 848.9 239 089.2 568.1 24 054.4 412.8 711.6 874.7 621 285.1 6 133.5 111 216.4 6 916.1 100 654.5 56.7 5 934.8 8 638.7 409 065.7 726.9 50 269.8 555.0 1 929.7 0.6 1 240 972.9 7 992.2 175 457.7 8 421.7 178 280.9 46.0 4 549.7 10 826.6 538 276.3 940.3 52 442.6 823.0 3 369.8 1 176.5 1 853 903.1 7 898.7 112 359.6 8 136.2 148 623.6 16.8 1 911.1 10 524.3 464 518.7 890.7 31 220.9 787.2 1 751.6 915.1 1 723 871.1
12 961.9 158 302.0 10 152.7 205 789.8 - - 13 065.5 554 006.5 1 146.1 32 891.4 1 011.6 1 527.6 - 1 766 626.9 16 632.7 202 412.1 10 137.5 212 480.5 - - 12 482.7 495 363.7 1 139.9 35 547.5 982.6 2 222.1 - 1 745 896.0
- - - 1 559.9 15 206.5 809.2 16 684.5 - - 1 014.6 42 392.0 93.5 2 446.7 58.3 958.4 - 136 999.7 1 557.1 15 448.7 832.4 17 120.6 - - 1 044.1 41 371.8 95.7 2 608.0 56.8 102.0 - 134 599.2 1 098.1 11 175.7 786.0 16 601.7 - - 980.1 39 880.2 88.5 2 556.1 78.1 101.0 - 135 330.9 - - - 1 195.6 14 748.1 803.6 1 736.5 - - 979.9 39 842.4 89.8 2 666.2 83.8 117.4 - 114 987.8 1 563.5 20 917.0 955.3 21 549.8 - - 1 154.0 47 608.1 106.0 3 025.6 97.5 135.9 - 158 799.2 1 616.9 22 471.3 1 054.8 24 694.6 - - 1 262.4 52 365.0 117.1 4 310.0 105.3 147.2 - 165 303.9 - - - 1 357.3 18 669.7 802.0 19 100.3 - - 971.7 40 452.0 89.8 2 675.9 82.1 116.4 - 151 891.3 1 449.7 19 807.4 883.6 21 492.4 - - 1 076.2 44 578.1 99.0 3 228.7 91.3 130.1 - 159 103.8 1 444.3 19 734.8 802.5 19 534.0 - - 995.6 39 788.5 90.2 3 073.4 83.1 114.9 - 157 757.4 - - - 1 225.7 13 470.2 719.6 16 146.6 - - 888.7 33 106.7 80.1 2 700.2 73.3 94.9 - 134 776.6 1 308.9 15 999.0 873.6 19 555.5 - - 1 090.6 38 618.9 98.8 3 293.8 87.7 103.3 - 143 516.8 1 255.8 14 763.6 814.9 18 264.0 - - 1 024.9 35 360.0 91.5 2 962.9 85.3 100.6 - 152 829.5 - - -
1 222.1 13 559.1 803.9 17 816.0 - - 1 022.3 35 391.2 91.1 2 963.2 81.1 94.9 - 134 143.61 502.3 16 042.0 823.7 18 301.5 - - 1 042.4 35 772.8 94.3 3 038.8 82.3 93.0 - 138 481.81 716.1 15 122.9 766.7 17 008.8 - - 955.0 31 482.6 86.7 2 744.5 79.4 91.6 - 140 723.1
1 281.9 13 245.0 819.2 17 903.5 - - 1 030.9 33 779.1 90.9 2 820.1 82.6 87.3 - 133 734.51 293.2 12 182.4 693.3 15 234.5 - - 868.5 28 050.2 77.7 2 344.2 70.5 76.2 - 124 094.7
902.0 8 822.6 510.0 10 674.5 - - 642.0 20 495.0 57.2 1 598.7 52.1 60.0 - 118 250.0
8 591.1 99 967.4 5 241.3 114 016.6 - - 6 435.0 263 459.4 590.6 17 612.6 479.8 699.3 - 869 287.88 388.5 103 430.6 5 234.1 116 432.4 - - 6 392.2 261 519.4 586.9 17 841.7 503.7 719.8 - 885 041.9
- Data not availableSource: Chamber of Mines
Rhodium RhutheniumNickel Paladium Phosphate Platinum
- 53 -

Table 13.0 Electrical Energy Produced and Distributed , Millions of kilowatt hours
Period
By
Hwange
Power
station
By Kariba
Power
Station
By Other
Power
Station
Independ
ent Power
Producer
s (IPPs)
Total from
Zimbabwe
Drawings
from inter-
connected
system
From Other
non inter-
connected
system
Net
imports Total
2012 3 133.2 5 387.3 442.1 - 8 962.7 9 788.4 0 375.1 10 163.62013 3 826.9 4 981.8 506.1 - 9 314.8 10 704.1 0 532.7 11 236.82014 3 821.3 5 402.4 559.3 - 9 814.9 11 034.4 0 - 243.4 10 791.02015 3 945.8 4 939.2 583.2 - 9 252.1 10 154.5 13.7 - 315.0 9 853.3
2015 January 322.1 418.5 49.7 4.3 794.6 874.3 0.0 - 27.4 846.9February 202.0 376.2 44.2 6.7 629.1 686.1 0.0 30.1 716.2March 228.6 463.8 50.5 7.7 750.6 800.0 0.0 - 8.5 791.5
April 254.7 446.6 42.3 10.8 754.4 803.2 0.0 - 30.0 773.2May 262.3 492.8 51.3 6.3 812.7 859.6 0.0 - 30.9 828.7June 395.1 465.0 47.5 3.9 911.5 953.5 0.0 - 69.8 883.7
July 470.1 470.0 58.4 3.3 1 001.8 1 046.5 0.0 - 101.1 945.4August 369.4 491.7 50.0 2.4 913.5 974.3 0.0 - 79.7 894.6September 357.2 341.0 51.5 2.4 752.1 803.5 5.6 5.5 814.6
October 339.9 360.1 45.2 1.9 747.1 795.4 6.8 6.3 808.5November 382.5 303.6 45.4 2.4 733.9 776.7 0.0 - 17.3 759.4December 361.9 309.9 47.2 1.8 450.8 781.4 1.3 7.9 790.6
2016 January 367.3 281.5 38.5 3.8 691.1 802.3 1.6 64.3 868.2
2014 Jan - Dec 3 821.3 5 402.4 559.3 28.9 9 814.9 11 034.4 0.0 - 243.4 10 791.0
2015 Jan - Dec 3 945.8 4 939.2 583.2 53.9 9 252.1 10 154.5 13.7 - 315.0 9 853.3
Table 13.1 Electirical Energy Used by Major Industrial Divisions, millions of kilowatt hours
Period Agriculture and Forestry
Mining and Quarrying
Manufacturing Transport
and Construction
Domestic Consumers
Others Total
2012 524.0 1 101.0 1 983.0 2 654.0 1 569.0 7 831.02013 888.0 1 360.0 1 755.0 2 047.0 1 506.0 8 285.02014 686.8 1 612.8 1 775.0 2 496.0 1 666.8 8 237.4
2014 January 33.4 110.2 175.9 221.2 135.6 676.2February 44.0 122.6 164.1 217.3 143.5 691.6March 33.7 114.3 176.5 266.1 132.1 722.8
April 38.0 136.1 145.8 187.9 147.6 655.4May 18.7 105.8 224.4 183.1 107.6 639.6June 36.4 137.9 183.4 211.3 139.9 708.9
July 42.6 109.8 205.0 204.5 137.9 699.7August 40.6 121.3 181.6 219.4 152.6 715.5September 42.1 130.1 179.9 193.7 139.9 685.7
October 115.7 199.4 38.0 200.6 140.3 694.0November 119.4 182.3 49.7 182.5 150.8 684.7December 122.3 143.0 50.6 208.4 138.9 663.2
2015 January 73.0 170.6 23.9 202.8 143.7 614.0February 84.0 157.8 29.4 179.1 140.3 590.7March 86.0 139.0 37.5 199.2 132.1 593.9
April 94.1 124.2 49.5 192.8 138.4 599.0May 98.8 160.2 41.4 190.4 141.9 632.6June 113.9 156.6 36.8 207.7 132.6 647.7
July 128.7 155.1 28.4 218.7 147.5 678.3August 131.8 149.0 38.4 202.1 155.0 676.3
2014 January-August 287.4 957.9 1 456.8 1 710.9 1 096.7 5 509.72015 January-August 810.2 1 212.6 285.3 1 593.0 1 131.5 5 032.5
Source: Zimbabwe Electricity Supply Authority (ZESA)
Generation Sent Out From other sources
Energy Distributed in ZimbabweInterconnected System
- 54 -

Table 14.0 : Building Materials Price Index (March-2009 = 100)-September 2015
Bricksᵜ Cement*
aggregates and
allied materials
Timber and
wood
products
Metal windows
and door frames
Roofingᵜ Sanitaryware
and plumbing
Flooring Paint and
glass
Electrical goods
and materials
Others Total
materials
Weights 125 189 226 53 50 136 40 77 58 46 1000
2011 86.3 104.7 91.1 98.9 110.1 130.9 93.8 89.3 139.8 81.3 113.52012 89.7 117.4 132.8 109.1 104.7 108.7 104.5 105.2 136.0 86.6 111.82013 90.0 118.9 130.4 105.8 104.7 100.7 108.5 98.2 137.1 84.1 111.72014 84.9 123.4 129.2 94.2 94.2 88.8 112.5 93.4 140.6 83.9 105.92015 82.4 118.6 138.2 87.8 93.9 83.8 116.5 89.7 137.9 81.0 106.9
2014 March 86.4 122.0 128.9 100.4 94.3 98.5 111.0 93.3 139.8 84.3 109.3June 86.4 119.4 128.7 95.5 94.3 79.8 112.0 91.1 139.5 83.7 106.6September 83.7 126.3 129.7 91.8 94.3 92.5 113.0 94.0 141.4 84.1 105.5December 83.2 125.9 129.5 89.6 94.1 85.6 114.0 95.3 141.4 83.4 102.2
2015 March 84.7 120.9 138.0 91.7 94.2 90.6 115.0 90.8 138.2 81.6 110.1June 84.6 119.6 138.3 92.0 94.0 83.0 116.0 89.3 138.4 81.3 106.1September 80.1 117.4 138.0 86.6 93.5 83.3 117.0 89.7 138.4 81.1 105.0December 80.2 116.3 138.4 81.0 93.7 78.4 118.0 88.9 136.7 79.8 106.3
0.2 -1.0 0.3 -6.4 0.2 -5.9 0.9 -0.9 -1.3 -1.6 1.3
-3.6 -7.6 6.8 -9.5 -0.4 -8.3 3.5 -6.7 -3.4 -4.3 4.1
Note: ♣ Includes delivery charges to site.
Percentage rates of change from September 2015 to December 2015
Percentage rates of change from December 2014 to December 2015
- 55 -
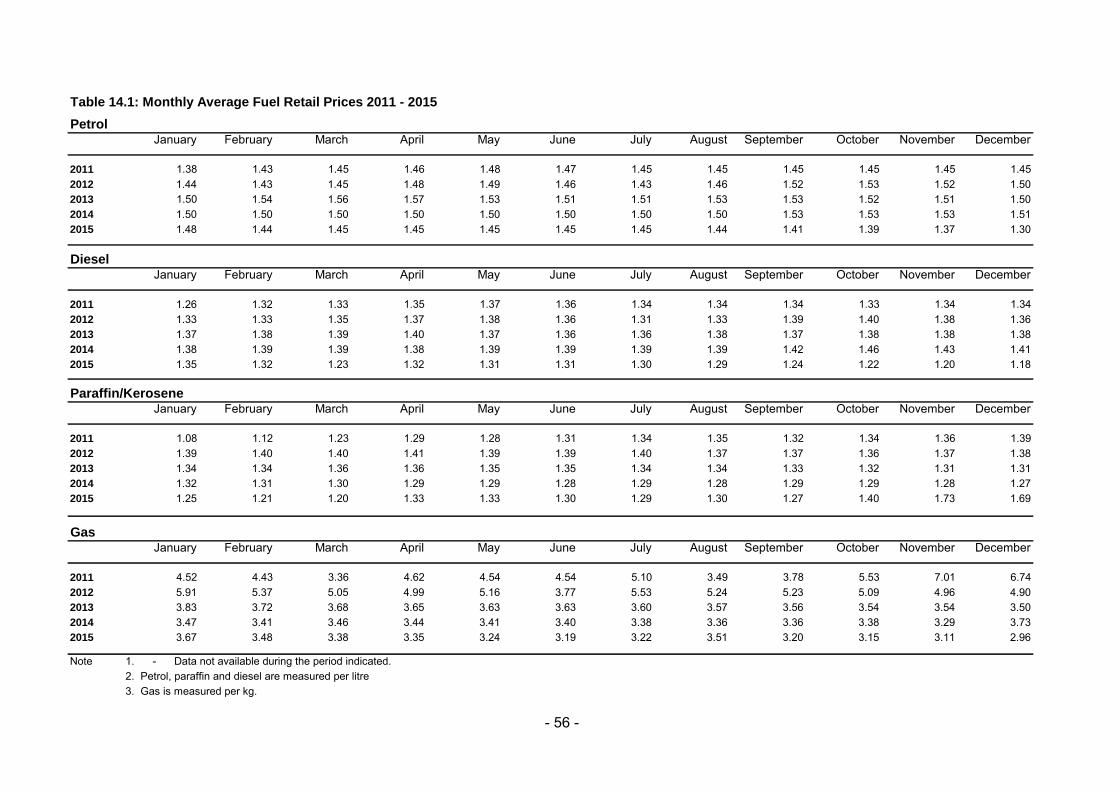
January February March April May June July August September October November December
2011 1.38 1.43 1.45 1.46 1.48 1.47 1.45 1.45 1.45 1.45 1.45 1.452012 1.44 1.43 1.45 1.48 1.49 1.46 1.43 1.46 1.52 1.53 1.52 1.502013 1.50 1.54 1.56 1.57 1.53 1.51 1.51 1.53 1.53 1.52 1.51 1.502014 1.50 1.50 1.50 1.50 1.50 1.50 1.50 1.50 1.53 1.53 1.53 1.512015 1.48 1.44 1.45 1.45 1.45 1.45 1.45 1.44 1.41 1.39 1.37 1.30
January February March April May June July August September October November December
2011 1.26 1.32 1.33 1.35 1.37 1.36 1.34 1.34 1.34 1.33 1.34 1.342012 1.33 1.33 1.35 1.37 1.38 1.36 1.31 1.33 1.39 1.40 1.38 1.362013 1.37 1.38 1.39 1.40 1.37 1.36 1.36 1.38 1.37 1.38 1.38 1.382014 1.38 1.39 1.39 1.38 1.39 1.39 1.39 1.39 1.42 1.46 1.43 1.412015 1.35 1.32 1.23 1.32 1.31 1.31 1.30 1.29 1.24 1.22 1.20 1.18
January February March April May June July August September October November December
2011 1.08 1.12 1.23 1.29 1.28 1.31 1.34 1.35 1.32 1.34 1.36 1.392012 1.39 1.40 1.40 1.41 1.39 1.39 1.40 1.37 1.37 1.36 1.37 1.382013 1.34 1.34 1.36 1.36 1.35 1.35 1.34 1.34 1.33 1.32 1.31 1.312014 1.32 1.31 1.30 1.29 1.29 1.28 1.29 1.28 1.29 1.29 1.28 1.272015 1.25 1.21 1.20 1.33 1.33 1.30 1.29 1.30 1.27 1.40 1.73 1.69
January February March April May June July August September October November December
2011 4.52 4.43 3.36 4.62 4.54 4.54 5.10 3.49 3.78 5.53 7.01 6.742012 5.91 5.37 5.05 4.99 5.16 3.77 5.53 5.24 5.23 5.09 4.96 4.902013 3.83 3.72 3.68 3.65 3.63 3.63 3.60 3.57 3.56 3.54 3.54 3.502014 3.47 3.41 3.46 3.44 3.41 3.40 3.38 3.36 3.36 3.38 3.29 3.732015 3.67 3.48 3.38 3.35 3.24 3.19 3.22 3.51 3.20 3.15 3.11 2.96
Note 1. - Data not available during the period indicated.2. Petrol, paraffin and diesel are measured per litre3. Gas is measured per kg.
Gas
Table 14.1: Monthly Average Fuel Retail Prices 2011 - 2015
Petrol
Diesel
Paraffin/Kerosene
- 56 -

Table 15.0: Volume of Manufacturing Index (VMI): 2013 - 2014 (Base 2009=100)
Food-stuffs (including
stockfeeds)Drink and
tobacco
Textiles including
ginningClothing and
footwearWood and
furniturePaper, printing and publishing
Chemical and petroleum
products
Non-metallic mineral
products
Metals and metal
products
Transport and transport
equipment
Other manufacturing
groups
All manufacturing
groups
Weights 252 118 28 79 24 68 172 46 103 20 89 1 000
2009 100.0 100.0 100.0 100.0 100.0 100.0 100.0 100.0 100.0 100.0 100.0 100.02010 95.1 95.8 108.6 100.9 90.8 96.0 97.3 104.4 104.2 97.5 53.6 94.12011 99.9 100.1 107.4 88.3 97.0 116.5 114.7 111.5 102.6 97.8 65.1 100.52012 100.8 97.2 117.5 95.4 90.7 106.8 88.5 106.9 82.4 101.1 60.7 93.32013 97.9 93.1 86.1 94.4 104.8 104.0 91.1 121.6 76.0 100.7 54.1 91.1
2014+ 98.3 97.2 80.4 82.1 104.4 101.3 90.4 131.1 69.8 61.8 68.5 91.4
2014 January 86.0 65.7 47.6 82.7 98.8 101.8 89.2 111.5 63.9 60.9 43.6 78.8February 92.8 88.8 64.7 87.1 104.7 114.3 100.7 122.8 76.6 67.5 56.8 90.2March 87.6 83.2 61.3 93.6 96.6 102.5 90.7 109.7 69.7 60.9 48.5 83.7
April 93.6 92.7 53.5 92.7 108.9 98.4 91.5 109.3 73.7 65.0 47.3 86.6May 94.5 87.6 66.8 82.4 92.7 95.7 86.6 115.3 65.3 56.5 56.8 84.4June 98.9 97.9 93.6 88.0 99.5 108.2 89.8 139.2 68.0 58.1 63.3 91.5
July 103.9 115.8 120.3 61.0 114.2 105.1 92.6 148.0 69.5 59.2 66.7 95.0August 95.6 113.6 117.4 64.4 112.3 105.4 88.7 143.7 70.1 58.0 65.6 91.9September 117.4 124.7 113.5 85.2 113.6 107.7 87.6 155.2 69.4 60.5 72.4 101.4
October+ 119.5 95.5 99.2 89.9 143.0 79.3 89.3 142.3 74.8 65.0 59.5 96.4November+ 98.1 109.4 84.4 96.5 163.7 101.1 87.2 153.6 78.3 67.7 97.2 98.6December+ 105.7 107.9 72.4 81.7 92.5 97.6 89.3 132.0 65.9 58.2 63.1 91.8
2015 January+ 97.3 109.0 67.1 79.1 84.3 97.4 89.7 135.0 66.1 58.6 64.8 89.6February+ 121.3 121.7 75.3 97.9 179.0 107.3 97.5 153.2 73.5 65.6 74.0 105.7March+ 105.4 110.3 67.8 91.0 145.7 96.3 85.6 141.0 67.0 59.6 68.0 94.1
April 101.4 114.7 69.2 88.4 152.4 99.5 84.9 146.5 70.1 61.5 69.2 94.5May 104.4 110.9 67.2 85.6 160.2 95.7 82.9 141.1 68.2 59.9 67.0 93.4June 102.4 113.7 67.7 91.2 171.3 97.3 84.1 145.7 70.7 62.5 69.8 95.1
2014 Jan-June 92.1 85.3 63.1 87.7 90.2 103.5 91.6 116.8 69.4 61.4 52.3 85.62015 Jan-June 105.1 113.3 69.0 88.7 144.7 98.9 87.3 143.6 69.2 61.2 68.8 95.3
+ Figures are provisional
- 57 -
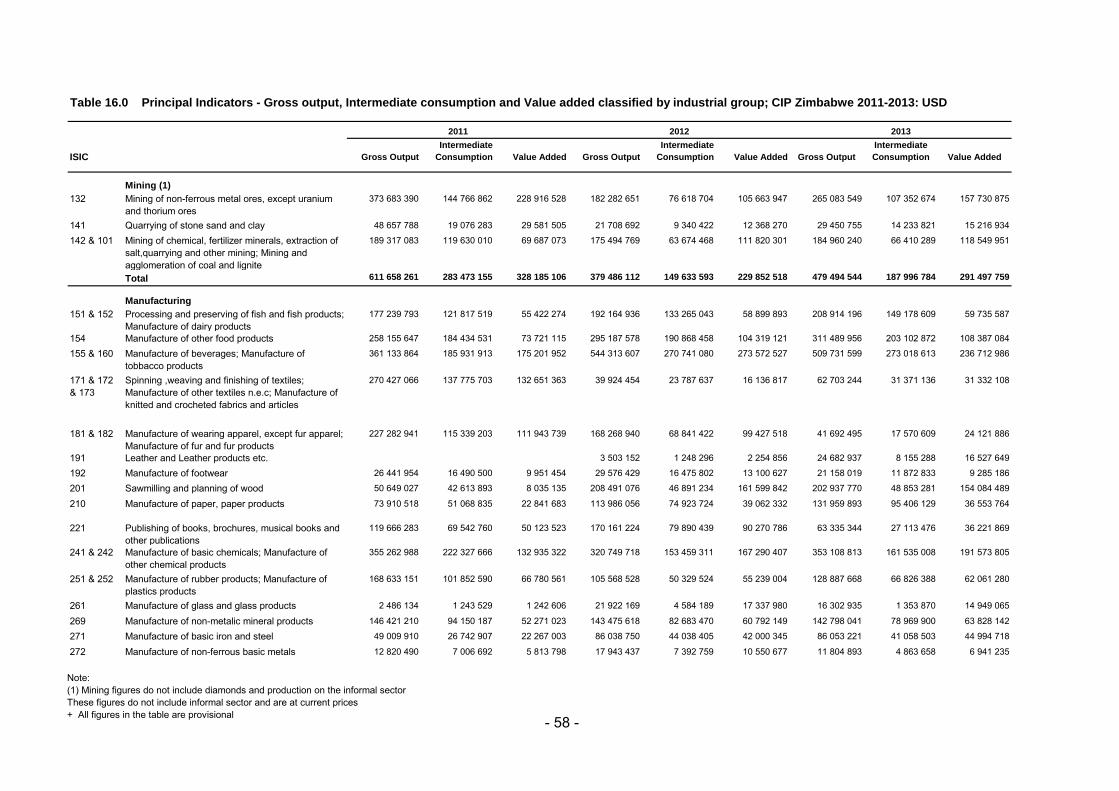
Table 16.0 Principal Indicators - Gross output, Intermediate consumption and Value added classified by industrial group; CIP Zimbabwe 2011-2013: USD
ISIC Gross Output
Intermediate
Consumption Value Added Gross Output
Intermediate
Consumption Value Added Gross Output
Intermediate
Consumption Value Added
Mining (1)
132 Mining of non-ferrous metal ores, except uranium and thorium ores
373 683 390 144 766 862 228 916 528 182 282 651 76 618 704 105 663 947 265 083 549 107 352 674 157 730 875
141 Quarrying of stone sand and clay 48 657 788 19 076 283 29 581 505 21 708 692 9 340 422 12 368 270 29 450 755 14 233 821 15 216 934
142 & 101 Mining of chemical, fertilizer minerals, extraction of salt,quarrying and other mining; Mining and agglomeration of coal and lignite
189 317 083 119 630 010 69 687 073 175 494 769 63 674 468 111 820 301 184 960 240 66 410 289 118 549 951
Total 611 658 261 283 473 155 328 185 106 379 486 112 149 633 593 229 852 518 479 494 544 187 996 784 291 497 759
Manufacturing
151 & 152 Processing and preserving of fish and fish products; Manufacture of dairy products
177 239 793 121 817 519 55 422 274 192 164 936 133 265 043 58 899 893 208 914 196 149 178 609 59 735 587
154 Manufacture of other food products 258 155 647 184 434 531 73 721 115 295 187 578 190 868 458 104 319 121 311 489 956 203 102 872 108 387 084
155 & 160 Manufacture of beverages; Manufacture of tobbacco products
361 133 864 185 931 913 175 201 952 544 313 607 270 741 080 273 572 527 509 731 599 273 018 613 236 712 986
171 & 172 & 173
Spinning ,weaving and finishing of textiles; Manufacture of other textiles n.e.c; Manufacture of knitted and crocheted fabrics and articles
270 427 066 137 775 703 132 651 363 39 924 454 23 787 637 16 136 817 62 703 244 31 371 136 31 332 108
181 & 182 Manufacture of wearing apparel, except fur apparel; Manufacture of fur and fur products
227 282 941 115 339 203 111 943 739 168 268 940 68 841 422 99 427 518 41 692 495 17 570 609 24 121 886
191 Leather and Leather products etc. 3 503 152 1 248 296 2 254 856 24 682 937 8 155 288 16 527 649
192 Manufacture of footwear 26 441 954 16 490 500 9 951 454 29 576 429 16 475 802 13 100 627 21 158 019 11 872 833 9 285 186
201 Sawmilling and planning of wood 50 649 027 42 613 893 8 035 135 208 491 076 46 891 234 161 599 842 202 937 770 48 853 281 154 084 489
210 Manufacture of paper, paper products 73 910 518 51 068 835 22 841 683 113 986 056 74 923 724 39 062 332 131 959 893 95 406 129 36 553 764
221 Publishing of books, brochures, musical books and other publications
119 666 283 69 542 760 50 123 523 170 161 224 79 890 439 90 270 786 63 335 344 27 113 476 36 221 869
241 & 242 Manufacture of basic chemicals; Manufacture of other chemical products
355 262 988 222 327 666 132 935 322 320 749 718 153 459 311 167 290 407 353 108 813 161 535 008 191 573 805
251 & 252 Manufacture of rubber products; Manufacture of plastics products
168 633 151 101 852 590 66 780 561 105 568 528 50 329 524 55 239 004 128 887 668 66 826 388 62 061 280
261 Manufacture of glass and glass products 2 486 134 1 243 529 1 242 606 21 922 169 4 584 189 17 337 980 16 302 935 1 353 870 14 949 065
269 Manufacture of non-metalic mineral products 146 421 210 94 150 187 52 271 023 143 475 618 82 683 470 60 792 149 142 798 041 78 969 900 63 828 142
271 Manufacture of basic iron and steel 49 009 910 26 742 907 22 267 003 86 038 750 44 038 405 42 000 345 86 053 221 41 058 503 44 994 718
272 Manufacture of non-ferrous basic metals 12 820 490 7 006 692 5 813 798 17 943 437 7 392 759 10 550 677 11 804 893 4 863 658 6 941 235
2012 20132011
Note:(1) Mining figures do not include diamonds and production on the informal sectorThese figures do not include informal sector and are at current prices+ All figures in the table are provisional - 58 -

Table 16.0 Principal Indicators - Gross output, Intermediate consumption and Value added classified by industrial group; CIP Zimbabwe 2011-2013: USD
ISIC Gross Output
Intermediate
Consumption Value Added Gross Output
Intermediate
Consumption Value Added Gross Output
Intermediate
Consumption Value Added
2012 20132011
281 Manufacture of structural metal products, tanks, reservoirs and steam generators
236 390 614 95 848 862 140 541 752 361 811 091 185 805 177 176 005 915 140 918 169 43 820 569 97 097 600
291 & 323 & 333
Manufacture of general purpose machinery; Manufacture of radio, television and communication equipment and apparatus; Manufacture of watches and clocks
128 657 388 42 658 119 85 999 269 88 307 906 57 858 816 30 449 090 142 220 108 86 859 041 55 361 067
311 Manufacture of electric motors , generators and transformers
40 566 420 24 002 796 16 563 624 57 975 417 32 655 346 25 320 071 60 670 221 36 783 473 23 886 748
331 & 352 & 353 & 359
Railroad equipment,Electrical machinery apparatus,appliances and supplies,aircrafp machinery and other transport equipment
- - - 5 635 598 2 517 441 3 118 157 2 820 266 1 453 498 1 366 768
341 Manufacture of bodies (coachwork) for motor vehicles; Manufacture of trailers and semi-trailers
61 837 970 31 707 251 30 130 719 127 080 504 51 028 177 76 052 326 61 078 466 25 950 307 35 128 159
361 Manufacture of furniture 93 523 822 60 578 176 32 945 646 89 772 693 48 862 822 40 909 871 114 097 212 62 222 162 51 875 050
369 Manufacture of jewellery and related articles 62 610 285 39 036 677 23 573 608 49 220 811 22 195 222 27 025 589 25 869 423 8 857 196 17 012 228
Total 2 923 127 475 1 672 170 308 1 250 957 168 3 241 079 691 1 650 343 792 1 590 735 899 2 865 234 887 1 486 196 415 1 379 038 472
Electricity and Water
401 & 410Production, collection and distribution of electricity: Collection, purification and distribution of water
454 338 358 145 008 548 309 329 810 114 508 386 59 898 847 54 609 539 114 508 386 59 898 847 54 609 539
Construction
451 Site preparation 91 344 728 49 686 808 41 657 920 169 852 676 151 573 610 18 279 066 420 103 814 331 446 192 88 657 622
452 Building of complete construction parts of civil engineering
25 023 693 15 345 959 9 677 734 111 669 920 33 901 215 77 768 704 197 704 112 60 199 824 137 504 288
Total 116 368 421 65 032 767 51 335 654 281 522 596 185 474 825 96 047 771 617 807 926 391 646 016 226 161 910
Grand Total 4 105 492 515 2 165 684 777 1 939 807 738 4 016 596 785 2 045 351 058 1 971 245 727 4 077 045 742 2 125 738 062 1 951 307 680
Note:(1) Mining figures do not include diamonds and production on the informal sectorThese figures do not include informal sector and are at current prices+ All figures in the table are provisional - 59 -

Table 17.1 Railways Analysis of Revenue, in thousand US$; 2010 - July 2015
Period
Coaching Agricul- Basic Other Misce- Total Road Catering Totalservices tural metal goods laneous motor and revenue
produce Coal Other Total products revenue services otherrevenue
2010 3 910.9 27 801.5 23 873.6 13 026.7 36 900.3 3 314.3 33 862.3 6 878.8 112 668.1 0 0 112 668.12011 4 652.5 8 876.5 22 895.4 11 526.4 34 421.8 3 192.8 33 292.6 7 554.4 91 990.6 0 0 91 990.62012 7 597.7 14 760.6 27 152.4 8 979.3 36 131.7 2 848.5 26 660.9 4 621.9 92 621.3 0 0 92 621.32013 4 094.4 14 991.2 27 730.2 6 527.4 34 257.6 2 646.3 29 752.9 3 153.9 88 896.4 0 896.0 89 792.42014 3 061.2 12 083.3 21 706.6 6 997.2 27 121.2 4 428.0 33 219.4 2 153.8 75 864.6 0 0 75 864.62015 January - July 1 493.2 9 185.4 16 533.8 3 578.7 20 112.4 1 860.2 22 360.2 1 589.3 56 600.6 0 0 56 600.7
2014 January 254.3 1 232.1 1 704.0 500.4 2 204.3 332.7 2 176.1 200.9 6 400.5 0 0 6 400.5February 258.9 1 479.5 2 991.3 612.4 3 603.7 338.6 6 936.6 188.4 12 805.7 0 0 12 805.7March 294.6 1 256.1 2 832.5 708.1 3 540.7 402.1 2 169.6 180.6 7 843.6 0 0 7 843.6
April 358.2 939.2 1 490.0 259.4 1 749.4 210.3 3 047.5 161.7 6 466.3 0 0 6 466.3May 258.0 1 068.0 2 770.6 662.3 3 432.9 334.0 2 738.0 297.3 8 128.1 0 0 8 128.1June 236.5 1 953.1 2 649.6 980.8 3 630.4 369.6 2 932.0 210.9 9 332.5 0 0 9 332.5
July 203.2 1 860.4 2 813.5 724.5 3 537.9 427.6 3 312.4 129.4 9 470.9 0 0 9 470.9August 275.9 1 531.6 2 355.9 283.8 2 639.7 423.3 2 764.7 104.0 7 739.3 0 0 7 739.3September 240.2 1 395.3 2 113.1 534.0 2 647.0 346.8 3 479.6 151.3 8 260.2 0 0 8 260.2
October 223.9 1 637.9 2 602.5 499.7 3 102.2 432.1 3 021.2 189.8 8 607.1 0 0 8 607.1November 189.7 1 421.5 2 283.5 549.0 2 832.5 453.5 3 127.2 161.6 8 186.0 0 0 8 186.0December 267.9 763.4 2 099.2 682.9 2 782.2 357.3 7 142.5 177.7 7 677.6 0 0 7 677.6
2015 January 221.4 1 194.7 2 982.6 267.6 3 250.2 264.6 3 235.1 207.3 8 373.4 0 0 8 373.4February 164.8 726.8 2 776.2 514.1 3 290.2 395.3 5 210.4 275.5 10 063.0 0 0 10 063.0March 181.7 954.3 2 317.1 482.2 2 799.3 276.4 3 712.5 250.4 8 174.5 0 0 8 174.5
April 215.6 1 253.1 2 384.8 516.0 2 900.8 272.7 3 294.2 224.0 8 160.5 0 0 7 106.7May 208.4 1 446.7 1 649.9 490.5 2 140.4 183.9 1 634.5 77.6 5 691.5 0 0 5 691.6June 301.8 1 943.2 2 198.4 825.6 3 024.0 243.2 2 678.7 309.1 8 500.0 0 0 8 500.0
July 199.6 1 666.6 2 224.7 482.7 2 707.4 224.0 2 594.9 245.3 7 637.8 0 0 7 637.8
Source : National Railways of Zimbabwe (NRZ)
Rail Traffic
Minerals and ores
- 60 -

Table 17.2 Airport Traffic, Excluding Transit Passengers
Overfliers
Period Flights in/out Passengers Freight# Tonne Flights in/out Passengers
Freight Tonne Flights in/out Passengers
Freight Tonne Flights in/out Passengers
Freight Tonne Flights in/out Passengers
Freight Tonne Total
2011 3 647 64 123 - 16 736 746 015 6 988 175 858 - 8 955 16 271 - 36 326 1 002 267 19 322 24 7782012 2 996 49 161 - 14 956 719 017 - 6 918 180 704 - 9 591 14 185 - 33 062 963 067 17 196 27 0252013 4 030 90 464 - 17 947 871 795 - 6 924 219 041 - 7 252 13 511 - 36 153 1 194 811 18 362 -2014 4 289 122 238 - 18 700 949 865 - 7 100 237 056 - 7 675 14 705 - 37 764 1 323 864 17 362 -
2014 1st Quarter 951 25 494 - 4 088 204 620 - 1 303 47 754 - 1 011 1 904 - 7 353 279 772 3 072 -2nd Quarter 1 073 29 107 - 4 693 230 810 - 1 834 55 732 - 2 087 3 348 - 9 687 318 997 5 072 -3rd Quarter 1 225 34 099 - 5 268 268 452 - 2 231 73 365 - 2 756 5 587 - 11 480 381 503 5 442 -4th Quarter 1 040 33 538 - 4 651 245 983 - 1 732 60 205 - 1 821 3 866 - 9 244 343 592 3 777 -
2014 January 342 8 779 - 1 349 73 589 - 413 15 343 - 332 699 - 2 436 98 410 1 017 -February 296 7 785 - 1 280 62 023 - 390 14 684 - 260 455 - 2 226 84 947 917 -March 313 8 930 - 1 459 69 008 - 500 17 727 - 419 750 - 2 691 96 415 1 137 -
April 357 11 196 - 1 456 81 680 - 540 18 873 - 603 1 111 - 2 956 112 860 1 170 -May 353 9 037 - 1 574 76 903 - 587 18 862 - 655 1 118 - 3 169 105 920 1 830 -June 363 8 874 - 1 663 72 227 - 707 17 997 - 829 1 119 - 3 562 100 217 2 072 -
July 439 11 095 ` 1 698 83 594 ` 644 21 906 ` 871 1 459 ` 3 652 118 054 2 017 -August 385 12 371 - 1 832 102 335 - 849 28 187 - 1 004 2 271 - 4 070 145 164 1 745 -September 401 10 633 - 1 738 82 523 - 738 23 272 - 881 1 857 - 3 758 118 285 1 680 -
October 384 10 676 - 1 700 73 300 - 675 23 370 - 935 1 774 - 3 694 109 120 1 347 -November 332 9 805 - 1 552 76 971 - 574 17 708 - 510 1 083 - 2 968 105 567 1 210 -December 324 13 057 - 1 399 95 712 - 483 19 127 - 376 1 009 - 2 582 128 905 1 219 -
2015 January 320 9 157 - 1 358 76 774 - 428 14 885 - 293 588 - 2 399 101 404 892 -
February 277 8 363 - 1 331 64 576 - 431 14 642 - 393 674 - 2 432 88 255 911 -March 382 11 572 - 1 550 80 587 - 502 18 524 - 486 949 - 2 920 111 632 1 029 -
April 374 14 178 - 1 565 93 617 - 518 18 801 - 522 1 211 - 2 979 127 807 1 247 -May 439 12 638 - 1 761 84 618 - 664 19 644 - 587 1 420 - 3 451 118 320 1 864 -June 410 12 018 - 1 851 83 130 - 691 18 111 - 912 1 658 - 3 864 114 917 2 105 -
July 428 14 425 ` 1 906 90 356 ` 646 21 107 ` 800 1 765 ` 3 780 127 653 2 107 `August 427 16 017 - 2 004 104 193 - 846 26 994 - 975 1 877 - 4 252 149 081 1 711 -September 444 13 566 - 1 924 91 368 - 711 23 619 - 1 071 2 097 - 4 150 130 650 1 516 -
October 408 13 901 - 1 930 89 368 - 665 24 497 - 859 1 822 - 3 862 129 588 - -November -
2014 Jan-October 3 633 99 376 - 15 749 777 182 - 6 043 200 221 - 6 789 14 350 - 32 214 1 091 129 14 933 -2015 Jan-October 3 909 125 835 - 17 180 858 587 - 6 102 200 824 - 6 898 14 061 - 34 089 1 199 307 13 383 -
Note: # Freight figures are a consolidation of cargo and mail tonnage - Data not availableData for Victoria Falls Airport was aggregated in others(up to 2008) but from 2009 its a stand alone.Source : Civil Aviation Authority of Zimbabwe (CAAZ)
Bulawayo ( Joshua Mqabuko Nkomo International Airport) Harare International Airport Victoria Falls International Airport Other Total
- 61 -

Table 18.0 Assets of Commercial Banks, US$ Million
Bond Foreign Balances Balances Balances Trade Treasury Agric Total Other Loans Contingent Other Non TotalCoins Notes and with the with at Bills Bills PEs Liquid Balances and Assets Assets Financial
coins Reserve Other Foreign Assets with RBZ Advances AssetsEnd of at Banks Bank Banks Banks 2014 January 0 356.9 395.3 134.1 253.1 153.0 119.2 5.4 1 417.0 27.9 2 866.4 516.1 362.2 353.9 5 543.5
February 0 334.3 130.5 285.0 195.0 193.2 5.4 1 143.4 32.8 2 718.1 534.5 502.9 351.1 5 282.8March 0 304.6 354.1 147.4 280.3 165.9 255.2 5.4 1 512.9 28.7 2 737.9 522.7 538.8 349.7 5 690.7
April 0 353.3 367.8 154.4 274.9 205.7 247.0 5.4 1 608.5 32.5 2 844.6 534.1 345.3 348.6 5 713.6May 0 327.8 421.1 120.5 372.8 211.5 241.7 5.4 1 700.8 27.5 2 836.8 591.4 366.2 347.1 5 869.8June 0 347.1 404.7 166.4 338.1 198.0 261.9 0.0 1 716.2 16.2 2 863.2 607.8 362.9 346.1 5 912.4
July 0 347.1 321.3 176.7 276.3 186.0 246.2 0.0 1 553.6 15.4 2 940.4 597.5 347.4 345.6 5 799.9August 0 360.7 424.5 178.5 243.5 173.9 237.5 0.0 1 618.6 15.5 2 949.1 609.5 353.9 346.4 5 893.0September 0 255.6 636.8 183.0 158.8 176.0 253.9 0.0 1 664.1 4.1 2 949.4 624.6 371.5 341.5 5 955.2
October 0 226.1 597.7 175.0 205.5 180.3 260.1 0.0 1 644.7 15.6 2 938.4 594.4 369.0 341.8 5 903.9November 0 258.9 556.7 169.1 157.5 178.5 281.6 0.0 1 602.3 4.2 2 951.6 597.5 369.4 341.1 5 866.1December 0.4 309.5 465.7 167.6 151.9 184.3 285.4 0.0 1 564.8 4.1 2 758.6 606.2 343.7 356.0 5 633.4
2015 January 0.6 222.5 527.9 159.0 182.6 163.6 325.7 0.0 1 581.9 21.4 2 796.8 557.7 360.2 366.1 5 684.1February 0.4 216.7 501.2 149.6 183.2 128.6 344.6 0.0 1 524.3 17.9 2 792.5 564.8 325.3 356.8 5 581.6March 0.6 246.9 461.4 147.8 222.2 121.6 338.0 5.4 1 543.9 15.5 2 925.5 527.3 352.5 362.0 5 726.7
April 0.7 205.5 492.8 158.6 218.5 112.0 335.1 5.4 1 528.6 18.2 2 967.1 527.1 364.2 385.4 5 790.6May 0.7 237.3 495.6 135.1 181.0 101.4 622.7 5.5 1 779.3 18.2 2 922.7 525.7 434.2 384.3 6 064.4June 0.8 245.7 570.9 155.1 144.7 90.8 750.1 4.4 1 962.5 28.8 2 872.6 498.4 351.0 386.2 6 099.5
July 0.9 226.0 544.9 137.3 135.3 86.3 770.0 0.0 1 900.7 28.8 2 815.0 504.1 361.1 388.8 5 998.5August 1.0 234.0 523.7 104.3 194.7 76.1 786.5 5.1 1 925.4 28.8 2 810.1 535.2 339.9 390.5 6 029.9September 1.0 255.2 551.8 114.8 192.9 63.7 764.9 5.1 1 949.4 28.0 2 844.1 599.2 404.6 392.3 6 217.7
October 0.9 215.7 536.1 143.7 171.5 83.5 808.3 5.2 1 964.9 26.7 2 884.2 599.3 350.6 391.5 6 217.0November 0.1 258.0 538.9 175.2 148.1 151.1 331.3 0.0 1 602.7 1.0 2 742.0 567.5 336.7 307.6 5 557.4December
Note: - Data not availableSource : Reserve Bank of Zimbabwe
Liquid AssetsSecurities
- 62 -

Table 18.1 Liabilities of Commercial Banks, US$ Million
End of DemandSavings &
short term Long termTotal
DepositsForeign
Liabilities RBZOther
BanksCapital and
ReservesContingent
LiabilitiesOther
LiabilitiesTotal
Liabilities
Of which Liabilities
to the public
2014 July 2 130.4 892.9 606.6 3 629.9 560.8 0 39.5 571.5 597.5 400.6 5 799.8 3 629.9August 2 202.3 963.1 539.9 3 705.3 552.7 0 43.5 580.7 609.5 401.2 5 892.9 3 705.3September 2 191.0 1 011.1 562.6 3 764.7 548.9 0 59.5 544.8 624.6 412.7 5 955.2 3 764.7
October 2 260.8 1 015.1 509.9 3 785.8 506.8 0 47.4 543.3 594.4 426.0 5 903.7 3 785.8November 2 231.8 943.4 526.5 3 701.7 509.4 0 90.6 541.8 597.5 425.0 5 866.0 3 701.7December 2 101.6 975.8 453.2 3 530.6 484.0 0 81.4 713.6 606.2 217.5 5 633.3 3 530.6
2015 January 2 056.2 996.2 561.7 3 614.1 470.1 0 79.5 728.5 557.7 234.3 5 684.2 3 614.1February 2 079.6 876.1 611.6 3 567.3 426.6 0 75.6 720.3 564.8 227.0 5 581.6 3 567.3March 2 139.3 940.4 513.3 3 593.0 461.1 0 101.9 749.7 527.3 293.6 5 726.6 3 593.0
April 2 098.7 943.5 629.8 3 672.0 448.9 0 103.4 747.4 527.1 291.8 5 790.6 3 672.0May 2 131.8 1 015.3 615.3 3 762.4 574.7 0 82.4 814.7 525.7 304.4 6 064.3 3 762.4June 2 213.2 1 021.9 593.5 3 828.6 560.2 0.8 103.1 814.9 498.4 293.2 6 099.2 3 828.6
July 2 166.4 889.7 732.5 3 788.6 478.9 0.8 88.2 813.0 504.1 325.0 5 998.6 3 788.6August 2 266.7 790.9 723.1 3 780.7 490.7 0.0 83.4 825.7 535.2 313.9 6 029.6 3 780.7September 2 276.7 967.6 648.7 3 892.9 504.0 0.0 72.0 828.1 599.2 321.5 6 217.7 3 892.9
October 2 259.9 909.3 667.8 3 837.0 494.3 0.0 112.2 841.2 599.3 322.9 6 217.0 3 837.0November 2 128.3 885.6 514.1 3 528.0 454.4 0.0 87.0 699.0 567.5 221.6 5 557.4 3 528.0December
Note: - Data not availableSource: Reserve Bank of Zimbabwe
DepositsAmount Owing
to
- 63 -

Table 18.2 Advances of Commercial Banks by Sector, US$ Thousands
End of Agriculture
Construction
Communication Distribution
Financial &
Investiments
Financial Organizati
onsManufactur
ing Mining Services Transport IndividualsConglome
rates/1 Total
2014 July 575 645.3 43 055.0 28 090.8 480 483.6 6 359.2 27 284.9 428 611.4 206 052.3 479 384.6 49 260.4 507 930.0 46 148.1 2 878 305.6August 548 866.7 56 886.1 38 891.3 498 696.8 54 387.2 110 618.5 422 942.5 221 099.2 430 156.3 48 167.0 474 060.2 37 230.9 2 942 002.7September 539 818.8 51 349.1 29 191.8 493 610.7 51 999.0 109 975.0 428 697.3 201 791.6 451 117.2 45 100.0 539 108.1 36 708.6 2 978 467.2
October 530 544.7 62 891.8 55 922.5 507 936.4 50 701.1 101 818.5 436 519.1 196 491.0 413 443.5 39 088.3 520 437.0 5 799.4 2 921 593.3November 574 859.5 58 780.5 46 419.5 460 989.3 50 008.6 120 510.4 453 924.5 208 418.3 413 410.7 45 289.6 540 638.4 5 976.9 2 979 226.2December 565 840.1 46 298.5 42 604.8 437 975.3 47 805.8 88 485.5 478 895.5 220 501.3 481 497.5 43 449.8 543 038.5 5 957.7 3 002 350.3
2015 January 541 656.5 46 681.6 39 906.8 445 656.6 21 454.5 131 350.1 466 896.6 207 686.6 452 817.5 47 945.7 557 066.9 1 401.2 2 960 520.6February 538 722.0 42 062.8 47 395.1 446 647.8 21 790.0 117 681.6 461 237.6 214 420.4 463 884.6 48 357.0 544 838.5 1 416.2 2 948 453.6March 549 118.0 42 010.1 44 087.2 448 278.7 76 302.3 110 180.3 473 978.1 203 327.9 466 104.7 48 938.0 550 140.6 1 339.6 3 013 805.5
April 556 457.4 30 687.3 44 546.9 451 852.9 65 696.1 72 653.7 457 797.1 202 418.2 518 353.6 47 653.8 551 662.8 990.1 3 000 769.9May 577 258.6 31 400.7 44 839.1 456 652.1 64 792.3 75 658.2 460 700.3 192 377.2 545 363.4 50 612.9 561 058.3 1 034.4 3 061 747.5June 576 485.1 29 649.0 56 936.5 463 750.7 20 117.9 91 678.4 407 949.0 181 512.7 512 108.4 40 839.7 590 917.1 965.9 2 972 910.4
July 589 866.7 27 447.9 56 456.1 474 568.7 21 025.9 92 335.6 418 612.0 186 238.8 416 928.9 41 201.6 579 629.0 941.4 2 905 252.6August 580 775.3 28 148.8 58 618.6 460 451.4 22 509.2 105 466.9 411 831.6 176 732.7 440 470.4 41 154.5 571 926.0 886.9 2 898 972.3September 598 429.9 28 307.9 59 213.0 443 604.1 22 711.9 102 015.0 421 228.0 174 144.2 467 804.5 43 051.0 569 250.1 929.5 2 930 689.1
October 609 537.2 33 868.4 53 813.7 466 727.6 21 566.0 104 959.3 447 136.6 141 401.6 484 254.8 40 156.6 573 330.4 907.7 2 977 659.9November 650 547.2 28 696.7 49 784.9 440 864.2 12 868.9 104 288.1 428 393.1 152 136.9 444 207.8 40 760.5 543 920.4 696.2 2 897 164.9December
Note: 1. These are large corporation with business operations covering across a number of sectorsSource: Reserve Bank of Zimbabwe
- 64 -

Table 19.0 Assets of Accepting Houses, US$ Million
Securities
Bond Foreign Balances Balances Balances Trade Treasury Agris PesTotal Other Loans & Contingent Other Non-FinancialTotal
Coins Notes & with with at Bills Bills Liquid Balances Advances Assets Assets AssetsCoins at RBZ Other Banks Foreign Assets with
End of Banks Banks RBZ
2014 January 0 0.10 0.50 0.00 0.20 1.80 0.00 0.00 2.60 0.00 81.30 10.00 23.50 34.70 152.10February 0 0.20 0.40 0.10 0.10 1.80 0.00 0.00 2.60 0.00 77.60 9.00 24.10 34.60 147.90March 0 0.10 0.10 0.10 0.10 1.60 0.00 0.00 2.00 0.00 53.20 8.70 21.80 32.50 118.20
April 0 0.10 0.40 0.20 0.30 1.60 0.00 2.60 5.20 75.20 8.50 22.20 32.40 140.90 284.40May 0 0.20 0.40 0.00 0.10 0.30 0.00 0.90 1.90 68.70 0.10 14.60 30.30 114.60 230.20June 0 0.20 0.20 0.10 0.10 0.60 0.00 0.00 1.20 0.00 66.80 0.10 14.70 29.60 112.40
July 0 0.20 0.30 0.00 0.10 0.30 0.00 0.00 0.90 0.00 66.90 0.10 12.90 28.70 109.50August 0 0.20 0.70 0.00 0.10 0.30 0.00 0.00 1.30 0.00 64.40 0.00 19.40 23.90 109.00September 0 0.40 0.20 0.00 0.10 0.30 0.00 0.00 1.00 0.00 65.90 0.10 18.90 19.70 105.60
October 0 0.70 0.70 0.00 0.10 0.30 0.00 0.00 1.80 0.00 68.30 0.10 10.80 25.90 106.90November 0 0.60 0.10 0.00 0.10 0.30 0.00 0.00 1.10 0.00 67.10 0.10 12.40 25.80 106.50December 0 0.90 0.40 0.00 0.10 0.30 0.00 0.00 1.70 0.00 63.60 0.10 10.00 24.60 100.00
2015 January 0 0.60 0.30 0.00 0.10 1.60 0.00 0.00 2.60 0.00 70.20 8.30 19.00 23.70 123.80February 0 0.40 0.20 0.10 0.10 1.60 0.00 0.00 2.40 0.00 72.00 8.30 19.30 23.60 125.60March 0 0.40 0.10 0.00 0.10 1.50 0.00 0.00 2.10 0.00 73.30 8.20 18.50 23.40 125.50
April 0 0.30 0.10 0.00 0.10 0.20 0.00 0.00 0.70 0.00 66.70 0.00 10.30 21.30 99.00May 0 0.40 0.00 0.00 0.00 0.20 0.00 0.00 0.60 0.00 67.90 0.00 9.60 21.20 99.30June 0 0.30 0.00 0.00 0.00 0.40 0.00 0.00 0.70 0.00 68.10 0.00 9.70 21.10 99.60
July 0 0.20 1.60 0.00 0.00 0.20 0.00 0.00 2.00 0.00 67.80 0.00 9.20 21.00 100.00August 0 0.10 1.80 0.00 0.00 0.20 0.00 0.00 2.00 0.00 60.00 0.00 9.30 28.10 99.40September 0 0.10 2.20 0.00 0.00 0.20 0.00 0.00 2.50 0.00 59.20 0.00 9.20 28.00 98.90
October 0 0.10 2.10 0.00 0.00 0.20 0.00 0.00 2.40 0.00 59.40 0.00 9.10 27.80 98.80November 0 0.60 0.10 0.00 0.10 0.03 0.00 0.00 1.00 0.00 67.10 0.10 12.40 25.80 106.30December
Note: - Data not availableSource: Reserve Bank of Zimbabwe
Liquid Assets
- 65 -

Table 19.1 Liabilities of Accepting Houses, US$ Million
Of whichCapital Contingent Other Total Liabilities
Demand Savings Long-term Total Foreign RBZ Other and Liabilities Liabilities Liabilities to theand short Deposits Liabilities Banks Reserves Public
End of term
2014 July 42.6 33.8 0.0 76.4 0.0 0.0 0.0 - 8.7 0.1 41.8 109.6 76.4August 36.4 40.4 0.0 76.8 0.0 0.0 0.0 - 7.8 0.0 40.0 109.0 76.8September 40.9 33.9 0.0 74.8 0.0 0.0 0.0 - 7.6 0.1 38.4 105.7 74.8
October 39.9 33.7 0.0 73.6 0.0 0.0 0.0 - 9.6 0.1 42.8 106.9 73.6November 39.4 33.3 0.0 72.7 0.0 0.0 0.0 - 10.9 0.1 44.4 106.3 72.7December 36.9 31.2 0.0 68.1 0.0 0.0 0.0 - 17.9 0.1 49.7 100.0 68.1
2015 January 39.0 40.9 0.0 79.9 11.7 0.0 0.0 - 47.0 8.3 70.7 123.6 79.9February 38.4 40.4 0.0 78.8 11.7 0.0 0.0 - 48.7 8.3 75.6 125.7 78.8March 68.6 12.1 0.0 80.7 12.0 0.0 0.0 - 50.7 8.2 75.2 125.4 80.7
April 63.9 0.0 0.0 63.9 0.0 0.0 0.0 - 27.5 0.0 62.4 98.8 63.9May 63.9 0.0 0.0 63.9 0.0 0.0 0.0 - 28.8 0.0 64.2 99.3 63.9June 62.9 0.0 0.0 62.9 0.0 0.0 0.0 - 28.9 0.0 65.6 99.6 62.9
July 62.9 0.0 0.0 62.9 0.0 0.0 0.0 - 27.8 0.0 64.8 99.9 62.9August 62.9 0.0 0.0 62.9 0.0 0.0 0.0 - 14.9 0.0 51.3 99.4 62.9September 62.2 0.0 0.0 62.2 0.0 0.0 0.0 - 15.3 0.0 52.0 98.9 62.2
October 61.9 0.0 0.0 61.9 0.0 0.0 0.0 - 16.4 0.0 53.2 98.8 61.9November 39.4 33.3 0.0 72.7 0.0 0.0 0.0 - 10.9 0.1 44.4 106.3 72.7December
Source: Reserve Bank of Zimbabwe
Deposits Amounts owing to
- 66 -

Table 19.2 Assets of Building Societies, US$ Million
Bond Coins
Notes and
Coins at Bank
Balances with other
BanksNostro
Balances TradeTreasury
BillsAgris
Pes Total
Other Balances
with RBZ/1
Mortgage Advances
Other Advances
Other Assets
Non-Financial
AssetsTotal
Assets
2014 January 0.0 30.9 147.5 0.0 0.2 40.0 0.0 218.6 0.0 384.5 136.4 64.4 125.3 929.2February 0.0 30.2 165.0 0.0 0.2 40.0 0.0 235.3 0.0 385.8 132.0 65.4 125.4 943.9March 0.0 47.5 166.2 0.0 0.2 40.0 0.0 253.8 0.0 390.4 132.1 68.8 125.0 970.1
April 0.0 45.2 161.0 0.0 0.2 40.0 0.0 246.5 0.0 401.8 132.4 76.6 124.7 982.0May 0.0 47.7 190.7 0.0 0.2 40.0 0.0 278.6 0.0 394.0 147.0 82.7 124.3 1 026.6June 0.0 39.5 187.9 0.0 0.0 40.0 0.0 267.4 0.0 400.0 150.4 84.0 124.4 1 026.2July 0.0 40.6 180.9 0.0 0.0 40.0 0.0 261.5 0.0 431.8 159.4 84.1 124.4 1 061.2August 0.0 17.8 219.8 0.0 0.0 51.4 0.0 289.1 0.0 442.4 166.5 86.4 124.2 1 108.6September 0.0 51.2 183.1 0.0 0.0 51.4 0.0 285.7 0.0 452.1 173.8 95.6 123.8 1 131.0
October 0.0 37.1 199.8 0.0 0.0 51.7 0.0 288.6 0.0 483.1 179.7 102.2 124.0 1 177.6November 0.0 53.2 217.5 0.0 0.0 32.8 0.0 303.5 0.0 512.4 169.3 109.0 123.5 1 217.7December 0.1 47.0 211.2 0.0 0.2 52.6 0.0 310.9 0.0 512.9 169.0 102.9 125.3 1 221.0
2015 January 0.1 37.3 196.0 0.0 0.1 51.8 0.0 307.0 0.0 511.6 172.1 105.8 126.1 1 222.6February 0.1 32.1 244.4 0.0 0.1 51.9 0.0 328.6 0.0 522.9 176.2 106.8 125.8 1 260.3March 0.1 52.4 214.4 0.0 0.1 52.0 0.0 319.0 0.0 508.7 180.0 122.5 125.5 1 255.7
April 0.1 32.5 243.2 0.0 0.1 60.4 0.0 336.3 0.0 520.2 182.5 118.3 124.8 1 282.1May 0.1 33.6 257.7 0.0 0.1 60.1 0.0 351.5 0.0 448.7 235.1 137.5 125.2 1 298.0June 0.2 59.6 204.9 0.0 0.1 60.1 0.0 324.8 0.0 464.9 231.9 139.4 122.0 1 283.0
July 0.2 51.6 205.5 0.0 0.1 62.9 0.0 320.2 0.0 461.5 230.6 133.9 121.9 1 268.1August 0.1 53.0 158.9 0.0 0.1 76.2 0.0 288.4 0.0 482.9 228.4 136.0 122.2 1 257.9September 0.1 55.4 161.7 0.0 0.1 76.0 0.0 293.3 0.0 480.4 235.9 153.3 122.1 1 285.0
October 0.1 45.2 229.1 0.0 0.1 76.0 0.0 350.5 0.0 494.0 237.8 153.3 122.8 1 358.4November 0.0 53.2 217.5 0.0 0.2 32.8 0.0 303.6 0.0 512.4 169.3 109.0 123.5 1 217.8December
Note: - Data not availableSource: Reserve Bank of Zimbabwe
Liquid Assets Securities
- 67 -

Table 19.3 Liabilities of Building Societies, US$ Million
Capital and Other Total Of which
Savings Long-term Total Foreign Other Reserves Liabilities Liabilities Liabilities to
and Deposits Liabilities Banks the public
End of Short-term
2014 January 313.9 253.1 567.0 26.1 80.6 225.9 29.5 929.1 567.0February 318.7 264.4 583.1 25.1 81.3 228.6 25.8 943.9 583.1March 374.6 234.6 609.2 24.7 79.6 231.4 25.2 970.1 609.2
April 358.4 262.7 621.1 24.9 76.5 234.0 25.4 981.9 621.1May 436.2 233.2 669.4 24.7 77.3 238.0 17.1 1 026.5 669.4June 440.1 212.2 652.3 34.8 78.9 243.1 17.3 1 026.4 652.3
July 362.4 302.9 665.3 30.1 104.3 244.2 17.5 1 061.4 665.3August 358.8 336.8 695.5 35.7 105.7 250.6 21.2 1 108.7 695.5September 394.8 297.6 692.4 54.2 106.9 253.5 23.9 1 130.9 692.4
October 364.5 368.0 732.5 54.2 105.3 258.5 27.3 1 177.8 732.5November 376.9 392.0 768.9 54.6 104.4 262.9 27.2 1 218.0 768.9December 400.9 387.5 788.4 54.2 102.0 262.7 27.6 1 234.9 788.4
2015 January 373.0 397.1 770.2 54.6 99.1 267.8 31.0 1 222.7 770.2February 405.8 400.3 806.2 53.6 98.3 272.9 29.2 1 260.2 806.2March 408.1 386.3 794.4 50.8 108.8 275.8 25.8 1 255.6 794.4
April 464.1 364.8 828.9 48.3 99.4 276.8 28.7 1 282.1 828.9May 472.0 391.6 863.6 48.5 87.4 270.7 27.8 1 298.0 863.6June 492.9 343.9 836.8 48.3 94.0 272.9 31.1 1 283.1 836.8
July 458.3 370.6 828.9 48.5 85.8 277.4 27.5 1 268.1 828.9August 438.4 386.1 824.5 47.6 73.2 282.7 29.9 1 257.9 824.5September 498.9 334.3 833.2 43.5 84.9 288.4 35.0 1 285.0 833.2
October 465.3 428.4 893.7 42.4 99.0 293.6 29.7 1 358.4 893.7November 376.9 392.0 768.9 54.6 104.4 262.9 27.2 1 217.8 768.9December
Note: - Data not availableSource: Reserve Bank of Zimbabwe
Deposits
- 68 -

End Period 2007 2008 2009 2010 2011 2012 2013 2014
Long Term External Debt 4 032 4 464 4 951 5 175 6 096 6 607 7 370 8 444
Government 3 054 3 465 4 037 4 095 4 638 4 929 5 012 4 523
Bilateral Creditors 1 520 1 863 2 308 2 325 2 597 2 694 2 928 2 445
Multilateral Creditors 1 524 1 592 1 729 1 770 2 041 2 235 2 084 2 078
Private Creditors 10 10 0 0 0 0 0 0
Public Enterprises 790 824 856 938 1 093 1 198 1 356 1 661
Bilateral Creditors 474 497 453 238 711 703 858 1 155
Multilateral Creditors 316 327 403 700 382 495 498 506
Private Creditors 0 0 0 0 0 0 0 0
Monetary Authorities 137 140 140 138 127 125 125 120
Multilateral Creditors-IMF 137 140 140 138 127 125 125 120
Private 51 35 57 142 366 480 1 002 2 261
Short Term External Debt 387 226 1 198 1 382 1 289 890 1 564 2 394
Supplier's Credits 178 41 193 286 134 30 0 0
Reserve Bank 0 0 642 642 618 614 614 587
Private 209 185 363 454 537 246 950 1 807
Total External Debt/1 4 607 4 690 6 289 6 695 7 385 7 497 8 934 10 838
Gross Domestic Product 4 000 3 175 8 157 9 457 10 956 12 393 13 490 14 068
External Debt/GDP 110.5% 147.7% 77.1% 70.8% 67.4% 60.5% 66.2% 77.0%
Note :
1.Total External Debt excludes penaltiesSource: Ministry of Finance and Reserve Bank of Zimbabwe
Figures have been revised. GDP figures for 2009 to 2011 have been revised and is the External Debt to GDP ratios for the period 2009 to 2011
Table 20.0 Zimbabwe : External Debt Oustanding by Debtor (Including all
arrears but excluding penalties) US$ millions
- 69 -

Table 21.0 Monetary Aggregates, US$ Thousands
Year ending
Total Commercial Building POSB Commercial Merchant Building
Bond RBZ Commercial Merchant Demand Banks Society Savings Banks Banks Society
Coins Demand Banks Bank Deposits Savings Savings Deposits U-30 day U-30 day U-30 day
Deposits Deposits Deposits M1 Deposits Deposits Deposits Deposits Deposits
2014 July 0.0 95.9 2 011 296.3 42 560.1 2 053 952.3 236 942.8 228 203.4 68 388.5 596 373.1 33 787.2 113 937.3August 0.0 95.8 2 084 005.9 36 379.5 2 120 481.2 256 908.6 232 305.6 68 651.3 629 496.8 40 442.4 126 458.5September 0.0 93.7 2 089 784.7 40 922.6 2 130 801.0 272 392.1 230 155.7 68 147.5 651 068.5 33 929.0 149 478.7
October 0.0 94.4 2 162 566.6 39 909.5 2 202 570.5 252 758.2 236 100.8 65 414.5 686 998.0 33 679.6 116 270.3November 0.0 94.0 2 124 944.0 39 446.4 2 164 484.4 250 745.7 253 699.7 70 142.9 630 856.1 33 288.9 113 090.1December 298.6 144.5 2 121 401.6 36 942.7 2 158 488.8 267 179.5 236 423.8 69 601.1 654 559.9 31 176.0 144 211.5
2015 January 567.1 714.7 1 967 789.9 39 049.7 2 008 121.4 282 832.4 233 498.2 70 144.8 638 395.6 40 928.2 127 399.4February 1 096.7 898.5 1 978 595.1 38 382.5 2 018 972.8 240 444.7 238 848.9 72 839.1 574 946.1 40 362.2 149 834.6March 1 294.0 545.0 2 051 081.7 68 611.0 2 121 531.7 230 198.0 244 746.0 75 993.4 645 401.5 12 132.4 152 280.6
April 1 749.3 491.6 1 990 235.2 63 935.0 2 056 411.1 267 921.4 256 526.3 74 678.1 607 334.3 0.0 189 428.7May 2 316.7 340.2 2 017 918.3 63 899.2 2 084 474.4 275 167.8 280 947.9 71 195.6 670 242.5 0.0 175 953.7June 2 684.1 4 035.0 2 112 470.2 62 949.9 2 182 139.2 248 074.6 279 625.3 73 397.6 707 686.1 0.0 188 805.2
July 2 719.3 3 889.6 2 023 527.6 62 949.9 2 093 086.4 239 113.1 275 914.5 68 785.7 587 421.2 0.0 171 250.8August 3 016.3 3 480.3 2 168 409.0 62 949.9 2 237 855.5 227 534.6 277 271.4 71 554.2 505 981.9 0.0 156 077.5September 3 425.5 3 478.9 2 166 471.3 62 157.8 2 235 533.5 230 176.6 289 245.0 77 161.5 613 287.8 0.0 190 548.2
October 4 445.3 3 485.7 2 149 026.8 61 925.6 2 218 883.4 231 465.3 294 208.3 73 380.5 565 136.6 0.0 144 911.8November 5 789.3 2 470.9 2 358 226.5 58 750.3 2 425 237.0 259 856.4 308 439.9 76 307.7 565 317.5 0.0 127 578.2December
Notes1. M1 (Narrow Money) is defined as demand deposits in the banking system.2. M2 is defined as M1 plus savings deposits plus less than 30 day deposits with the banking system.3. M3 is defined as M2 plus over 30 day time deposits with the banking sector.Source: Reserve Bank of Zimbabwe
- 70 -

Table 21.0 Monetary Aggregates, US$ Thousands
Year ending
2014 JulyAugustSeptember
OctoberNovemberDecember
2015 JanuaryFebruaryMarch
AprilMayJune
JulyAugustSeptember
OctoberNovemberDecember
Monetary Aggregates, US$ Thousands
Total Commercial Merchant Building Building Building POSB Total
Savings Banks Banks Society Society Society Time Long Grand
and O-30 day O-30 day O-30 day Class C Other Deposits Term Total
Short term Deposits Deposits Deposits Deposits Share
M2 Deposits M3
1 277 632.3 3 331 584.6 577 592.3 0.0 287 853.4 0.0 11 266.6 15 773.0 892 485.3 4 224 069.9 1 354 263.2 3 474 744.4 516 231.3 0.0 304 479.1 0.0 11 266.6 15 354.3 847 331.3 4 322 075.7 1 405 171.5 3 535 972.5 540 278.5 0.0 280 499.3 0.0 11 266.6 20 485.8 852 530.2 4 388 502.7
1 391 221.4 3 593 791.9 492 200.3 0.0 337 930.1 0.0 11 266.6 22 070.6 863 467.6 4 457 259.5 1 351 823.4 3 516 307.8 508 747.2 0.0 359 491.3 0.0 11 266.6 19 652.7 899 157.8 4 415 465.6 1 403 151.8 3 561 640.6 449 703.8 0.0 365 334.8 0.0 11 266.6 15 174.4 841 479.6 4 403 120.2
1 393 198.6 3 401 320.0 544 421.5 0.0 366 978.6 0.0 11 266.6 16 138.8 938 805.5 4 340 125.5 1 317 275.6 3 336 248.4 597 685.2 0.0 375 166.9 0.0 11 266.6 17 519.8 1 001 638.5 4 337 886.9 1 360 751.9 3 482 283.6 503 769.1 0.0 355 362.1 0.0 11 266.6 17 638.5 888 036.3 4 370 319.9
1 395 888.8 3 452 299.9 618 804.9 0.0 340 739.4 0.0 11 266.6 15 733.8 986 544.7 4 438 844.6 1 473 507.5 3 557 981.9 536 216.7 0.0 364 490.5 0.0 11 266.6 18 011.8 929 985.6 4 487 967.5 1 497 588.8 3 679 728.0 509 642.0 0.0 326 111.5 0.0 11 266.6 17 261.6 864 281.7 4 544 009.7
1 342 485.3 3 435 571.7 651 895.8 0.0 351 579.9 0.0 11 266.6 23 646.5 1 038 388.8 4 473 960.5 1 238 419.6 3 476 275.1 622 991.6 0.0 340 974.7 0.0 11 266.6 21 540.3 996 773.2 4 473 048.3 1 400 419.1 3 635 952.6 611 608.0 0.0 303 177.5 0.0 11 266.6 24 019.0 950 071.1 4 586 023.7
1 309 102.5 3 527 985.9 628 213.7 0.0 409 350.0 0.0 11 266.6 24 010.2 1 072 840.5 4 600 826.4 1 337 499.7 3 762 736.7 503 244.7 0.0 444 267.1 0.0 11 266.6 23 668.6 982 447.0 4 745 183.7
Notes1. M1 (Narrow Money) is defined as demand deposits in the banking system.2. M2 is defined as M1 plus savings deposits plus less than 30 day deposits with the banking system.3. M3 is defined as M2 plus over 30 day time deposits with the banking sector.Source: Reserve Bank of Zimbabwe
- 71 -

TABLE 22.0 LENDING RATES (percent per annum) 1
TABLE 22.1 Banks Deposit Rates (percent per annum)
NOMINAL
LENDING
NOMINAL
LENDING
HOUSES \1
RATE 1
RATE 2 SAVINGS 3 MONTHS /2 3 MONTHS
Individuals Corporate Individuals Corporate
2014 July 6.00-35.00 14.33 9.45 15.00-23.00 19.00 18.00 0.15-8.00 3.00-20.00 11.00-12.00
August 6.00-35.00 14.28 9.45 15.00-23.00 19.00 18.00 0.15-8.00 3.00-20.00 11.00-12.00September 6.00-35.00 14.45 9.57 15.00-23.00 19.00 18.00 0.15-8.00 3.00-20.00 11.00-12.00
October 6.00-35.00 14.36 9.90 15.00-23.00 19.00 18.00 0.15-8.00 3.00-20.00 11.00-12.00November 6.00-35.00 14.26 9.97 15.00-23.00 19.00 18.00 0.15-8.00 3.00-20.00 11.00-12.00December 6.00-35.00 14.19 9.68 15.00-23.00 19.00 18.00 0.15-8.00 3.00-20.00 12.00-12.00
2015 January 6.00-35.00 14.16 9.66 6.00-2100 19.00 18.00 0.15-8.00 3.00-17.00 12.00-12.00February 4.30-33.50 14.00 9.73 - - - 0.50-12.00 1.00-17.00 -March 4.30-33.50 13.24 8.75 - - - 0.50-12.00 1.00-17.00 -
April 4.30-31.00 12.71 8.84 - - - 0.30-8.00 1.00-17.00 -May 5.00-31.00 12.74 8.79 - - - 0.30-8.00 1.00-17.00 -June 5.00-31.00 11.94 8.42 - - - 0.30-8.00 1.00-17.00 -
July 5.00-31.00 11.86 8.56 - - - 0.30-8.00 1.00-15.00 -August 4.30-26.00 11.96 8.51 - - - 0.30-8.00 1.00-15.00 -September 4.30-25.00 11.81 8.47 - - - 0.30-8.00 1.00-16.00 -
October 4.00-18.00 10.98 7.28 - - - 0.50-8.00 1.00-17.00 -November 4.00-16.25 12.2 7.67 - - - 0.75-8.00 1.00-17.00 -December
Notes: Notes:1 Table revised, to separate weighted lending rates for individuals and corporate bodies 1. The range of rates quoted by banks during the period2 Nominal Lending rates depict the range of rates quoted by banks3 Lending rates excludes rates on staff loansSource: Reserve Bank of Zimbabwe Source: Reserve Bank of Zimbabwe
LENDING RATES 3
LENDING RATES 3
WEIGHTED AVERAGE BASE WEIGHTED AVERAGE BASE
ACCEPTING
2. Three (3) months deposit rates revised to excluderates on inactive or dormant accounts from 2012 onwards.
END OF
MERCHANT BANKSCOMMERCIAL BANKS COMMERCIAL BANKS \1
- 72 -

Table 23 Zimbabwe Stock Exchange Statistics
Period Industrial Mining US$Millions Turnover Turnover
Index Index Market Value Volume
Capitalization US$Millions Millions
2013 January 179.34 84.07 4 700.33 36.75 165.72February 182.64 72.01 4 748.24 45.92 164.25March 183.88 66.21 4 726.34 37.77 231.10
April 189.66 71.98 4 894.68 26.02 157.13May 212.38 73.99 5 471.22 35.51 144.44June 211.19 73.29 5 436.58 40.64 224.08
July 232.87 66.77 6 004.92 42.57 298.10August 181.67 48.73 4 682.27 54.17 409.01September 200.05 50.29 5 157.20 37.67 123.90
October 209.74 52.68 5 407.42 44.58 602.95November 213.91 47.02 5 504.05 34.97 188.97December 202.12 45.79 5 203.13 49.21 287.68
2014 January 189.25 35.04 4 882.11 63.97 170.10February 189.45 39.34 4 906.94 25.81 135.46March 176.32 29.51 4 560.29 28.88 381.65
April 172.91 29.64 4 473.51 51.35 429.09May 174.89 35.44 4 533.91 35.90 235.70June 186.57 61.32 4 873.40 28.54 178.47
July 188.08 95.00 4 959.21 25.22 322.41August 196.43 104.80 5 186.63 66.40 328.16September 195.25 92.76 5 140.16 34.06 210.94
October 177.88 70.38 4 664.80 28.26 156.44November 171.45 64.39 4 517.93 34.77 155.85December 162.79 71.71 4 327.06 29.70 475.02
2015 January 164.90 58.13 4 365.14 16.06 57.39February 167.16 55.38 4 353.38 34.78 122.86March 158.22 43.93 4 117.08 18.90 405.84
April 156.26 42.93 4 066.07 29.19 590.29May 152.96 44.45 3 978.06 23.28 288.46June 148.40 44.30 3 864.76 14.51 80.69
July 145.35 39.36 3 812.65 20.40 142.10August 135.43 35.34 3 552.02 15.34 76.19September 131.93 24.36 3 444.53 17.96 105.63
October 130.83 23.57 3 416.11 12.86 63.76November 117.55 22.33 3 141.68 8.95 91.42December 114.85 23.72 3 073.41 16.36 183.79
Note: 1.Market capitalisation is the issued share capital multiply by the closing price of each counter2.Value of turnover is the value of shares bought or sold in a month3.Volume of turnover is the number of shares bought or sold in a month4.The base year for the stock indices is February 19, 2009 - Data not available
Source: Zimbabwe Stock Exchange
- 73 -

Table 24.0 Selected International Exchange rates
South Botswana Japanese European British
African Pula/1 Yen/1 Currency/2 Pound
Rand/1 Sterling/2
2013 January 9.03 8.05 90.90 1.36 1.58February 8.84 8.04 92.36 1.31 1.52March 9.26 8.30 94.13 1.28 1.51
April 8.98 8.10 97.76 1.31 1.55May 10.08 8.65 100.85 1.30 1.52June 9.94 8.60 98.74 1.31 1.53
July 9.83 8.49 98.31 1.33 1.53August 10.33 8.75 98.18 1.32 1.55September 10.10 8.58 97.92 1.35 1.60
October 9.95 8.50 98.28 1.37 1.60November 10.19 8.64 102.33 1.36 1.64December 10.43 8.72 105.02 1.38 1.65
2014 January 11.21 9.09 102.47 1.35 1.65February 10.71 8.85 101.74 1.37 1.67March 10.59 8.80 102.86 1.38 1.66
April 10.57 8.85 102.38 1.38 1.68May 10.44 8.73 101.61 1.36 1.67June 10.58 8.67 101.30 1.36 1.70
July 10.68 8.85 102.76 1.36 1.69August 10.98 9.07 107.35 1.29 1.63September 11.26 9.26 109.39 1.27 1.63
October 10.90 9.11 110.87 1.26 1.59November 11.02 9.22 118.21 1.38 1.57December 11.56 9.51 119.65 1.22 1.56
2015 January 11.55 9.61 117.85 1.13 1.51February 11.55 9.61 119.17 1.12 1.54March 12.16 9.96 120.19 1.08 1.48
April 11.82 9.74 118.60 1.11 1.54May 12.13 9.76 123.87 1.09 1.53June 12.26 9.92 122.31 1.12 1.57
July 12.71 10.67 124.03 1.09 1.56August 13.31 10.20 121.11 1.12 1.54September 13.90 10.55 119.94 1.12 1.54
October 13.85 10.47 121.15 1.10 1.54November 14.40 10.70 122.73 1.06 1.53December
1. Foireign currency per US dollarSource: Reserve Bank of Zimbabwe
- 74 -

Table 25.1 Sectoral Analysis of Commercial Banks Deposits, US$ Thousands
End
of Agriculture Construction
Communica
tion Distribution Financial & Financial
Manufactu
ring Mining Services Transport Individuals
Conglomera
tes/1 Total
Investments
Organizatio
ns
2013 July 108 086.60 46 449.50 120 982.30 380 448.80 178 341.40 677 700.70 301 575.90 97 583.80 710 856.10 39 395.90 487 954.40 102 531.40 3 251 906.80
August 137 107.10 48 726.10 135 788.50 319 106.00 174 593.90 637 190.70 333 255.30 99 194.10 639 401.60 41 996.50 417 762.60 93 772.10 3 077 894.50
September 100 028.30 57 039.80 145 652.50 380 781.40 207 379.20 612 131.50 408 359.10 103 872.80 795 047.60 46 982.90 435 912.40 90 265.80 3 383 453.30
October 94 346.30 52 722.40 141 401.40 338 625.90 223 223.80 754 145.40 339 305.60 99 583.30 754 116.10 41 527.20 440 197.90 97 771.10 3 376 966.40
November 114 178.70 47 740.90 128 399.30 312 639.20 241 628.80 741 885.40 283 426.00 80 507.60 727 492.50 42 901.00 458 479.90 89 292.50 3 268 571.80
December 113 914.20 51 981.70 142 938.10 342 785.10 213 125.20 755 299.40 327 658.10 83 103.10 762 884.40 41 827.90 432 436.30 61 038.70 3 328 992.20
2014 January 130 154.60 53 292.90 146 876.10 353 793.80 259 569.60 731 703.30 304 033.20 93 776.70 770 435.40 40 085.90 485 573.10 60 897.70 3 430 192.30
February 138 812.30 55 092.20 134 813.90 420 181.00 262 183.80 786 295.60 270 062.50 131 134.80 779 640.30 39 169.20 508 813.70 61 822.30 3 588 021.60
March 118 239.10 55 167.50 135 807.90 382 675.50 216 025.30 791 776.00 275 549.10 103 298.70 806 185.90 42 432.80 521 381.50 72 990.90 3 521 530.20
April 164 347.50 59 289.30 102 323.70 408 823.50 325 559.70 780 207.00 325 659.80 135 187.40 888 876.20 43 746.50 582 848.80 82 009.80 3 898 879.20
May 149 474.10 60 669.40 108 977.60 355 802.30 332 850.80 800 256.80 303 599.40 132 132.80 1 027 552.70 38 921.00 581 930.20 93 334.90 3 985 502.00
June 194 685.10 64 188.90 95 595.60 470 267.70 291 594.60 812 999.70 348 303.50 130 453.40 895 698.00 44 735.50 575 149.10 91 392.40 4 015 063.50
July 163 335.60 56 812.00 87 587.50 370 121.70 303 367.30 830 988.60 334 436.80 112 985.00 880 761.10 44 675.40 587 756.70 94 841.50 3 867 669.20
August 128 794.10 38 934.10 90 012.50 271 204.30 270 009.90 755 141.60 236 267.50 130 548.60 865 566.60 31 180.40 467 724.20 89 582.40 3 374 966.20
September 177 932.50 56 444.50 82 756.70 315 956.80 309 508.30 951 593.40 278 461.50 174 497.90 978 044.00 47 792.70 571 629.90 103 464.80 4 048 083.00
October 158 421.70 57 091.40 83 973.90 407 934.00 308 028.80 917 450.30 266 690.90 178 771.00 936 336.20 44 950.20 613 425.10 91 764.10 4 064 837.60November 140 908.60 61 494.30 93 114.00 350 153.80 313 668.70 881 007.40 271 049.90 137 867.80 955 760.60 48 177.70 641 405.30 90 462.20 3 985 070.30December 147 242.40 60 358.10 118 725.70 328 729.50 325 746.60 950 304.90 290 329.30 118 977.80 964 815.00 47 574.30 638 061.10 92 040.80 4 082 905.50
2015 January 155 304.20 63 950.40 136 066.90 349 099.70 294 145.50 809 684.00 314 319.60 113 452.00 1 034 514.70 48 876.50 606 370.30 78 746.00 4 004 529.80February 151 740.10 63 122.60 109 807.60 370 581.80 314 944.70 784 737.60 309 307.90 120 255.10 1 028 160.10 43 112.00 606 650.60 78 891.20 3 981 311.30March 199 484.80 63 709.20 116 397.40 378 460.00 351 448.00 762 380.70 373 911.90 99 744.60 912 654.40 42 478.90 644 951.30 72 605.20 4 018 226.40
April 186 896.30 65 974.00 130 284.90 380 884.80 330 001.90 799 952.40 373 648.30 109 735.00 944 772.90 44 964.90 653 801.00 75 850.90 4 096 767.30May 185 803.20 73 167.50 111 512.10 523 774.70 299 659.20 801 335.50 419 453.70 113 355.00 1 041 392.80 50 057.90 619 767.90 71 388.80 4 310 668.30June 187 657.00 76 777.80 109 336.00 498 031.30 304 087.20 877 042.80 338 069.80 67 556.60 1 131 497.10 43 949.00 651 072.80 72 166.90 4 357 244.30
July 180 261.30 80 536.40 106 645.30 452 744.10 295 611.10 911 363.80 360 746.50 88 518.40 971 759.90 53 101.60 647 215.10 70 618.80 4 219 122.30August 168 075.20 86 038.90 108 477.70 472 875.10 335 158.30 784 616.60 401 830.10 76 647.00 1 042 260.40 55 455.90 657 177.10 51 922.50 4 240 534.80September 197 641.50 85 842.60 112 415.30 462 925.60 349 564.20 831 813.00 379 121.40 71 090.00 1 033 106.70 53 348.10 676 308.00 55 759.20 4 308 935.60
October 219 922.30 85 382.00 116 874.40 447 200.70 331 543.60 821 640.80 378 568.50 68 298.70 1 100 719.70 55 846.70 648 757.50 67 353.20 4 342 108.10November 212 806.10 85 815.70 98 468.40 465 089.70 334 835.60 846 959.00 363 754.40 71 866.20 1 074 141.80 56 110.30 665 421.10 64 630.30 4 339 898.60December
Note. - 1. These are large corporation with business operations covering across a number of sectors- 75 -

Table 25.2: Broad Money Survey US$ Thousands
January February March April May June July August September October November December
NET FOREIGN ASSETS - 714 190.6 - 763 306.5 - 565 969.3 - 636 028.1 - 681 066.5 - 775 512.6 - 723 772.8 - 727 785.7 - 715 689.4 - 822 417.2 - 771 548.0
Assets 830 959.5 737 833.4 816 079.6 755 493.4 811 200.5 926 353.7 843 689.2 867 447.1 889 018.6 784 372.6 667 350.7
Reserve Bank (RBZ) 356 661.9 280 889.9 282 170.1 282 900.6 303 218.6 453 986.1 395 771.0 360 705.6 360 255.9 335 321.7 300 180.5Deposit Money Banks (DMBs) 405 880.7 400 473.5 469 563.3 424 368.1 418 721.9 390 608.3 361 517.6 428 702.8 448 219.8 387 305.0 310 522.6Other Banking Institutions (OBIs)/1 68 416.9 56 470.0 64 346.2 48 224.7 89 260.0 81 759.3 86 400.6 78 038.7 80 542.9 61 745.9 56 647.6
Liabilities/2 -1 545 150.1 -1 501 140.1 -1 382 038.9 -1 391 521.4 -1 492 176.9 -1 701 866.2 -1 567 462.0 -1 595 232.8 -1 604 707.9 -1 606 789.9 -1 438 898.6
RBZ 1 007 096.0 1 009 161.8 858 095.4 894 207.5 868 931.4 1 093 306.3 1 039 959.7 1 056 817.9 1 057 080.8 1 069 972.4 1 048 664.8
DMBs 483 463.5 438 356.5 473 182.2 448 998.0 574 792.7 560 305.8 478 956.0 490 791.1 504 085.0 494 458.0 347 787.2OBIs 54 590.6 53 621.8 50 761.3 48 315.9 48 452.8 48 254.1 48 546.3 47 623.8 43 542.1 42 359.5 42 446.6
NET DOMESTIC ASSETS 5 054 316.0 5 101 193.5 4 936 279.4 5 074 872.7 5 169 034.0 5 319 522.4 5 197 733.1 5 200 833.8 5 301 713.1 5 423 243.6 5 516 731.6
DOMESTIC CREDIT 4 231 495.5 4 249 052.5 4 371 027.6 4 529 777.3 4 817 875.4 4 869 072.5 4 981 511.5 5 027 828.1 5 078 530.1 5 195 496.3 5 344 345.6
Claims on Government (net) 544 026.1 549 179.3 537 675.3 665 258.8 950 594.1 1 074 237.6 1 160 044.8 1 192 006.7 1 182 354.0 1 253 218.7 1 359 827.4
RBZ - 12 594.0 - 12 908.0 - 22 274.1 98 377.6 97 847.8 91 807.5 243 082.9 244 517.6 254 297.8 271 997.2 314 096.4
DMBs 504 696.7 510 080.3 500 344.5 498 836.6 784 428.5 904 112.3 845 865.3 860 228.9 838 982.9 890 154.0 954 556.6
OBIs 51 923.4 52 007.0 59 604.9 68 044.6 68 317.8 78 317.8 71 096.6 87 260.2 89 073.3 91 067.5 91 174.4
Claims on Public Enterprises 64 967.7 68 944.3 71 543.2 102 474.4 104 306.3 53 148.2 48 641.8 55 228.9 53 211.4 83 710.6 82 879.6
RBZ 0.0 0.0 0.0 737.3 1 087.1 1 189.1 1 931.5 2 098.7 2 423.7 30 362.6 30 375.1DMBs 64 967.7 68 944.3 71 543.2 101 737.1 103 219.2 51 959.1 46 710.3 53 130.2 50 787.7 53 348.0 52 504.5
Agri-Pes 0.0 0.0 0.0 0.0 0.0 0.0 0.0 0.0 0.0 0.0 0.0 Other 64 967.7 68 944.3 69 816.8 100 742.9 102 436.0 51 254.0 46 510.3 53 130.2 50 787.7 53 348.0 52 504.5
OBIs 0.0 0.0 1 726.4 994.2 783.2 705.1 200.0 1 279.1 1 312.2 1 166.5 926.4
Claims on Private Sector 3 622 501.7 3 630 928.9 3 761 809.1 3 762 044.1 3 762 975.0 3 741 686.7 3 772 824.9 3 780 592.5 3 842 964.7 3 858 567.0 3 901 638.6RBZ 34 725.3 34 725.3 31 409.0 31 558.0 31 155.6 51 689.8 66 722.4 92 768.9 67 359.3 75 959.6 77 442.5DMBs 2 835 002.6 2 824 415.9 2 960 892.4 2 948 993.7 2 960 917.8 2 900 630.1 2 910 157.5 2 875 477.3 2 956 930.6 2 950 844.9 2 981 759.1OBIs 752 773.8 771 787.7 769 507.7 781 492.4 770 901.6 789 366.8 795 945.0 812 346.3 818 674.8 831 762.5 842 437.0
OTHER ITEMS (NET) 822 820.5 852 141.2 565 251.8 545 095.4 351 158.7 450 450.0 216 221.6 171 726.7 221 870.7 226 580.9 171 459.6
BROAD MONEY (M3) 4 340 125.4 4 337 887.0 4 370 310.1 4 438 844.6 4 487 967.5 4 544 009.8 4 473 960.3 4 473 048.1 4 586 023.7 4 600 826.4 4 745 183.6
Notes
1. (OBIs) Finance Houses, Building Societies and POSB
2. Sign Reversal on Liabilities
Broad Money (M3) is Net Foreign Assets plus net Domestic AssetsSource: Reserve Bank of Zimbabwe
2015
- 76 -

--77 -
Explanatory Notes
Table 1.0 Recorded Migration through Official Ports
Sources: Analysis of returns from the Department of Immigration Control relating to migration through official ports (it should be noted that other cross-border migration is not included and, as indicated below, there is evidence of understatement in the emigration figures relating to official ports).
Immigrants Include: 1) new residents intending to remain in
Zimbabwe for at least twelve months;2) temporary residents taking up employment for
a limited period;3) returning former residents who had declared
themselves as emigrants when they left thecountry, and
4) returning former residents who had previouslydeclared they were leaving for less than ayear, but who nevertheless, had remainedaway for more than twelve months.
Emigrants include: 1) residents who, on departure, declare they are
leaving for more than twelve months, and2) persons who recorded themselves as visitors
on arrival, but who stayed for more than twelvemonths.
It should be noted that from other sources there is evidence that a significant number of the emigrants leaving through the official ports are omitted from these figures. Mainly these are residents who, on departure, declare they are leaving for less than twelve months, but who do not return within a year.
Table 2.0 Visitors and Returning Residents Source - Analysis of returns received from the Department of Immigration
Visitors are defined as residents of other countries who visit Zimbabwe for a period not exceeding 12 months for any reason other than taking employment. These persons are classified, on arrival, by the Department of Immigration according to their reasons for visiting the country. In transit visitors are defined to include those visitors entering the country en route to another destination, and who spend less than two nights in passing through the country. The number of visitors leaving the country after a visit of less than one night is ascertained from the exit cards which are completed by or in respect of all departing visitors.
Returning residents are defined as persons normally resident in Zimbabwe, returning to this country after a visit not exceeding 12 months to other countries, who did not leave Zimbabwe as emigrants. The
number of residents returning after a visit of not less than one night is again obtained from the exit cards.
Table 4.0 Road Accidents and Occupational Injuries
Source.- Zimbabwe Republic Police and the National Social Security Authority respectively
The figures of occupational injuries, which include industrial diseases other than pneumoconiosis, represent claims on the National Social Security Authority.
Because they are not covered by the workers compensation scheme injuries to the following classes of persons are excluded:
a) domestic servantsb) civil servantsc) casual workers
Table 5.0 Crime Statistics
Source - Police General Headquarters
The figures given are crimes reported to the Police for the periods shown. They are “National” total derived from reports from all stations.
For the period August 2011 to March 2012 some of the crimes under Criminal Law were reported under Miscellaneous Offence, Common Law and Law and Order Maintenance Act( other)
Table 6.0 and 6.1 Employees and their Earnings An employee is defined as a person who works for a public or private employer for more than 30 hours per week. Working owners of private liability companies are included within this definition.
Following the above definition, self-employed persons who operate unincorporated enterprises rather than private limited liability companies are excluded.
Since 1975 the procedure, apart from the private domestic service sector has been to undertake a full postal inquiry in September each year and to supplement this inquiry .with smaller surveys in the months of March, June and December; for these smaller enquiries coverage is confined to establishments with more than 10 employees. After each September inquiry the number of employees in the smaller establishments is assumed to remain statistic until the next full inquiry. Adjustments as necessary, are then made to that year’s figures in the light of the latest September results.

--78 -
The earnings figures given in Table 6.0 and 6.1 include: (a) all cash wages, salaries, allowances, commissions and bonuses; (b) the employers’ contributions in respect of their employees to pension, provident and holiday funds and to medical aid societies; (c) the current account (as distinct from the capital account) costs to the employer of any food, clothing and housing provided free of charge to the employees. Data for formal employment in the agriculture sector used to include persons only employed in the LSCF farms. For consistency and comparability purposes the data now includes employees and earnings for A1, A2 farms as these previously constituted the LSCF. For private domestic servants, earnings are assessed twice a year through a sample survey in the six main urban areas. Details of earnings in all the other sectors of the economy are collected on a quarterly basis together with the employment data referred to earlier. Unpublished data on further cross tabulations of employees and earnings figures is available on request from the office. The variables include sex, employment status (part time, full time, casual), area/region, industrial sector/status, income group, etc. Table 7.0 Consumer Price Index (CPI) The index is a Laspeyres type with December 2012 as base year. It is based on a changing cost of a weighted basket comprising of 495 different consumer goods and services which represent consumption by the average household in Zimbabwe. In constructing the weights, consumption of own produced goods and services was added to expenditure. In the case of owner-occupied housing the rent values of the houses were imputed. Similarly, for health services an imputed value for those services provided free by government was added to the tallied expenditure. The consumption concept, unlike the expenditure concept used in the previous series, increases the importance of food, housing and health. Generally, the CPI relates to price levels around the 15th of every month. However there are a few important items for which prices are collected bi-annually (e.g. rent) or annually (e.g. school fees). All CPI figures include value added tax and excise duty. Twelve (12) major group and 68 sub-group indices are produced monthly. With effect from January 2013, ZIMSTAT is publishing the new Consumer Price Index (CPI) with new weights and a new classification in accordance
with international guidelines. The use of a new classification of Individual Consumption by Purpose (COICOP) resulted in the creation of a new classification which resulted in coming up with 83 classes, 41 groups and 12 divisions while in the old classification there were 68 subgroups and 12 major groups. The number of items in the CPI basket has also been increased from 428 to 495. Due to the reclassification that has been done, the sub-groups and major groups have been substituted by classes, groups and divisions. The implementation of the COICOP classification is also part of the harmonisation project of Consumer Price Indices in different regions like the SADC region. All member states are supposed to adopt the new procedure to enable inter country comparisons of the CPI and the rate of inflation. The indices prior to January 2013 were re-referenced to December 2012=100. The rates of inflation remain the same under different weight regimes as the relative magnitude of indices is maintained. The new weights are therefore applicable from January 2013 onwards. Major Groups in the Consumer Price Index by weight 2012.
Major Groups CPI 2012 National %
Food and non-Alcoholic Beverages
Alcoholic Beverages and tobacco
Clothing and footwear
Housing, water, electricity, gas and other fuels
Furniture, household equipment and maintenance
Health
Transport
Communication
Recreation and culture
Education
Restaurants and hotels
Miscellaneous goods and services
Total
33.5
4.4
6.0
17.7
9.9
2.2
9.8
3.4
2.1
5.7
1.4
3.9
100.0

--79 -
Comparing the Old Basket with the New Basket The office adopted a new poverty basket based on the 2011/2012 Poverty, Income, Consumption and Expenditure Survey (PICES) in May 2013. Users who wish to compare the old basket with the new basket are advised to multiply the old basket with the following factors
PROVINCE FACTORS Manicaland 0.9 Mashonaland Central 1.0 Mashonaland East 0.8 Mashonaland West 0.9 Matabeleland North 1.0 Matabeleland South 1.0 Midlands 0.9 Masvingo 0.9 Harare 0.9 National 0.9
Table 7.1 - 7.4 Poverty Datum Lines (PDL)
The ILO Position on PDL in relation to Wages and Salaries
The Minimum Wage-Fixing Machinery Recommendation, 1928, the Minimum Wage Fixing Machinery (Agriculture) Recommendation, 1951, and the Equal Remuneration Recommendation, 1951, provided the following guidelines for minimum wage fixing bodies:
That the minimum wage fixing, should adopt criteria which will make systems of minimum wages both an effective instrument of social protection and an element in the strategy of economic and social development,
that minimum wage fixing should in no way operate to the prejudice of the exercise and growth of free collective bargaining as a means of fixing wages higher than the minimum, and
The Minimum Wage Fixing Recommendation, 1970 stated the purpose of minimum wage fixing as:
Minimum wage fixing should constitute one element in a policy designed to overcome poverty and to ensure the satisfaction of the needs of all workers and their families.
The fundamental purpose of minimum wage fixing should be to give wage earners necessary
social protection as regards minimum permissible levels of wages.
ILO Criteria for Determining the Level of Minimum Wages
In determining the level of minimum wages, account should be taken of the following criteria, amongst others:
the needs of workers and their families;
the general level of wages in the country;
the cost of living and changes therein;
social security benefits;
the relative living standards of other social groups ;
economic factors, including the requirements of economic development, levels of productivity and the desirability of attaining and maintaining a high level of employment.
From the above discussion, ILO recommends that the PDL should be used as a benchmark or a reference point in determining minimum wages. Although the recurrent result is that minimum wages and poverty are inversely related, one cannot always conclude that a rise in the minimum wages is the most cost effective way to reduce poverty. It is also important to note that there may be more than one breadwinner in a household, so if everyone gets the minimum wage then it means that households get far more than what the household would need.
Table 8.0 National Income National income can be measured in three ways, viz. by using information on income, production or expenditure. In the main, the estimates are obtained from the product approach, but, using the product estimates as controls, analyses are also made by type of income and by expenditure. Gross national income (market prices) represents the value of income accruing to the factors of production supplied by residents. It is thus the sum of incomes paid by resident producers to all factors of production (gross domestic income at factor cost), plus indirect taxes reduced by subsidies plus income received by resident factors of production from non-residents, less income paid to non-residents factors of production. In practice, establishments are regarded as paying out factor incomes to labour in the form of wages and salaries, and being left with a gross operating profit which is the factor income attributable to the factors of production employed, but not necessarily owned by the establishment. Part of this gross operating profit is then distributed to the owners of the factors

--80 -
of production in the form of investment income (interest, rent, dividends and net profit) and to other final recipients in the form of transfer income (direct taxes, pensions, bursaries, etc.). Wages and salaries include: (1) all cash wages, salaries, allowances, overtime commissions and bonuses; (2) employers’ contributions to pension funds, provident funds, holiday funds and medical aid societies but exclude contributions to the Workmen’s Compensation Fund; (3) the cash value of all income received in kind, i.e. housing, uniform etc.; paid to or on behalf of residents and non-resident labour by enterprises, local and central government persons and private non-profit-making institution which are resident in the country. Wages and salaries paid by foreign diplomatic and consular mission (non-residents) are excluded. Rent includes the imputed income from owner-occupied dwellings and the actual payments to both private rentiers of residential buildings and to Government in its capacity as owner of buildings. The rental income is recorded before deduction of costs and depreciation. Gross operating profit is estimated before receipt or payment of property income (rent, other than that on residential buildings) and is expressed gross of depreciation. Unincorporated enterprises’ gross operating profit is the income in cash and kind actually received by individual employers and persons working on their own account from the total entrepreneurial income of their enterprises plus income from property. Table 8.1 Gross Domestic Product at Factor Cost
by Industry of Origin Gross domestic product at factor cost represents the total value at factor cost of the goods and services produced within the country counted without duplication and before providing for depreciation. It is therefore essentially the sum of the values added at each stage of production. Table 8.2 Expenditure on the Gross National
Product This table gives the final uses of gross domestic product and gross national product at market prices. The latter is derived by adjusting gross domestic product for net factor incomes (receipts less payments) from abroad. Private consumption expenditure represents consumption by person in their capacity as final consumers. The details are to some extent, derived as residual after the allocation of supply to the other components of demand. It includes imputed rentals
for owner-occupied dwellings but not expenditure on new dwellings. What is wanted as a component of final uses gross domestic product is final consumption of resident households. However, what can be directly estimated is expenditure in the domestic market. To obtain final consumption expenditure of resident households, expenditure in domestic market is adjusted for net external expenditure (expenditure less receipts) on passenger fares, holiday travel, amount spent by visitors, foreign exchange bought from travellers and no currency involved imports. Net government current expenditure relates to expenditure departments on goods and services netted for fees, sales and recoveries. All expenditure on defence is treated as current expenditure, except identifiable capital expenditure on airfields also used also used for civilian purposes and family residential dwellings. Gross fixed capital formation is made up of purchases of new fixed assets (other than land) by all enterprises and central and local government less their sales of similar second hand goods. It includes work in progress of construction industry as well as expenditure on new private dwellings by individuals (net of sales). Increase in stocks includes livestock, materials and supplies, finished goods and work in progress of all industries (other than construction). Net exports of goods and services (exports less imports)-Exports include sales of merchandise and services as well as direct purchases in Zimbabwe made by visitors, travellers and foreign governments. Imports include purchases of merchandise and services as well as direct purchases made by resident household and government on current account abroad. Net factor income from abroad-comprise wages and salaries and entrepreneurial income received from less similar income paid abroad by residents. Table 9.0 Balance of Payments The objectives of the Balance of Payments Account is to record and identify transactions between residents and non-residents. The account is designed to indicate: a) Flows of resources b) Changes in foreign financial assets and liabilities c) Transfer payments i.e. payments flowing either
way without a quid pro quo. Conceptually each transaction involves a debit and credit entry. However, these are not explicit or accurate. Timing variations may cause transactions not to match; exchange variations may also affect

--81 -
the balance. To offset these and other variations, errors and omissions are included as a balancing item against such discrepancies. The account is divided into a current account covering goods, services and transfers and a capital account covering public and private capital flows. The resulting balance is financed by official financing which may involve borrowing for this specific purpose. Table 10.0 Summary of External Trade Figures for domestic exports, re-exports and imports (including the parcel post trade are in the main compiled from customs bills of entry completed by exporters and importers. For electricity a special monthly return is obtained from ZESA showing trade in the commodity. Gold sales are sales of gold by the Reserve Bank to monetary authorities abroad. Corrections for any previous month’s figures are made in the current month. Domestic exports, that is, goods of Zimbabwean origin, include goods produced domestically and those originally imported that have under-gone a process of transformation. They are valued “Free-on-rail” (F.O.R) at the point of despatch. Excluded are goods consigned to diplomatic and other official missions, cinematograph films on lease tourists” effects and fuel uplifts and stores purchased by foreign aircraft. Re-exports are also valued “Free-on-board” (F.O.B) at point of despatch. These consists of goods previously imported and are now being exported in essentially the same physical condition as when they were originally imported and of goods previously imported and entered into customs bonded warehouses. Imports include goods imported into the country directly for home consumption or use and those going into customs bonded warehouses. Returned exports are also included as re-imports. Imports are valued cost insurance and freight (C.I.F) beginning with 1990 whereas they were valued Free on Board (F.O.B) previously. Table 10.1 and 10.2 Domestic Exports/ Imports
by Principal Countries.
The countries selected are the major trading partners in terms of value based on figures of the previous year. Table 10.1 excludes gold sales which are shown in Table 10.0. Particulars of exports are given according to the country of destination; this is the final country to which the goods are being despatched from Zimbabwe. Details of imports are given by the country of origin or production.
Table 10.3 and 10.4 Domestic Exports/Imports by HS Chapters
Zimbabwe has changed its classification of commodities from Standard International Trade Classification (SITC) to the Harmonised System of Commodity Coding and Description (HS). Table 11.0 Short-Term Credits Extended to
Farmers Source - Commercial banks and Merchant banks
Table 11.1 Summary of Sales of Principal Crops and Livestock to/through Marketing Authorities
Sources – Analysis of returns received as listed in Tables 11.2 and 11.3 below Tables 11.2 and 11.3 Volume and Value of
Crops Sales to / through Marketing Authorities
Sources – Analysis of returns received from:
i. Grain Marketing Boards (GMB)
ii. Agriculture Marketing Authority (AMA)
iii. Tobacco Marketing Board (TIMB)
iv. Zimbabwe Sugar Sales (Pvt) Ltd.
Tables 11.4 and 11.5 Volume and value of Livestock Slaughtering and Milk Butterfat Production
Sources – Analysis of returns received from:
i. Cold Storage Company (CSC)
ii. Colcom
iii. Government Grading Centre
iv. Quarterly Census of Registered Butcheries
(Class 11)
v. Dairy Association of Zimbabwe (DAZ)
The resulting overall average price for the grading centers was also used to value the slaughtering for CSC. Colcom average price for pig slaughtering was also used to value pig slaughtering at Government grading centres and butchers. Table 12.0 and 12.1 Mineral Production Source – Chamber of Mines Generally the value is “at mine” except for copper and nickel for which quantities and values are included after refining and hence relate to the metal content.

--82 -
Table 13.0 Electrical Energy Produced and Distributed
Source – Zimbabwe electricity Supply Authority (ZESA) Undertakings with a capacity of less than 100 kilowatts are excluded. Imports into Zimbabwe are from Zambia, DRC, South Africa and Mozambique. Exports from Zimbabwe, other than through the grid system, are to South Africa and Namibia. The net figure is shown. The generation and distribution of electricity in Zimbabwe is the responsibility of the Zimbabwe Electricity Supply Authority (ZESA. The difference between Zimbabwe’s input to and drawings from ZESA Grid is made up of exports to/imports from Zambia and line losses within the Zimbabwe Section of the grid system; these losses are of the order of 4 percent of the drawings from the ZESA Grid. Table 13.1 Electrical Energy Consumed by Broad
Industrial Sectors Undertakings of less than 100 kilowatt capacity are not included. The difference between total energy distributed and total energy consumed is made up of transformer usage and line losses, details of which are not available. Table 14.0 Building Material Price Index The table illustrates the price changes of building materials and the changes in the cost of building a particular three-bed roomed house (excluding labour). The later is indicated by the total materials index. The total materials index is arrived at by combining the materials indices by weights which are derived from the cost structure of the house. The weights presently being used were derived in 1968. The indices are calculated to 1968 as base then later converted to 1980 base. The index covers two urban areas which represent the Nation. These are Harare Bulawayo. Firstly for each city are computed then combined using the ratio 75:15 = Harare : Bulawayo to get the national index. Table 15.0: Volume of Manufacturing Index (VMI)
The indicators used for measuring changes in the volume of production are: physical quantities produced or materials used, value of sales or output deflated by a price index. From 2009, new weights have been used and 2009 has also been used as the comparison base year.
Table 16.0 Principal Indicators - Gross output, Intermediate consumption and Value added classified by industrial group; CIP Zimbabwe
The table shows gross output, intermediate consumption and value added as principal indicators. Gross output illustrates the result of the overall production activity of establishments (i.e. industrial units) and it corresponds to the sum of the value of all goods or services that are actually produced within an establishment and become available for use outside that establishment plus any goods and services produced for own final use. The value of production at basic prices is given by: Gross output = Value of sale/turnover/shipments of all goods or services produced by the establishment + Value of sale/turnover/shipments adjusted for stocks. Intermediate consumption consists of the value of goods and services consumed as inputs in the process of production, excluding fixed assets. The goods or services may be either transformed or used up in the production process and is calculated as follows: Hence Value added = Gross output – Intermediate consumption Table 17.0 Railways Source – Railways Administration Rail services operating revenue relates solely to revenue from rail traffic. Rail services operating expenditure is confined to the direct costs of operating the service. Total revenue includes revenue from road motor services, catering and property rents in addition to rail services. Total expenditure includes the costs of running all the services as well as general administration and interest charges. Number of passengers excludes children under 7 years. Gross tonne kilometres is the gross mass , as shown on the vehicle list, of every vehicle, “dead” engine, etc., included in the composition of trains, plus ballast wagons travelling to and from the point of working when hauled by other than ballast trains, multiplied by the distance travelled. Net tonne kilometres relate to all public freight-paying traffic and invoiced railway stores, plus

--83 -
ballast en route to ballasting point when hauled on other than ballast trains. The contents of coaching stock, goods vans and “other vehicles” and ballast wagons whilst on ballast train working “in section are” excluded. Coaching services includes revenue from passenger traffic, parcels, excess luggage, special trains and saloons. Miscellaneous revenue includes demurrage, storage and mails. Table 17.2 Airport Traffic Flights in/out include all aircraft landing and taking off, viz. an aircraft which lands and takes off is reflected in the figures for flights in/out as two. Passengers include those who embark or disembark at an airport but exclude in-transit passengers. Freight includes good and mail lifted and set down. Other airports comprise Masvingo, Kariba, Buffalo Range, Victoria Falls, Charles Prince and Hwange National Park. Air Zimbabwe Source - Air Zimbabwe Distances are measured in terms of the Great Circle distances between airports. Table 18.0 Assets of Commercial Banks Source - Reserve Bank of Zimbabwe The commercial banks include; Barclays Bank of Zimbabwe Limited, CBZ Bank Limited, Stanbic Bank Ltd, Standard Chartered Bank Limited and ZB Bank Limited, Agricultural Bank of Zimbabwe Limited Kingdom Bank Limited, Premier Banking Corporation Limited, FBC Bank Limited, African Banking Corporation, Metropolitan Bank of Zimbabwe Limited, TN Bank Limited, NMB Bank Limited, MBCA Bank Limited, and Zimbabwe Allied Banking Group. Table 18.1 Liabilities of Commercial Banks Source - Reserve Bank of Zimbabwe Table 18.2 Advances of Commercial Banks by
Sector Source - Reserve Bank of Zimbabwe Table 18.3 Advances of Commercial Bank by
Type of Organisation Source – Reserve Bank of Zimbabwe Other Financial Institutions Table 19.0 Assets of Accepting Houses Source - Reserve Bank of Zimbabwe
Table 19.1 Liabilities of Accepting Houses Source - Reserve Bank of Zimbabwe Table 19.2 Assets of Building Societies Source - Reserve Bank of Zimbabwe The Building Societies in Zimbabwe include; CBZ Building, Central Africa Building Society (CABS), FBC Building Society and ZB Building Society etc. Table 19.3 Liabilities of Building Societies Source - Reserve Bank of Zimbabwe Table 20.0 Public Debt and Government Finance Zimbabwe External Debt Outstanding by Debtor (including all arrears but excluding penalties). Source - Reserve Bank of Zimbabwe and Ministry of Finance Table 21.0 Monetary Aggregates Includes the definitions of money supply M1 (narrow definition of money supply), M2 and M3 (the broad money supply). Source- Reserve Bank of Zimbabwe Interest rates
Table 22.0 Bank Deposit Rates These are available for Commercial Banks Savings rates and 3 months Commercial Bank deposit rates. Bank deposit rates are also available for Accepting Houses for a period of 3 months. Source - Reserve Bank Table 22.0 Lending Rates Lending rates are available for lending rates for Commercial Banks and for Accepting Houses. Source - Reserve Bank Table 23.0 Stock Exchange Indices Source - The Zimbabwe Stock Exchange The value of turnover index is calculated on the total value of sales conducted on the Stock Exchange. The industrial share price index is calculated on the closing prices on the last day of business of each month. The index covers all domestic industrial shares. It is a base weighted index but the chain-base method is used to take account of news issues, bonus issues, etc. Table 24.0 Selected International Exchange Rates, Source – Reserve Bank of Zimbabwe The Exchange rates are for the period after the introduction of multicurrency into the Country.
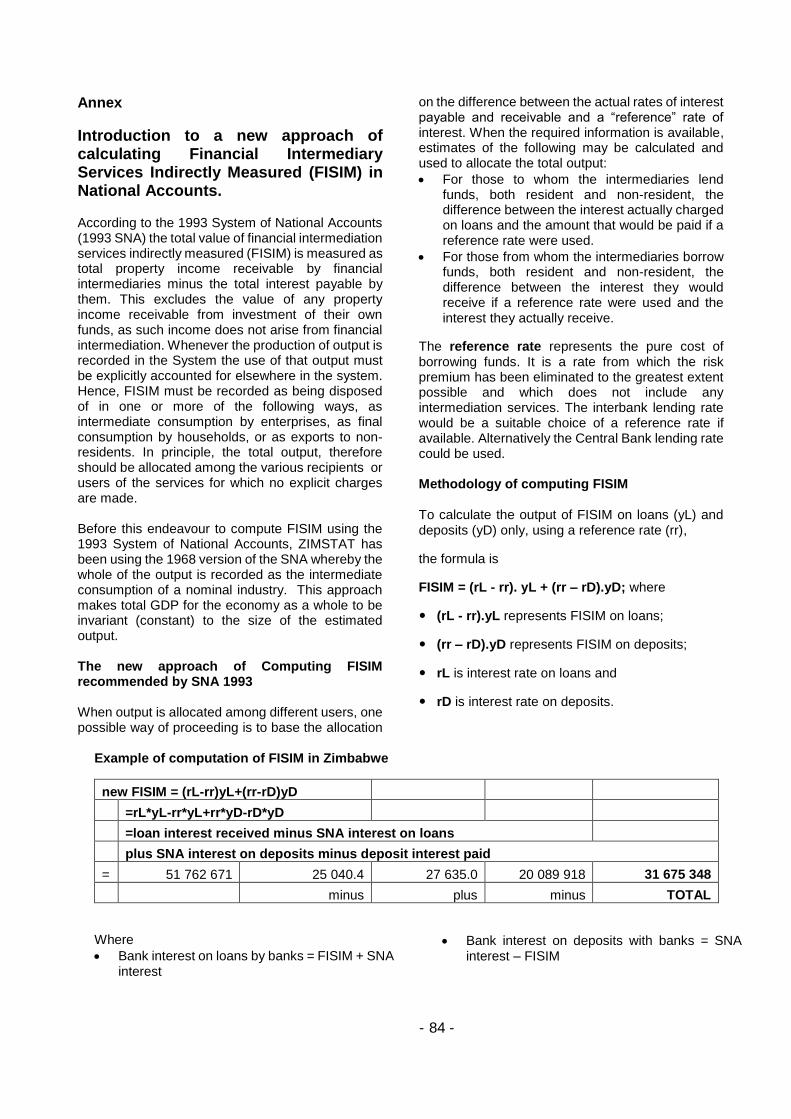
--84 -
Annex
Introduction to a new approach of calculating Financial Intermediary Services Indirectly Measured (FISIM) in National Accounts. According to the 1993 System of National Accounts (1993 SNA) the total value of financial intermediation services indirectly measured (FISIM) is measured as total property income receivable by financial intermediaries minus the total interest payable by them. This excludes the value of any property income receivable from investment of their own funds, as such income does not arise from financial intermediation. Whenever the production of output is recorded in the System the use of that output must be explicitly accounted for elsewhere in the system. Hence, FISIM must be recorded as being disposed of in one or more of the following ways, as intermediate consumption by enterprises, as final consumption by households, or as exports to non-residents. In principle, the total output, therefore should be allocated among the various recipients or users of the services for which no explicit charges are made. Before this endeavour to compute FISIM using the 1993 System of National Accounts, ZIMSTAT has been using the 1968 version of the SNA whereby the whole of the output is recorded as the intermediate consumption of a nominal industry. This approach makes total GDP for the economy as a whole to be invariant (constant) to the size of the estimated output. The new approach of Computing FISIM recommended by SNA 1993 When output is allocated among different users, one possible way of proceeding is to base the allocation
on the difference between the actual rates of interest payable and receivable and a “reference” rate of interest. When the required information is available, estimates of the following may be calculated and used to allocate the total output:
For those to whom the intermediaries lend funds, both resident and non-resident, the difference between the interest actually charged on loans and the amount that would be paid if a reference rate were used.
For those from whom the intermediaries borrow funds, both resident and non-resident, the difference between the interest they would receive if a reference rate were used and the interest they actually receive.
The reference rate represents the pure cost of borrowing funds. It is a rate from which the risk premium has been eliminated to the greatest extent possible and which does not include any intermediation services. The interbank lending rate would be a suitable choice of a reference rate if available. Alternatively the Central Bank lending rate could be used. Methodology of computing FISIM To calculate the output of FISIM on loans (yL) and deposits (yD) only, using a reference rate (rr),
the formula is
FISIM = (rL - rr). yL + (rr – rD).yD; where
(rL - rr).yL represents FISIM on loans;
(rr – rD).yD represents FISIM on deposits;
rL is interest rate on loans and
rD is interest rate on deposits.
Example of computation of FISIM in Zimbabwe
new FISIM = (rL-rr)yL+(rr-rD)yD
=rL*yL-rr*yL+rr*yD-rD*yD
=loan interest received minus SNA interest on loans
plus SNA interest on deposits minus deposit interest paid
= 51 762 671 25 040.4 27 635.0 20 089 918 31 675 348
minus plus minus TOTAL
Where
Bank interest on loans by banks = FISIM + SNA interest
Bank interest on deposits with banks = SNA interest – FISIM

--85 -
Use one reference rate to calculate FISIM on loans and deposits with resident financial institutions
Breakdown of Computations
SNA interest on loans = interbank rate*level of loans
FISIM on loans = Actual amount received – SNA interest
SNA interest on deposits = interbank rate*level of deposits
FISIM on deposits = SNA interest – actual amount paid
If this type of information is not available or not appropriate, the total value of FISIM could be allocated using different indicators. For example, it could be allocated in proportion to the total financial assets and liabilities that exist between financial intermediaries and various groups of users, or in proportion to other relevant financial variables. Two alternative methods of allocation of FISIM to users are permitted in the System of National Accounts; FISIM may either be allocated to the industries and sectors of the total economy or to a nominal industry and sector. The Allocation of FISIM to Industries For industries with market output or output for own use valued at market prices, the allocation of FISIM to that industry increases intermediate consumption and decreases value added. For industries with non-market output, the allocation of FISIM increases both intermediate consumption and output but leaves value added unchanged.
Work Currently Done on FISIM in Zimbabwe FISIM was computed using the interbank rate which is estimated as the average rate for the deposit rates. In the past Zimbabwe used to have an interbank rate but nowadays the banks negotiate between themselves on the interbank rate to use during transactions. The average deposit rate was chosen as it is less variable than the average commercial bank lending rate. An alternative would be to use the minimum lending rates when available. FISIM was computed using data on deposits and advances for commercial Banks, Merchant Banks and Building Societies. This data is easily obtainable from the Reserve Bank monthly Bulletins. Splitting by FISIM by industry FISIM was then split into various industries using each industry’s contribution to advances for both Commercial Banks and Merchant Banks using data from the Reserve Bank’s monthly Reviews. Individuals are part of the sectors covered and so they were removed as they are part of the GDP by expenditure approach. The splitting of the FISIM for the Expenditure table was done using the previous stable ratios of the expenditure table components. Old FISIM and New FISIM The old FISIM which is currently published in the revised National Accounts figures was split by industry using the ratios obtained in the NEW FISIM computed using the recommended approach using the 1993 System of National Accounts (SNA). The new FISIM figures have also been shown alongside the old FISIM figures. Revision of GDP together with updating the FISIM figures will be done after work on Central Business Register Survey (CBR) results are published.

--86 -
FISIM Analysis Old and New Approaches
2009 2010 2011
2012
New FISIM (Total Financial Sector) 51 214 401.00 130 449 507.00 212 216 554.00 285 201 438.00 FISIM Old (published in revised National Accounts figures) 22 138 249.00 35 641 097.00 50 253 947.00 67 328 897.00
GDP at market prices 8 157 077 422.00 9 456 808 151.00 10 956 226 611.00 12 472 416 688.00
New FISIM from Fin Sector % GDP 0.63 1.38 1.94 2.29
FISIM OLD as percentage of GDP (%) 0.27 0.38 0.46 0.54
Comparison with old series 1985 1986 1987 1988
Imputed Bank Charges % of GDP 2.3 2.2 2.5 2.1
New FISIM Financial Sector 2009 2010 2011
2012
FISIM Commercial Banks 49 478 911.00 120 996 127.00 177 624 340.00 243 768 834.00
FISIM Merchant Banks - 2 057 440.00 5 143 660.00 9 943 839.00 9 757 256.00
FISIM Building Society 3 792 930.00 4 309 720.00 24 648 375.00 31 675 348.00
Total New FISIM 51 214 401.00 130 449 507.00 212 216 554.00 285 201 438.00
Variance New FISIM less Old FISIM 29 076 152.00 94 808 410.00 161 962 607.00 217 872 541.00
Total Advances of Commercial Banks and Merchant Banks by Industry Sector), Percent (Excluding advances made to individuals)
2009 2010 2011
2012
Agriculture 14.1 17.5 17.6 19
Construction 1.9 2.8 3 2.6
Distribution 21.7 20.5 17.6 16.7
Finance and insurance 9.3 9.8 10.5 7.8
Manufacturing and Conglomerates 27.7 21.9 21 20
Mining 10.1 12.2 9 11
Services 11.9 11.6 14.8 16.3
Transport 3.4 3.7 6.6 6.7
Total 100.1 100 100.1 100.1
New FISIM Production Approach by Industry
2009 2010 2011
2012
Agriculture 7 214 017.00 22 828 664.00 37 312 801.00 54 134 139.00
Construction 972 102.00 3 652 586.00 6 360 137.00 7 407 830.00
Distribution 11 102 423.00 26 742 149.00 37 312 801.00 47 581 059.00
Finance and insurance 4 758 181.00 12 784 052.00 22 260 478.00 22 223 489.00
Manufacturing and Conglomerates 14 172 217.00 28 568 442.00 44 520 955.00 56 983 304.00
Mining 5 167 487.00 15 914 840.00 19 080 410.00 31 340 817.00
Services 6 088 425.00 15 132 143.00 31 376 673.00 46 441 393.00
Transport 1 739 550.00 4 826 632.00 13 992 300.00 19 089 407.00
Total 51 214 401.00 130 449 507.00 212 216 554.00 285 201 438.00

--87 -
Old FISIM Production Approach by Industry
2009 2010 2011 2012
Agriculture 3 118 375.00 6 237 192.00 8 835 859.00 12 779 711.00
Construction 420 207.00 997 951.00 1 506 112.00 1 748 803.00
Distribution 4 799 201.00 7 306 425.00 8 835 859.00 11 232 693.00
Finance and insurance 2 056 800.00 3 492 828.00 5 271 393.00 5 246 408.00
Manufacturing and Conglomerates 6 126 169.00 7 805 400.00 10 542 786.00 13 452 327.00
Mining 2 233 729.00 4 348 214.00 4 518 337.00 7 398 780.00
Services 2 631 820.00 4 134 367.00 7 430 154.00 10 963 647.00
Transport 751 949.00 1 318 721.00 3 313 447.00 4 506 530.00
Total 22 138 249.00 35 641 097.00 50 253 947.00 67 328 897.00 New FISIM Allocation to Expenditure
2009 2010 2011 2012
Final Consumption 41 432 450.00 105 533 651.00 171 683 192.00 230 727 963.00
Private Consumption (as a residual) 32 531 388.00 82 861 527.00 134 799 955.00 181 159 953.00
Consumption of Private Non-Profit Bodies 317 529.00 808 787.00 1 315 743.00 1 768 249.00
Government Consumption Expenditure 8 583 534.00 21 863 337.00 35 567 494.00 47 799 761.00
Gross Capital Formation 11 154 497.00 28 411 903.00 46 220 765.00 62 116 873.00
Gross Fixed Capital Formation 11 512 997.00 29 325 049.00 47 706 281.00 64 113 283.00
Exports of Goods and Services 18 273 298.00 46 544 384.00 75 718 866.00 101 759 873.00
Imports of Goods and Services 19 635 601.00 50 014 341.00 81 363 827.00 109 346 231.00
Total FISIM Allocation 51 214 401.00 130 449 507.00 212 216 554.00 285 201 438.00 Old FISIM Allocation to Expenditure Table
2009 2010 2011 2012
Final Consumption 17 909 843.00 28 833 648.00 40 655 443.00 54 469 078.00
Private Consumption (as a residual) 14 062 216.00 22 639 225.00 31 921 307.00 42 767 316.00
Consumption of Private Non-Profit Bodies 137 257.00 220 975.00 311 574.00 417 439.00
Government Consumption Expenditure 3 710 370.00 5 973 448.00 8 422 561.00 11 284 323.00
Gross Capital Formation 4 821 711.00 7 762 631.00 10 945 310.00 14 664 234.00
Gross Fixed Capital Formation 4 976 678.00 8 012 119.00 11 297 087.00 15 135 536.00
Exports of Goods and Services 7 898 927.00 12 716 743.00 17 930 608.00 24 022 951.00
Imports of Goods and Services 8 487 805.00 13 664 797.00 19 267 363.00 25 813 899.00
Total Old FISIM Allocation 22 138 249.00 35 641 097.00 50 253 947.00 67 328 897.00