quarterly disclosure report for the six months ended ... · texas a&m university-corpus...
TRANSCRIPT
Quarterly Disclosure Report
For the Six Months Ended December 31, 2018
(Unaudited)
Peter J. McCanna President and Interim Chief Financial Officer
Baylor Scott & White Health 214-820-7506
www.BaylorScottandWhite.com
Quarterly Disclosure Report for December 31, 2018
TARRANT COUNTY CULTURAL EDUCATION TARRANT COUNTY CULTURAL EDUCATIONFACILITIES FINANCE CORPORATION FACILITIES FINANCE CORPORATION
HOSPITAL REVENUE BONDS HOSPITAL REVENUE BONDS(BAYLOR HEALTH CARE SYSTEM PROJECT) (BAYLOR HEALTH CARE SYSTEM PROJECT)
SERIES 2011A SERIES 2011B7 MONTH WINDOW VRDB
TARRANT COUNTY CULTURAL EDUCATION TARRANT COUNTY CULTURAL EDUCATIONFACILITIES FINANCE CORPORATION FACILITIES FINANCE CORPORATION
HOSPITAL REVENUE BONDS HOSPITAL REVENUE BONDS(BAYLOR HEALTH CARE SYSTEM PROJECT) (BAYLOR HEALTH CARE SYSTEM PROJECT)
SERIES 2011C SERIES 2013A
TARRANT COUNTY CULTURAL EDUCATION TARRANT COUNTY CULTURAL EDUCATIONFACILITIES FINANCE CORPORATION FACILITIES FINANCE CORPORATION
HOSPITAL REVENUE BONDS TAXABLE HOSPITAL REVENUE BONDS(BAYLOR HEALTH CARE SYSTEM PROJECT) (BAYLOR HEALTH CARE SYSTEM PROJECT)
SERIES 2013B SERIES 2013C7 MONTH WINDOW VRDB
TARRANT COUNTY CULTURAL EDUCATION TARRANT COUNTY CULTURAL EDUCATIONFACILITIES FINANCE CORPORATION FACILITIES FINANCE CORPORATION
HOSPITAL REVENUE BONDS HOSPITAL REVENUE BONDS(SCOTT & WHITE HEALTHCARE PROJECT) (SCOTT & WHITE HEALTHCARE PROJECT)
SERIES 2013A SERIES 2013C
BAYLOR SCOTT & WHITE HOLDINGS BAYLOR SCOTT & WHITE HOLDINGSTAXABLE BONDS TAXABLE BONDS
SERIES 2015 SERIES 2016
TARRANT COUNTY CULTURAL EDUCATION BAYLOR SCOTT & WHITE HOLDINGSFACILITIES FINANCE CORPORATION TAXABLE COMMERCIAL PAPER NOTES
HOSPITAL REVENUE BONDS SERIES A(BAYLOR SCOTT & WHITE HEALTHCARE PROJECT)
SERIES 2016A
BAYLOR SCOTT & WHITE HEALTH
NOTICErelating to:

Quarterly Disclosure Report for December 31, 2018
CUSIP No.'s:
87638QFN4, 87638QFP9, 87638QFK0, 87638QFL8, 87638QFQ7, 87638QFR5, 87638QFS3,87638QFM6, 87638QFT1, 87638QFX2, 87638QEW5, 87638QGU7, 87638QGV5, 87638QGW3,87638QHA0, 87638QGX1, 87638QGY9, 87638QGZ6, 87638QGT0, 87638QHB8, 072863AA1,072863AB9, 072863AC7, 072863AD5, 072863AE3, 072863AF0, 87638QNV7, 87638QNW5,87638QNX3, 87638QNY1, 87638QNZ8, 87638QPA1, 87638QPB9, 87638QPC7, 87638QPD5,87638QPE3, 87638QPF0, 87638QPG8, 87638QPH6, 87638QPJ2, 87638QPK9, 87638QPL7,87638QPM5, 87638QPN3, 87638QPQ6, 87638QPR4, 87638QPP8, 87638QGC7, 87638QGD5,87638QGE3, 87638QGF0, 87638QGG8, 87638QGH6, 87638QGJ2, 87638QGK9, 87638QGL7,87638QGM5, 87638QGN3, 87638QGQ6, 87638QGP8, 87638QGR4
Commercial Paper Base CUSIP No.'s:
07287B 07287C 07287D
THE REMAINDER OF THIS PAGE WAS INTENTIONALLY LEFT BLANK
Quarterly Disclosure Report for December 31, 2018
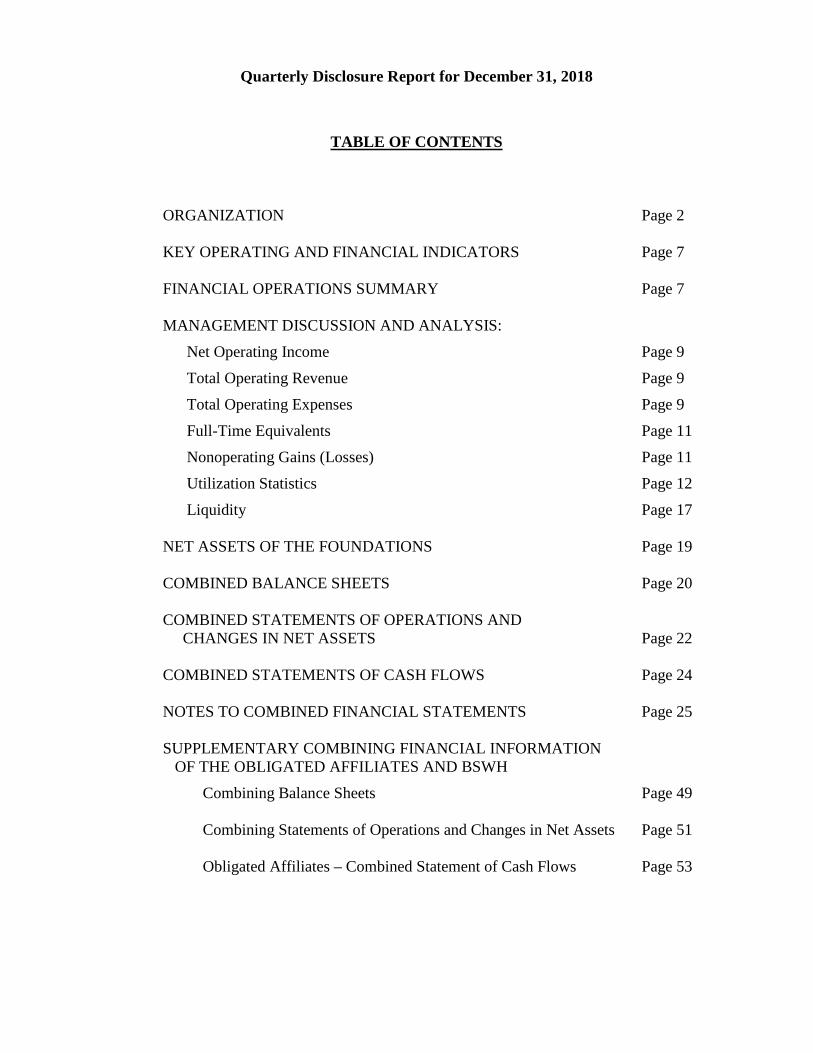
TABLE OF CONTENTS
ORGANIZATION Page 2 KEY OPERATING AND FINANCIAL INDICATORS Page 7 FINANCIAL OPERATIONS SUMMARY Page 7 MANAGEMENT DISCUSSION AND ANALYSIS:
Net Operating Income Page 9
Total Operating Revenue Page 9
Total Operating Expenses Page 9
Full-Time Equivalents Page 11
Nonoperating Gains (Losses) Page 11
Utilization Statistics Page 12
Liquidity Page 17 NET ASSETS OF THE FOUNDATIONS Page 19 COMBINED BALANCE SHEETS Page 20 COMBINED STATEMENTS OF OPERATIONS AND CHANGES IN NET ASSETS Page 22 COMBINED STATEMENTS OF CASH FLOWS Page 24 NOTES TO COMBINED FINANCIAL STATEMENTS Page 25 SUPPLEMENTARY COMBINING FINANCIAL INFORMATION OF THE OBLIGATED AFFILIATES AND BSWH Combining Balance Sheets Page 49 Combining Statements of Operations and Changes in Net Assets Page 51 Obligated Affiliates – Combined Statement of Cash Flows Page 53
Quarterly Disclosure Report for December 31, 2018
- 1 -
ATTENTION
This document is marked with a dated date of December 31, 2018 and reflects information only as of that dated date. Readers are cautioned not to assume that any information has been updated beyond the dated date except as to any portion of the document that expressly states that it constitutes an update concerning specific recent events occurring after the dated date of the document. Any information contained in the portion of the document indicated to concern recent events speaks only as of its date. We expressly disclaim any duty to provide an update of any information contained in this document.
The information contained in this document may include “forward-looking statements” by using forward-looking words such as “may,” “will,” “should,” “expects,” “believes,” “anticipates,” “estimates,” or others. You are cautioned that forward-looking statements are subject to a variety of uncertainties that could cause actual results to differ from the projected results. Those risks and uncertainties include general economic and business conditions, receipt of funding grants, and various other factors which are beyond our control.
Because we cannot predict all factors that may affect future decisions, actions, events, or financial circumstances, what actually happens may be different from what we include in forward-looking statements.
THE REMAINDER OF THIS PAGE WAS INTENTIONALLY LEFT BLANK
Quarterly Disclosure Report for December 31, 2018
- 2 -
ORGANIZATION Baylor Scott & White Health System Baylor Scott & White Holdings (BSW Holdings), a Texas nonprofit corporation, and its controlled affiliates (collectively, the “System” or “BSWH”) were created from the combination of two Texas health care systems, Baylor Health Care System (BHCS) and its controlled affiliates and Scott & White Healthcare (S&W) and its controlled affiliates. BSW Holdings and Baylor Scott & White Health (BSW Health), a Texas nonprofit corporation, were created by BHCS and S&W in connection with their combination. BSW Holdings is the sole member of BHCS, S&W, and BSW Health and has control and substantial reserved powers over all BHCS and S&W controlled affiliates. The System includes two flagship hospitals, Baylor University Medical Center (BUMC) and Scott & White Memorial Hospital, now doing business as Baylor Scott & White Medical Center - Temple (SWMH), along with twenty-two other hospitals (see “BSWH Adult and Pediatric Licensed Beds” table) located in north and central Texas, excluding joint venture hospitals noted below. The System includes five foundations and one research institute which are the Baylor Health Care System Foundation, Scott & White Healthcare Foundation, Irving Healthcare Foundation, All Saints Health Foundation, Scott & White Healthcare Foundation Brenham, and Baylor Scott & White Health Research Institute. The System also includes Baylor Scott & White Quality Alliance (BSWQA). BSWQA is an accountable care organization functioning as a clinically integrated health network of employed physicians, independent physicians, hospitals, and other providers of care who are committed to delivering high quality, cost-effective, value-based care. The System also includes Scott & White Clinic (the “Clinic”), HealthTexas Provider Network (HTPN), Hillcrest Family Health Center, and Hillcrest Physician Services. The Clinic, a Texas nonprofit corporation, operates clinics located throughout the central Texas area, in addition to the main campus in Temple, Texas. HTPN is a Texas nonprofit corporation that owns and operates primary care and specialty practices in the Dallas-Fort Worth metroplex and north Texas. Hillcrest Family Health Center and Hillcrest Physician Services operate clinics in the greater Waco area. The System operates Scott and White Health Plan and its subsidiary, Insurance Company of Scott and White (collectively referred to as the “Health Plan”), which provides health insurance benefits to approximately 226,000 members through a variety of commercial, Medicaid, Medicare, Part D, Pharmacy Benefits Management, and Administrative Services Only products and services.
Quarterly Disclosure Report for December 31, 2018
- 3 -
The System’s combined financial statements also include partnerships through Texas Health Ventures Group, LLC (THVG JV) with ten short-stay surgery hospitals and twenty-eight ambulatory surgery centers, BIR JV, LLP (BIR JV) with four rehabilitation hospitals and ninety-three clinics, EBD JV, LLP (EBD JV) with eight emergency medical centers, ESWCT, LLC that operates one emergency medical center, BTDI JV, LLP (BTDI JV) with thirty-eight imaging centers, and THVG Bariatric, LLC (THVGB), which has provided bariatric services. The System is committed to medical education in support of its mission of exemplary care, education, and research. The Texas A&M College of Medicine and the System have established Clinical Training Programs, for which medical students complete clinical rotations at BUMC and SWMH. Central Texas Veterans Health Care System is a major clinical partner in Temple and helps to train the System’s residents and medical students. Because of this affiliation, the System’s trainees are able to better identify the needs of veterans and their families. Nursing education is conducted through programs and affiliations with numerous schools of nursing including Baylor University School of Nursing, Dallas County Community College District, Texas A&M University-Corpus Christi, Texas Woman’s University, University of Mary Hardin-Baylor, and the University of Texas at Arlington. A number of these students remain with the System as employees following their training and education. Obligated Group BSW Holdings and certain of its affiliates issue and secure debt (“Master Debt”) under a Master Indenture of Trust and Security Agreement, dated as of February 1, 2014, as supplemented and amended (the “Master Indenture”), among BSW Holdings, the affiliates from time to time obligated thereunder (the “Obligated Affiliates”), and The Bank of New York Mellon Trust Company, National Association, as trustee. The following entities are currently Obligated Affiliates:
- BSW Holdings - BSW Health - BHCS, a Texas nonprofit corporation - S&W, a Texas nonprofit corporation - BUMC, a Texas nonprofit corporation - Baylor All Saints Medical Center, a Texas nonprofit corporation, doing business as
Baylor Scott & White All Saints Medical Center – Fort Worth - Baylor Regional Medical Center at Grapevine, a Texas nonprofit corporation, doing
business as Baylor Scott & White Medical Center – Grapevine - Baylor Medical Center at Waxahachie, a Texas nonprofit corporation, doing business
as Baylor Scott & White Medical Center – Waxahachie - Baylor Regional Medical Center at Plano, a Texas nonprofit corporation, doing business
as Baylor Scott & White Medical Center – Plano - SWMH, a Texas nonprofit corporation, also doing business as Baylor Scott & White
McLane Children’s Medical Center

Quarterly Disclosure Report for December 31, 2018
- 4 -
- Scott & White Clinic, a Texas nonprofit corporation - Scott & White Hospital – Round Rock, a Texas nonprofit corporation, doing business
as Baylor Scott & White Medical Center – Round Rock and Baylor Scott & White Medical Center – Lakeway
- Scott & White Continuing Care Hospital, a Texas nonprofit corporation, doing business as Baylor Scott & White Continuing Care Hospital
- Hillcrest Baptist Medical Center, a Texas nonprofit corporation, doing business as Baylor Scott & White Medical Center – Hillcrest
- Baylor Medical Centers at Garland and McKinney, a Texas nonprofit corporation, doing business as Baylor Scott & White Medical Center – McKinney
- Scott & White Hospital – College Station, a Texas nonprofit corporation, doing business as Baylor Scott & White Medical Center – College Station
BSW Holdings is currently the Combined Group Representative under the Master Indenture. There are currently no Designated Affiliates under the Master Indenture.
The combined System’s credit ratings are Aa3 (Stable Outlook) by Moody’s Investors Service and AA- (Stable Outlook) by S&P Global Ratings.
Awards and Distinctions
The System is recognized as one of the leading health care delivery systems across the United States, having received the following recognitions, among others:
• U.S. News & World Report – According to U.S. News & World Report’s “Best
Hospitals” and “Best Hospitals for Common Care” 2017-2018 ratings, 13 Baylor Scott & White Health hospitals received recognition. This includes four nationally ranked hospitals and two hospitals in the Texas Top Ten, the most of any health system in Texas.
• Becker’s Hospital Review – Listed among the 150 Top Places to Work in Healthcare.
• Fortune and Great Place to Work – Listed among the Best Work Places in Health Care by Fortune and the Great Place to Work Institute for the second year in a row.
• Eighty HTPN practices and fifty-one S&W clinics have received the National Committee for Quality Assurance (“NCQA”) Patient-Centered Medical Home Recognition for using evidence-based, patient-centered processes that focus on highly coordinated care and long-term, participative relationships.
• Press Ganey – 11 hospitals earned the Press Ganey Guardian of Excellence Award, which recognizes top-performing health care facilities that have consistently rated in the 95th percentile or above for patient experience based on one year of data. Additionally, 3 hospitals earned the Pinnacle of Excellence Award.
Quarterly Disclosure Report for December 31, 2018
- 5 -
BUMC
• U.S. News & World Report – BUMC is ranked as the No. 2 hospital in the Dallas metro area, as well as No. 3 in Texas, and was nationally recognized for the 25th consecutive year.
• U.S. News & World Report – Named as one of the top 50 hospitals nationally in two medical specialties: Ear, Nose & Throat and Gastroenterology & GI Surgery, and high performing in Cancer, Diabetes & Endocrinology, Geriatrics, Neurology and Neurosurgery, Nephrology, Orthopedics, and Pulmonology.
• The Joint Commission – Reaccredited with a Gold Seal of Approval™ for the Ventricular Assist Device Program, the nation’s first such accredited program.
• Extracorporeal Life Support Organization (ESLO) - Gold Level Award for Excellence in Life Support – BUMC is the first and only adult extracorporeal membrane oxygenation (ECMO) center in north Texas to earn this award.
SWMH
• U.S. News & World Report – Ranked among top 10 hospitals in Texas; nationally ranked in Ear, Nose and Throat care; high performing in two specialties – Gastroenterology & GI Surgery, and Pulmonology; high performing in four common procedures or conditions – heart failure, colon cancer surgery, COPD (chronic obstructive pulmonary disease), and knee replacement.
• Becker’s Hospital Review – 100 Hospitals and Health Systems with Great Oncology Programs in U.S. for Glenda Tanner Vasicek Cancer Center.
• American Heart Association/American Stroke Association – Get with the Guidelines®– Stroke GOLD PLUS Target; Stroke Elite Plus Quality Achievement Award.
• American Heart Association – Mission: Lifeline® STEMI Receiving Center – GOLD Plus Achievement Award Hospital.
• American Heart Association – Mission: Lifeline® NSTEMI – Bronze Achievement Award.
• The Joint Commission – The Gold Seal of Approval; Accredited Programs in Hospital, Nursing Care Center, Home Care; Advanced Certification in Stroke (Primary Stroke Center) and Ventricular Assist Device.
Quarterly Disclosure Report for December 31, 2018
- 6 -
BSWQA
• NCQA ACO Accredition: Level 2 – Verifies BSWQA has the infrastructure to support value-based delivery and the accountability.
• NCQA Patient-Centered Medical Home Recognition – 146 practices representing 655 providers.
• Becker’s Hospital Review – Named to Becker’s Top 110 ACOs to Know in 2018.
• NCQA Case Management Accreditation – The National Committee for Quality Assurance (NCQA) awarded BSWQA 3-year Accreditation for its Case Management program, effective December 19, 2017 – December 19, 2020. This Accreditation verifies that BSWQA has a process in place to ensure safe transitions.
• NAACOS “Innovation” Award – Honors BSWQA’s improvements in the percentage of providers meeting or exceeding focus measures.
Health Plan
• Every year, Medicare evaluates plans based on a 5-star rating system. The Health Plan’s SeniorCare (Cost) HMO received an overall 4.5 out of 5 stars from the Centers for Medicare & Medicaid Services for 2018. SeniorCare Advantage HMO, which was first offered in 2018, also now bears the 4.5 out of 5 star rating, as the SeniorCare (Cost) membership was passively enrolled into the SeniorCare Advantage HMO effective January 1, 2019. Due to this star rating, the Health Plan was recently recognized as one of the 2019 Best Insurance Companies for Medicare Advantage by U.S. News & World Report – making it one of only two Medicare providers in Texas to be included on this prestigious list.
• The Health Plan is consistently rated one of the top health plans in Texas by NCQ’s Private Health Insurance Plan Ratings.
THE REMAINDER OF THIS PAGE WAS INTENTIONALLY LEFT BLANK

Quarterly Disclosure Report for December 31, 2018
- 7 -
KEY OPERATING AND FINANCIAL INDICATORS The information contained in this document represents the financial condition and results of operations of BSWH for fiscal years ending June 30, 2018 and 2017, and the six months ended December 31, 2018 and 2017.
FINANCIAL OPERATIONS SUMMARY
BSWH Summary Combined Balance Sheets($ Thousands)
2017 2018 2017 2018ASSETSCurrent assets $ 2,840,871 $ 2,992,900 $ 3,041,856 $ 2,813,107 Long-term investments 3,562,260 4,024,716 3,785,973 4,134,039 Assets whose use is limited 324,526 302,997 340,982 287,248 Property and equipement, net 3,525,384 3,683,590 3,577,277 3,768,179 Other assets 893,565 1,133,858 1,130,581 1,137,769 Total assets $ 11,146,606 $ 12,138,061 $ 11,876,669 $ 12,140,342 LIABILITIES AND NET ASSETSCurrent liabilities $ 1,422,380 $ 1,797,414 $ 1,573,148 $ 1,640,607 Long-term debt and capital lease obligations less current maturities 3,171,837 3,087,064 3,062,642 3,121,040 Other long-term liabilities 670,301 635,141 674,562 656,274 Total liabilities 5,264,518 5,519,619 5,310,352 5,417,921 Noncontrolling interests - redeemable 443,128 424,704 510,049 449,577 Net assets 5,438,960 6,193,738 6,056,268 6,272,844 Total liabilities and net assets $ 11,146,606 $ 12,138,061 $ 11,876,669 $ 12,140,342
June 30, December 31,
($ Thousands)
2017 2018 2017 2018
Total operating revenue 9,084,476$ 9,476,624$ 4,813,562$ 4,909,417$ Operating margin 3.2% 6.1% 8.0% 8.5%Adjusted EBITDA (1) 888,767$ 1,244,121$ 730,496$ 731,347$ Cash and investments 5,268,661$ 5,770,844$ 5,566,737$ 5,561,761$ Days in patient accounts receivable (2) 38.5 36.0 39.1 37.1
(1) Adjusted Earnings Before Interest, Taxes, Depreciation and Amortization (EBITDA) is defined as revenue in excess of expenses plus depreciation, amortization, taxes, interest, excluding unrealized gains/losses on investments, unrealized gains/losses on interest rate swaps, and loss on extinguishment of debt.(2) Days in Patient Accounts Receivable is defined as net patient receivables divided by average daily net patient care revenue. Average daily net patient revenue is defined as net patient care revenue (less patient related bad debt) divided by the number of days in the period.
BSWH Key Operating and Financial Indicators
June 30,Year Ended Six Months Ended
December 31,
Quarterly Disclosure Report for December 31, 2018
- 8 -
BSWH Summary Financial Information ($ Thousands)
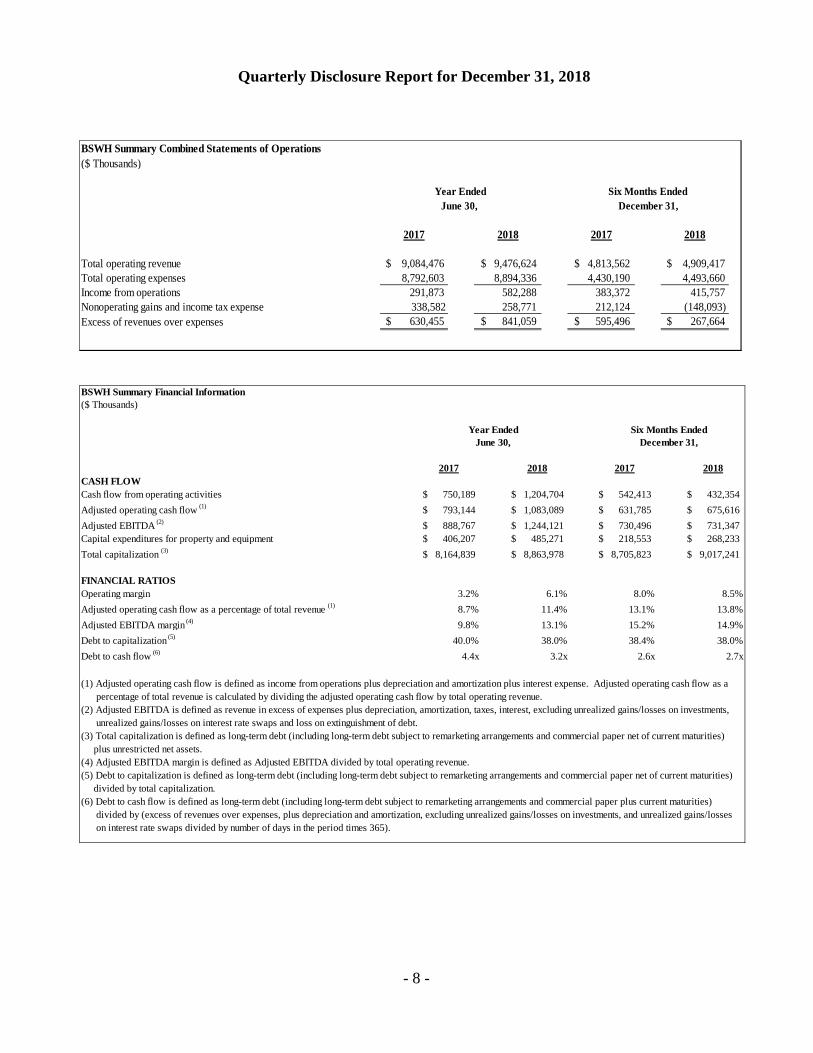
2017 2018 2017 2018CASH FLOW Cash flow from operating activities 750,189$ 1,204,704$ 542,413$ 432,354$ Adjusted operating cash flow (1) 793,144$ 1,083,089$ 631,785$ 675,616$ Adjusted EBITDA (2) 888,767$ 1,244,121$ 730,496$ 731,347$ Capital expenditures for property and equipment 406,207$ 485,271$ 218,553$ 268,233$ Total capitalization (3) 8,164,839$ 8,863,978$ 8,705,823$ 9,017,241$
FINANCIAL RATIOSOperating margin 3.2% 6.1% 8.0% 8.5%Adjusted operating cash flow as a percentage of total revenue (1) 8.7% 11.4% 13.1% 13.8%Adjusted EBITDA margin (4) 9.8% 13.1% 15.2% 14.9%Debt to capitalization (5) 40.0% 38.0% 38.4% 38.0%Debt to cash flow (6) 4.4x 3.2x 2.6x 2.7x
plus unrestricted net assets.
divided by total capitalization.
divided by (excess of revenues over expenses, plus depreciation and amortization, excluding unrealized gains/losses on investments, and unrealized gains/losses
(4) Adjusted EBITDA margin is defined as Adjusted EBITDA divided by total operating revenue.(5) Debt to capitalization is defined as long-term debt (including long-term debt subject to remarketing arrangements and commercial paper net of current maturities)
(6) Debt to cash flow is defined as long-term debt (including long-term debt subject to remarketing arrangements and commercial paper plus current maturities)
on interest rate swaps divided by number of days in the period times 365).
(3) Total capitalization is defined as long-term debt (including long-term debt subject to remarketing arrangements and commercial paper net of current maturities)
(1) Adjusted operating cash flow is defined as income from operations plus depreciation and amortization plus interest expense. Adjusted operating cash flow as a percentage of total revenue is calculated by dividing the adjusted operating cash flow by total operating revenue.(2) Adjusted EBITDA is defined as revenue in excess of expenses plus depreciation, amortization, taxes, interest, excluding unrealized gains/losses on investments, unrealized gains/losses on interest rate swaps and loss on extinguishment of debt.
Year Ended Six Months EndedJune 30, December 31,
BSWH Summary Combined Statements of Operations($ Thousands)
2017 2018 2017 2018
Total operating revenue $ 9,084,476 $ 9,476,624 $ 4,813,562 $ 4,909,417 Total operating expenses 8,792,603 8,894,336 4,430,190 4,493,660 Income from operations 291,873 582,288 383,372 415,757 Nonoperating gains and income tax expense 338,582 258,771 212,124 (148,093)Excess of revenues over expenses $ 630,455 $ 841,059 $ 595,496 $ 267,664
Year EndedJune 30, December 31,
Six Months Ended
Quarterly Disclosure Report for December 31, 2018
- 9 -
MANAGEMENT DISCUSSION AND ANALYSIS
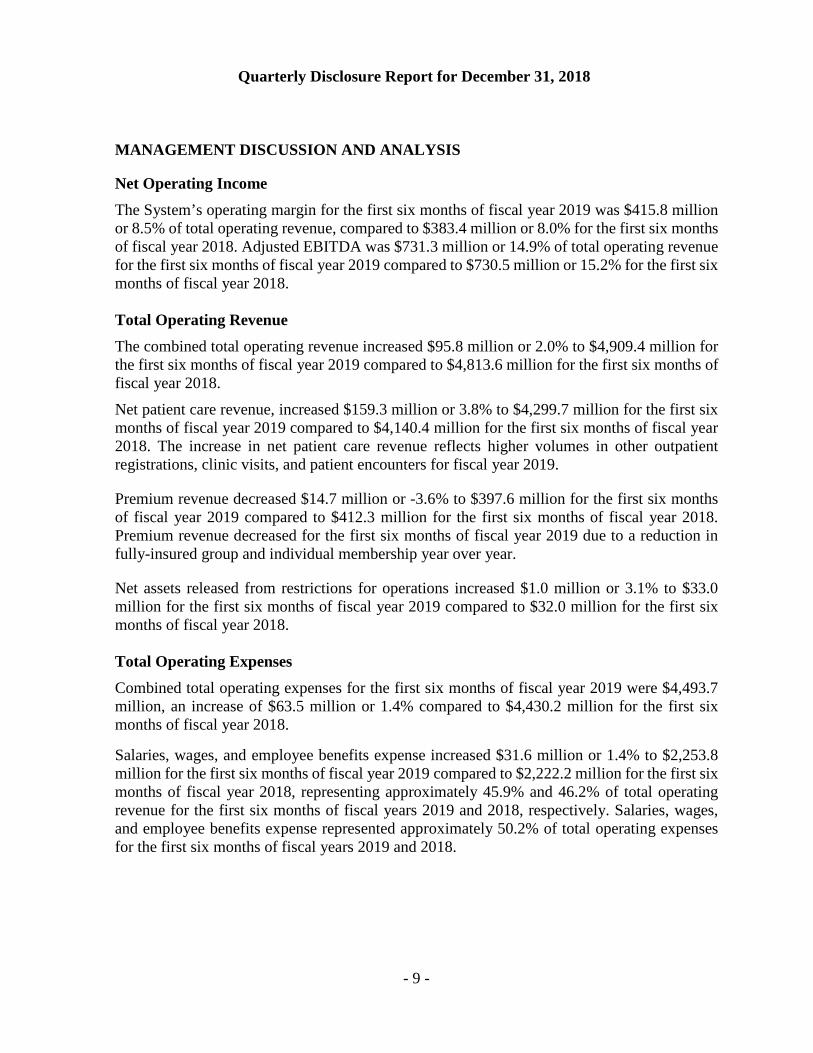
Net Operating Income The System’s operating margin for the first six months of fiscal year 2019 was $415.8 million or 8.5% of total operating revenue, compared to $383.4 million or 8.0% for the first six months of fiscal year 2018. Adjusted EBITDA was $731.3 million or 14.9% of total operating revenue for the first six months of fiscal year 2019 compared to $730.5 million or 15.2% for the first six months of fiscal year 2018. Total Operating Revenue The combined total operating revenue increased $95.8 million or 2.0% to $4,909.4 million for the first six months of fiscal year 2019 compared to $4,813.6 million for the first six months of fiscal year 2018. Net patient care revenue, increased $159.3 million or 3.8% to $4,299.7 million for the first six months of fiscal year 2019 compared to $4,140.4 million for the first six months of fiscal year 2018. The increase in net patient care revenue reflects higher volumes in other outpatient registrations, clinic visits, and patient encounters for fiscal year 2019. Premium revenue decreased $14.7 million or -3.6% to $397.6 million for the first six months of fiscal year 2019 compared to $412.3 million for the first six months of fiscal year 2018. Premium revenue decreased for the first six months of fiscal year 2019 due to a reduction in fully-insured group and individual membership year over year. Net assets released from restrictions for operations increased $1.0 million or 3.1% to $33.0 million for the first six months of fiscal year 2019 compared to $32.0 million for the first six months of fiscal year 2018.
Total Operating Expenses Combined total operating expenses for the first six months of fiscal year 2019 were $4,493.7 million, an increase of $63.5 million or 1.4% compared to $4,430.2 million for the first six months of fiscal year 2018. Salaries, wages, and employee benefits expense increased $31.6 million or 1.4% to $2,253.8 million for the first six months of fiscal year 2019 compared to $2,222.2 million for the first six months of fiscal year 2018, representing approximately 45.9% and 46.2% of total operating revenue for the first six months of fiscal years 2019 and 2018, respectively. Salaries, wages, and employee benefits expense represented approximately 50.2% of total operating expenses for the first six months of fiscal years 2019 and 2018.
Quarterly Disclosure Report for December 31, 2018
- 10 -
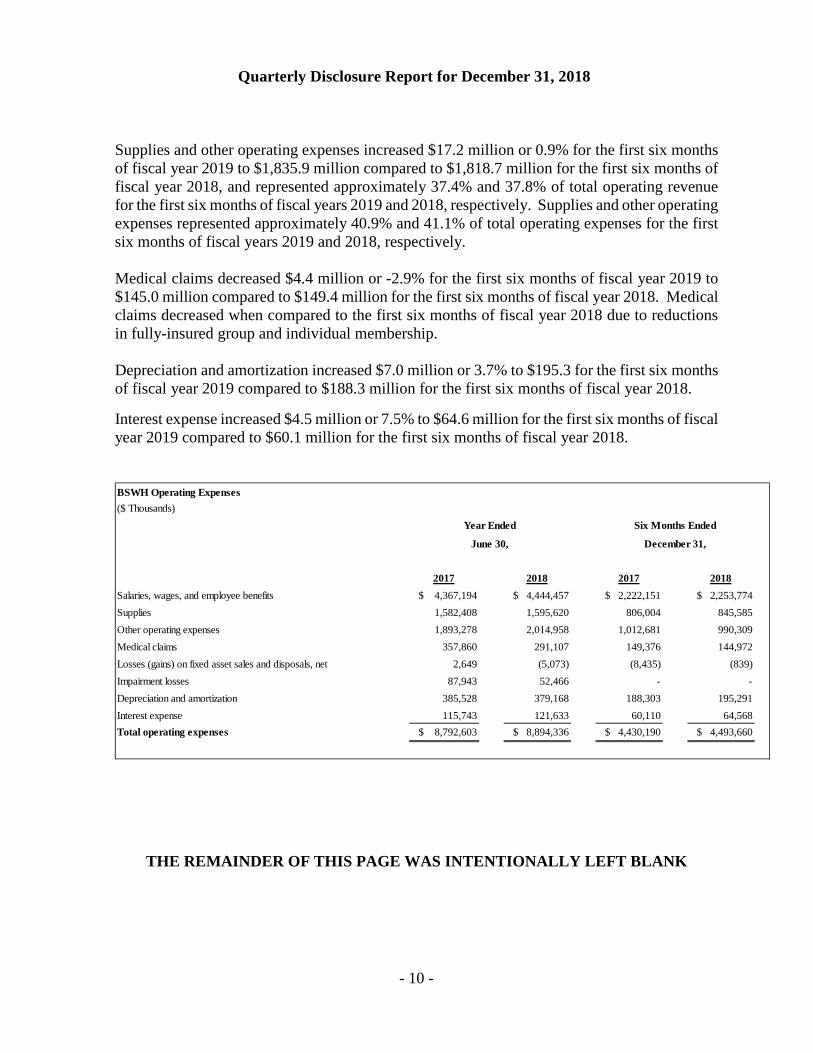
Supplies and other operating expenses increased $17.2 million or 0.9% for the first six months of fiscal year 2019 to $1,835.9 million compared to $1,818.7 million for the first six months of fiscal year 2018, and represented approximately 37.4% and 37.8% of total operating revenue for the first six months of fiscal years 2019 and 2018, respectively. Supplies and other operating expenses represented approximately 40.9% and 41.1% of total operating expenses for the first six months of fiscal years 2019 and 2018, respectively. Medical claims decreased $4.4 million or -2.9% for the first six months of fiscal year 2019 to $145.0 million compared to $149.4 million for the first six months of fiscal year 2018. Medical claims decreased when compared to the first six months of fiscal year 2018 due to reductions in fully-insured group and individual membership. Depreciation and amortization increased $7.0 million or 3.7% to $195.3 for the first six months of fiscal year 2019 compared to $188.3 million for the first six months of fiscal year 2018. Interest expense increased $4.5 million or 7.5% to $64.6 million for the first six months of fiscal year 2019 compared to $60.1 million for the first six months of fiscal year 2018. BSWH Operating Expenses($ Thousands)
2017 2018 2017 2018Salaries, wages, and employee benefits $ 4,367,194 $ 4,444,457 $ 2,222,151 $ 2,253,774 Supplies 1,582,408 1,595,620 806,004 845,585 Other operating expenses 1,893,278 2,014,958 1,012,681 990,309 Medical claims 357,860 291,107 149,376 144,972 Losses (gains) on fixed asset sales and disposals, net 2,649 (5,073) (8,435) (839)Impairment losses 87,943 52,466 - - Depreciation and amortization 385,528 379,168 188,303 195,291 Interest expense 115,743 121,633 60,110 64,568 Total operating expenses $ 8,792,603 $ 8,894,336 $ 4,430,190 $ 4,493,660
June 30,
Year Ended Six Months Ended
December 31,
THE REMAINDER OF THIS PAGE WAS INTENTIONALLY LEFT BLANK
Quarterly Disclosure Report for December 31, 2018
- 11 -
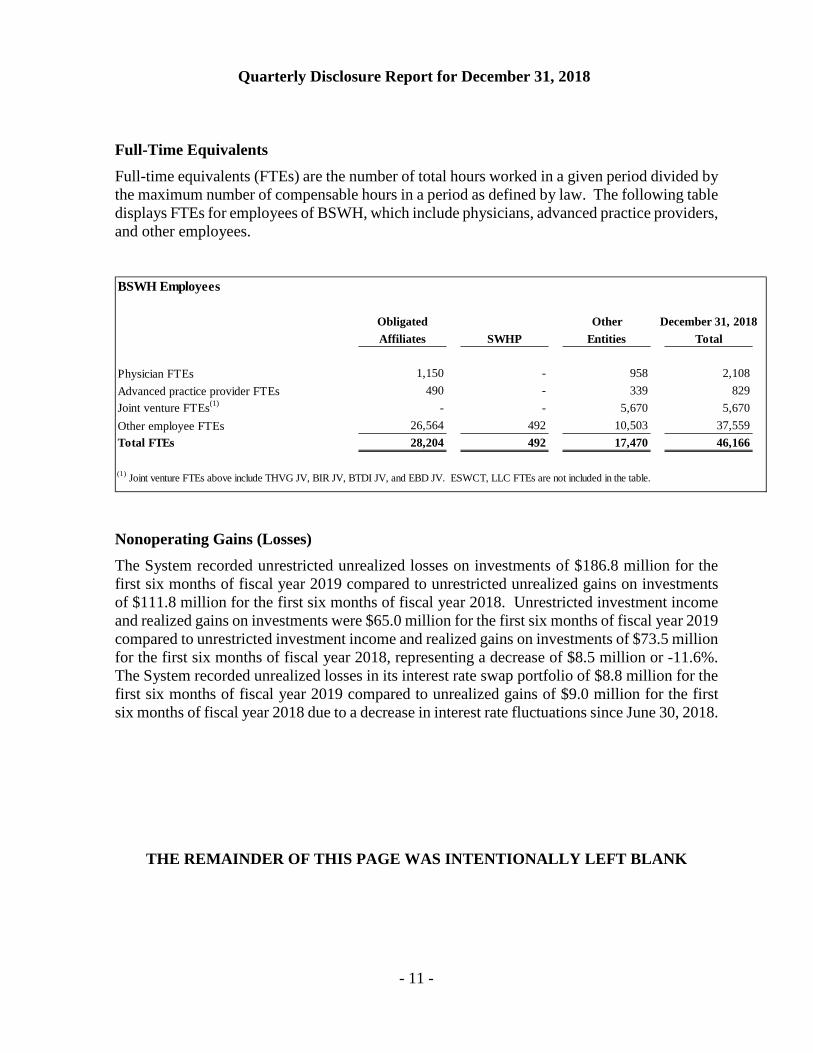
Full-Time Equivalents Full-time equivalents (FTEs) are the number of total hours worked in a given period divided by the maximum number of compensable hours in a period as defined by law. The following table displays FTEs for employees of BSWH, which include physicians, advanced practice providers, and other employees.
BSWH Employees
Obligated Other December 31, 2018Affiliates SWHP Entities Total
Physician FTEs 1,150 - 958 2,108 Advanced practice provider FTEs 490 - 339 829 Joint venture FTEs(1) - - 5,670 5,670 Other employee FTEs 26,564 492 10,503 37,559 Total FTEs 28,204 492 17,470 46,166
(1) Joint venture FTEs above include THVG JV, BIR JV, BTDI JV, and EBD JV. ESWCT, LLC FTEs are not included in the table.
Nonoperating Gains (Losses) The System recorded unrestricted unrealized losses on investments of $186.8 million for the first six months of fiscal year 2019 compared to unrestricted unrealized gains on investments of $111.8 million for the first six months of fiscal year 2018. Unrestricted investment income and realized gains on investments were $65.0 million for the first six months of fiscal year 2019 compared to unrestricted investment income and realized gains on investments of $73.5 million for the first six months of fiscal year 2018, representing a decrease of $8.5 million or -11.6%. The System recorded unrealized losses in its interest rate swap portfolio of $8.8 million for the first six months of fiscal year 2019 compared to unrealized gains of $9.0 million for the first six months of fiscal year 2018 due to a decrease in interest rate fluctuations since June 30, 2018.
THE REMAINDER OF THIS PAGE WAS INTENTIONALLY LEFT BLANK

Quarterly Disclosure Report for December 31, 2018
- 12 -
Utilization Statistics BSWH derives its patient revenue from managed care companies, Medicare, Medicaid, commercial insurers, self paying patients, and other sources. The following graph approximates the percentages of gross patient revenue by payor which includes intercompany activity related to the insured patients of the Health Plan.

Quarterly Disclosure Report for December 31, 2018
- 13 -
THE REMAINDER OF THIS PAGE WAS INTENTIONALLY LEFT BLANK
Quarterly Disclosure Report for December 31, 2018
- 14 -
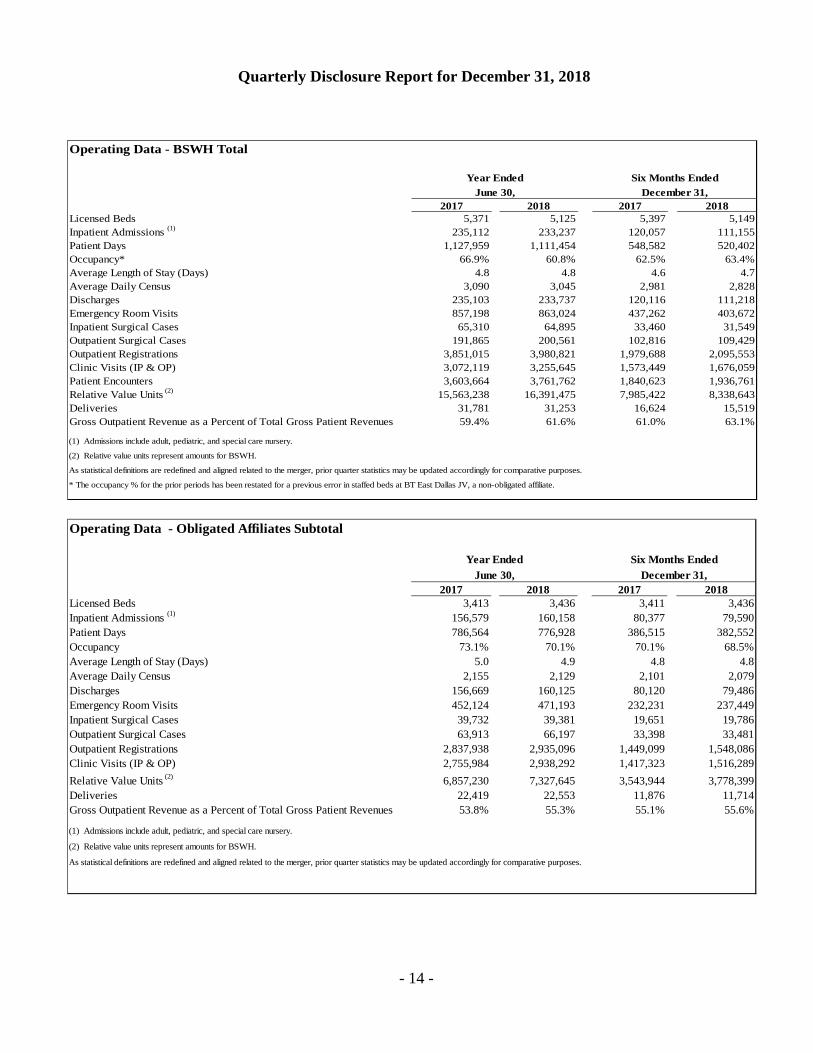
Operating Data - BSWH Total
2017 2018 2017 2018Licensed Beds 5,371 5,125 5,397 5,149 Inpatient Admissions (1) 235,112 233,237 120,057 111,155 Patient Days 1,127,959 1,111,454 548,582 520,402 Occupancy* 66.9% 60.8% 62.5% 63.4%Average Length of Stay (Days) 4.8 4.8 4.6 4.7 Average Daily Census 3,090 3,045 2,981 2,828 Discharges 235,103 233,737 120,116 111,218 Emergency Room Visits 857,198 863,024 437,262 403,672 Inpatient Surgical Cases 65,310 64,895 33,460 31,549 Outpatient Surgical Cases 191,865 200,561 102,816 109,429 Outpatient Registrations 3,851,015 3,980,821 1,979,688 2,095,553 Clinic Visits (IP & OP) 3,072,119 3,255,645 1,573,449 1,676,059 Patient Encounters 3,603,664 3,761,762 1,840,623 1,936,761 Relative Value Units (2) 15,563,238 16,391,475 7,985,422 8,338,643 Deliveries 31,781 31,253 16,624 15,519 Gross Outpatient Revenue as a Percent of Total Gross Patient Revenues 59.4% 61.6% 61.0% 63.1%
(1) Admissions include adult, pediatric, and special care nursery.
(2) Relative value units represent amounts for BSWH.
As statistical definitions are redefined and aligned related to the merger, prior quarter statistics may be updated accordingly for comparative purposes.
* The occupancy % for the prior periods has been restated for a previous error in staffed beds at BT East Dallas JV, a non-obligated affiliate.
Year EndedJune 30,
Six Months EndedDecember 31,
Operating Data - Obligated Affiliates Subtotal
2017 2018 2017 2018Licensed Beds 3,413 3,436 3,411 3,436 Inpatient Admissions (1) 156,579 160,158 80,377 79,590 Patient Days 786,564 776,928 386,515 382,552 Occupancy 73.1% 70.1% 70.1% 68.5%Average Length of Stay (Days) 5.0 4.9 4.8 4.8 Average Daily Census 2,155 2,129 2,101 2,079 Discharges 156,669 160,125 80,120 79,486 Emergency Room Visits 452,124 471,193 232,231 237,449 Inpatient Surgical Cases 39,732 39,381 19,651 19,786 Outpatient Surgical Cases 63,913 66,197 33,398 33,481 Outpatient Registrations 2,837,938 2,935,096 1,449,099 1,548,086 Clinic Visits (IP & OP) 2,755,984 2,938,292 1,417,323 1,516,289 Relative Value Units (2) 6,857,230 7,327,645 3,543,944 3,778,399 Deliveries 22,419 22,553 11,876 11,714 Gross Outpatient Revenue as a Percent of Total Gross Patient Revenues 53.8% 55.3% 55.1% 55.6%
(1) Admissions include adult, pediatric, and special care nursery.
(2) Relative value units represent amounts for BSWH.
As statistical definitions are redefined and aligned related to the merger, prior quarter statistics may be updated accordingly for comparative purposes.
Year EndedJune 30, December 31,
Six Months Ended
Quarterly Disclosure Report for December 31, 2018
- 15 -
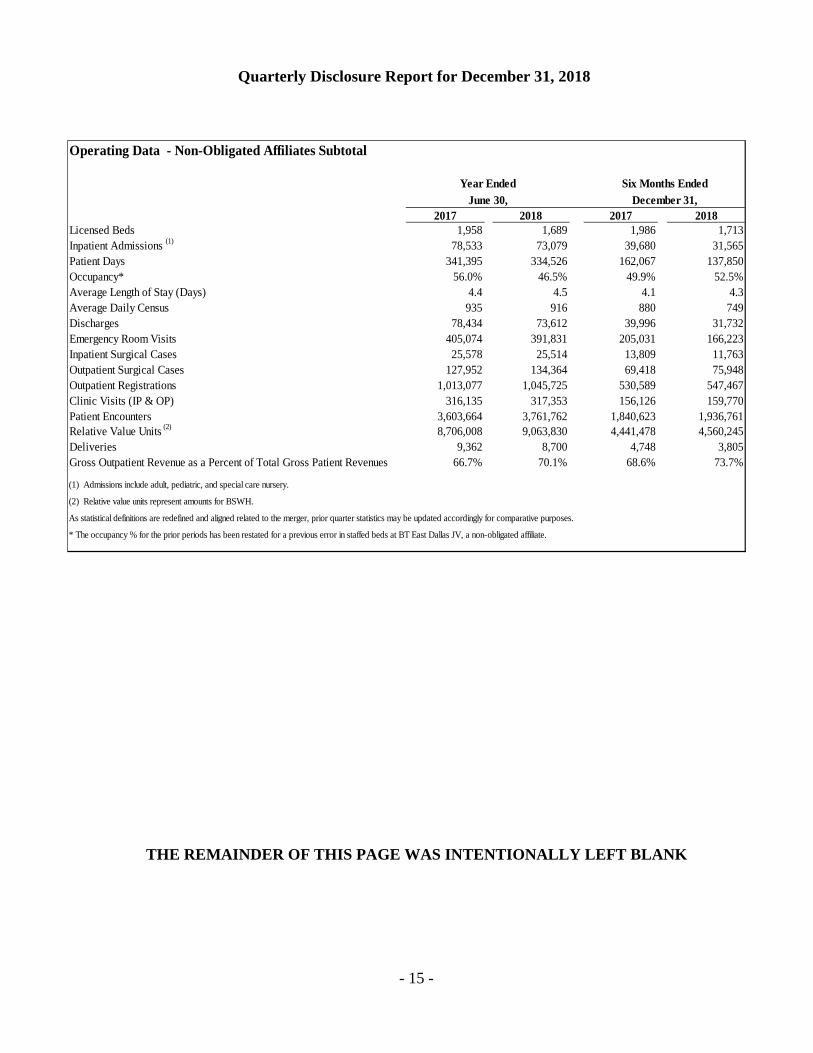
Operating Data - Non-Obligated Affiliates Subtotal
2017 2018 2017 2018Licensed Beds 1,958 1,689 1,986 1,713 Inpatient Admissions (1) 78,533 73,079 39,680 31,565 Patient Days 341,395 334,526 162,067 137,850 Occupancy* 56.0% 46.5% 49.9% 52.5%Average Length of Stay (Days) 4.4 4.5 4.1 4.3 Average Daily Census 935 916 880 749 Discharges 78,434 73,612 39,996 31,732 Emergency Room Visits 405,074 391,831 205,031 166,223 Inpatient Surgical Cases 25,578 25,514 13,809 11,763 Outpatient Surgical Cases 127,952 134,364 69,418 75,948 Outpatient Registrations 1,013,077 1,045,725 530,589 547,467 Clinic Visits (IP & OP) 316,135 317,353 156,126 159,770 Patient Encounters 3,603,664 3,761,762 1,840,623 1,936,761 Relative Value Units (2) 8,706,008 9,063,830 4,441,478 4,560,245 Deliveries 9,362 8,700 4,748 3,805 Gross Outpatient Revenue as a Percent of Total Gross Patient Revenues 66.7% 70.1% 68.6% 73.7%
(1) Admissions include adult, pediatric, and special care nursery.
(2) Relative value units represent amounts for BSWH.
As statistical definitions are redefined and aligned related to the merger, prior quarter statistics may be updated accordingly for comparative purposes.
* The occupancy % for the prior periods has been restated for a previous error in staffed beds at BT East Dallas JV, a non-obligated affiliate.
Year EndedJune 30,
Six Months EndedDecember 31,
THE REMAINDER OF THIS PAGE WAS INTENTIONALLY LEFT BLANK
Quarterly Disclosure Report for December 31, 2018
- 16 -
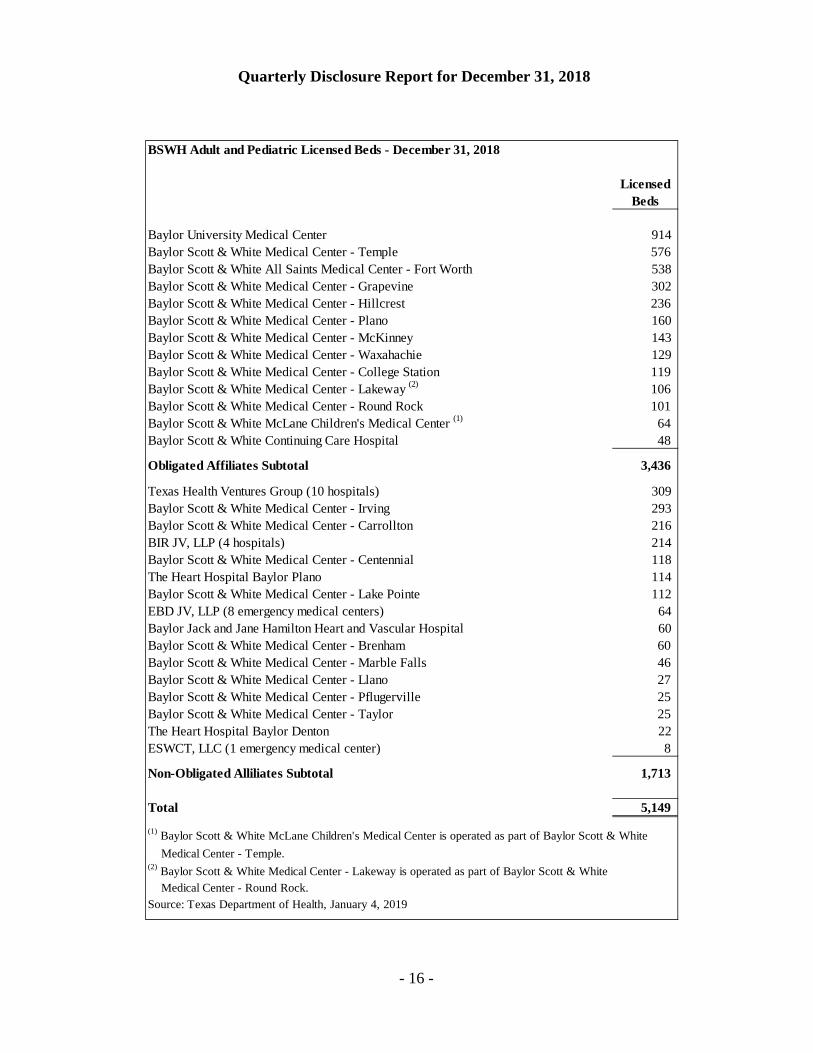
BSWH Adult and Pediatric Licensed Beds - December 31, 2018
LicensedBeds
Baylor University Medical Center 914 Baylor Scott & White Medical Center - Temple 576 Baylor Scott & White All Saints Medical Center - Fort Worth 538 Baylor Scott & White Medical Center - Grapevine 302 Baylor Scott & White Medical Center - Hillcrest 236 Baylor Scott & White Medical Center - Plano 160 Baylor Scott & White Medical Center - McKinney 143 Baylor Scott & White Medical Center - Waxahachie 129 Baylor Scott & White Medical Center - College Station 119 Baylor Scott & White Medical Center - Lakeway (2) 106 Baylor Scott & White Medical Center - Round Rock 101 Baylor Scott & White McLane Children's Medical Center (1) 64 Baylor Scott & White Continuing Care Hospital 48
Obligated Affiliates Subtotal 3,436
Texas Health Ventures Group (10 hospitals) 309 Baylor Scott & White Medical Center - Irving 293 Baylor Scott & White Medical Center - Carrollton 216 BIR JV, LLP (4 hospitals) 214 Baylor Scott & White Medical Center - Centennial 118 The Heart Hospital Baylor Plano 114 Baylor Scott & White Medical Center - Lake Pointe 112 EBD JV, LLP (8 emergency medical centers) 64 Baylor Jack and Jane Hamilton Heart and Vascular Hospital 60 Baylor Scott & White Medical Center - Brenham 60 Baylor Scott & White Medical Center - Marble Falls 46 Baylor Scott & White Medical Center - Llano 27 Baylor Scott & White Medical Center - Pflugerville 25 Baylor Scott & White Medical Center - Taylor 25 The Heart Hospital Baylor Denton 22 ESWCT, LLC (1 emergency medical center) 8
Non-Obligated Alliliates Subtotal 1,713
Total 5,149 (1) Baylor Scott & White McLane Children's Medical Center is operated as part of Baylor Scott & White Medical Center - Temple.(2) Baylor Scott & White Medical Center - Lakeway is operated as part of Baylor Scott & White Medical Center - Round Rock.Source: Texas Department of Health, January 4, 2019

Quarterly Disclosure Report for December 31, 2018
- 17 -
Liquidity Unrestricted cash and investments of $4.8 billion at December 31, 2018 decreased $176.5 million as compared to unrestricted cash and investments of $5.0 billion at June 30, 2018 after capital expenditures of $268.2 million and net losses on trading investments of $121.2 million. Unrestricted days cash on hand decreased to 204.9 days at December 31, 2018 from 212.7 days at June 30, 2018. Including restricted funds, days cash on hand totaled 238.1 days at December 31, 2018 compared to 247.4 days at June 30, 2018. The debt to capitalization ratio is 38.0% at December 31, 2018 and June 30, 2018, respectively, and total assets are $12.1 billion at December 31, 2018 and June 30, 2018.
BSWH Cash and Investments ($ Thousands)
2017 2018 2017 2018Cash and cash equivalents (1) $ 1,189,606 $ 1,263,591 $ 1,255,680 $ 946,812 Short-term investments (2) 192,269 179,540 184,102 193,662 Long-term investments (3) 3,886,786 4,327,713 4,126,955 4,421,287 Total cash and investments 5,268,661 5,770,844 5,566,737 5,561,761 Less: restricted cash and investments (4) 795,601 808,631 847,285 776,084 Total unrestricted cash and investments $ 4,473,060 $ 4,962,213 $ 4,719,452 $ 4,785,677
Average daily operating expenses (less depreciation) $ 23,033 $ 23,329 $ 23,054 $ 23,361 Unrestricted days cash on hand (5) 194.2 212.7 204.7 204.9 Days cash on hand (6) 228.7 247.4 241.5 238.1
(1) Cash and cash equivalents are composed of assets that may be immediately converted to cash.(2) Short-term investments are assets that are convertible to cash in one year or less.(3) Long-term investments are comprised of U.S. small, mid and large capitalization stocks, international stocks, intermediate term fixed income securities, hedge funds, real estate, and private equity.(4) Restricted cash and investments is the sum of the restricted long-term investments, assets restricted by donors, assets held by bond trustees, and assets required to meet self-insurance obligations.(5) Unresticted days cash on hand is calculated as unrestricted cash and investments divided by average daily operating expenses (less depreciation).(6) Days cash on hand includes restricted funds.
June 30, December 31,
THE REMAINDER OF THIS PAGE WAS INTENTIONALLY LEFT BLANK

Quarterly Disclosure Report for December 31, 2018
- 18 -
Baylor Scott & White HealthSelf Liquidity Report ($ Thousands)
December 31,2018
Daily LiquidityMoney Market Funds - Aaa-rated 25,758$ Checking and deposit accounts at P-1 rated bank 354,822 Short-term investment funds at P-1 rated bank 14,580 Subtotal Daily Liquidity (Cash & Securities) 395,160 $400 Million General Purpose LOC (undrawn amount) (1) 320,600 Subtotal Daily Liquidity 715,760$
Weekly LiquidityFixed Income: Publicly Traded Fixed Income Securities rated at least Aa3 635,225 Fixed Income: Publicly Traded Fixed Income Securities rated below Aa3 788,255 Equities: Exchange Traded Equity (ownership of shares of stock) 166,213 Equities: Equity Funds 616,676 Subtotal Weekly Liquidity 2,206,369 Total Daily and Weekly Liquidity 2,922,129$
Longer Term LiquidityFunds, vehicles, investments that allow withdrawals with one month noticeor longer 1,065,605$
(1) Baylor Scott & White Holdings $400MM line of credit expires January 14, 2020.The table above sets forth those assets that would reasonably be available to BSWH to satisfy a liquidity event. The table does not include assets held by affiliates of BSWH that would not be reasonably available to BSWH to satisfy a liquidity event, including assets held by thefive foundations as described further in this report, THVG JV, Texas Heart Hospital of the Southwest, LLP and Baylor Heart and VascularCenter, LLP, among others.
THE REMAINDER OF THIS PAGE WAS INTENTIONALLY LEFT BLANK

Quarterly Disclosure Report for December 31, 2018
- 19 -
NET ASSETS OF THE FOUNDATIONS The System operates five philanthropic foundations which include Baylor Health Care System Foundation, Scott & White Healthcare Foundation, All Saints Health Foundation, Irving Healthcare Foundation, and Scott & White Healthcare Foundation Brenham. The cumulative net assets of these five entities are as follows:
Net Assets of the Foundations($ Thousands)
2017 2018 2017 2018
Unrestricted $ 147,835 $ 158,745 $ 149,345 $ 142,557 Temporarily restricted 269,586 291,725 288,387 277,004 Permanently restricted 260,812 273,983 273,236 276,925 Total $ 678,233 $ 724,453 $ 710,968 $ 696,486
June 30, December 31,
THE REMAINDER OF THIS PAGE WAS INTENTIONALLY LEFT BLANK

Quarterly Disclosure Report for December 31, 2018
- 20 -
Baylor Scott & White HealthCombined Balance Sheets($ Thousands)
ASSETS 2017 2018 2017 2018
CURRENT ASSETS: Cash and cash equivalents 1,189,606$ $ 1,263,591 $ 1,255,680 $ 946,812 Short-term investments 192,269 179,540 184,102 193,662 THVG funds due from United Surgical Partners, Inc. 85,888 117,752 98,938 117,029 Accounts receivables: Patient, net 816,598 804,751 880,785 865,998 Premium 116,182 92,556 79,040 86,606 Other 185,862 187,159 242,864 182,464 Other current assets 254,466 347,551 300,447 420,536 Total current assets 2,840,871 2,992,900 3,041,856 2,813,107
LONG-TERM INVESTMENTS: Unrestricted 3,091,185 3,519,082 3,279,670 3,645,203 Restricted 471,075 505,634 506,303 488,836 Total long-term investments 3,562,260 4,024,716 3,785,973 4,134,039
ASSETS WHOSE USE IS LIMITED: Other designated assets 165,128 162,361 175,719 145,508 Self insurance reserves 98,272 110,783 114,255 123,530 Funds held by bond trustee 61,126 29,853 51,008 18,210 Total assets whose use is limited 324,526 302,997 340,982 287,248
ASSETS HELD FOR SALE 16,354 - 16,324 -
PROPERTY AND EQUIPMENT, net 3,525,384 3,683,590 3,577,277 3,768,179
CONTRIBUTIONS RECEIVABLE, net 61,014 185,946 176,951 178,505
INTEREST IN NET ASSETS OF RELATED FOUNDATION 4,048 4,217 4,220 4,217
OTHER LONG-TERM ASSETS: Equity investment in unconsolidated entities 57,548 61,748 64,243 61,653 Goodwill and intangible assets, net 734,291 864,239 848,433 878,467 Other 20,310 17,708 20,410 14,927 Total other long-term assets 812,149 943,695 933,086 955,047
Total assets 11,146,606$ $ 12,138,061 $ 11,876,669 $ 12,140,342
June 30, December 31,
Quarterly Disclosure Report for December 31, 2018
- 21 -
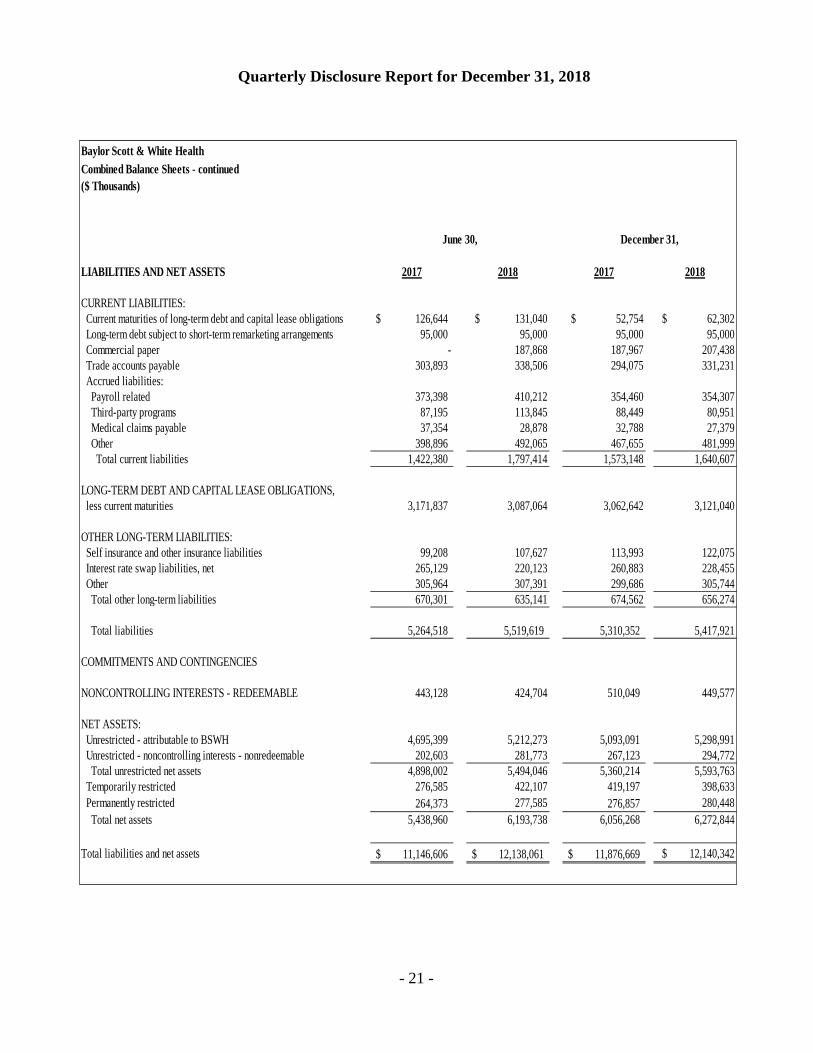
Baylor Scott & White HealthCombined Balance Sheets - continued($ Thousands)
LIABILITIES AND NET ASSETS 2017 2018 2017 2018
CURRENT LIABILITIES: Current maturities of long-term debt and capital lease obligations 126,644$ $ 131,040 $ 52,754 $ 62,302 Long-term debt subject to short-term remarketing arrangements 95,000 95,000 95,000 95,000 Commercial paper - 187,868 187,967 207,438 Trade accounts payable 303,893 338,506 294,075 331,231 Accrued liabilities: Payroll related 373,398 410,212 354,460 354,307 Third-party programs 87,195 113,845 88,449 80,951 Medical claims payable 37,354 28,878 32,788 27,379 Other 398,896 492,065 467,655 481,999 Total current liabilities 1,422,380 1,797,414 1,573,148 1,640,607
LONG-TERM DEBT AND CAPITAL LEASE OBLIGATIONS, less current maturities 3,171,837 3,087,064 3,062,642 3,121,040
OTHER LONG-TERM LIABILITIES: Self insurance and other insurance liabilities 99,208 107,627 113,993 122,075 Interest rate swap liabilities, net 265,129 220,123 260,883 228,455 Other 305,964 307,391 299,686 305,744 Total other long-term liabilities 670,301 635,141 674,562 656,274
Total liabilities 5,264,518 5,519,619 5,310,352 5,417,921
COMMITMENTS AND CONTINGENCIES
NONCONTROLLING INTERESTS - REDEEMABLE 443,128 424,704 510,049 449,577
NET ASSETS: Unrestricted - attributable to BSWH 4,695,399 5,212,273 5,093,091 5,298,991 Unrestricted - noncontrolling interests - nonredeemable 202,603 281,773 267,123 294,772 Total unrestricted net assets 4,898,002 5,494,046 5,360,214 5,593,763 Temporarily restricted 276,585 422,107 419,197 398,633 Permanently restricted 264,373 277,585 276,857 280,448 Total net assets 5,438,960 6,193,738 6,056,268 6,272,844
Total liabilities and net assets 11,146,606$ 12,138,061$ 11,876,669$ $ 12,140,342
June 30, December 31,
Quarterly Disclosure Report for December 31, 2018
- 22 -
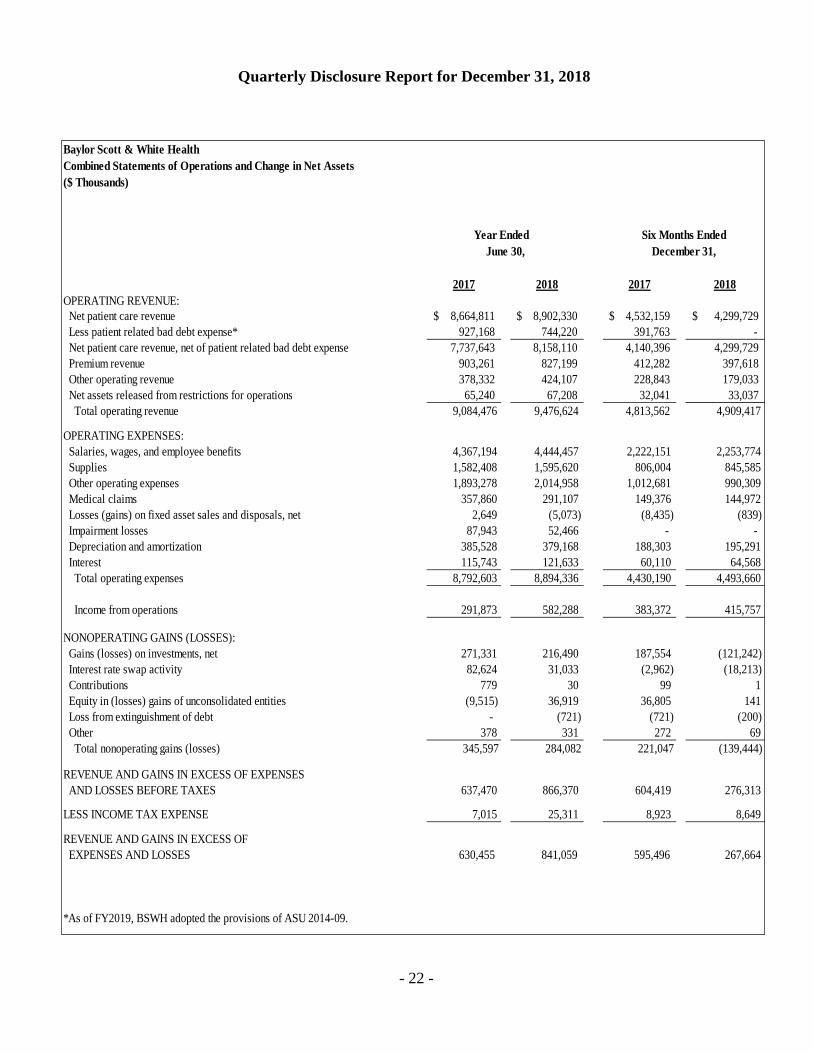
Baylor Scott & White HealthCombined Statements of Operations and Change in Net Assets($ Thousands)
2017 2018 2017 2018OPERATING REVENUE: Net patient care revenue 8,664,811$ 8,902,330$ 4,532,159$ 4,299,729$ Less patient related bad debt expense* 927,168 744,220 391,763 - Net patient care revenue, net of patient related bad debt expense 7,737,643 8,158,110 4,140,396 4,299,729 Premium revenue 903,261 827,199 412,282 397,618 Other operating revenue 378,332 424,107 228,843 179,033 Net assets released from restrictions for operations 65,240 67,208 32,041 33,037 Total operating revenue 9,084,476 9,476,624 4,813,562 4,909,417
OPERATING EXPENSES: Salaries, wages, and employee benefits 4,367,194 4,444,457 2,222,151 2,253,774 Supplies 1,582,408 1,595,620 806,004 845,585 Other operating expenses 1,893,278 2,014,958 1,012,681 990,309 Medical claims 357,860 291,107 149,376 144,972 Losses (gains) on fixed asset sales and disposals, net 2,649 (5,073) (8,435) (839) Impairment losses 87,943 52,466 - - Depreciation and amortization 385,528 379,168 188,303 195,291 Interest 115,743 121,633 60,110 64,568 Total operating expenses 8,792,603 8,894,336 4,430,190 4,493,660
Income from operations 291,873 582,288 383,372 415,757
NONOPERATING GAINS (LOSSES): Gains (losses) on investments, net 271,331 216,490 187,554 (121,242) Interest rate swap activity 82,624 31,033 (2,962) (18,213) Contributions 779 30 99 1 Equity in (losses) gains of unconsolidated entities (9,515) 36,919 36,805 141 Loss from extinguishment of debt - (721) (721) (200) Other 378 331 272 69 Total nonoperating gains (losses) 345,597 284,082 221,047 (139,444)
REVENUE AND GAINS IN EXCESS OF EXPENSES AND LOSSES BEFORE TAXES 637,470 866,370 604,419 276,313
LESS INCOME TAX EXPENSE 7,015 25,311 8,923 8,649
REVENUE AND GAINS IN EXCESS OF EXPENSES AND LOSSES 630,455 841,059 595,496 267,664
*As of FY2019, BSWH adopted the provisions of ASU 2014-09.
June 30,Year Ended Six Months Ended
December 31,
Quarterly Disclosure Report for December 31, 2018
- 23 -
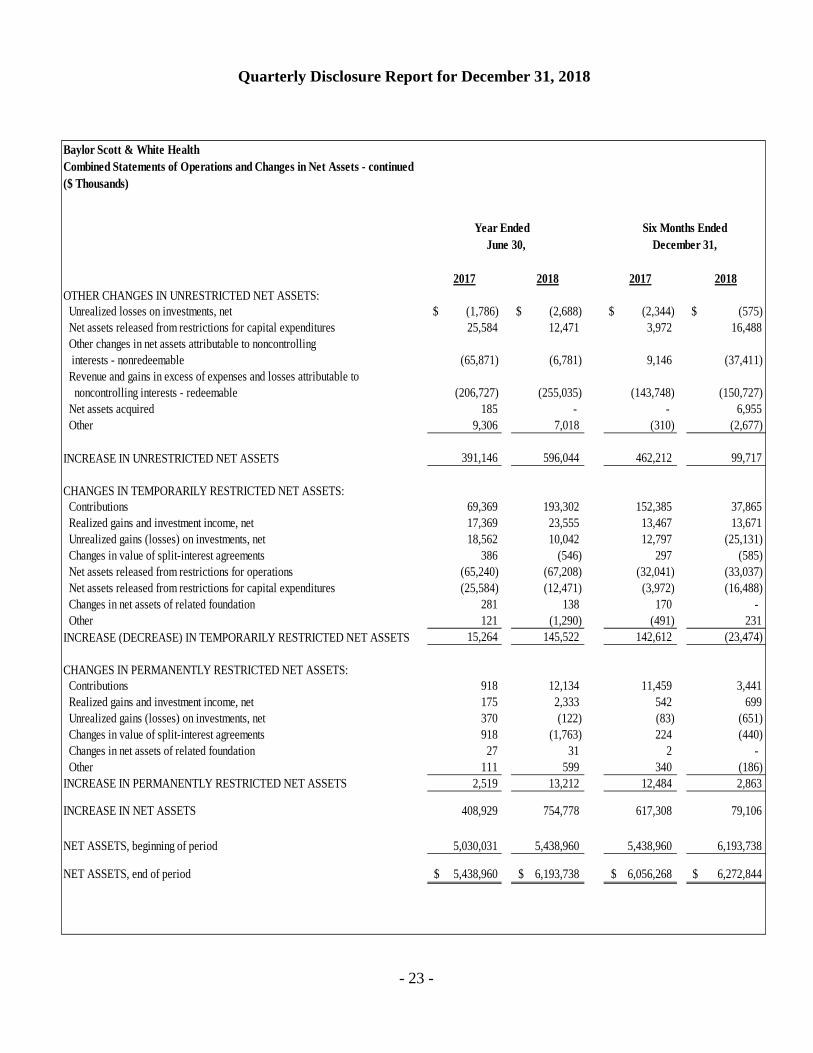
Baylor Scott & White HealthCombined Statements of Operations and Changes in Net Assets - continued($ Thousands)
2017 2018 2017 2018OTHER CHANGES IN UNRESTRICTED NET ASSETS: Unrealized losses on investments, net $ (1,786) $ (2,688) $ (2,344) $ (575) Net assets released from restrictions for capital expenditures 25,584 12,471 3,972 16,488 Other changes in net assets attributable to noncontrolling interests - nonredeemable (65,871) (6,781) 9,146 (37,411) Revenue and gains in excess of expenses and losses attributable to noncontrolling interests - redeemable (206,727) (255,035) (143,748) (150,727) Net assets acquired 185 - - 6,955 Other 9,306 7,018 (310) (2,677)
INCREASE IN UNRESTRICTED NET ASSETS 391,146 596,044 462,212 99,717
CHANGES IN TEMPORARILY RESTRICTED NET ASSETS: Contributions 69,369 193,302 152,385 37,865 Realized gains and investment income, net 17,369 23,555 13,467 13,671 Unrealized gains (losses) on investments, net 18,562 10,042 12,797 (25,131) Changes in value of split-interest agreements 386 (546) 297 (585) Net assets released from restrictions for operations (65,240) (67,208) (32,041) (33,037) Net assets released from restrictions for capital expenditures (25,584) (12,471) (3,972) (16,488) Changes in net assets of related foundation 281 138 170 - Other 121 (1,290) (491) 231 INCREASE (DECREASE) IN TEMPORARILY RESTRICTED NET ASSETS 15,264 145,522 142,612 (23,474)
CHANGES IN PERMANENTLY RESTRICTED NET ASSETS: Contributions 918 12,134 11,459 3,441 Realized gains and investment income, net 175 2,333 542 699 Unrealized gains (losses) on investments, net 370 (122) (83) (651) Changes in value of split-interest agreements 918 (1,763) 224 (440) Changes in net assets of related foundation 27 31 2 - Other 111 599 340 (186)INCREASE IN PERMANENTLY RESTRICTED NET ASSETS 2,519 13,212 12,484 2,863
INCREASE IN NET ASSETS 408,929 754,778 617,308 79,106
NET ASSETS, beginning of period 5,030,031 5,438,960 5,438,960 6,193,738
NET ASSETS, end of period $ 5,438,960 $ 6,193,738 $ 6,056,268 $ 6,272,844
June 30, December 31,Year Ended Six Months Ended
Quarterly Disclosure Report for December 31, 2018
- 24 -
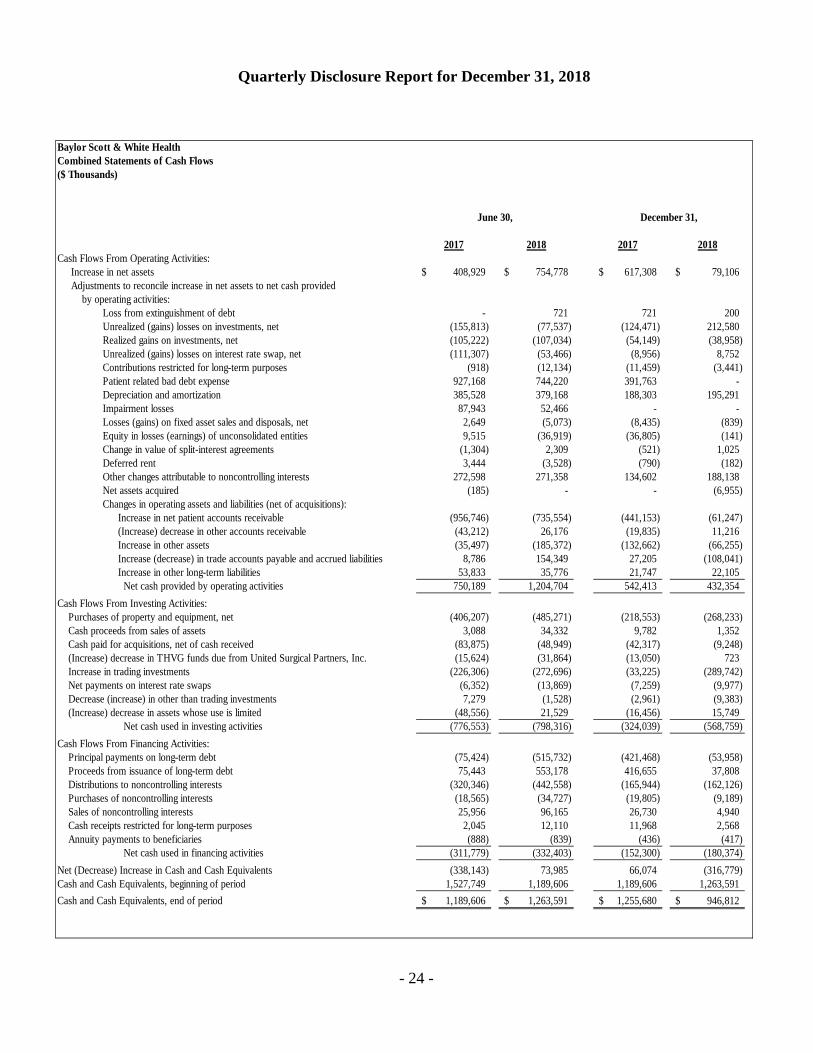
Baylor Scott & White HealthCombined Statements of Cash Flows($ Thousands)
2017 2018 2017 2018Cash Flows From Operating Activities: Increase in net assets 408,929$ 754,778$ 617,308$ 79,106$ Adjustments to reconcile increase in net assets to net cash provided by operating activities:
Loss from extinguishment of debt - 721 721 200 Unrealized (gains) losses on investments, net (155,813) (77,537) (124,471) 212,580 Realized gains on investments, net (105,222) (107,034) (54,149) (38,958) Unrealized (gains) losses on interest rate swap, net (111,307) (53,466) (8,956) 8,752 Contributions restricted for long-term purposes (918) (12,134) (11,459) (3,441) Patient related bad debt expense 927,168 744,220 391,763 - Depreciation and amortization 385,528 379,168 188,303 195,291 Impairment losses 87,943 52,466 - - Losses (gains) on fixed asset sales and disposals, net 2,649 (5,073) (8,435) (839) Equity in losses (earnings) of unconsolidated entities 9,515 (36,919) (36,805) (141) Change in value of split-interest agreements (1,304) 2,309 (521) 1,025 Deferred rent 3,444 (3,528) (790) (182) Other changes attributable to noncontrolling interests 272,598 271,358 134,602 188,138 Net assets acquired (185) - - (6,955) Changes in operating assets and liabilities (net of acquisitions):
Increase in net patient accounts receivable (956,746) (735,554) (441,153) (61,247) (Increase) decrease in other accounts receivable (43,212) 26,176 (19,835) 11,216 Increase in other assets (35,497) (185,372) (132,662) (66,255) Increase (decrease) in trade accounts payable and accrued liabilities 8,786 154,349 27,205 (108,041) Increase in other long-term liabilities 53,833 35,776 21,747 22,105 Net cash provided by operating activities 750,189 1,204,704 542,413 432,354
Cash Flows From Investing Activities: Purchases of property and equipment, net (406,207) (485,271) (218,553) (268,233) Cash proceeds from sales of assets 3,088 34,332 9,782 1,352 Cash paid for acquisitions, net of cash received (83,875) (48,949) (42,317) (9,248) (Increase) decrease in THVG funds due from United Surgical Partners, Inc. (15,624) (31,864) (13,050) 723 Increase in trading investments (226,306) (272,696) (33,225) (289,742) Net payments on interest rate swaps (6,352) (13,869) (7,259) (9,977) Decrease (increase) in other than trading investments 7,279 (1,528) (2,961) (9,383) (Increase) decrease in assets whose use is limited (48,556) 21,529 (16,456) 15,749
Net cash used in investing activities (776,553) (798,316) (324,039) (568,759) Cash Flows From Financing Activities: Principal payments on long-term debt (75,424) (515,732) (421,468) (53,958) Proceeds from issuance of long-term debt 75,443 553,178 416,655 37,808 Distributions to noncontrolling interests (320,346) (442,558) (165,944) (162,126) Purchases of noncontrolling interests (18,565) (34,727) (19,805) (9,189) Sales of noncontrolling interests 25,956 96,165 26,730 4,940 Cash receipts restricted for long-term purposes 2,045 12,110 11,968 2,568 Annuity payments to beneficiaries (888) (839) (436) (417)
Net cash used in financing activities (311,779) (332,403) (152,300) (180,374) Net (Decrease) Increase in Cash and Cash Equivalents (338,143) 73,985 66,074 (316,779) Cash and Cash Equivalents, beginning of period 1,527,749 1,189,606 1,189,606 1,263,591 Cash and Cash Equivalents, end of period 1,189,606$ 1,263,591$ 1,255,680$ 946,812$
December 31,June 30,

Quarterly Disclosure Report for December 31, 2018
Notes to Combined Financial Statements
- 25 -
1. ORGANIZATION Baylor Scott & White Holdings (BSW Holdings), a Texas nonprofit corporation exempt from federal income taxation under Section 501(c)(3) of the Internal Revenue Code, and its controlled affiliates (collectively, the “System”) were created from the combination of two Texas healthcare systems, Baylor Health Care System (BHCS) and its affiliates, and Scott & White Healthcare (SWH) and its affiliates. BSW Holdings and Baylor Scott & White Health (BSW Health), a Texas nonprofit corporation, were created by BHCS and SWH in connection with their combination. BSW Holdings is the sole member of BHCS, SWH, and BSW Health and has control and substantial reserved powers over all BHCS and SWH material affiliates. BHCS and its material affiliates are collectively referred to as “Baylor”. SWH and its material affiliates are collectively referred to as “Scott & White”. BSW Holdings and its controlled affiliates are collectively referred to as the “System” or “BSWH”. The combined financial statements include the accounts of BSW Holdings, BSW Health, BHCS, SWH, Baylor University Medical Center (BUMC), Scott & White Memorial Hospital (SWMH), Scott & White Health Plan (the “Health Plan” or “SWHP”), five foundations, twenty-two community and specialty hospitals located throughout the Dallas and Fort Worth metroplex and the central Texas area, one wholly owned insurance subsidiary, Baylor Quality Health Care Alliance, LLC, an accountable care organization, four physician practice organizations (HealthTexas Provider Network, Scott & White Clinic, Hillcrest Family Health Center, and Hillcrest Physician Services), and other related entities. Investments in certain related entities with 50.0% or less ownership are accounted for using the equity method. The transactions and balances for investments in certain related entities with greater than 50.0% ownership, or where the System exercises board control, are included in the accompanying combined financial statements with related noncontrolling interests reported in the combined financial statements. These entities include five acute and specialty hospitals referenced above, along with partnerships in: Texas Health Ventures Group, LLC (THVG), providing short stay hospital and outpatient surgery services, BIR JV, LLP, providing rehabilitation services, BTDI JV, LLP, providing imaging services, EBD JV, LLP and ESWCT, LLC, providing emergency medical services, HTPN Gastroenterology Services, LLP, providing endoscopic services, and THVG Bariatric, LLC, which has provided bariatric services. All significant intercompany accounts and transactions among entities included in the combined financial statements have been eliminated. The following summarizes significant changes in the System in 2017 - 2019: THVG BUMC has a majority ownership of 50.1% in THVG with USP North Texas, Inc. (USP), a Texas corporation and subsidiary of United Surgical Partners, Inc. (USPI) holding the
Quarterly Disclosure Report for December 31, 2018
Notes to Combined Financial Statements - continued
- 26 -
remaining 49.9%. THVG had net patient care revenue included in the System’s combined financial statements of approximately $645,911,000 and $566,252,000 in the first six months of fiscal years 2019 and 2018, respectively. THVG completed the acquisition of one outpatient center in fiscal year 2017. THVG recorded goodwill and intangible assets, net, of approximately, $19,852,000, fixed assets of approximately $517,000, noncontrolling interests of approximately $16,674,000, and other net liabilities of approximately $3,695,000 in 2017. THVG completed the acquisition of one surgical hospital in fiscal year 2018. THVG recorded goodwill and intangible assets, net, of approximately $111,874,000, fixed assets of approximately $18,276,000, noncontrolling interests of approximately $91,338,000, and other net liabilities of approximately $38,812,000 in 2018.
BT East Dallas JV, LLP and BT Garland JV, LLP Effective January 1, 2016, two Texas limited liability partnerships were formed between the System and Healthcare Network Texas, Inc., a Delaware corporation and subsidiary of Tenet Healthcare Corporation (Tenet). BUMC has a majority ownership of 75% of BT East Dallas JV, LLP, (BT East Dallas) with Tenet holding the remaining 25%. Baylor Medical Centers at Garland and McKinney (Garland), a Texas nonprofit corporation wholly owned by BHCS, has a majority ownership of 50.1% of BT Garland JV, LLP (Garland JV) with Tenet holding the remaining 49.9%. The purpose of these partnerships was to own, operate, and manage five community hospitals focused on delivering integrated, value-based care to communities in Rockwall, Collin, and Dallas counties. Effective June 9, 2017, BSW Holdings approved the proposed divestiture of Baylor Scott & White Medical Center – Garland (BSWMC – Garland) and Baylor Scott & White Medical Center – White Rock (White Rock), a hospital operated by BT East Dallas JV, LLP, and classification as assets held for sale. Due to the proposed divestiture and their classification as held for sale, an impairment assessment was required for the long-lived assets of BSWMC – Garland and White Rock under the assets to be disposed of by sale model. The assessment resulted in an adjustment for impairment of approximately $70,624,000, recorded in the accompanying combined statements of operations for the year ended June 30, 2017. The remaining book value of BSWMC – Garland and White Rock is reported in assets held for sale in the accompanying combined balance sheets, as of June 30, 2017. After impairments, the remaining net book value of land, building and improvements, and major movable equipment and other was approximately $3,900,000, $5,427,000, and $7,027,000, respectively, as of June 30, 2017.
Quarterly Disclosure Report for December 31, 2018
Notes to Combined Financial Statements - continued
- 27 -
On December 14, 2017, BSWH announced that a decision was made to close BSWMC – Garland, a 113 bed hospital. The last day of operations was February 28, 2018. On December 22, 2017, BSWH and Tenet signed a definitive agreement for the sale of White Rock to Pipeline Health, a California-based hospital management company. The sale was completed on March 1, 2018. On December 31, 2017, BSWH and Tenet signed a definitive agreement to restructure ownership of the three remaining hospitals: Baylor Scott & White Medical Center – Centennial, Baylor Scott & White Medical Center – Lake Pointe, and Baylor Scott & White Medical Center – Sunnyvale. BSWH and Tenet have owned the three hospitals through the BT East Dallas partnership since January 2016. Under the definitive agreement, BSWH acquired Tenet's interest in Baylor Scott & White Medical Center – Centennial and Baylor Scott & White Medical Center – Lake Pointe, and took over as manager and operator effective March 1, 2018. Baylor Scott & White Medical Center – Sunnyvale became part of the existing THVG joint venture between Tenet's subsidiary USPI and BSWH effective March 1, 2018. BSWH continues to be majority owner in the facility, while USPI took over its operation. Lakeway In September 2016, the System purchased Lakeway Regional Medical Center, a 106 bed multispecialty hospital now called Baylor Scott & White Medical Center - Lakeway, operated as a part of Scott & White Hospital - Round Rock. Sale of Equity Method Investment In July 2017, BSWH sold its equity investment in Med Fusion and ClearPoint Diagnostic Labs to Quest Diagnostics. The gain on sale of approximately $37,322,000 is included in equity in earnings (losses) of unconsolidated entities in the accompanying combined statements of operations and changes in net assets. Irving Hospital Authority Contribution to Irving In August and November of 2017, Baylor Medical Center at Irving (Irving) executed lease amendments in which the Irving Hospital Authority (Authority) agreed to renovate, equip, and expand the properties leased from the Authority. The projects include renovation of portions of the existing hospital building, replacement of an existing central utility plant, construction of a new six-story tower, and the purchase of related furnishings and medical equipment. The projects will be completed in phases, with estimated completion of the entire project in mid 2020. Accordingly, in 2018 Irving recorded a temporarily restricted contribution of approximately $122,700,000, net of discount, for building renovations, furnishings, and medical equipment, and a receipt of a right to use the new tower and central utility plant for the
Quarterly Disclosure Report for December 31, 2018
Notes to Combined Financial Statements - continued
- 28 -
remainder of the lease term under the existing lease agreement. The contribution receivable is reflected in the accompanying combined balance sheets and the temporarily restricted contribution is reflected in the changes in temporarily restricted net assets in the accompanying combined statements of operations and changes in net assets. BIR JV, LLP BIR JV, LLP completed the acquisition of one rehabilitation hospital in 2018. BIR JV, LLP recorded goodwill and intangible assets, net, of approximately $6,493,000, fixed assets of approximately $368,000, and other net liabilities of approximately $6,861,000 in 2018. Debt Restructuring In November 2018, BSWH issued an additional $20,000,000 of commercial paper under its $400,000,000 commercial paper program. The proceeds were used to redeem the remaining $19,700,000 of Baylor Health Care System Taxable Notes, Series 2000, with a loss on extinguishment of debt of $200,000. In December 2018, BSWH extended the $400,000,000 revolving line of credit, which was scheduled to expire in January 2019, to January 2020.
2. SIGNIFICANT ACCOUNTING POLICIES The accompanying combined financial statements of the System have been prepared in conformity with accounting principles generally accepted in the United States. The following is a summary of the significant accounting and reporting policies used in preparing the financial statements. Adoption of New Accounting Pronouncements In August 2014, the Financial Accounting Standards Board (FASB) issued Accounting Standards Update (ASU) 2014-15, “Disclosure of Uncertainties about an Entity’s Ability to Continue as a Going Concern.” This ASU amendment requires management to assess an entity’s ability to continue as a going concern. Management should evaluate whether conditions or events, considered in the aggregate, exist that raise substantial doubt about the entity’s ability to continue as a going concern within one year after the date that the financial statements are issued. The System applied the provisions of ASU 2014-15 in fiscal year 2017, which did not have a material impact on the combined financial statements. In January 2015, FASB issued ASU 2015-01, “Simplifying Income Statement Presentation by Eliminating the Concept of Extraordinary Items.” The amendments in ASU 2015-01 eliminate
Quarterly Disclosure Report for December 31, 2018
Notes to Combined Financial Statements - continued
- 29 -
the concept of extraordinary items in financial statements. The System applied the provisions of ASU 2015-01 in fiscal year 2017, which did not have a material impact on the combined financial statements. In February 2015, FASB issued ASU 2015-02, “Consolidation: Amendments to the Consolidation Analysis.” The amendments in ASU 2015-02 improve targeted areas of consolidation guidance for legal entities such as limited partnerships, limited liability corporations, and securitization structures (collateralized debt obligations, collateralized loan obligations, and mortgage-backed security transactions). The System applied the provisions of ASU 2015-02 in fiscal year 2018, which did not have a material impact on the combined financial statements. In April 2015, FASB issued ASU 2015-03, “Interest - Imputation of Interest: Simplifying the Presentation of Debt Issuance Costs.” The amendments in ASU 2015-03 are intended to simplify the presentation of debt issuance costs. These amendments require that debt issuance costs related to a recognized debt liability be presented in the balance sheet as a direct deduction from the carrying amount of the related debt liability, consistent with debt discounts. The System applied the provisions of ASU 2015-03 in fiscal year 2017, which had no net impact on its financial position, results of operations, or cash flows. In April 2015, FASB issued ASU 2015-05, “Intangibles - Goodwill and Other - Internal-Use Software: Customer’s Accounting for Fees Paid in a Cloud Computing Arrangement.” The amendments in ASU 2015-05 provide guidance to customers about whether a cloud computing arrangement includes a software license. If a cloud computing arrangement includes a software license, then the customer should account for the software license element of the arrangement consistent with the acquisition of other software licenses. If a cloud computing arrangement does not include a software license, the customer should account for the arrangement as a service contract. The System applied the provisions of ASU 2015-05 in fiscal year 2017, which did not have a material impact on the combined financial statements. In May 2015, FASB issued ASU 2015-07, “Disclosures for Investments in Certain Entities That Calculate Net Asset Value per Share (or Its Equivalent).” This ASU removes the requirement to categorize within the fair value hierarchy all investments for which fair value is measured using the net asset value per share practical expedient. The amendments also remove the requirement to make certain disclosures for all investments that are eligible to be measured at fair value using the net asset value per share practical expedient. The System applied the provisions of ASU 2015-07 in fiscal year 2018, which did not have a material impact on the combined financial statements. In May 2015, FASB issued ASU 2015-09, “Disclosures about Short-Duration Contracts.” This ASU requires insurance entities to disclose, for annual reporting periods, information
Quarterly Disclosure Report for December 31, 2018
Notes to Combined Financial Statements - continued
- 30 -
about the liability for unpaid claims and claim adjustment expenses. The amendments also require insurance entities to disclose information about significant changes in methodologies and assumptions used to calculate the liability for unpaid claims and claim adjustment expenses, including reasons for the change, and the effects on the financial statements. In addition, the amendments require insurance entities to disclose, for annual and interim reporting periods, a roll-forward of the liability for unpaid claims and claim adjustment expenses. For health insurance claims, the amendments require the disclosure of the total of incurred-but-not-reported liabilities, and expected development on reported claims included in the liability for unpaid claims and claim adjustment expenses. The System applied the provisions of ASU 2015-09 in fiscal year 2018, which did not have a material impact on the combined financial statements. In July 2015, FASB issued ASU 2015-11, “Simplifying the Measurement of Inventory.” This ASU requires an entity to measure inventory at the lower of cost and net realizable value. Net realizable value is the estimated selling prices in the ordinary course of business, less reasonably predictable costs of completion, disposal, and transportation. Subsequent measurement is unchanged for inventory measured using last-in, first-out (LIFO) or the retail inventory method. The amendments do not apply to inventory that is measured using LIFO or the retail inventory method. The amendments apply to all other inventory, which includes inventory that is measured using first-in, first-out (FIFO) or average cost. The System applied the provisions of ASU 2015-11 in fiscal year 2018, which did not have a material impact on the combined financial statements. In August 2015, FASB issued ASU 2015-15, “Presentation and Subsequent Measurement of Debt Issuance Costs Associated with Line-of-Credit Arrangements (Amendments to SEC Paragraphs Pursuant to Staff Announcement at June 18, 2015 EITF Meeting).” This ASU requires an entity to defer and present debt issuance costs as an asset and subsequently amortize the deferred debt issuance costs ratably over the term of the line-of-credit arrangement, regardless of whether there are any outstanding borrowings on the line-of-credit arrangement. The System applied the provisions of ASU 2015-15 in fiscal year 2017, which did not have a material impact on the combined financial statements. In September 2015, FASB issued ASU 2015-16, “Simplifying the Accounting for Measurement-Period Adjustments.” This ASU requires that an acquirer recognize adjustments to estimated amounts that are identified during the measurement period and any related income effects in the reporting period in which the adjustment amounts are determined. The ASU also requires an entity to present separately on the face of the income statement, or disclose in the notes, the portion of the amount recorded in current-period earnings by line item that would have been recorded in previous reporting periods if the adjustment to the estimated amounts had been recognized as of the acquisition date. The System applied the provisions of ASU 2015-16 in fiscal year 2018, which did not have a material impact on the combined financial statements.
Quarterly Disclosure Report for December 31, 2018
Notes to Combined Financial Statements - continued
- 31 -
In March 2016, FASB issued ASU 2016-07, “Simplifying the Transition to the Equity Method of Accounting.” This ASU eliminates the requirement that when an investment qualifies for use of the equity method, as a result of an increase in the level of ownership interest or degree of influence, an investor must adjust the investment, results of operations, and retained earnings retroactively on a step-by-step basis as if the equity method had been in effect during all previous periods that the investment had been held. The amendments require that the equity method investor add the cost of acquiring the additional interest in the investee to the current basis of the investor’s previously held interest and adopt the equity method of accounting as of the date the investment becomes qualified for equity method accounting. Retroactive adjustment of the investment is no longer required. The System applied the provisions of ASU 2016-07 in fiscal year 2018, which did not have a material impact on the combined financial statements. In January 2017, FASB issued ASU 2017-02, “Clarifying When a Not-for-Profit Entity That Is a General Partner or a Limited Partner Should Consolidate a For-Profit Limited Partnership or Similar Entity.” This ASU retains the consolidation guidance that was in Subtopic 810-20. Not-for-profits that are general partners should continue to be presumed to control a for-profit limited partnership, regardless of the extent of their ownership interest, unless that presumption is overcome. The System applied the provisions of ASU 2017-02 in fiscal year 2018, which did not have a material impact on the combined financial statements. In May 2014, August 2015, April 2016, May 2016, December 2016, and February 2017, FASB issued ASU 2014-09, “Revenue from Contracts with Customers (Topic 606)”; ASU 2015-14, “Revenue from Contracts with Customers”; ASU 2016-10, “Identifying Performance Obligations and Licensing”; ASU 2016-12, “Revenue from Contracts with Customers: Narrow-Scope Improvements and Practical Expedients”; ASU 2016-20, “Technical Corrections and Improvements to Topic 606, Revenue from Contracts with Customers”; and ASU 2017-05, “Clarifying the Scope of Asset Derecognition Guidance and Accounting for Partial Sales of Nonfinancial Assets”, respectively, which supersedes the revenue recognition requirements in Accounting Standards Codification (ASC) 605, “Revenue Recognition.” These ASU’s address when an entity should recognize revenue to depict the transfer of promised goods or services to customers in an amount that reflects the consideration to which the entity expects to be entitled in exchange for those goods or services. These ASU’s are effective for annual reporting periods beginning after December 15, 2017, and interim periods within those years for public business entities and not-for-profit entities that have issued publicly traded debt, and December 15, 2018 for all other entities as amended by ASU 2015-14. The System adopted the guidance under these ASU’s in fiscal year 2019 using a modified retrospective method of transition. While the adoption had an effect on the presentation of net patient care revenue, it did not have a material impact on the combined financial statements.

Quarterly Disclosure Report for December 31, 2018
Notes to Combined Financial Statements - continued
- 32 -
Other Accounting Pronouncements In November 2015, FASB issued ASU 2015-17, “Balance Sheet Classification of Deferred Taxes.” This ASU requires that deferred tax liabilities and assets be classified as noncurrent in a classified statement of financial position. The provisions of ASU 2015-17 are effective for fiscal years beginning after December 15, 2016, and interim periods within those years for public business entities, and December 15, 2017, and interim periods thereafter for all other entities. This ASU is not expected to have a material impact on the combined financial statements. In January 2016, FASB issued ASU 2016-01, “Recognition and Measurement of Financial Assets and Financial Liabilities.” This ASU requires equity investments to be measured at fair value with changes in fair value recognized in net income. This ASU also requires the use of the exit price notion when measuring the fair value of financial instruments for disclosure purposes. A reporting organization must present separately, in other comprehensive income, the portion of the total change in the fair value of a liability resulting from a change in the instrument-specific credit risk. The provisions of ASU 2016-01 are effective for fiscal years beginning after December 15, 2017, and interim periods within those years for public business entities, and December 15, 2018 for all other entities. The System is currently evaluating the impact of this ASU. In February 2016, January 2018, July 2018, July 2018, and December 2018, FASB issued ASU 2016-02, “Leases”; ASU 2018-01, “Land Easement Practical Expedient”; ASU 2018-10, “Codification Improvements to Topic 842, Leases”; ASU 2018-11, “Leases (Topic 842): Targeted Improvements.”; and ASU 2018-20, “Leases (Topic 842): Narrow-Scope Improvements for Lessors”, respectively. These ASU’s require lessees to record a lease liability that represents the lessee’s future lease obligation payments and a right-of-use asset that represents the lessee’s right to use or control of a specified asset for the lease term. The main difference with current practice being that lessees will be required to record an asset and liability for what is now considered an operating lease. These ASU’s are effective for fiscal years beginning after December 15, 2018, and interim periods within those years for public business entities and not-for-profit entities that have issued publicly traded debt, and December 15, 2019 for all other entities. The System is currently evaluating the impact of these ASU’s and believes they will have a material impact on the combined financial statements. In March 2016, FASB issued ASU 2016-05, “Effect of Derivative Contract Novations on Existing Hedge Accounting Relationships.” This ASU clarifies that a change in the counterparty to a derivative instrument that has been designated as the hedging instrument does not, in and of itself, require dedesignation of that hedging relationship provided that all other hedge
Quarterly Disclosure Report for December 31, 2018
Notes to Combined Financial Statements - continued
- 33 -
accounting criteria remain intact. The provisions of ASU 2016-05 are effective for fiscal years beginning after December 15, 2016, and interim periods within those years for public business entities, and December 15, 2017, and interim periods thereafter for all other entities. The System is currently evaluating the impact of this ASU. In March 2016, FASB issued ASU 2016-06, “Contingent Put and Call Options in Debt Instruments.” This ASU clarifies what steps are required when assessing whether the economic characteristics and risks of call (put) options are clearly and closely related to the economic characteristics and risks of their debt hosts, which is one of the criteria for bifurcating an embedded derivative. Consequently, when a call (put) option is contingently exercisable, an entity does not have to assess whether the event that triggers the ability to exercise a call (put) option is related to interest rates or credit risks. The provisions of ASU 2016-06 are effective for fiscal years beginning after December 15, 2016, and interim periods within those years for public business entities, and December 15, 2017, and interim periods thereafter for all other entities. This ASU is not expected to have a material impact on the combined financial statements. In June 2016 and November 2018, FASB issued ASU 2016-13, “Financial Instruments-Credit Losses (Topic 326)”, and, ASU 2018-19, “Codification Improvements to Topic 326, Financial Instruments - Credit Losses”, respectively. These ASU’s require health care entities to evaluate the collectability of the transaction price for goods or services that will be transferred to the patient rather than the stated contract price or the amount billed for those items. Additionally, health care entities are required to estimate variable consideration using either the “expected value” method or the “most-likely-amount” method. These amendments expand disclosures regarding revenue from contracts with customers. These ASU’s are effective for fiscal years beginning after December 15, 2020 and interim periods thereafter. The System is currently evaluating the impact of this ASU. In August 2016, FASB issued ASU 2016-14, “Presentation of Financial Statements of Not-for-Profit Entities.” This ASU requires not-for-profit entities to report two classes of net assets, as well as enhances disclosures on board designated funds, liquidity, and functional expenses. The provisions of ASU 2016-14 are effective for fiscal years beginning after December 15, 2017, and interim periods thereafter. This ASU is not expected to have a material impact on the combined financial statements. In August 2016, FASB issued ASU 2016-15, “Classification of Certain Cash Receipts and Cash Payments.” This ASU provides cash flow statement classification guidance related to debt extinguishment costs, contingent consideration payments made after a business combination, proceeds from the settlement of insurance claims, distributions made from equity method investees, separately identifiable cash flows, and application of the predominance
Quarterly Disclosure Report for December 31, 2018
Notes to Combined Financial Statements - continued
- 34 -
principle. The provisions of ASU 2016-15 are effective for fiscal years beginning after December 15, 2017, and interim periods within those years for public business entities, and December 15, 2018, and interim periods thereafter for all other entities. The System is currently evaluating the impact of this ASU. In October 2016, FASB issued ASU 2016-16, “Intra-Entity Transfers of Assets Other Than Inventory.” This ASU requires an entity to recognize the income tax consequences of an intra- entity transfer of an asset other than inventory when the transfer occurs. The provisions of ASU 2016-16 are effective for fiscal years beginning after December 15, 2017, and interim periods within those years for public business entities, and December 15, 2018, and interim periods thereafter for all other entities. The System is currently evaluating the impact of this ASU. In November 2016, FASB issued ASU 2016-18, “Restricted Cash: a Consensus of the FASB Emerging Issues Task Force.” This ASU requires a statement of cash flows to explain the change during the period in the total of cash, cash equivalents, and amounts generally described as restricted cash or restricted cash equivalents. The provisions of ASU 2016-18 are effective for fiscal years beginning after December 15, 2017, and interim periods within those years for public business entities, and December 15, 2018, and interim periods thereafter for all other entities. This ASU is expected to have a material impact on the combined statements of cash flows. In January 2017, FASB issued ASU 2017-01, “Clarifying the Definition of a Business.” By clarifying the definition of a business, the amendments of this ASU affect all companies and other reporting organizations that must determine whether they have acquired or sold a business. The provisions of ASU 2017-01 are effective for fiscal years beginning after December 15, 2017, and interim periods within those years for public business entities, and December 15, 2018, and interim periods within those years for all other entities. The System is currently evaluating the impact of this ASU. In January 2017, FASB issued ASU 2017-04, “Simplifying the Test for Goodwill Impairment.” This ASU eliminates Step 2 from the goodwill impairment test. Step 2 measures a goodwill impairment loss by comparing the implied fair value of a reporting unit’s goodwill with the carrying amount of that goodwill. The provisions of ASU 2017-04 are effective for fiscal years beginning after December 15, 2019, and interim periods within those years for public business entities, and December 15, 2021, and interim periods within those years for all other entities. The System is currently evaluating the impact of this ASU. In March 2017, FASB issued ASU 2017-07, “Improving the Presentation of Net Periodic Pension Cost and Net Periodic Postretirement Benefit Cost.” This ASU requires that an employer report the service cost component in the same line item as other compensation costs
Quarterly Disclosure Report for December 31, 2018
Notes to Combined Financial Statements - continued
- 35 -
arising from services rendered by the pertinent employees during the period. The other components of net benefit cost are required to be presented in the income statement separately from the service cost component and outside a subtotal of income from operations, if one is presented. The provisions of ASU 2017-07 are effective for fiscal years beginning after December 15, 2017, and interim periods within those years for public business entities, and December 15, 2018, and interim periods thereafter for all other entities. This ASU is not expected to have a material impact on the combined financial statements. In March 2017, FASB issued ASU 2017-08, “Premium Amortization on Purchased Callable Debt Securities.” This ASU shortens the amortization period for certain callable debt securities held at a premium and requires the premium to be amortized to the earliest call date. However, the amendments do not require an accounting change for securities held at a discount; the discount continues to be amortized to maturity. The provisions of ASU 2017-08 are effective for fiscal years beginning after December 15, 2018, and interim periods within those years for public business entities, and December 15, 2019, and interim periods thereafter for all other entities. The System is currently evaluating the impact of this ASU. In June 2018, FASB issued ASU 2018-08, “Not-for-Profit Entities (Topic 958): Clarifying the Scope and the Accounting Guidance for Contributions Received and Contributions Made.” These amendments clarify the accounting guidance around contributions of cash and other assets made and received by not-for-profit organizations and business enterprises. When the entity is a resource recipient, the provisions of ASU 2018-08 are effective for fiscal years beginning after June 15, 2018 and interim periods within those years, for public business entities and not-for-profit entities, and December 15, 2018 for all other entities. When the entity is a resource provider, the provisions of ASU 2018-08 are effective for fiscal years beginning after December 15, 2018 and interim periods within those years, for public business entities and not-for-profit entities, and December 15, 2019 for all other entities. This ASU is not expected to have a material impact on the combined financial statements. In August 2018, FASB issued ASU 2018-13, “Fair Value Measurement (Topic 820): Disclosure Framework - Changes to the Disclosure Requirements for Fair Value Measurement.” The amendments in ASU 2018-13 remove certain disclosure requirements related to transfers between fair value levels, the valuation of Level 3 assets and liabilities, as well as the changes in unrealized gains and losses included in earnings for Level 3. Additionally, these amendments modify certain disclosure requirements related to transfers, purchases, and issuances in and out of Level 3 for nonpublic entities. The provisions of ASU 2018-13 are effective for fiscal years beginning after December 15, 2019 and interim periods within those years. An entity is permitted to early adopt any removed or modified disclosures upon issuance of ASU 2018-13 and delay adoption of the additional disclosures until their effective date. The System is currently evaluating the impact of this ASU.
Quarterly Disclosure Report for December 31, 2018
Notes to Combined Financial Statements - continued
- 36 -
In August 2018, FASB issued ASU 2018-14, “Compensation - Retirement Benefits - Defined Benefit Plans - General (Subtopic 715-20): Disclosure Framework - Changes to the Disclosure Requirements for Defined Benefit Plans.” The amendments in ASU 2018-14 remove certain requirements related to the amount and timing of plan assets expected to be returned to the employer, related party disclosures, and disclosures related to Level 3 fair value. Additionally, these amendments clarify and enhance the disclosures for projected benefit obligation and accumulated benefit obligation. The provisions of ASU 2018-14 are effective for fiscal years ending after December 15, 2020, for public business entities and December 15, 2021, for all other entities. The System is currently evaluating the impact of this ASU. In August 2018, FASB issued ASU 2018-15, “Intangibles - Goodwill and Other - Internal-Use Software (Subtopic 350-40): Customer’s Accounting for Implementation Costs Incurred in a Cloud Computing Arrangement That Is a Service Contract.” The amendments in ASU 2018-15 determine which implementation costs to capitalize as an asset and which costs to expense. Additionally, these amendments clarify how the capitalized implementation costs should be presented within the financial statements. The provisions of ASU 2018-15 are effective for fiscal years ending after December 15, 2019, for public business entities and December 15, 2020, for all other entities. The System is currently evaluating the impact of this ASU. Cash and Cash Equivalents Cash equivalents are defined as investments which have original maturities of three months or less. Cash equivalents consist primarily of securities issued by the United States government or its agencies, certificates of deposit, commercial paper, and dollar denominated foreign issuer investments. THVG Funds Due From United Surgical Partners, Inc. THVG participates in a shared services accounts payable program with USPI, wherein USPI has custody of substantially all of THVG’s cash, paying THVG and its facilities interest income on the net balance at prevailing market rates. Amounts held by USPI on behalf of THVG totaled approximately $117,029,000 and $117,752,000, at December 31, 2018 and June 30, 2018, respectively. The funds due from USPI are available on demand. Investments The System has designated all of its investments as trading except for those investments held at Highground Advisors (HA) for the benefit of the BHCS Foundation and the investments of All Saints Health Foundation. For all trading investments, the interest and dividends, realized gains (losses) and unrealized gains (losses) are included in gains (losses) on investments, net,
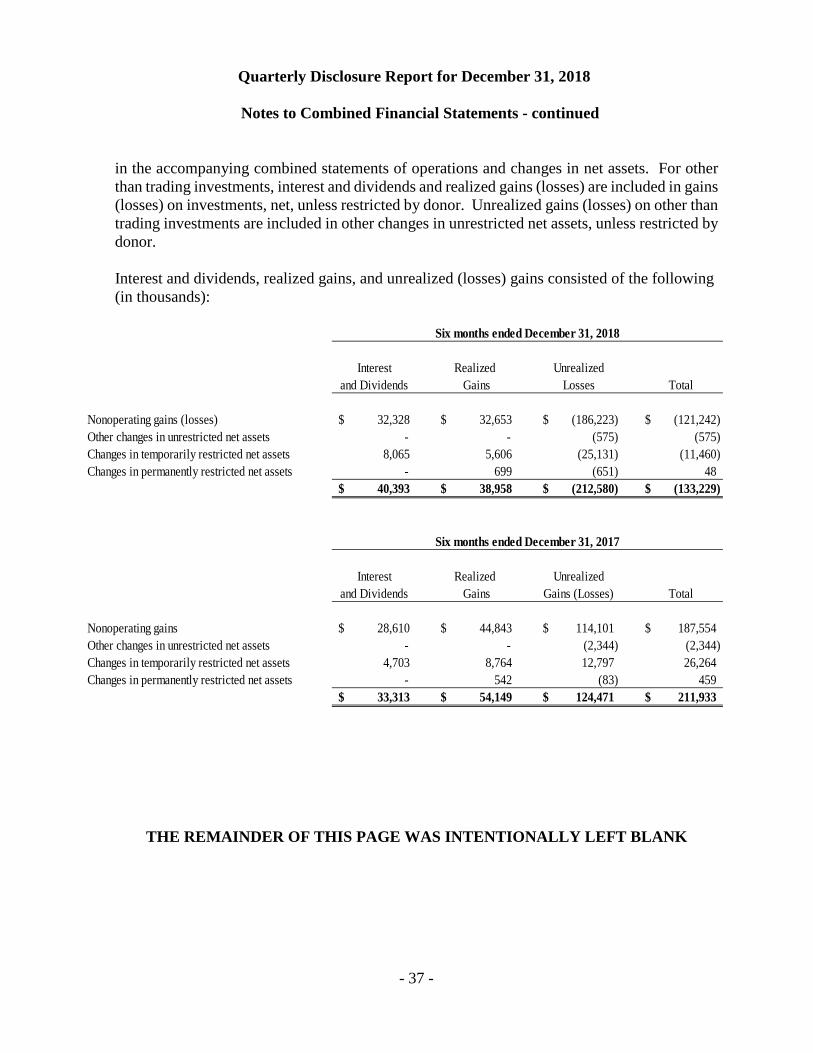
Quarterly Disclosure Report for December 31, 2018
Notes to Combined Financial Statements - continued
- 37 -
in the accompanying combined statements of operations and changes in net assets. For other than trading investments, interest and dividends and realized gains (losses) are included in gains (losses) on investments, net, unless restricted by donor. Unrealized gains (losses) on other than trading investments are included in other changes in unrestricted net assets, unless restricted by donor. Interest and dividends, realized gains, and unrealized (losses) gains consisted of the following (in thousands):
Interest Realized Unrealizedand Dividends Gains Losses Total
Nonoperating gains (losses) 32,328$ 32,653$ (186,223)$ (121,242)$ Other changes in unrestricted net assets - - (575) (575) Changes in temporarily restricted net assets 8,065 5,606 (25,131) (11,460) Changes in permanently restricted net assets - 699 (651) 48
40,393$ 38,958$ (212,580)$ (133,229)$
Interest Realized Unrealizedand Dividends Gains Gains (Losses) Total
Nonoperating gains 28,610$ 44,843$ 114,101$ 187,554$ Other changes in unrestricted net assets - - (2,344) (2,344) Changes in temporarily restricted net assets 4,703 8,764 12,797 26,264 Changes in permanently restricted net assets - 542 (83) 459
33,313$ 54,149$ 124,471$ 211,933$
Six months ended December 31, 2018
Six months ended December 31, 2017
THE REMAINDER OF THIS PAGE WAS INTENTIONALLY LEFT BLANK
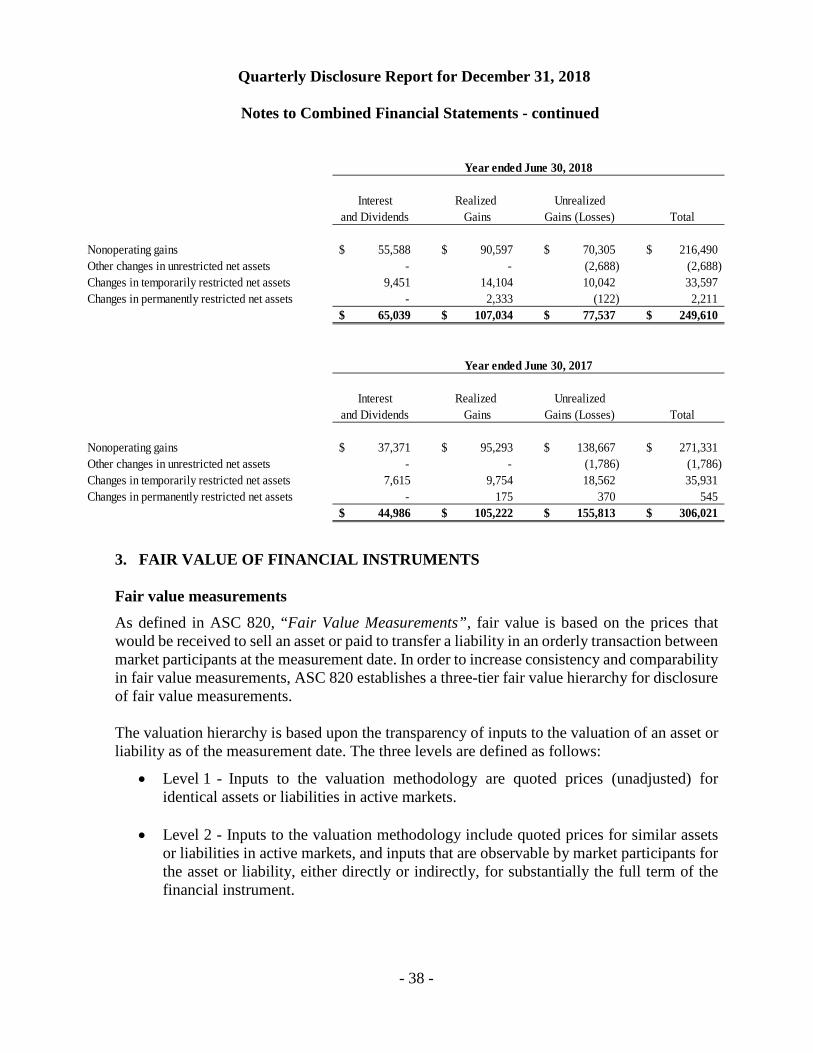
Quarterly Disclosure Report for December 31, 2018
Notes to Combined Financial Statements - continued
- 38 -
Interest Realized Unrealizedand Dividends Gains Gains (Losses) Total
Nonoperating gains 55,588$ 90,597$ 70,305$ 216,490$ Other changes in unrestricted net assets - - (2,688) (2,688) Changes in temporarily restricted net assets 9,451 14,104 10,042 33,597 Changes in permanently restricted net assets - 2,333 (122) 2,211
65,039$ 107,034$ 77,537$ 249,610$
Interest Realized Unrealizedand Dividends Gains Gains (Losses) Total
Nonoperating gains 37,371$ 95,293$ 138,667$ 271,331$ Other changes in unrestricted net assets - - (1,786) (1,786) Changes in temporarily restricted net assets 7,615 9,754 18,562 35,931 Changes in permanently restricted net assets - 175 370 545
44,986$ 105,222$ 155,813$ 306,021$
Year ended June 30, 2018
Year ended June 30, 2017
3. FAIR VALUE OF FINANCIAL INSTRUMENTS Fair value measurements As defined in ASC 820, “Fair Value Measurements”, fair value is based on the prices that would be received to sell an asset or paid to transfer a liability in an orderly transaction between market participants at the measurement date. In order to increase consistency and comparability in fair value measurements, ASC 820 establishes a three-tier fair value hierarchy for disclosure of fair value measurements. The valuation hierarchy is based upon the transparency of inputs to the valuation of an asset or liability as of the measurement date. The three levels are defined as follows:
• Level 1 - Inputs to the valuation methodology are quoted prices (unadjusted) for identical assets or liabilities in active markets.
• Level 2 - Inputs to the valuation methodology include quoted prices for similar assets or liabilities in active markets, and inputs that are observable by market participants for the asset or liability, either directly or indirectly, for substantially the full term of the financial instrument.
Quarterly Disclosure Report for December 31, 2018
Notes to Combined Financial Statements - continued
- 39 -
• Level 3 - Inputs that reflect the reporting entity’s own assumptions about the assumptions market participants would use in pricing the asset or liability are unobservable and developed based on the best information available in the circumstances.
A financial instrument’s categorization within the valuation hierarchy is based upon the lowest level of input that is significant to the fair value measurement. The carrying values of cash and cash equivalents, THVG funds due from USPI, patient accounts receivable, other receivables, investments of insurance subsidiaries, accounts payable, accrued liabilities, and estimated third-party payor settlements payable are reasonable estimates of their fair value due to the short-term nature of these financial instruments. Fair values of short-term investments and long-term investments are generally based on quoted prices for similar instruments in active markets, quoted prices for identical or similar instruments in markets that are not active, and model-based valuation techniques for which all significant assumptions are observable in the market or can be corroborated by observable market data for substantially the full term of the assets. Inputs are obtained from various sources including market participants, dealers, and brokers. This applies to investments such as domestic equities, U.S. treasuries, exchange-traded mutual funds, and agency securities. Alternative Investments Investments held consist of marketable securities as well as securities that do not have readily determinable fair values. Private equity investments, real estate investments, and hedge funds are collectively referred to as “alternative investments.” These are included in unrestricted long-term investments in the accompanying combined balance sheets, other than those held at HA. The investments in alternative investments are valued by management at fair value utilizing the net asset value (NAV) provided by the underlying investment companies unless management determines some other valuation is more appropriate. Such fair value estimates do not reflect early redemption penalties as the System does not intend to sell such investments before the expiration of the early redemption periods. The fair values of the securities held by limited partnerships that do not have readily determinable fair values are determined by the general partner and are based on historical cost, appraisals, or other estimates that require varying degrees of judgment. If no public market exists for the investment securities, the fair value is determined by the general partner taking into consideration, among other things, the cost of securities, prices of recent significant placements of securities of the same issuer, and subsequent developments concerning the companies to which the securities relate. Investments valued at NAV are not leveled within the fair value hierarchy.
Quarterly Disclosure Report for December 31, 2018
Notes to Combined Financial Statements - continued
- 40 -
Included in collective investment funds held at HA for the BHCS Foundation are alternative investment interests in private equity funds and oil and gas interests. These interests are included in restricted long-term investments in the accompanying combined balance sheets. These alternative investments are in limited partnership interests and are carried at the NAV provided by the underlying investment companies unless management determines some other valuation is more appropriate. BHCS Foundation also has other real estate and oil and gas interests which are carried at lower of cost or market and represent Level 3 assets. Beneficial Interest The System records charitable remainder trusts, where it is not the trustee, at the discounted present value of the estimated future cash flows. These trusts are reported in contributions receivable, net, in the accompanying combined balance sheets. When a third-party serves as trustee, the beneficial interest is required to be measured at fair value on a recurring basis. As beneficial interests utilize multiple unobservable inputs, including no active markets, and are measured using management’s assumption about risk inherent in the valuation technique, beneficial interests in split-interest agreements represent Level 3 assets. The methods described above may produce a fair value calculation that may not be indicative of net realizable value or reflective of future fair values. Furthermore, while the System believes its valuation methods are appropriate and consistent with other market participants, the use of different methodologies or assumptions to determine the fair value of certain financial instruments could result in a different estimate of fair value at the reporting date.
THE REMAINDER OF THIS PAGE WAS INTENTIONALLY LEFT BLANK

Quarterly Disclosure Report for December 31, 2018
Notes to Combined Financial Statements - continued
- 41 -
The following table below sets forth, by level, the financial assets and liabilities measured at fair value on a recurring basis as of December 31, 2018 (in thousands):
Assets: Total Level 1 Level 2 Level 3Cash and cash equivalents Cash 914,424$ 914,424$ $ - $ - Money market funds 32,388 32,388 - - Total cash and cash equivalents 946,812 946,812 - -
Short-term investments Cash 44 44 - - Mutual funds 1,308 1,308 - - Fixed income securities 1,822 - 1,822 - U.S. government securities 125,261 97,105 28,156 - Other 65,227 65,151 76 - Total short-term investments 193,662 163,608 30,054 -
Unrestricted long-term investments Cash 1,642 1,642 - - Certificates of deposit 500 500 - - Mutual funds 31,345 31,275 70 - Equity securities 1,515,389 280,128 1,235,261 - Fixed income securities 241,900 28 241,872 - U.S. government securities 486,464 - 486,464 - Mortgage-backed securitites 381,389 65,528 315,861 - Split-interest agreements 1,153 - 1,153 - Cash surrender value life insurance 663 - - 663 Other 754 - 716 38 Common funds, held at HA Group investment fund 598 - 598 - Group bond fund 35 - 35 - Group equity fund 67 - 67 - Other funds 21 20 - 1 Assets held at NAV practical expedient (1)
Hedge fund/diversifiers alternative investments 510,957 Private equity alternative investments 228,641 Real estate alternative investments 114,734 Other funds 4 Total unrestricted long-term investments 3,516,256 379,121 2,282,097 702
(1) Hedge fund/diversifiers alternative investments, private equity alternative investments, real estate alternative investments, and other investments for which fair value is measured using the NAV per share as a practical expedient are not leveled within the fair value hierarchy and are included as a reconciling item to total investments.
December 31, 2018
In the accompanying combined balance sheets, unrestricted long-term investments at December 31, 2018 includes an investment of approximately $128,947,000 accounted for under the cost method.
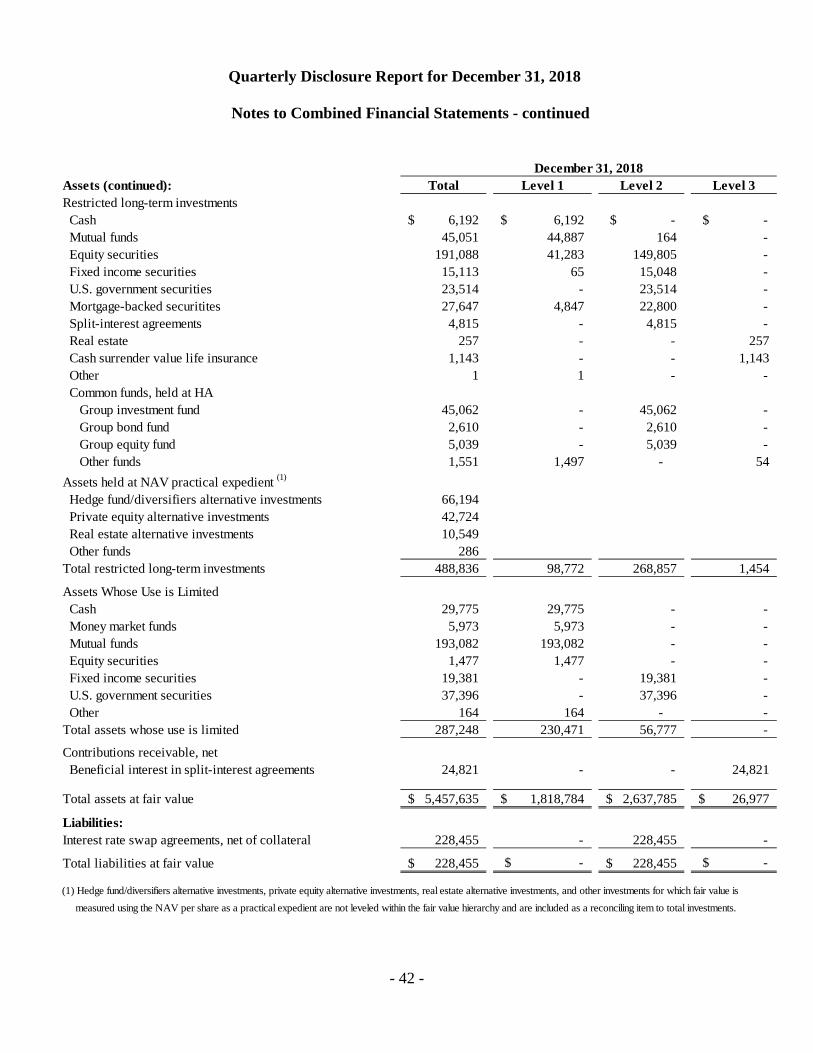
Quarterly Disclosure Report for December 31, 2018
Notes to Combined Financial Statements - continued
- 42 -
Assets (continued): Total Level 1 Level 2 Level 3Restricted long-term investments Cash 6,192$ 6,192$ $ - $ - Mutual funds 45,051 44,887 164 - Equity securities 191,088 41,283 149,805 - Fixed income securities 15,113 65 15,048 - U.S. government securities 23,514 - 23,514 - Mortgage-backed securitites 27,647 4,847 22,800 - Split-interest agreements 4,815 - 4,815 - Real estate 257 - - 257 Cash surrender value life insurance 1,143 - - 1,143 Other 1 1 - - Common funds, held at HA Group investment fund 45,062 - 45,062 - Group bond fund 2,610 - 2,610 - Group equity fund 5,039 - 5,039 - Other funds 1,551 1,497 - 54 Assets held at NAV practical expedient (1)
Hedge fund/diversifiers alternative investments 66,194 Private equity alternative investments 42,724 Real estate alternative investments 10,549 Other funds 286 Total restricted long-term investments 488,836 98,772 268,857 1,454
Assets Whose Use is Limited Cash 29,775 29,775 - - Money market funds 5,973 5,973 - - Mutual funds 193,082 193,082 - - Equity securities 1,477 1,477 - - Fixed income securities 19,381 - 19,381 - U.S. government securities 37,396 - 37,396 - Other 164 164 - - Total assets whose use is limited 287,248 230,471 56,777 -
Contributions receivable, net Beneficial interest in split-interest agreements 24,821 - - 24,821
Total assets at fair value 5,457,635$ 1,818,784$ 2,637,785$ 26,977$
Liabilities:Interest rate swap agreements, net of collateral 228,455 - 228,455 -
Total liabilities at fair value 228,455$ $ - 228,455$ $ -
(1) Hedge fund/diversifiers alternative investments, private equity alternative investments, real estate alternative investments, and other investments for which fair value is measured using the NAV per share as a practical expedient are not leveled within the fair value hierarchy and are included as a reconciling item to total investments.
December 31, 2018

Quarterly Disclosure Report for December 31, 2018
Notes to Combined Financial Statements - continued
- 43 -
The following table is a roll forward of the combined balance sheet amounts for financial instruments classified by the System within Level 3 of the valuation hierarchy defined above for the six months ended December 31, 2018 (in thousands):
Common Split-Interest InvestmentAgreements Funds Other Total
Balance, beginning of period 24,584$ 55$ 2,182$ 26,821$ Realized gains (losses), net 60 - (77) (17) Unrealized (losses) gains, net (494) - 1 (493) Purchases 768 - - 768 Settlements (97) - (5) (102) Balance, end of period 24,821$ 55$ 2,101$ 26,977$
December 31, 2018
At December 31, 2018, alternative investments recorded at NAV consisted of the following (in thousands):
Redemption RedemptionUnfunded Frequency if Notice
Fair Value Commitments Currently Eligible PeriodEquity-linked investments a 49,114$ $ - quarterly, annually 60-90 daysEvent-driven investments b 84,433 - quarterly, annually 30-90 daysCredit-linked investments c 84,421 -
Multi-strategy investments d 1,957 - monthly, quarterly 30-90 daysTactical trading investments e 146,849 - daily, monthly 2-90 daysRisk parity and global asset allocation fundf 210,377 - monthly 5-30 daysReal estate funds - open ended g 55,795 - quarterly 90 daysReal estate funds - closed ended h 69,488 21,819 Oil and gas funds i 290 -
Private equity funds j 203,575 192,488 Private debt funds k 67,790 43,652 Total 974,089$ 257,959$
December 31, 2018
Quarterly Disclosure Report for December 31, 2018
Notes to Combined Financial Statements - continued
- 44 -
a) Equity-linked fund managers buy equities that are expected to increase in value and sell short equities that are expected to decrease in value. Portfolios range from net short to net long, depending on market conditions. Aggressive funds may capture returns by exceeding 100% exposure while conservative funds mitigate market risk by maintaining net exposures of between 0-50%. Typically, equity-linked strategies are based on "bottom up" fundamental analysis of the individual companies, in which investments are made. There may also be "top down" analysis of the risks and opportunities offered by industries, sectors, countries, and the macroeconomic situation. Equity-linked managers may be generalists or focus on certain industries, sectors, regions or equity category (i.e. small or large cap and value or growth). There are many trading styles, with frequent or dynamic traders and some longer-term investors. Returns are generally more correlated with the direction of the equity markets, although reduction in market risk exposure through shorting is expected to enhance the absolute and risk-adjusted returns relative to the overall performance of the asset class. The fair values of the investments in this class have been estimated using the net asset value per share of the funds.
b) Event-driven fund managers seek to exploit pricing inefficiencies that may occur before or after corporate events such as an earnings announcement, bankruptcy, merger, acquisition, or spinoff. Returns are less correlated with the general direction of market movements primarily due to the idiosyncratic nature of individual events. Several investment managers include quarterly percentage redemption limits. The fair values of the investments in this class have been estimated using the net asset value per share of the funds.
c) Credit-linked fund managers seek to profit from the mispricing of related securities. These
strategies utilize quantitative and qualitative analysis to identify securities or spreads between securities that deviate from their fair value and/or historical norms. Examples include convertible arbitrage, fixed arbitrage, statistical arbitrage, and select global macro strategies. Fund returns are generally not dependent on the direction of market movements. The fair values of the investments in this class have been estimated using the net asset value per share of the funds.
d) Multi-strategy fund managers focus on large, long-term mispricing in the global fixed-income, equity and credit markets, capturing relative-value anomalies via multi-product trades. Returns are relatively uncorrelated with the general direction of market movements since they avoid taking a directional bias with regards to the price movement of a specific stock or market. Several investment managers include quarterly percentage redemption limits and/or early redemption penalties. The fair values of the investments in this class have been estimated using the net asset value per share of the funds.
e) Tactical trading fund managers generally invest on a large scale around the world using
economic theory to justify the decision making process on either a discretionary or systematic basis. Strategies are typically based on forecasts and analysis about interest rate
Quarterly Disclosure Report for December 31, 2018
Notes to Combined Financial Statements - continued
- 45 -
trends, the general flow of funds, political changes, government policies, inter-government relations, and other broad systemic and technical factors. Returns are relatively uncorrelated with the general direction of market movements. Several investment managers include quarterly percentage redemption limits. The fair values of the investments in this class have been estimated using the net asset value per share of the funds.
f) Risk parity and global asset allocation fund managers invest across global markets including equities, nominal government bonds, inflation linked bonds, commodities, and emerging markets on a risk balanced framework. Typically these strategies incorporate leverage to increase the risk contribution from low volatility asset classes (e.g., inflation linked bonds and nominal government bonds). The fair values of the investments in this class have been estimated using the net asset value per share of the funds.
g) Real estate - open end fund managers invest in U.S. commercial real estate. Redemptions are available on a quarterly basis, subject to the discretion of the General Partners. The General Partners may elect to establish a redemption queue should the level of redemptions for a given quarter be detrimental to the fund’s overall performance. The fair values of the investments in this class have been estimated using the net asset value, which is based on the ownership interest of partners' capital.
h) Real estate - closed end fund managers invest primarily in U.S. commercial real estate and
industries related to real estate, with some having minimal exposure outside of the U.S. These partnerships are illiquid and therefore do not have a redemption feature. Distributions from each fund will be received as the underlying investments of the funds are liquidated. It is estimated that the underlying assets of these funds will be liquidated over the next six years with the value of those underlying asset being replaced by investments in new real estate funds. The fair values of the investments in this class have been estimated using the net asset value, which is based on the ownership interest of partners' capital.
i) Oil and gas fund managers invested in mineral properties located in Texas and Wyoming.
The fund in this category is closed to new investors, is illiquid and redemption is subject to fund management approval. Royalty income is distributed quarterly subject to fund management approval ($0.50 per unit per quarter in 2018 and 2017). Distributions from the fund will be received as the underlying investments are depleted. The fair value of the mineral properties have been estimated by multiplying the most recent twelve months of royalty income, excluding lease bonus income, times a factor of five. The fund’s management used a multiple of five for the valuation based on current industry methodology, recent market transactions, and the fund’s extensive experience in mineral properties.
Quarterly Disclosure Report for December 31, 2018
Notes to Combined Financial Statements - continued
- 46 -
j) Thirty - seven private equity fund managers invest in a variety of mostly private companies. These investments have a drawdown structure where a portion of commitments (which are made upon entering the partnership) are called gradually over the first 3-6 years of the partnership’s life. It is expected that most of the unfunded commitments should be called within the next 6 years. These partnerships are illiquid and therefore do not have a redemption feature. Instead, the nature of the investments in this class is that distributions are received as the investment in the underlying companies are sold. It is estimated that the current underlying assets of these partnerships should be liquidated within the next 10 years. The investments are valued based on each partnership’s valuation policy which is then subject to annual third party financial audits. Financial audits are available approximately 90 days following year end. Therefore, the valuation at year end reflects the latest reported manager valuation with adjustments for new capital calls and distributions.
k) Seven private debt fund managers invest in a variety of mostly private companies. These investments have a drawdown structure where a portion of commitments (which are made upon entering the partnership) are called gradually over the first 1-3 years of the partnership’s life. It is expected that most of the unfunded commitments should be called within the next 4 years. These partnerships are illiquid and therefore do not have a redemption feature. Instead, the nature of the investments in this class is that distributions are received as income from the debt is received and as the investment in the underlying companies are sold or the debt principal is repaid. It is estimated that the current underlying assets of these partnerships should be liquidated within the next 6 years. The investments are valued based on each partnership’s valuation policy which is then subject to annual third party financial audits. Financial audits are available approximately 90 days following year end. Therefore, the valuation at year end reflects the latest reported manager valuation with adjustments for new capital calls and distributions.
4. ENDOWMENTS
The System’s endowments consist of donor-restricted and board-designated endowment funds for a variety of purposes. The net assets associated with endowment funds are classified and reported based on the existence or absence of donor imposed restrictions. The System has interpreted the State of Texas Uniform Prudent Management of Institutional Funds Act (UPMIFA) as not requiring the maintaining of purchasing power of permanently restricted endowment funds absent explicit donor stipulations to the contrary. As a result of this interpretation, the System classifies as permanently restricted net assets, (a) the original value of gifts donated to the permanent endowment, (b) the original value of subsequent gifts to the permanent endowment, and (c) accumulations to the permanent endowment made in accordance
Quarterly Disclosure Report for December 31, 2018
Notes to Combined Financial Statements - continued
- 47 -
with the direction of the applicable donor gift instrument at the time the accumulation is added to the fund. The remaining portion of the donor-restricted endowment fund that is not classified in permanently restricted net assets is classified as temporarily restricted net assets until those amounts are appropriated for expenditure by the System in a manner consistent with the standard of prudence prescribed by UPMIFA. In accordance with UPMIFA, the System considers the following factors in making a determination to appropriate or accumulate endowment funds:
1) The duration and preservation of the fund 2) The purposes of the System and the donor restricted endowment fund 3) General economic conditions 4) The possible effect of inflation and deflation 5) The expected total return from income and the appreciation of investments 6) Other resources of the System and 7) The investment policies of the System
Endowment Return Objectives and Risk Parameters The System follows an investment policy that attempts to provide a predictable stream of funding to programs supported by its endowment while seeking to maintain the purchasing power of endowment assets. Under this policy, the return objective for the endowment assets, measured over a full market cycle, shall be to maximize the return against various indices, based on the endowment’s target allocation applied to the appropriate individual benchmarks. To achieve its long-term rate of return objectives, the System relies on a total return strategy in which investment returns are achieved through both capital appreciation (realized and unrealized gains) and current yield (interest and dividends). The System targets a diversified asset allocation that places greater emphasis on equity-based investments to achieve its long-term objectives within prudent risk constraints. Relationship of Endowment Spending Practices to Investment Objectives The System determines the appropriation of endowment funds for expenditure reimbursement through the budgeting process. Distribution policies for the System’s endowments govern the amount of endowment funds that may be appropriated during this process. In establishing its policies, the System considered the long-term expected return on its endowments. Accordingly, over the long-term, the System expects the current distribution policies to allow its endowments to grow at an average of the long-term rate of inflation and maintain its purchasing power. In order to maintain the purchasing power of endowment assets, expenditures are based on investment performance and spending is curbed in response to deficit situations. Over the long-term, the System expects its endowment to grow consistent with its intention to maintain the purchasing power of the endowment assets as well as to provide additional real growth through new gifts.
Quarterly Disclosure Report for December 31, 2018
Notes to Combined Financial Statements - continued
- 48 -
5. RETIREMENT BENEFITS The System provides 401(k) defined contribution plans for eligible employees. Employees are eligible to contribute to the plans immediately with no minimum service or age requirement. The System had four frozen defined benefit plans at the time of merger. Three of the four plans are subject to ERISA and all are being funded in accordance with regulatory requirements. Three of the four plans were merged together in fiscal year 2017.
6. CONTINGENCIES The healthcare industry is subject to numerous laws and regulations of federal, state, and local governments. These laws and regulations include, but are not necessarily limited to, matters such as licensure, accreditation, government healthcare program participation requirements, reimbursement for patient services, physician ownership and self-referral, and Medicare and Medicaid fraud and abuse. Government activity has continued with respect to investigations and allegations concerning possible violations of fraud and abuse statutes and regulations by healthcare providers. Violations of these laws and regulations could result in expulsion from government healthcare programs together with the imposition of significant fines and penalties, as well as significant repayments for patient services previously billed. Management believes that the System is in compliance with applicable fraud and abuse laws and regulations as well as other applicable federal and state laws and regulations. 7. SUBSEQUENT EVENTS FirstCare Health Plans On January 1, 2019, the Health Plan acquired SHA, LLC d/b/a FirstCare Health Plans and its subsidiary, Southwest Life & Health Insurance Company, from Covenant Health System in Lubbock, Texas and Hendrick Health System in Abilene, Texas. Letter of Intent with Memorial Hermann On September 28, 2018, BSWH executed a letter of intent with Memorial Hermann Health System to pursue merging the operations of the two health systems through the creation of a new nonprofit, tax-exempt parent corporation. On February 5, 2019, BSWH and MHHS announced merger discussions have been discontinued. The System has performed an evaluation of material subsequent events and transactions from December 31, 2018 through February 14, 2019.
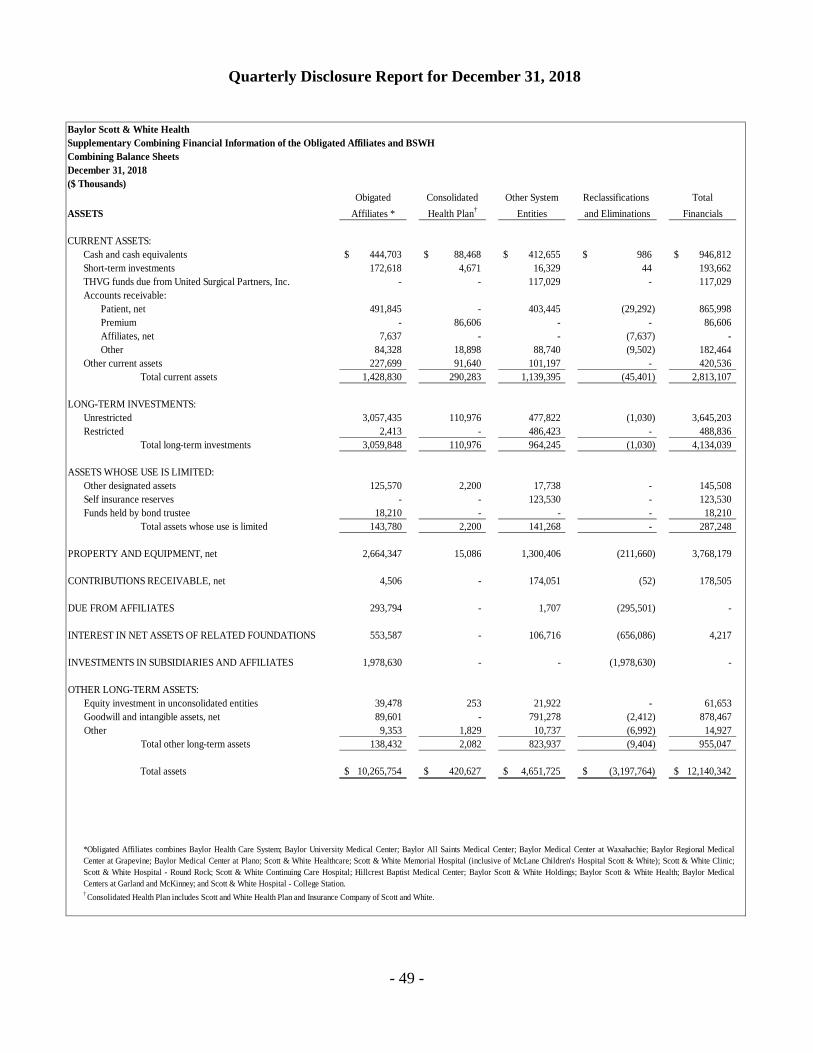
Quarterly Disclosure Report for December 31, 2018
- 49 -
Combining Balance Sheets
($ Thousands)Obigated Consolidated Other System Reclassifications Total
Affiliates * Health Plan† Entities and Eliminations Financials
CURRENT ASSETS:Cash and cash equivalents 444,703$ 88,468$ 412,655$ 986$ 946,812$ Short-term investments 172,618 4,671 16,329 44 193,662 THVG funds due from United Surgical Partners, Inc. - - 117,029 - 117,029 Accounts receivable:
Patient, net 491,845 - 403,445 (29,292) 865,998 Premium - 86,606 - - 86,606 Affiliates, net 7,637 - - (7,637) - Other 84,328 18,898 88,740 (9,502) 182,464
Other current assets 227,699 91,640 101,197 - 420,536 Total current assets 1,428,830 290,283 1,139,395 (45,401) 2,813,107
LONG-TERM INVESTMENTS:Unrestricted 3,057,435 110,976 477,822 (1,030) 3,645,203 Restricted 2,413 - 486,423 - 488,836
Total long-term investments 3,059,848 110,976 964,245 (1,030) 4,134,039
ASSETS WHOSE USE IS LIMITED:Other designated assets 125,570 2,200 17,738 - 145,508 Self insurance reserves - - 123,530 - 123,530 Funds held by bond trustee 18,210 - - - 18,210
Total assets whose use is limited 143,780 2,200 141,268 - 287,248
PROPERTY AND EQUIPMENT, net 2,664,347 15,086 1,300,406 (211,660) 3,768,179
CONTRIBUTIONS RECEIVABLE, net 4,506 - 174,051 (52) 178,505
DUE FROM AFFILIATES 293,794 - 1,707 (295,501) -
INTEREST IN NET ASSETS OF RELATED FOUNDATIONS 553,587 - 106,716 (656,086) 4,217
INVESTMENTS IN SUBSIDIARIES AND AFFILIATES 1,978,630 - - (1,978,630) -
OTHER LONG-TERM ASSETS:Equity investment in unconsolidated entities 39,478 253 21,922 - 61,653 Goodwill and intangible assets, net 89,601 - 791,278 (2,412) 878,467 Other 9,353 1,829 10,737 (6,992) 14,927
Total other long-term assets 138,432 2,082 823,937 (9,404) 955,047
Total assets 10,265,754$ 420,627$ 4,651,725$ (3,197,764)$ 12,140,342$
† Consolidated Health Plan includes Scott and White Health Plan and Insurance Company of Scott and White.
*Obligated Affiliates combines Baylor Health Care System; Baylor University Medical Center; Baylor All Saints Medical Center; Baylor Medical Center at Waxahachie; Baylor Regional MedicalCenter at Grapevine; Baylor Medical Center at Plano; Scott & White Healthcare; Scott & White Memorial Hospital (inclusive of McLane Children's Hospital Scott & White); Scott & White Clinic;Scott & White Hospital - Round Rock; Scott & White Continuing Care Hospital; Hillcrest Baptist Medical Center; Baylor Scott & White Holdings; Baylor Scott & White Health; Baylor MedicalCenters at Garland and McKinney; and Scott & White Hospital - College Station.
ASSETS
Baylor Scott & White HealthSupplementary Combining Financial Information of the Obligated Affiliates and BSWH
December 31, 2018
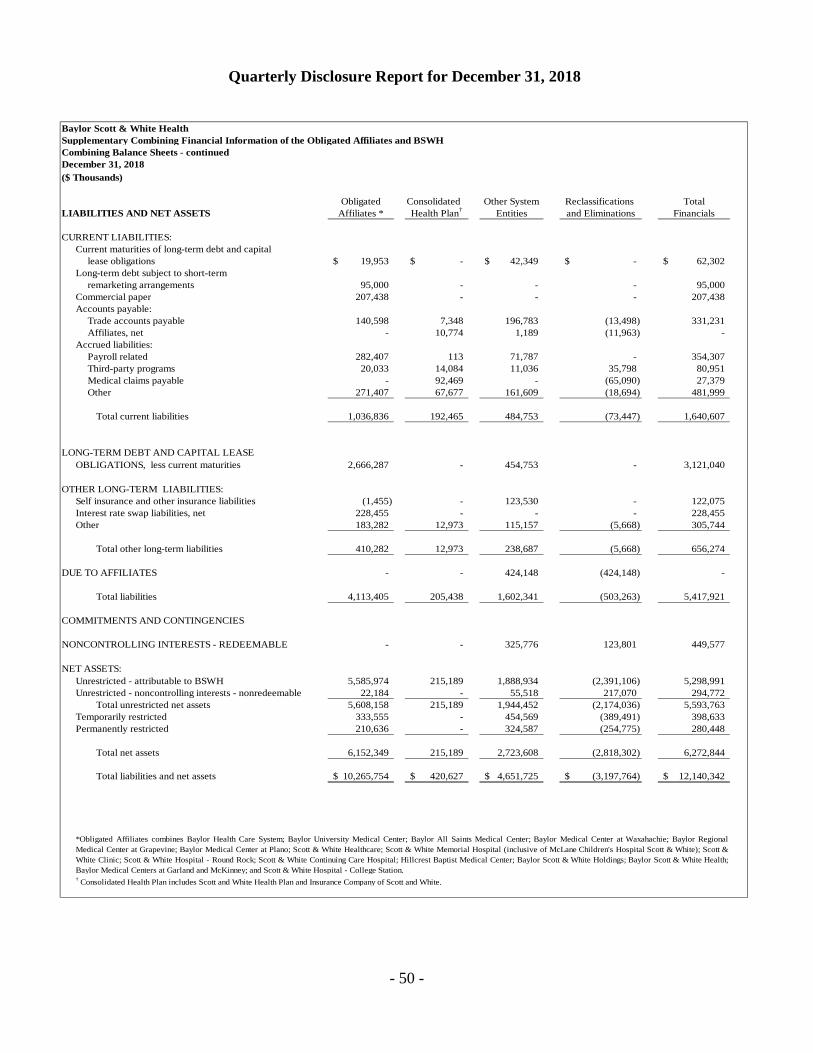
Quarterly Disclosure Report for December 31, 2018
- 50 -
Combining Balance Sheets - continued
($ Thousands)
Obligated Consolidated Other System Reclassifications TotalLIABILITIES AND NET ASSETS Affiliates * Health Plan† Entities and Eliminations Financials
CURRENT LIABILITIES:Current maturities of long-term debt and capital
lease obligations 19,953$ -$ 42,349$ -$ 62,302$ Long-term debt subject to short-term
remarketing arrangements 95,000 - - - 95,000 Commercial paper 207,438 - - - 207,438 Accounts payable:
Trade accounts payable 140,598 7,348 196,783 (13,498) 331,231 Affiliates, net - 10,774 1,189 (11,963) -
Accrued liabilities:Payroll related 282,407 113 71,787 - 354,307 Third-party programs 20,033 14,084 11,036 35,798 80,951 Medical claims payable - 92,469 - (65,090) 27,379 Other 271,407 67,677 161,609 (18,694) 481,999
Total current liabilities 1,036,836 192,465 484,753 (73,447) 1,640,607
LONG-TERM DEBT AND CAPITAL LEASEOBLIGATIONS, less current maturities 2,666,287 - 454,753 - 3,121,040
OTHER LONG-TERM LIABILITIES:Self insurance and other insurance liabilities (1,455) - 123,530 - 122,075 Interest rate swap liabilities, net 228,455 - - - 228,455 Other 183,282 12,973 115,157 (5,668) 305,744
Total other long-term liabilities 410,282 12,973 238,687 (5,668) 656,274
DUE TO AFFILIATES - - 424,148 (424,148) -
Total liabilities 4,113,405 205,438 1,602,341 (503,263) 5,417,921
COMMITMENTS AND CONTINGENCIES
NONCONTROLLING INTERESTS - REDEEMABLE - - 325,776 123,801 449,577
NET ASSETS:Unrestricted - attributable to BSWH 5,585,974 215,189 1,888,934 (2,391,106) 5,298,991 Unrestricted - noncontrolling interests - nonredeemable 22,184 - 55,518 217,070 294,772
Total unrestricted net assets 5,608,158 215,189 1,944,452 (2,174,036) 5,593,763 Temporarily restricted 333,555 - 454,569 (389,491) 398,633 Permanently restricted 210,636 - 324,587 (254,775) 280,448
Total net assets 6,152,349 215,189 2,723,608 (2,818,302) 6,272,844 Total liabilities and net assets 10,265,754$ 420,627$ 4,651,725$ (3,197,764)$ 12,140,342$
† Consolidated Health Plan includes Scott and White Health Plan and Insurance Company of Scott and White.
Baylor Scott & White HealthSupplementary Combining Financial Information of the Obligated Affiliates and BSWH
December 31, 2018
*Obligated Affiliates combines Baylor Health Care System; Baylor University Medical Center; Baylor All Saints Medical Center; Baylor Medical Center at Waxahachie; Baylor RegionalMedical Center at Grapevine; Baylor Medical Center at Plano; Scott & White Healthcare; Scott & White Memorial Hospital (inclusive of McLane Children's Hospital Scott & White); Scott &White Clinic; Scott & White Hospital - Round Rock; Scott & White Continuing Care Hospital; Hillcrest Baptist Medical Center; Baylor Scott & White Holdings; Baylor Scott & White Health;Baylor Medical Centers at Garland and McKinney; and Scott & White Hospital - College Station.

Quarterly Disclosure Report for December 31, 2018
- 51 -
Combining Statements of Operations and Changes in Net Assets
($ Thousands)
Obligated Consolidated Other System Reclassifications TotalAffiliates * Health Plan† Entities and Eliminations Financials
OPERATING REVENUE:Net patient care revenue 2,477,198$ -$ 2,015,946$ (193,415)$ 4,299,729$ Premium revenue - 397,850 - (232) 397,618 Other operating revenue 233,885 8,153 293,979 (356,984) 179,033 Net assets released from restrictions for operations 4,270 - 34,174 (5,407) 33,037
Total operating revenue 2,715,353 406,003 2,344,099 (556,038) 4,909,417
OPERATING EXPENSES:Salaries, wages, and employee benefits 1,354,952 21,585 901,811 (24,574) 2,253,774 Supplies 412,587 66 432,932 - 845,585 Other operating expenses 619,384 39,902 673,697 (342,674) 990,309 Medical claims - 342,441 - (197,469) 144,972 (Gains) losses on fixed asset sales and disposals, net (1,073) - 234 - (839) Depreciation and amortization 131,409 255 67,512 (3,885) 195,291 Interest 50,480 1,236 21,596 (8,744) 64,568
Total operating expenses 2,567,739 405,485 2,097,782 (577,346) 4,493,660
Income from operations 147,614 518 246,317 21,308 415,757
NONOPERATING GAINS (LOSSES):Losses on investments, net (96,236) (1,213) (18,713) (5,080) (121,242) Interest rate swap activity (18,213) - - - (18,213) Contributions 13,699 - 243 (13,941) 1 Equity in gains (losses) of unconsolidated entities 371 - (230) - 141 Loss from extinguishment of debt (200) - - - (200) Other 103,360 (6) 7,416 (110,701) 69
Total nonoperating gains (losses) 2,781 (1,219) (11,284) (129,722) (139,444)
REVENUE AND GAINS IN EXCESS (DEFICIT) OF EXPENSESAND LOSSES BEFORE TAXES 150,395 (701) 235,033 (108,414) 276,313
LESS INCOME TAX EXPENSE 385 8 8,256 - 8,649
REVENUE AND GAINS IN EXCESS (DEFICIT) OF EXPENSESAND LOSSES 150,010 (709) 226,777 (108,414) 267,664
† Consolidated Health Plan includes Scott and White Health Plan and Insurance Company of Scott and White.
Baylor Scott & White HealthSupplementary Combining Financial Information of the Obligated Affiliates and BSWH
For the Six Months Ended December 31, 2018
*Obligated Affiliates combines Baylor Health Care System; Baylor University Medical Center; Baylor All Saints Medical Center; Baylor Medical Center at Waxahachie; Baylor Regional Medical Center atGrapevine; Baylor Medical Center at Plano; Scott & White Healthcare; Scott & White Memorial Hospital (inclusive of McLane Children's Hospital Scott & White); Scott & White Clinic; Scott & WhiteHospital - Round Rock; Scott & White Continuing Care Hospital; Hillcrest Baptist Medical Center; Baylor Scott & White Holdings; Baylor Scott & White Health; Baylor Medical Centers at Garland andMcKinney; and Scott & White Hospital - College Station.
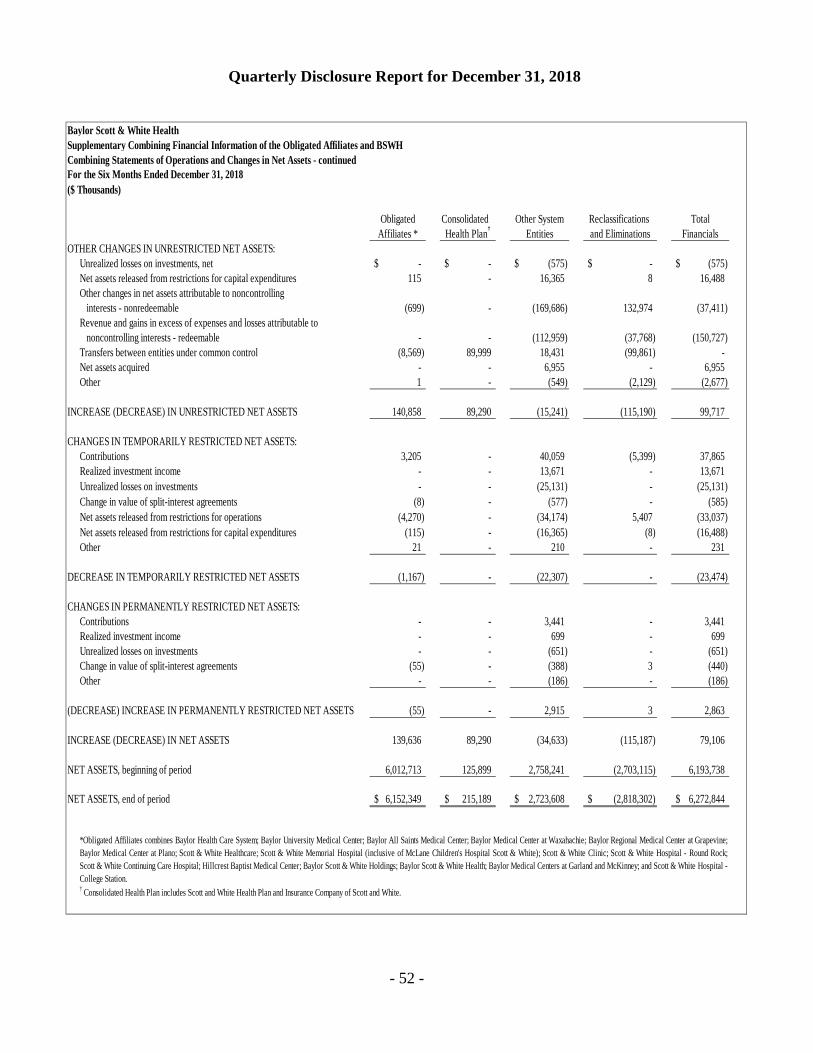
Quarterly Disclosure Report for December 31, 2018
- 52 -
Combining Statements of Operations and Changes in Net Assets - continued
($ Thousands)
Obligated Consolidated Other System Reclassifications TotalAffiliates * Health Plan† Entities and Eliminations Financials
OTHER CHANGES IN UNRESTRICTED NET ASSETS:Unrealized losses on investments, net -$ -$ (575)$ -$ (575)$ Net assets released from restrictions for capital expenditures 115 - 16,365 8 16,488 Other changes in net assets attributable to noncontrolling interests - nonredeemable (699) - (169,686) 132,974 (37,411) Revenue and gains in excess of expenses and losses attributable to noncontrolling interests - redeemable - - (112,959) (37,768) (150,727) Transfers between entities under common control (8,569) 89,999 18,431 (99,861) - Net assets acquired - - 6,955 - 6,955 Other 1 - (549) (2,129) (2,677)
INCREASE (DECREASE) IN UNRESTRICTED NET ASSETS 140,858 89,290 (15,241) (115,190) 99,717
CHANGES IN TEMPORARILY RESTRICTED NET ASSETS:Contributions 3,205 - 40,059 (5,399) 37,865 Realized investment income - - 13,671 - 13,671 Unrealized losses on investments - - (25,131) - (25,131) Change in value of split-interest agreements (8) - (577) - (585) Net assets released from restrictions for operations (4,270) - (34,174) 5,407 (33,037) Net assets released from restrictions for capital expenditures (115) - (16,365) (8) (16,488) Other 21 - 210 - 231
DECREASE IN TEMPORARILY RESTRICTED NET ASSETS (1,167) - (22,307) - (23,474)
CHANGES IN PERMANENTLY RESTRICTED NET ASSETS:Contributions - - 3,441 - 3,441 Realized investment income - - 699 - 699 Unrealized losses on investments - - (651) - (651) Change in value of split-interest agreements (55) - (388) 3 (440) Other - - (186) - (186)
(DECREASE) INCREASE IN PERMANENTLY RESTRICTED NET ASSETS (55) - 2,915 3 2,863
INCREASE (DECREASE) IN NET ASSETS 139,636 89,290 (34,633) (115,187) 79,106
NET ASSETS, beginning of period 6,012,713 125,899 2,758,241 (2,703,115) 6,193,738
NET ASSETS, end of period 6,152,349$ 215,189$ 2,723,608$ (2,818,302)$ 6,272,844$
† Consolidated Health Plan includes Scott and White Health Plan and Insurance Company of Scott and White.
Baylor Scott & White HealthSupplementary Combining Financial Information of the Obligated Affiliates and BSWH
For the Six Months Ended December 31, 2018
*Obligated Affiliates combines Baylor Health Care System; Baylor University Medical Center; Baylor All Saints Medical Center; Baylor Medical Center at Waxahachie; Baylor Regional Medical Center at Grapevine;Baylor Medical Center at Plano; Scott & White Healthcare; Scott & White Memorial Hospital (inclusive of McLane Children's Hospital Scott & White); Scott & White Clinic; Scott & White Hospital - Round Rock;Scott & White Continuing Care Hospital; Hillcrest Baptist Medical Center; Baylor Scott & White Holdings; Baylor Scott & White Health; Baylor Medical Centers at Garland and McKinney; and Scott & White Hospital -College Station.
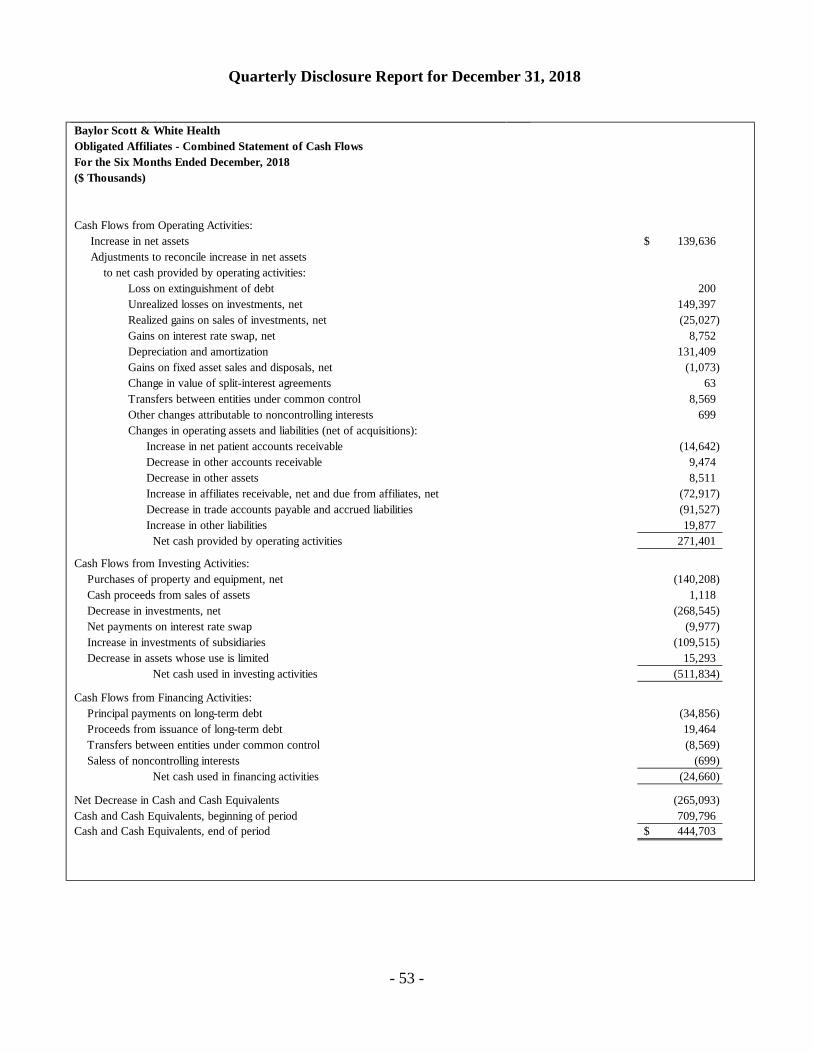
Quarterly Disclosure Report for December 31, 2018
- 53 -
Baylor Scott & White HealthObligated Affiliates - Combined Statement of Cash FlowsFor the Six Months Ended December, 2018($ Thousands)
Cash Flows from Operating Activities: Increase in net assets 139,636$ Adjustments to reconcile increase in net assets to net cash provided by operating activities:
Loss on extinguishment of debt 200 Unrealized losses on investments, net 149,397 Realized gains on sales of investments, net (25,027) Gains on interest rate swap, net 8,752 Depreciation and amortization 131,409 Gains on fixed asset sales and disposals, net (1,073) Change in value of split-interest agreements 63 Transfers between entities under common control 8,569 Other changes attributable to noncontrolling interests 699 Changes in operating assets and liabilities (net of acquisitions):
Increase in net patient accounts receivable (14,642) Decrease in other accounts receivable 9,474 Decrease in other assets 8,511 Increase in affiliates receivable, net and due from affiliates, net (72,917) Decrease in trade accounts payable and accrued liabilities (91,527) Increase in other liabilities 19,877 Net cash provided by operating activities 271,401
Cash Flows from Investing Activities: Purchases of property and equipment, net (140,208) Cash proceeds from sales of assets 1,118 Decrease in investments, net (268,545) Net payments on interest rate swap (9,977) Increase in investments of subsidiaries (109,515) Decrease in assets whose use is limited 15,293
Net cash used in investing activities (511,834)
Cash Flows from Financing Activities: Principal payments on long-term debt (34,856) Proceeds from issuance of long-term debt 19,464 Transfers between entities under common control (8,569) Saless of noncontrolling interests (699)
Net cash used in financing activities (24,660)
Net Decrease in Cash and Cash Equivalents (265,093) Cash and Cash Equivalents, beginning of period 709,796 Cash and Cash Equivalents, end of period 444,703$