quarterly economic outlook august 2016 - kpmg | us€¦ · executive summary global economy ......
TRANSCRIPT
Quarterly Economic OutlookGlobal and Australian ForecastsAugust 2016
KPMG Economics

ContentsPage
Executive summary 3Global outlook 5Global forecasts 10Domestic outlook 12Domestic forecasts 18KPMG Economics Quarterly Scenario – Global investors lose confidence in Europe 20KPMG Economics contacts 24

3© 2016 KPMG, an Australian partnership and a member firm of the KPMG network of independent member firms affiliated with KPMG International Cooperative (“KPMG International”), a Swiss entity. All rights reserved. The KPMG name and logo are registered trademarks or trademarks of KPMG International. Liability limited by a scheme approved under Professional Standards Legislation.
Executive summaryGlobal economy • Brexit has increased global uncertainty and likely to have impeded the recovery in the world economy - 2016 looks like it will
record the lowest level of economic growth since 2009.• Chinese economy remains under pressure as the government seeks to rebalance the economy towards higher domestic
consumption and greater import substitution activities• Contradictory indicators also make it difficult to read the current state of the US economy• Japan’s Abenomics policy framework remains a disappointment, but growth in the first quarter of 2016 came in slightly higher than
expectations• The ‘inflation genie’ in most advanced economies appears to be in its bottle• Long term bond yields continue to fall for almost all countries, declining between 30bp and 50bp in most economies, with
Germany, Japan and Switzerland now registering negative rates• Commodity prices remained subdued and although there appears to be some signs of recovery, they remain significantly below
2015 levels, however oil price volatility seems to have stabilised• The ILO expects the number of unemployed persons to increase by 2.3 million in 2016
Australian economy
• The Australian economy continues to grow at rates better than most of the developed economies, recording seasonally adjusted growth of 1.1% q/q and 2.7% y/y in the March Quarter 2016.
• Downturn in investment expenditure remains a drag on economic growth, and will continue for the next 12-18 months• Employment growth is not occurring at rates strong enough to significantly reduce unemployment levels• Inflation remains weak and will stay below the RBA target band into FY17• The $A appears relatively strong at the moment, although this is more so reflecting weaknesses in other currencies• Consumer sentiment in Australia fell in both June and July of 2016
Australian forecasts
FY15 FY16 FY17 FY18 FY19 FY20 FY21
GDP (Real) 2.3% 2.9% 2.7% 3.0% 3.1% 3.4% 3.4%
Inflation (1) 1.6% 1.2% 2.0% 2.4% 2.4% 2.6% 2.9%
Unemployment, % (1) 6.1% 5.7% 5.3% 5.3% 5.6% 5.6% 5.7%
$A/US$ (1) 0.778 0.745 0.752 0.745 0.743 0.742 0.745
(1) = Average through the year
Global outlook

5© 2016 KPMG, an Australian partnership and a member firm of the KPMG network of independent member firms affiliated with KPMG International Cooperative (“KPMG International”), a Swiss entity. All rights reserved. The KPMG name and logo are registered trademarks or trademarks of KPMG International. Liability limited by a scheme approved under Professional Standards Legislation.
Global outlookThe lead-up and immediate aftermath of the United Kingdom (UK) voting to leave the European Union (EU) has increased global uncertainty and likely to have impeded the recovery in the world economy. Prior to the Brexitreferendum world economic growth was subdued, and now it looks like 2016 will record the lowest level of growth since 2009. However, we were starting to see signs of improvement with Emerging Markets and Developing Economies; specifically Brazil and Russia appear to be returning to positive growth sooner than previously expected.
The IMF have revised its global growth forecasts downwards in the wake of Brexit uncertainty, dropping 0.1% in both 2016 and 2017 to 3.1% and 3.4% respectively. KPMG Economics’ forecasts are slightly lower than the IMF at 3.0% and 3.3% for 2016 and 2017 respectively, primarily due to differences in expectations on world trade. The WTO noted that an additional 145 trade-restrictive measures have been put in place by G20 countries during the 7-month period to mid-May 2016; which equates to the highest monthly adoption rate of protectionist measures since 2009.
Despite the economic recovery strengthening in the first part of this year –driven by improving domestic demand in most countries – the political and economic uncertainty following the UK referendum has now put a dampener on expected growth rates in advanced European economies for the rest of the year. 2016 Q1 saw GDP growth of 0.6% for the Euro area; some 1.7% higher than the same time twelve months ago. Unemployment in the Euro Area has fallen to be 10.1% in June 2016, although Greece (23.4%) and Spain (19.9%) remain at extreme levels of unemployment.
The ECB continues to adopt very accommodative monetary policy; in early June 2016 it began purchasing corporate bonds as part of its €80 billion per month Asset Purchase Programme (APP), which itself has been extended ‘until March 2017, or beyond if necessary’. The ECB also commenced the second series of Targeted Longer-term Refinancing Operations (TLTRO II) in late June 2016 to further incentivise banks to lend to the private sector. Under TLTRO II, the more loans that participating banks issue to non-financial corporations and households (except loans to households for house purchases), the more attractive the interest rate on their TLTRO-II borrowings become.
-6
-4
-2
0
2
4
6
8
10
% c
han
ge p
er a
nn
um
Source: KPMG Economics, IMF
Chart 1World GDP Growth
Emerging Markets and developing Economies Advanced Economies World
-2
-1
0
1
2
3
4
5
6
7
% c
han
ge p
er a
nn
um
Source: KPMG Economics, IMF
Chart 2GDP Growth rates
2016 2017

6© 2016 KPMG, an Australian partnership and a member firm of the KPMG network of independent member firms affiliated with KPMG International Cooperative (“KPMG International”), a Swiss entity. All rights reserved. The KPMG name and logo are registered trademarks or trademarks of KPMG International. Liability limited by a scheme approved under Professional Standards Legislation.
Global outlookThe Chinese economy continues to show resilience with annualised growth of 6.5% in the first quarter and 6.7% growth in the second quarter of 2016; although there is some conjecture that the latest annual growth rate is 6.3% if the sum of the past 4 quarterly growth rates is used. Regardless of the ‘right number’, the Chinese economy remains under pressure as the government seeks to rebalance the economy towards higher domestic consumption and greater import substitution activities. The most significant concerns still revolve around China’s ever increasing debt position, which is now estimated at nearly 250% of GDP – levels similar to countries with debt problems, such as Greece, Spain and Japan. The concerns revolve around three core issues, being the proportion of debt secured to residential properties; debt sourced from the ‘shadow banking’ sector; and the value of debt owed by local government authorities. Capital outflows appear to have stabilized over the past 6 months, with foreign exchange reserves held by the People’s Bank of China steady at around US$3.2 trillion as at July 2016.
Uneven and inconsistent growth continues to hamper the United States economy, with output slowing in late 2015, picking up in early 2016 then slowing again in the past few months. Contradictory indicators also make it difficult to read the current state of the US economy; 2016 Q2 saw annualisedGDP growth of 1.2%, while employment growth remains strong, with 225,000 new jobs created in July 2016 and the unemployment rate now at 4.9%. This soft economic growth figure has been attributed to a slow down in consumer spending (and corresponding increase in the savings rate) and declining investment in non-residential fixed investment (primarily associated with the energy sector). The FED may need to review their expectations towards monetary policy settings; at the latest June 2016 meeting the participant assessed target level for the Federal Funds Rate was pulled back to 0.83% for 2016 (down from 1.02% in March 2016), 1.63% for 2017 (down from 2.04%), 2.46% for 2018 (down from 2.95%) and 3.14% for the longer run (down from 3.31%). While all these target rates have been revised down they remain consistent with a tightening bias, with at least one, and potentially two, 25bp adjustments expected by the end of the year.
-2
-1
0
1
2
3
4
5
6
7
Ave
rage
per
cen
tage
ch
ange
Source KPMG Economics, IMF
Chart 3World Inflation Rates
China Japan UK US
0
5
10
15
20
25
30
35
Perc
ent
of
GD
P
Source: KPMG Economics, IMF
Chart 4Investment
Emerging Economies Advanced Economies World

7© 2016 KPMG, an Australian partnership and a member firm of the KPMG network of independent member firms affiliated with KPMG International Cooperative (“KPMG International”), a Swiss entity. All rights reserved. The KPMG name and logo are registered trademarks or trademarks of KPMG International. Liability limited by a scheme approved under Professional Standards Legislation.
Global outlookThe UK economy saw first quarter growth at 0.4% q/q, down from 0.7% in the previous quarter; although the economy rebounded to record 0.6% q/q growth in June despite the Brexit vote being held during this period. Results were mixed across sectors, with mining, quarrying and manufacturing all improving, although services growth slowed and construction activity declined. With soft overall conditions and a spike in uncertainty5, the Bank of England (BoE) reduced the Bank Rate to 0.25%, the first cut in seven years and lowest on record. The BoE also agreed to implement a range of new measures aimed at promoting economic growth including a new Term Funding Scheme to reinforce the pass-through of the cut in Bank Rate; the purchase of up to £10 billion of UK corporate bonds; and an expansion of the asset purchase scheme for UK government bonds of £60 billion, taking the total stock of these asset purchases to £435 billion.
Japan’s Abenomics policy framework remains a disappointment but growth in the first quarter of 2016 came in slightly higher than expectations. Domestic demand is weak and inflation remains below target. The Yen has appreciated 16% against the USD since the start of the year, which will negatively impact the Japanese trade balance, and therefore economic growth through the remainder of 2016 and into 2017. The Japanese Government has delayed the planned increase in sales tax from 8% to 10% to now come into force in late 2019 rather than April 2017.
Developing economies and emerging markets have been helped by recent improvements in commodity prices. Brazil achieved a better than expected 2016 Q1 GDP result, with the economy only contracting 0.3%. Increased Government expenditure (associated with the August 2016 Olympic Games) and strong export growth helped overcome the continued weakness in domestic consumption and fixed investment. Meanwhile, the recession being experienced in Russia appears to be easing, with GDP contracting by only 1.2% in the March quarter 2016 – the lowest amount since the recession commenced at the start of 2015. While unemployment has started to decline (down from 6.0% in March to be 5.4% in June), real incomes continue to slide, adding to the weakness in consumption activity.
0
100
200
300
400
500
600
700
Ind
ex
Source: KPMG Economics, EPU
Chart 5Economic Policy Uncertainty Index
UK Euro Overall Daily News-based
0
20
40
60
80
100
120
140
160
0.0
0.5
1.0
1.5
2.0
2.5
Yen
Per
US
D
Cu
rren
cy P
er U
SD
Source: KPMG Economics, RBA
Chart 6Exchange Rates (USD)
Euro (LHS) Pounds (LHS) AUD (LHS) Yen (RHS)

8© 2016 KPMG, an Australian partnership and a member firm of the KPMG network of independent member firms affiliated with KPMG International Cooperative (“KPMG International”), a Swiss entity. All rights reserved. The KPMG name and logo are registered trademarks or trademarks of KPMG International. Liability limited by a scheme approved under Professional Standards Legislation.
Global outlookThe ‘inflation genie’ in most advanced economies appears to be in its bottle, with general ‘all item’ inflation rates running slightly lower than target rates due to softer energy prices. With oil prices rising in 2016Q2, inflation was expected to start to creep back up but hasn’t, suggesting that persistence of the ‘output gap’ and resultant soft wages growth, is also contributing strongly to keeping inflation low. Developing countries on the other hand are still experiencing high inflation, including Brazil (8.9%), Russia, (7.2%) and India (5.8%).
With a weak global outlook long term bond yields continue to fall for almost all countries, declining between 30bp and 50bp in most economies, with numerous countries including Germany, Japan and Switzerland registering negative rates. Even countries like South Africa and Portugal, which experienced spikes in bond yields in late 2015 / early 2016, has seen a tightening over the past few months. Analysts have suggested a variety of reasons that collectively have pushed yields lower, including changing expectations around US Fed rates; monetary policy settings in other developed countries; and an increased risk aversion by investors.
Currency market activity has been mostly focused on movements in the UK Sterling, which has fallen by nearly 15% against the USD since the Brexit vote, and the Japanese Yen, which has conversely appreciated from about 120¥/USD at the start of 2016 to nearly 100 ¥/USD currently. Drivers of these movements include interest rate differentials (YEN) and investor ‘safe haven’ demand (STG). The People’s Bank of China lowered the renminbi’s daily fix to the USD by 3.7% from ¥6.620 to ¥6.6375 after the UK referendum on 27 June 2016; a level it hasn’t been since December 2010.
After several months of stability in monetary policy settings, a flurry of central bank activity has seen central bank rates decline. Official interest rates have declined since the beginning of April 2016 in India (-25bp), Hungary (-15bp), South Korea (-25bp), Russia (-50bp), Indonesia (-25 bp), Australia (-25bp), the UK (-25bp) and New Zealand (-25bp); although Mexico recorded a 50bp increase at the end of June 2016 in its Tasa de Fondeo Bancario (overnight interbank rate).
-0.5% 0.0% 0.5% 1.0% 1.5% 2.0%
Australia
UK
Canada
US
Euro
Japan
Source: KPMG Economice, RBA
Co
un
trie
s
Chart 8July 2016 Official Interest Rates
-1% 0% 1% 2% 3% 4% 5% 6% 7%
Mexico
China
Australia
US
Canada
UK
German
Japan
Switzerland
Source: KPMG Economics: Bloomberg
Co
un
trie
s
Chart 710 Year Bond Yields
9© 2016 KPMG, an Australian partnership and a member firm of the KPMG network of independent member firms affiliated with KPMG International Cooperative (“KPMG International”), a Swiss entity. All rights reserved. The KPMG name and logo are registered trademarks or trademarks of KPMG International. Liability limited by a scheme approved under Professional Standards Legislation.
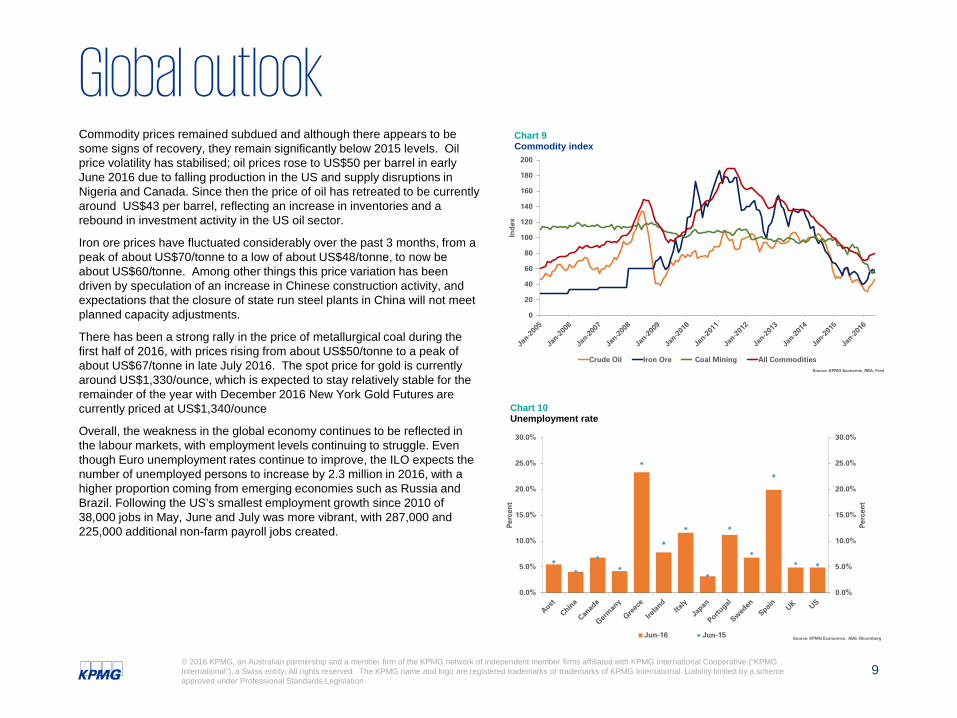
Global outlookCommodity prices remained subdued and although there appears to be some signs of recovery, they remain significantly below 2015 levels. Oilprice volatility has stabilised; oil prices rose to US$50 per barrel in early June 2016 due to falling production in the US and supply disruptions in Nigeria and Canada. Since then the price of oil has retreated to be currently around US$43 per barrel, reflecting an increase in inventories and a rebound in investment activity in the US oil sector.
Iron ore prices have fluctuated considerably over the past 3 months, from a peak of about US$70/tonne to a low of about US$48/tonne, to now be about US$60/tonne. Among other things this price variation has been driven by speculation of an increase in Chinese construction activity, and expectations that the closure of state run steel plants in China will not meet planned capacity adjustments.
There has been a strong rally in the price of metallurgical coal during the first half of 2016, with prices rising from about US$50/tonne to a peak of about US$67/tonne in late July 2016. The spot price for gold is currently around US$1,330/ounce, which is expected to stay relatively stable for the remainder of the year with December 2016 New York Gold Futures are currently priced at US$1,340/ounce
Overall, the weakness in the global economy continues to be reflected in the labour markets, with employment levels continuing to struggle. Even though Euro unemployment rates continue to improve, the ILO expects the number of unemployed persons to increase by 2.3 million in 2016, with a higher proportion coming from emerging economies such as Russia and Brazil. Following the US’s smallest employment growth since 2010 of 38,000 jobs in May, June and July was more vibrant, with 287,000 and 225,000 additional non-farm payroll jobs created.
0
20
40
60
80
100
120
140
160
180
200
Ind
ex
Source: KPMG Economic, RBA, Fred
Chart 9Commodity index
Crude Oil Iron Ore Coal Mining All Commodities
0.0%
5.0%
10.0%
15.0%
20.0%
25.0%
30.0%
0.0%
5.0%
10.0%
15.0%
20.0%
25.0%
30.0%
Perc
ent
Perc
ent
Source: KPMG Economics, ABS, Bloomberg
Chart 10Unemployment rate
Jun-16 Jun-15

10© 2016 KPMG, an Australian partnership and a member firm of the KPMG network of independent member firms affiliated with KPMG International Cooperative (“KPMG International”), a Swiss entity. All rights reserved. The KPMG name and logo are registered trademarks or trademarks of KPMG International. Liability limited by a scheme approved under Professional Standards Legislation.
Growth in Real GDPYear End December 2015 2016 2017 2018 2019 2020 2021
OECD 2.1% 1.7% 1.8% 2.0% 2.1% 2.0% 1.9%
Americas
Brazil -3.9% -2.8% 1.2% 2.0% 2.4% 2.6% 2.8%
Canada 1.1% 1.5% 2.0% 2.3% 2.2% 2.0% 1.8%
Latin America 1.7% 2.0% 2.3% 2.9% 3.0% 2.8% 2.7%
Mexico 2.5% 2.6% 2.3% 2.8% 3.1% 3.3% 3.3%
USA 2.4% 1.9% 2.3% 2.2% 2.2% 2.2% 2.2%
Europe
EMU 1.9% 1.4% 1.3% 1.6% 1.5% 1.3% 1.2%
France 1.2% 1.2% 1.0% 1.4% 1.3% 1.2% 1.1%
Germany 1.4% 1.7% 1.5% 1.4% 1.0% 0.8% 0.7%
Greece -0.3% -1.3% -0.3% -0.4% 1.5% 2.9% 3.0%
Ireland 26.3% 1.5% 2.4% 3.2% 3.1% 2.7% 2.4%
Italy 0.6% 0.7% 0.5% 1.3% 1.7% 1.7% 1.5%
Russian Federation -3.7% -0.9% 0.0% 4.3% 3.4% 2.7% 2.5%
UK 2.2% 1.7% 0.9% 1.9% 2.1% 2.2% 2.1%
Africa 3.9% 2.8% 3.4% 4.3% 4.0% 3.5% 3.3%
South Africa 2.6% 2.5% 2.6% 3.1% 3.5% 4.0% 4.2%
Middle East 2.5% 2.6% 3.1% 3.4% 3.0% 3.1% 3.2%
Asia
China 6.9% 6.6% 6.1% 5.9% 5.6% 5.6% 5.7%
East Asia 5.0% 3.6% 5.0% 5.3% 5.1% 4.9% 4.7%
Hong Kong 2.4% 0.9% 2.3% 2.4% 2.3% 2.3% 2.2%
Indonesia 4.8% 4.4% 4.6% 5.7% 4.9% 4.2% 3.8%
India 7.2% 7.5% 6.9% 7.3% 6.8% 6.6% 6.4%
Japan 0.6% 0.3% 0.5% 0.7% 0.6% 0.5% 0.6%
Singapore 2.0% 1.4% 2.8% 3.3% 3.1% 3.1% 3.2%
South Korea 2.6% 2.5% 2.6% 3.1% 3.5% 4.0% 4.2%
Taiwan 0.6% 0.7% 2.3% 2.9% 3.1% 3.2% 3.3%
Vietnam 6.6% 7.2% 4.4% 4.3% 4.2% 3.9% 3.5%
Oceania
New Zealand 3.0% 2.6% 1.8% 2.2% 2.3% 2.3% 2.3%
World 3.1% 3.0% 3.3% 3.7% 3.6% 3.5% 3.5%
Annual InflationYear End December 2015 2016 2017 2018 2019 2020 2021
OECD 0.8% 1.0% 1.8% 1.8% 1.8% 1.9% 2.1%
Americas
Brazil 10.3% 5.7% 5.5% 5.0% 4.3% 4.3% 4.7%
Canada 1.3% 1.5% 2.0% 1.0% 0.8% 1.4% 1.9%
Latin America 4.5% 4.2% 3.6% 3.4% 2.6% 3.3% 3.9%
Mexico 2.3% 3.6% 3.2% 2.3% 2.2% 2.6% 3.0%
USA 0.5% 1.0% 1.7% 1.7% 1.8% 2.0% 2.2%
Europe
EMU 0.3% 0.4% 1.5% 1.7% 1.6% 1.6% 1.6%
France 0.0% 0.6% 1.5% 1.6% 1.6% 1.5% 1.6%
Germany 0.7% 0.3% 1.7% 1.7% 1.7% 1.7% 1.8%
Greece -0.5% -1.0% -0.8% -0.5% -0.2% 0.0% 0.1%
Ireland 0.9% -0.6% 0.3% 0.8% 1.1% 1.3% 1.5%
Italy 0.3% 0.4% 1.5% 2.2% 1.9% 1.8% 1.8%
Russian Federation 14.5% 5.2% 5.1% 4.8% 4.5% 4.4% 4.4%
UK 0.1% 1.0% 3.2% 2.5% 2.1% 2.0% 2.0%
Africa 9.9% 10.5% 6.8% 6.1% 5.1% 4.5% 4.2%
South Africa 1.1% 1.4% 1.7% 1.6% 1.7% 1.8% 1.9%
Middle East 7.3% 5.8% 5.9% 5.4% 4.3% 3.9% 3.4%
Asia
China 1.5% 2.5% 1.3% 1.9% 1.9% 2.1% 2.6%
East Asia 1.8% 1.1% 2.5% 3.3% 3.6% 3.8% 3.9%
Hong Kong 1.0% 1.4% 1.5% 1.6% 1.9% 2.2% 2.6%
Indonesia 4.8% 3.8% 5.2% 5.1% 4.7% 4.5% 4.4%
India 5.3% 6.9% 3.4% 4.4% 4.1% 4.1% 4.0%
Japan -0.2% -0.5% 0.1% 0.4% 0.4% 0.3% 0.3%
Singapore -0.7% -0.5% 0.8% 1.1% 1.6% 1.9% 2.4%
South Korea 1.1% 1.4% 1.7% 1.6% 1.7% 1.8% 1.9%
Taiwan 0.1% 0.0% 0.7% 0.3% 0.5% 0.8% 1.0%
Vietnam 0.5% 5.1% 3.2% 4.0% 4.8% 5.4% 5.6%
Oceania
New Zealand 0.7% 0.8% 1.5% 1.5% 2.2% 2.5% 2.8%
Global forecasts

Domestic outlook

12© 2016 KPMG, an Australian partnership and a member firm of the KPMG network of independent member firms affiliated with KPMG International Cooperative (“KPMG International”), a Swiss entity. All rights reserved. The KPMG name and logo are registered trademarks or trademarks of KPMG International. Liability limited by a scheme approved under Professional Standards Legislation.
Domestic outlookThe Australian economy, while still subdued by historical standards, continues to grow at rates better than most of the developed economies. Growth is being supported by the export sector, with mining production generating economic benefits from a volume (and slight price) perspective, and services also contributing positively to our trade balance. Declining business investment continues to detract from economic growth, and is anticipated to do so well into FY18. Overall, the Australian economy recorded seasonally adjusted growth of 1.1% q/q and 2.7% y/y in the March Quarter 2016.
KPMG Economics August 2016 forecasts have Australian GDP growing at 2.9% y/y for 2016, which suggests a relatively soft growth for the June quarter 2016.
Again, continued growth in the volume of commodities exported – including the ramp up of LNG exports – combined with the sustained expansion of services exports, means the external sector contribute a marginally greater proportion to GDP going forward.
While the economy is improving, employment growth is not occurring at rates strong enough to make a major impact on Australia’s unemployment levels. We anticipate unemployment to remain sticky between mid-5% and 6% for the medium term.
Inflation remains weak and will stay below the RBA target band into FY17, increasingly steadily thereafter, but still staying within the 2%-3% range for the medium term.
The $A appears relatively strong at the moment, although this is more so reflecting weaknesses in other currencies. We have AUD/USD settling at around the US$0.74 - $US$0.76 band into the medium term.
-2.0%
-1.0%
0.0%
1.0%
2.0%
3.0%
4.0%
-2.0%
-1.0%
0.0%
1.0%
2.0%
3.0%
4.0%
Source: KPMG Economics, ABS
Chart 11GDP Growth by Component
C I+Inv G X-M SD GDP-Qtr GDP-Annualised
-8 -6 -4 -2 0 2 4 6 8
All groups CPI
Food and non-alcoholic beverages
Alcohol and tobacco
Clothing and footwear
Housing
Furnishings, household equipment and services
Health
Transport
Communication
Recreation and culture
Education
Insurance and financial services
Source: KPMG Economics, ABS
CP
I Gro
up
Chart 12Inflation by Category
Annual Inflation Rate

13© 2016 KPMG, an Australian partnership and a member firm of the KPMG network of independent member firms affiliated with KPMG International Cooperative (“KPMG International”), a Swiss entity. All rights reserved. The KPMG name and logo are registered trademarks or trademarks of KPMG International. Liability limited by a scheme approved under Professional Standards Legislation.
ConsumptionThe Westpac-Melbourne Institute Consumer Sentiment Index for Australia fell 3% to 99.1 in July of 2016 following a 1% drop in June. This fall is not unexpected given the uncertainty caused by the Brexit and late finalization of election results. Households have also been a little pessimistic due to the state of the employment market, volatility in equity markets and financial market conditions.
Retail turnover rose 0.4% q/q in Q2 2016, leading to an increase of 3.8% in the twelve months to June 2016 compared with the previous 12 months. Clothing, footwear and personal accessory (+5.8% y/y) and Household goods retailing (+5.6% y/y) were the two strongest sectors, while Food retailing (+2.8% y/y) and Cafes, restaurants and takeaway food services (+3.0% y/y) were the weakest sectors.
Queensland, the Northern Territory and the Australian Capital Territory recorded a decline in retail sales in the June quarter 2016, while the resource states of Western Australian (+0.2%), Queensland (0.6%) and Northern Territory (-0.3%) achieved anemic annual retail sales growth over FY16.
Vehicles sales remain strong, with just under 100,000 vehicles sold in June 2016, bringing total sales for FY16 to 1.17 million, some 3.6% higher than vehicle sales in FY15. The switch in consumer preferences for motor vehicles strengthened in FY16, with sales of passenger vehicles declining by 22,000 (-4.3% y/y) in FY16 compared to FY15; while SUV sales grew by 53,000 (+14.1% y/y) over the same time period. New South Wales achieved more than 7% year-on-year growth in vehicle sales – with virtually of the growth occurring in the SUV segment; while at the other extreme, Western Australia recorded -6% year-on-year growth, some 6,600 less vehicle sales.
65000
70000
75000
80000
85000
90000
95000
100000
105000
Vo
lum
e S
ales
Source: KPMG Economics, ABS
Chart 14New Motor Vehicle Sales, Total vehicles
Trend Seasonally Adjusted
70
80
90
100
110
120
Co
nsu
mer
Sen
tim
ent
Ind
ex
Source: KPMG Economics, Melbourne Institute, Westpac, AIP
Chart 13Consumer Confidence
14© 2016 KPMG, an Australian partnership and a member firm of the KPMG network of independent member firms affiliated with KPMG International Cooperative (“KPMG International”), a Swiss entity. All rights reserved. The KPMG name and logo are registered trademarks or trademarks of KPMG International. Liability limited by a scheme approved under Professional Standards Legislation.
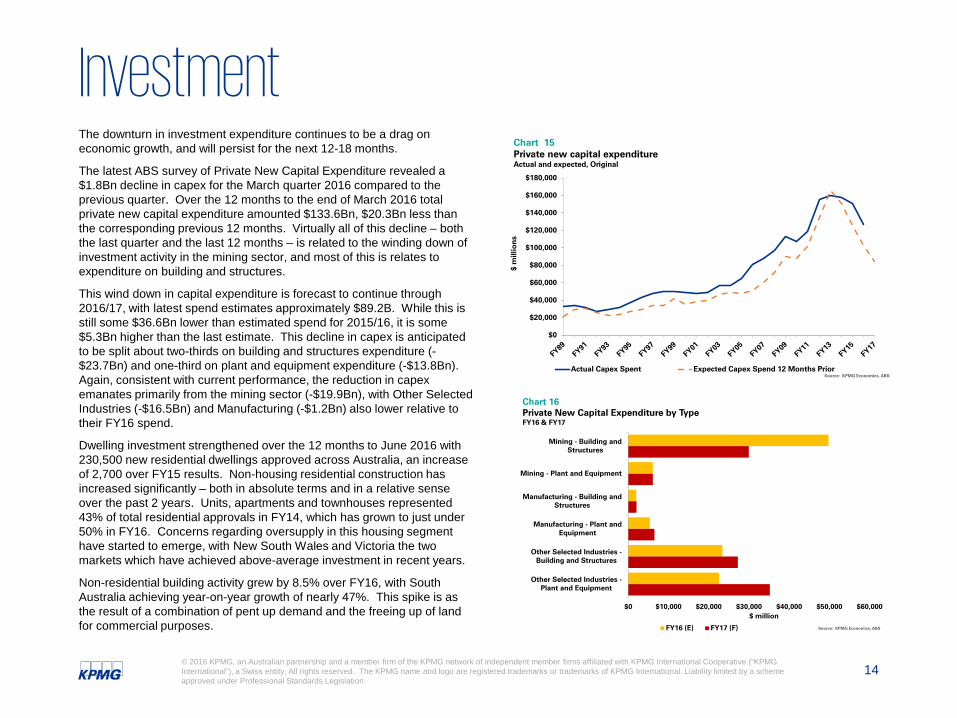
InvestmentThe downturn in investment expenditure continues to be a drag on economic growth, and will persist for the next 12-18 months.
The latest ABS survey of Private New Capital Expenditure revealed a $1.8Bn decline in capex for the March quarter 2016 compared to the previous quarter. Over the 12 months to the end of March 2016 total private new capital expenditure amounted $133.6Bn, $20.3Bn less than the corresponding previous 12 months. Virtually all of this decline – both the last quarter and the last 12 months – is related to the winding down of investment activity in the mining sector, and most of this is relates to expenditure on building and structures.
This wind down in capital expenditure is forecast to continue through 2016/17, with latest spend estimates approximately $89.2B. While this is still some $36.6Bn lower than estimated spend for 2015/16, it is some $5.3Bn higher than the last estimate. This decline in capex is anticipated to be split about two-thirds on building and structures expenditure (-$23.7Bn) and one-third on plant and equipment expenditure (-$13.8Bn). Again, consistent with current performance, the reduction in capexemanates primarily from the mining sector (-$19.9Bn), with Other Selected Industries (-$16.5Bn) and Manufacturing (-$1.2Bn) also lower relative to their FY16 spend.
Dwelling investment strengthened over the 12 months to June 2016 with 230,500 new residential dwellings approved across Australia, an increase of 2,700 over FY15 results. Non-housing residential construction has increased significantly – both in absolute terms and in a relative sense over the past 2 years. Units, apartments and townhouses represented 43% of total residential approvals in FY14, which has grown to just under 50% in FY16. Concerns regarding oversupply in this housing segment have started to emerge, with New South Wales and Victoria the two markets which have achieved above-average investment in recent years.
Non-residential building activity grew by 8.5% over FY16, with South Australia achieving year-on-year growth of nearly 47%. This spike is as the result of a combination of pent up demand and the freeing up of land for commercial purposes.
$0
$20,000
$40,000
$60,000
$80,000
$100,000
$120,000
$140,000
$160,000
$180,000
$ m
illio
ns
Chart 15Private new capital expenditureActual and expected, Original
Actual Capex Spent Expected Capex Spend 12 Months PriorSource: KPMG Economics, ABS
$0 $10,000 $20,000 $30,000 $40,000 $50,000 $60,000
Mining - Building andStructures
Mining - Plant and Equipment
Manufacturing - Building andStructures
Manufacturing - Plant andEquipment
Other Selected Industries -Building and Structures
Other Selected Industries -Plant and Equipment
Chart 16Private New Capital Expenditure by Type FY16 & FY17
FY16 (E) FY17 (F)
$ million
Source: KPMG Economics, ABS

15© 2016 KPMG, an Australian partnership and a member firm of the KPMG network of independent member firms affiliated with KPMG International Cooperative (“KPMG International”), a Swiss entity. All rights reserved. The KPMG name and logo are registered trademarks or trademarks of KPMG International. Liability limited by a scheme approved under Professional Standards Legislation.
LabourThe Australian labour market remains soft, and this is reflected in the recent disproportionate growth in casual employment relative to full time employment and the downward trend in the average hours worked.
The labour market has also been much weaker in the first half of 2016, with only 43,000 new jobs generated in the 6 months to June, and the number of full time employed persons declining by nearly 19,000. This weakness resulted in a rise in the number of unemployed persons by 7,800 in the 6 months to the end of June 2016, which had the effect of keeping the unemployment rate stable at 5.8%.
New South Wales achieved incremental employment of 117,000 jobs over FY16; but again it was a tale of two halves. The 6 months to end of December 2015 recorded 100,000 new jobs, while the first half of 2016 only 17,000 new jobs were created in the State. Consistent with this profile, only 24,800 new full time jobs were created in the State over the year; +72,800 between July and December 2015 and -48,000 between January and June 2016. Victoria on the other hand bucked this trend, recording 101,000 new jobs for the FY2016 year, made up of nearly 113,000 full time jobs and -12,000 part time jobs.
Total hours worked in all jobs grew by 1.7% over the year to June 2016; although there was a softness in the June quarter 2016 for the non-agricultural market sector which saw a decline of nearly 45 million hours worked compared to the first 3 months of the year.
In addition to a ‘sticky’ unemployment rate, under-employment continues to persist with a historically large proportion of employed persons working less than they would like. The underutilisation rate of employed persons is sitting at its highest level since the ABS survey began in 1978. However, there is a marked skew in these results, with people aged 15-24 years recording underutilization between 2 to 3 times higher than older workers. This also bears out in unemployment rates by age cohorts, where the unemployment rate for 15-24 year olds was 12.2% at May 2016, while 25-34 year olds was 5.4% and 35 years and older was about 4.1%.
63.5
64.0
64.5
65.0
65.5
66.0
3.0
3.5
4.0
4.5
5.0
5.5
6.0
6.5
Part
icip
atin
g pe
rson
s (%
)
Une
mpl
oyed
per
sons
(%)
Source: KPMG Economics, ABS
Chart 17Unemploymen and Participation Rates
Unemployment rate Participation rate
-2%
-1%
1%
2%
3%
4%
5%
Perc
enta
ge G
row
th
Source: KPMG Australia, ABS
Chart 18Second Quater Employment Growth By State

16© 2016 KPMG, an Australian partnership and a member firm of the KPMG network of independent member firms affiliated with KPMG International Cooperative (“KPMG International”), a Swiss entity. All rights reserved. The KPMG name and logo are registered trademarks or trademarks of KPMG International. Liability limited by a scheme approved under Professional Standards Legislation.
GovernmentState Government debt has been growing faster than either Commonwealth Government or Local Government debt.
While only the third largest quantum of debt, Victoria’s State and Local government sectors combined have recorded compound annual growth in net debt and unfunded superannuation liabilities of 14.2% since FY09. While this rate of growth is concerning, on a relative basis – both in terms of per capita debt and debt as a proportion of GSP - Victoria remains at the lower end of the spectrum compared to other jurisdictions.
From a capacity to pay perspective, Tasmania’s public sector debt position appears most worrying. At the end of FY15, net debt and unfunded superannuation liabilities of State and Local Government’s in Tasmania represented more than one-third of the state’s GSP (35.6%). This has steadily risen from about 27% in FY06. While on a per capita basis it does not appear excessive relative to other jurisdictions (~$17,700 per person), the Tasmanian economy is smaller and shallower which does curtail the state’s capacity to finance the interest charges and repay the debt, and maintain a minimum service standard to the community.
Since 2014 public sector wages have been increasing at notably stronger annual growth rates than private sector wages, with the latest data showing this gap is widening. Over the year to March 2016, private sector wages grew at 1.9% per annum – the lowest annual growth rate since data has been collected from 1998 – while the public sector recorded annual growth of 2.5%.
Over the year to December 2015, State and Local Governments (excluding the ACT Government) spent just over $117Bn on employee expenses and superannuation interest payments. When each jurisdictions expenditure is broadly ‘normalized’ by taking into consideration the resident population of each state, and the geographic size of each state, it appears Tasmania has the highest employee related expenses compared to any other jurisdiction, followed by Victoria and the Northern Territory.
0%
5%
10%
15%
20%
25%
30%
35%
40%
$-
$5,000
$10,000
$15,000
$20,000
$25,000
$30,000
NSW VIC QLD SA WA TAS NT
% o
f GS
P
Chart 19Public Sector Net Debt + Unfunded Superannuation Liabilitities, 30 June 2015
Debt per Capita Debt as % of GSPSource: KPMG Economics, ABS
NSW
VIC
QLD
SA
WA
TAS
NT0.0
1.0
2.0
3.0
4.0
5.0
6.0
7.0
8.0
9.0
0 5,000 10,000 15,000 20,000 25,000 30,000 35,000 40,000
Res
iden
t Po
pu
lati
on
$M
Chart 20Employee and nominal superannuation interest expenses, Year Ended December 2015
Source: KPMG Economics, ABS

17© 2016 KPMG, an Australian partnership and a member firm of the KPMG network of independent member firms affiliated with KPMG International Cooperative (“KPMG International”), a Swiss entity. All rights reserved. The KPMG name and logo are registered trademarks or trademarks of KPMG International. Liability limited by a scheme approved under Professional Standards Legislation.
Net exportsThe June Quarter 2016 saw the full production from the first trains of the APLNG and GLNG facilities in Gladstone; and the recommencement of the first train at Gorgon following a two-month shutdown. About 38 Mt of LNG was exported in FY16, generating some $17.2Bn in revenues – up from $16.9Bn in FY15. However, prices for LNG have fallen dramatically over the previously 12 months reflecting world oil prices and new supply from Australia and the United States enters the market. Spot prices fell around 11% to around US$6.50 per gigajoule in the March quarter 2016, and continued to fall in the June quarter to around US$4.86.
Iron ore exports continue to ramp up as the production phase of the recent investment cycle commences. The commencement of operations of the Roy Hill mine during the March quarter helped lift domestic production nearly 5% y/y. The domestic industry remains focused on reducing costs of production, with Fortescue Metals announcing it had realised further production savings during the March quarter, achieving a pre-interest, tax, and royalty cost of just US$14.79 per wet tonne. At the same time it had received an average price of US$45.94 per tonne.
Australia’s trade balance worsened in the 12 months to June 2016 through a combination of falling exports and rising imports. Despite an improvement in the exports of services, including nearly $1Bn more of education exports, imports continued to grow at a faster rate.
Tourism exports have grown by more than 9.0% each year over the past two years, and represent about 14% of total exports. There has been a surge in the number of international tourist visiting Australia, with total arrivals up by 715,000 to 7.85 million visitors during FY16. New Zealand remains our largest export tourist market (1.32 million visitors), although China is now a close second, with more than 1.15 million visitors.
0
5,000
10,000
15,000
20,000
25,000
30,000
35,000
$Mill
ions
, orig
inal
Axis Title
Chart 21Export by Category
Mining and metals Machine and Transport Services Rural Goods
40
45
50
55
60
65
70
75
80
85
0.400
0.500
0.600
0.700
0.800
0.900
1.000
1.100
1.200
Source: KPMG Economics, RBA
Chart 22Exchange rates
AUD/USD TWI

18© 2016 KPMG, an Australian partnership and a member firm of the KPMG network of independent member firms affiliated with KPMG International Cooperative (“KPMG International”), a Swiss entity. All rights reserved. The KPMG name and logo are registered trademarks or trademarks of KPMG International. Liability limited by a scheme approved under Professional Standards Legislation.
Australian forecasts
FY15 FY16 FY17 FY18 FY19 FY20 FY21
GDP (Real) 2.3% 2.9% 2.7% 3.0% 3.2% 3.5% 3.4%Private Consumption 2.7% 3.0% 2.9% 2.8% 2.9% 2.9% 3.1%Investment
Housing 6.7% 7.3% 2.5% -1.0% 4.4% 6.6% 7.9%Business -6.7% -11.6% -8.5% -3.1% 3.0% 4.5% 4.6%
GovernmentConsumption 1.3% 3.3% 2.3% 2.2% 2.1% 2.0% 1.9%Investment -5.4% -2.6% -1.0% -1.3% 0.0% 0.2% 1.2%
Total domestic demand 1.0% 1.3% 1.0% 1.6% 2.7% 3.1% 3.3%Export volumes 6.5% 7.2% 8.5% 8.1% 4.4% 4.1% 3.8%Import volumes 0.1% -0.5% 1.0% 2.2% 2.6% 3.0% 3.8%Inflation (1) 1.6% 1.2% 1.9% 2.3% 2.4% 2.7% 2.8%Real Personal Disposable Income 2.1% 2.0% 2.5% 2.7% 3.2% 3.3% 3.2%Unemployment, % (1) 6.1% 5.7% 5.7% 5.6% 5.3% 5.6% 5.8%Government Balance as % of GDP -1.9% -1.6% -0.9% -0.2% -0.2% -0.3% -0.4%Govt. debt as % of GDP 42.1% 44.0% 44.1% 42.8% 41.1% 39.2% 37.3%Current account as % of GDP -3.7% -5.3% -3.1% -1.6% -0.9% -0.8% -0.7%$A/US$ (1) 0.778 0.745 0.752 0.745 0.743 0.742 0.745 Terms of Trade (1) 69.5 65.8 64.8 64.9 64.7 64.5 64.1

Scenario
Global investors lose confidence in Europe

20© 2016 KPMG, an Australian partnership and a member firm of the KPMG network of independent member firms affiliated with KPMG International Cooperative (“KPMG International”), a Swiss entity. All rights reserved. The KPMG name and logo are registered trademarks or trademarks of KPMG International. Liability limited by a scheme approved under Professional Standards Legislation.
Global investors lose confidence with EuropeFawley and Neely (2013) from the St.Louis Federal Reserve
the financial crisis, sovereign debt crisis, and banking problems in Europe are intimately linked. The financial crisis created a recession that reduced tax revenues and growth and raised social spending, thus significantly exacerbating existing budget problems and increasing the risk associated with European debt.
The European Central Bank(ECB) has implemented a range of monetary policy initiatives, initially targeted at softening the financial distress within the European banking system, but has since broadened its focus to one of stimulating growth, promoting inflation and stablising the sovereign debt problem.
The ECB Balance Sheet has expanded significantly since the adoption of a more aggressive QE program since mid-2014, with total assets now equalling €3.28 trillion. The ECB adopted an Asset Purchase Program (APP), but the design of its program was quite different to other QE programs implemented in countries like the US and the UK. At the end of July 2016, the ECB held about €1,165Bn in private and public sector debt instruments. The ECB’s ‘unconventional monetary policy’ setting has now extended to the adoption of 0% for the Main Refinancing Operations rate and -0.40% for its deposit rate.
Despite all these actions, Europe remains in a state of economic malaise. Growth rates across most countries have been barely positive, and despite the array of fiscal and monetary policy actions that have been implemented to stimulate output, the results have been modest and mixed.
In this QEO we look at the scenario where the world investors loose confidence in the effectiveness of monetary policy within the EU. In essence we broadly follow the methodology and scenario outlined by the European Banking Authority’s to stress test banks within the EU.
-5%
-4%
-3%
-2%
-1%
0%
1%
2%
3%
4%
5%
An
nu
al %
Ch
ange
Chart 23Annual GDP Growth, US and EuropeActual and Baseline Forecasts
US Europe Source: KPMG Economics
0 €
500,000 €
1,000,000 €
1,500,000 €
2,000,000 €
2,500,000 €
3,000,000 €
3,500,000 €
Mill
ion
Eu
ros
Year ended December
Chart 24Size of ECB Consolidated Balance Sheet
Source: KPMG Economics, ECB

21© 2016 KPMG, an Australian partnership and a member firm of the KPMG network of independent member firms affiliated with KPMG International Cooperative (“KPMG International”), a Swiss entity. All rights reserved. The KPMG name and logo are registered trademarks or trademarks of KPMG International. Liability limited by a scheme approved under Professional Standards Legislation.
Global investors lose confidence with EuropeThe key elements of the scenario include:
• Investor risk assessments deteriorate such that the term premia for government bonds issued by EU member states increase by 200bp between 2017Q1 and 2018Q4, and then return to the baseline from 2019Q1 onwards;
• There is also a rise in the risk premia for investments within the corporate sector at a global level, again 200bp, but extended for three years from 2017Q1 to 2019Q4, returning to baseline from 2020Q1;
• Consumer wealth effects are impacted by falling house and equity prices. The variable path adopted for these two asset classes across all European jurisdictions was the average of the macroeconomic variable forecasts presented by the Bank of England 2015 Stress Test. The exogenous path is set for the period 201701 to 201904, with prices then returning to baseline forecasts (see Chart 25) ; and
• Government expenditures across all EU member countries decline by 1% per annum on a cumulative basis in order to reduce sovereign debt levels.
The projected impact of these shocks on the world economy is substantial. World GDP falls by about -1.5% compared to the baseline in 2018, but then gradually improves to stablise in the medium term at around baseline levels, only to fall away again as cumulative government expenditure cuts start to impact consumption activity.
However, the impact on the Eurozone is much more severe. EU GDP falls by -1.7% and -3.7% in the first two years of the shock scenario, but while output improves it never recovers to baseline forecasts. Inflation collapses as a consequence of the shocks, and generates deflation for a short period in 2019. The Euro depreciates against the USD by 2% immediately, causing imports to fall sharply (by over 9% in 2018), but despite this depreciation European exports also contract by just over 5% due to falling world demand.
-4.0%
-3.5%
-3.0%
-2.5%
-2.0%
-1.5%
-1.0%
-0.5%
0.0%
0.5%
1.0%
% d
iffe
ren
ce t
o b
asel
ine
fore
cast
s
Chart 26GDP Impact due to European Shock Scenario
World Europe USSource: KPMG Economics
-14.00%
-12.00%
-10.00%
-8.00%
-6.00%
-4.00%
-2.00%
0.00%
2.00%
4.00%
6.00%
% d
iffe
ren
ce t
o b
asel
ine
fore
cast
s
Chart 25Shock assumptions for house and equity prices
House Prices Equity PricesSource: KPMG Economics, NIESR

22© 2016 KPMG, an Australian partnership and a member firm of the KPMG network of independent member firms affiliated with KPMG International Cooperative (“KPMG International”), a Swiss entity. All rights reserved. The KPMG name and logo are registered trademarks or trademarks of KPMG International. Liability limited by a scheme approved under Professional Standards Legislation.
Global investors lose confidence with EuropeWhile most of the shocks are EU centric, the rise in investment premiaglobally places an immediate handbrake on investment activity across all jurisdictions. Business investment in the US is negatively impacted, falling between -3% and -6% over the 4 years to 2020 compared to baseline forecasts. While substantial, these declines are significantly smaller than those projected for private sector investment in the EU. In 2017, private sector investment in the EU is nearly -13% lower than baseline forecasts, which worsen to -25% and -19% in 2018 and 2019 respectively.
The scenario modelled produces an acute economic downturn for Europe. In comparison to the GFC, this scenario is less severe, but more prolonged. That is, EU GDP fell sharply -4.5% in 2009, and then again by -0.8% and -0.3% in 2012 and 2013 respectively.
Under the scenario modelled, EU GDP contracts -0.4% and -0.6% immediately after the shocks are implemented (ie: 2017 and 2018. This growth remains anaemic into the medium term, primarily because government expenditures are permanently cut and continue to reduce by 1% per annum in order to pay back sovereign debt. Interestingly, the debt-to-GDP ratio of most EU countries in fact worsens in the early years of the scenario as tax receipts decline as consequence of the lower economic activity, increasing government debt as an outcome. It takes about 9 years for most countries within the EU to turn their budget position’s around start to achieve debt reduction.
Australia is not immune to this downturn. GDP declines, falling at its worst by around -1.0% during FY19 an FY20. However, given the baseline interest rate setting interest rate setting, there is scope for the RBA to cushion ths shock by reducing the cash rate. In our simulation the cash rate is projected to be stepped down to about 0.50% in 2019 in response to the weaker global economic conditions. In contrast, the EU is required to maintain its current ‘lower bound’ 0% official rate until the end of 2020, while the US has to keep very loose monetary policy well into 2020.
-5%
-4%
-3%
-2%
-1%
0%
1%
2%
3%
4%
5%
% p
er a
nn
um
Chart 27EU GDP Growth - Baseline v. Shock scenario
Shock Scenario BaselineSource: KPMG Economics
-30%
-25%
-20%
-15%
-10%
-5%
0%
5%
%
Chart 28Private Sector Investment, Europe and USDifference between Shock and Baseline
Europe USSource: KPMG Economics
23© 2016 KPMG, an Australian partnership and a member firm of the KPMG network of independent member firms affiliated with KPMG International Cooperative (“KPMG International”), a Swiss entity. All rights reserved. The KPMG name and logo are registered trademarks or trademarks of KPMG International. Liability limited by a scheme approved under Professional Standards Legislation.
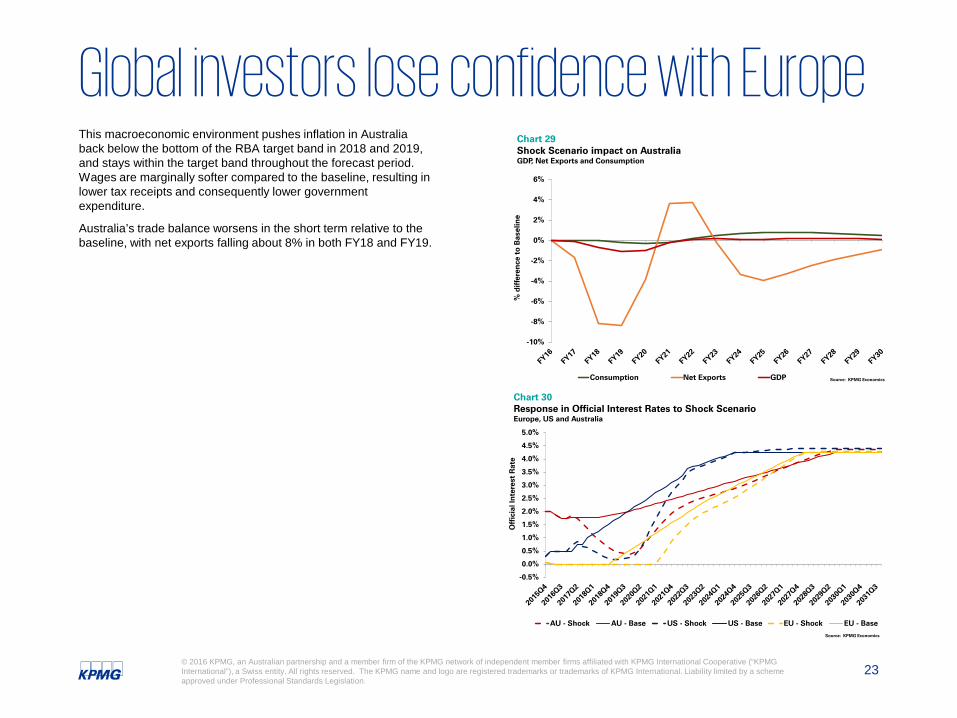
Global investors lose confidence with EuropeThis macroeconomic environment pushes inflation in Australia back below the bottom of the RBA target band in 2018 and 2019, and stays within the target band throughout the forecast period. Wages are marginally softer compared to the baseline, resulting in lower tax receipts and consequently lower government expenditure.
Australia’s trade balance worsens in the short term relative to the baseline, with net exports falling about 8% in both FY18 and FY19.
-0.5%
0.0%
0.5%
1.0%
1.5%
2.0%
2.5%
3.0%
3.5%
4.0%
4.5%
5.0%
Off
icia
l In
tere
st R
ate
Chart 30Response in Official Interest Rates to Shock ScenarioEurope, US and Australia
AU - Shock AU - Base US - Shock US - Base EU - Shock EU - Base
Source: KPMG Economics
-10%
-8%
-6%
-4%
-2%
0%
2%
4%
6%
% d
iffe
ren
ce t
o B
asel
ine
Chart 29Shock Scenario impact on Australia GDP, Net Exports and Consumption
Consumption Net Exports GDP Source: KPMG Economics

24© 2016 KPMG, an Australian partnership and a member firm of the KPMG network of independent member firms affiliated with KPMG International Cooperative (“KPMG International”), a Swiss entity. All rights reserved. The KPMG name and logo are registered trademarks or trademarks of KPMG International. Liability limited by a scheme approved under Professional Standards Legislation.
KPMG EconomicsKPMG does not make any statement in this report as to whether any forecasts or projections included in this report will be achieved, or whether the assumptions and data underlying any prospective economic forecasts or projections are accurate, complete or reasonable. KPMG does not warrant or guarantee the achievement of any such forecasts or projections. Any economic projections or forecasts in this report rely on economic inputs that are subject to unavoidable statistical variation. They also rely on economic parameters that are subject to unavoidable statistical variation. While all care has been taken to account for statistical variation, care should be taken whenever considering or using this information. There will usually be differences between forecast or projected and actual results, because events and circumstances frequently do not occur as expected or predicted, and those differences may be material. Any estimates or projections will only take into account information available to KPMG up to the date of this report and so findings may be affected by new information. Events may have occurred since this report was prepared, which may impact on it and its findings.
The information contained herein is of a general nature and is not intended to address the specific circumstances of any particular individual or entity
Contact us
Brendan RynneMelbourne Partner, Chief EconomistTel: 03 9288 [email protected]

kpmg.com.au kpmg.com.au/app
© 2016 KPMG, an Australian partnership and a member firm of the KPMG network of independent member firms affiliated with KPMG International Cooperative (“KPMG International”), a Swiss entity. All rights reserved.
The KPMG name and logo are registered trademarks or trademarks of KPMG International.
Liability limited by a scheme approved under Professional Standards Legislation.
The information contained in this document is of a general nature and is not intended to address the objectives, financial situation or needs of any particular individual or entity. It is provided for information purposes only and does not constitute, nor should it be regarded in any manner whatsoever, as advice and is not intended to influence a person in making a decision, including, if applicable, in relation to any financial product or an interest in a financial product. Although we endeavour to provide accurate and timely information, there can be no guarantee that such information is accurate as of the date it is received or that it will continue to be accurate in the future. No one should act on such information without appropriate professional advice after a thorough examination of the particular situation.
To the extent permissible by law, KPMG and its associated entities shall not be liable for any errors, omissions, defects or misrepresentations in the information or for any loss or damage suffered by persons who use or rely on such information (including for reasons of negligence, negligent misstatement or otherwise).