quarterly financial highlights (unaudited)
DESCRIPTION
TRANSCRIPT

Quarterly Financial Statements for the three months ended March 31, 2002
April 22, 2002
Quarterly Financial Highlights (unaudited)HOYA CORPORATION and Consolidated Subsidiaries
Performance for the fourth quarter (three months ended March 31, 2002 and 2001)( Unit:Millions of Yen, figures less than a million yen are omitted.)
Three months ended March 31, Variance (1)Results of Operations 2002 2001 (%)
Net sales ¥59,819 ¥60,578 -1.3Operating income 10,982 11,166 -1.6Ordinary income 11,709 12,376 -5.4Net income 4,938 364 -Net income per share(Yen) ¥42.53 ¥3.14
Notes : No changes have been made in accounting policy.
As of Mar. 31, As of Dec. 31, As of Mar. 31, (2)Financial Position 2002 2001 2001
Total assets ¥278,067 ¥268,749 ¥267,610 Shareholders' equity 219,180 213,285 195,333 Shareholders' equity ratio 78.8% 79.4% 73.0%Shareholders' equity per share (Yen) ¥1,887.50 ¥1,836.71 ¥1,682.10
Three months ended March 31,
(3)Conditions of Cash Flow 2002 2001Net cash provided by operating activities ¥17,497 ¥18,055Net cash used in investing activities -2,907 -6,181Net cash provided by (used in) financing activities -250 -8,979Cash and cash equivalents, end of period ¥66,321 ¥51,697
Contact:Naoji Ito, Manager of Investor Relations Tel:03(3952)1160 Fax:03(3952)0726 E-mail:[email protected]
Hoya Corporation does not guarantee the accuracy or completeness of the information herein. Unless otherwise stated estimates or forecasts aresolely those of our company and subject to change without notice. Hoya Corporation accepts no liability whatsoever for any direct or consequentialloss arising from any use of this report.

(1) General OverviewMillions of Yen
Results of Operations Three months ended Mar. 31, 2002Net sales ¥59,819Operating income ¥10,982Ordinary income ¥11,709Net income ¥4,938Net income per share(Yen) ¥42.53
1. Business Overview
In the 4th quarter of Fiscal 2001, a certain amount of optimism returned mainly in the United States andEurope to counter the worldwide IT (information technology) led depression. The operating ratios of thoseIndustries related to semiconductors and electronic components in Asia, mainly in South Korea andTaiwan, improved favorably. Recovery of the equivalent industries in Japan lagged behind and personalconsumption was still stagnant due to corporate restructuring and suchlike.In the currency market, the US dollar appreciated by 12.4%, the Euro by 7.2%, and the Thai baht by11.7%, all against the yen, respectively during the quarter under review.
In this business environment, quarterly sales of the Electro-Optics of the HOYA Group increasedfavorably in comparison with that of the 3rd quarter but decreased on a year-on-year basis. In the EyeCare segment, sales increased thanks to the enhanced added value of products. Consolidated sales duringthe quarter decreased 1.3% on a year-on-year basis to Yen 59,819 million.
1-1. Results of Operations
Quarterly Net Sales (Millions of Yen) and Average Exchange Rate (Yen/US$)
48,897 50,024 50,975 51,21456,323 59,372 60,529 60,578 60,321 58,037 57,088 59,819
108.10106.20
107.68103.28
133.50126.02
121.25122.80120.63118.78
111.22
111.68
0
10,000
20,000
30,000
40,000
50,000
60,000
70,000
Jun-99 Sep-99 Dec-99 Mar-00 Jun-00 Sep-00 Dec-00 Mar-01 Jun-01 Sep-01 Dec-01 Mar-0260.00
70.00
80.00
90.00
100.00
110.00
120.00
130.00
140.00

* : In the quarter ended March 31, 2001, the Company amortized goodwill for Yen 14,347 million andappropriated it into extra-ordinary loss.
During the quarter under review, sales and profits of the Electro-Optics segment decreased on a year-on-year basis in spite of signs of recovery from the IT-led depression, which offset the increase in salesand profits of the Eye Care segment brought about by expanded sales of high-value-added productsand improvements in profitability. As a result, on a consolidated basis, operating income and ordinaryincome during the quarter decreased 1.6% and 5.4% on a year-on-year basis respectively.
During the quarter under review, extraordinary losses such as additional expenditure for earlyretirement accounted for Yen 1,126 million while disposal of fixed assets cost a further Yen 1,165million. During the same period in the previous fiscal year, Yen 14,347 million for amortization ofgoodwill had been accounted for in the extraordinary losses as subsidiaries in the United States werereorganized as branches, and net income during the same quarter had been Yen 364 million. Netincome during the quarter under review, therefore, increased substantially on a year-on-year basis.
Quarterly Incomes (Millions of Yen)
8,06
8
8,38
1
9,31
3
8,92
6
9,88
4
11,9
87
12,0
90
11,1
16
11,6
13
11,2
34
10,0
68
10,9
82
8,46
0
8,48
6
9,13
7
9,40
1
10,1
46
12,9
67
12,6
95
12,3
76
12,1
24
10,5
73
11,3
68
11,7
09
4,82
8
4,76
2
5,87
4
5,25
1
6,23
3
7,45
8
7,80
5
364
7,46
8
6,19
2
5,14
2
4,93
8
0
2,000
4,000
6,000
8,000
10,000
12,000
14,000
Jun-99 Sep-99 Dec-99 Mar-00 Jun-00 Sep-00 Dec-00 Mar-01*
Jun-01 Sep-01 Dec-01 Mar-02
Operating Income Ordinary Income Net Income
Ratio of Net Sales by Business Segment - Quarterly Transition
0%10%20%30%40%50%60%70%80%90%
100%
Jun-99 Sep-99 Dec-99 Mar-00 Jun-00 Sep-00 Dec-00 Mar-01 Jun-01 Sep-01 Dec-01 Mar-02
Electro-Optics Photonics Vision Care Health Care Crystal Service
(2) Segment Overview
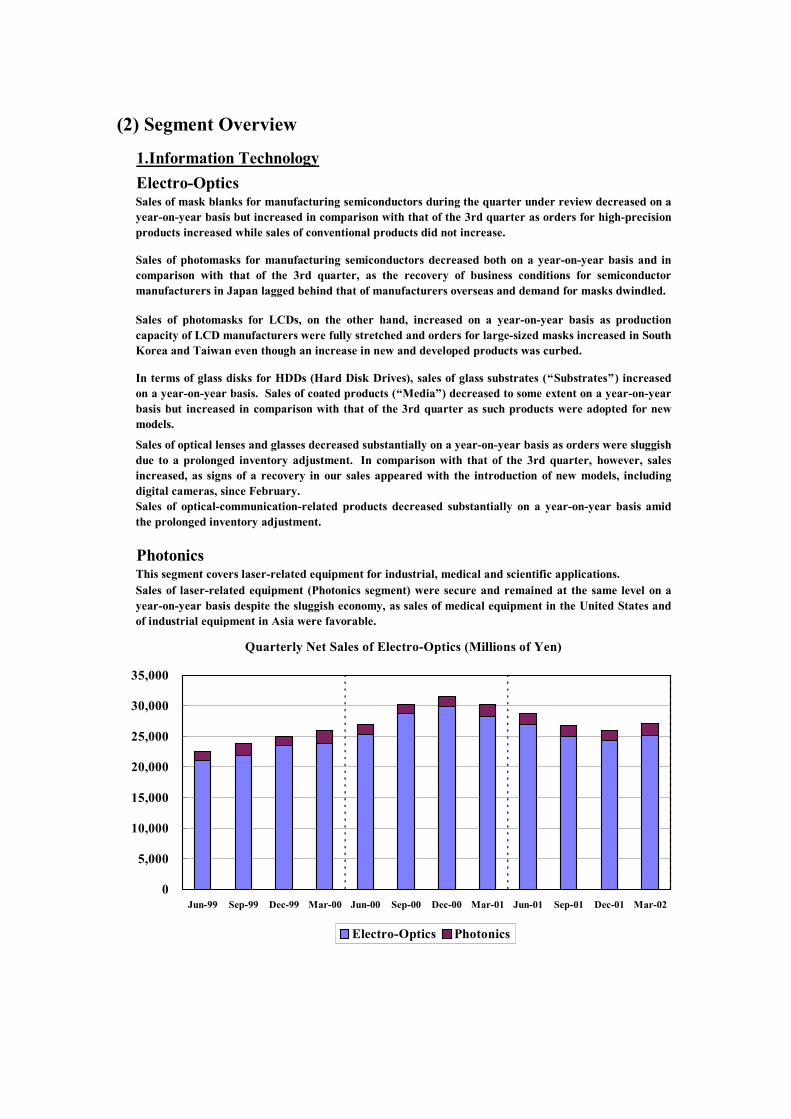
1.Information TechnologyElectro-OpticsSales of mask blanks for manufacturing semiconductors during the quarter under review decreased on ayear-on-year basis but increased in comparison with that of the 3rd quarter as orders for high-precisionproducts increased while sales of conventional products did not increase.
Sales of photomasks for manufacturing semiconductors decreased both on a year-on-year basis and incomparison with that of the 3rd quarter, as the recovery of business conditions for semiconductormanufacturers in Japan lagged behind that of manufacturers overseas and demand for masks dwindled.
Sales of photomasks for LCDs, on the other hand, increased on a year-on-year basis as productioncapacity of LCD manufacturers were fully stretched and orders for large-sized masks increased in SouthKorea and Taiwan even though an increase in new and developed products was curbed.
In terms of glass disks for HDDs (Hard Disk Drives), sales of glass substrates (“Substrates”) increasedon a year-on-year basis. Sales of coated products (“Media”) decreased to some extent on a year-on-yearbasis but increased in comparison with that of the 3rd quarter as such products were adopted for newmodels.
Sales of optical lenses and glasses decreased substantially on a year-on-year basis as orders were sluggishdue to a prolonged inventory adjustment. In comparison with that of the 3rd quarter, however, salesincreased, as signs of a recovery in our sales appeared with the introduction of new models, includingdigital cameras, since February.Sales of optical-communication-related products decreased substantially on a year-on-year basis amidthe prolonged inventory adjustment.
PhotonicsThis segment covers laser-related equipment for industrial, medical and scientific applications.Sales of laser-related equipment (Photonics segment) were secure and remained at the same level on ayear-on-year basis despite the sluggish economy, as sales of medical equipment in the United States andof industrial equipment in Asia were favorable.
Quarterly Net Sales of Electro-Optics (Millions of Yen)
0
5,000
10,000
15,000
20,000
25,000
30,000
35,000
Jun-99 Sep-99 Dec-99 Mar-00 Jun-00 Sep-00 Dec-00 Mar-01 Jun-01 Sep-01 Dec-01 Mar-02
Electro-Optics Photonics
2. Eye Care
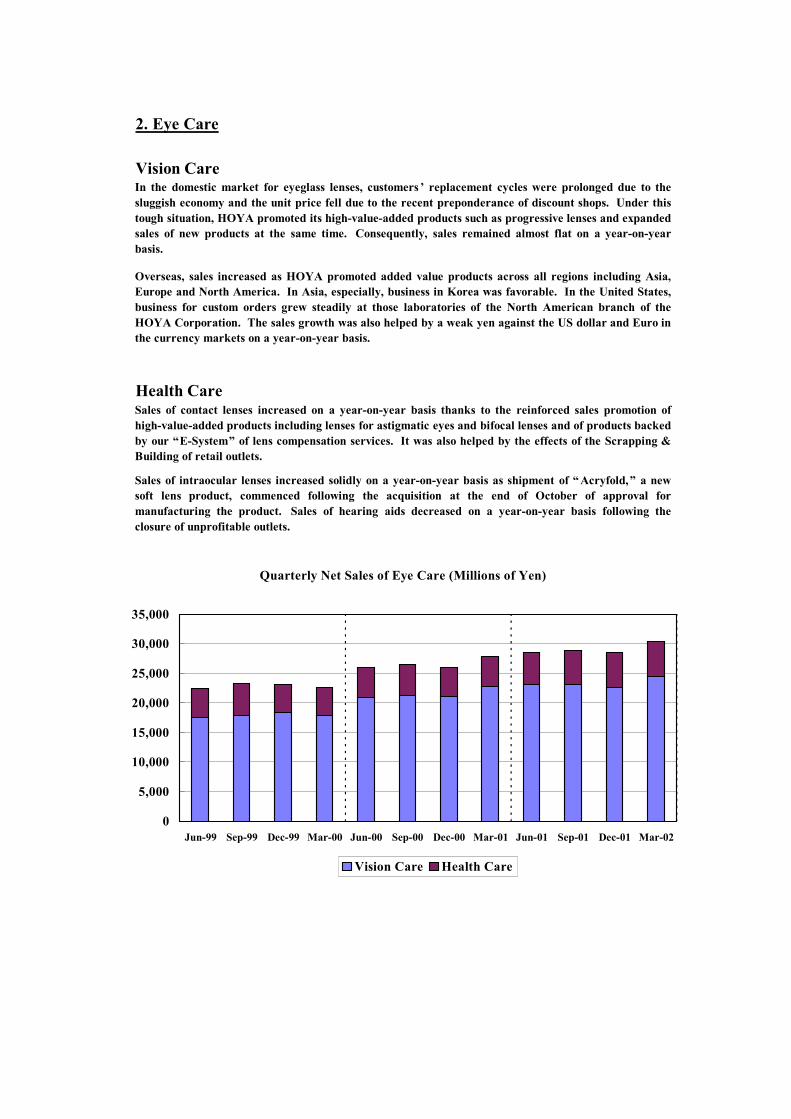
Vision CareIn the domestic market for eyeglass lenses, customers ’ replacement cycles were prolonged due to thesluggish economy and the unit price fell due to the recent preponderance of discount shops. Under thistough situation, HOYA promoted its high-value-added products such as progressive lenses and expandedsales of new products at the same time. Consequently, sales remained almost flat on a year-on-yearbasis.
Overseas, sales increased as HOYA promoted added value products across all regions including Asia,Europe and North America. In Asia, especially, business in Korea was favorable. In the United States,business for custom orders grew steadily at those laboratories of the North American branch of theHOYA Corporation. The sales growth was also helped by a weak yen against the US dollar and Euro inthe currency markets on a year-on-year basis.
Health CareSales of contact lenses increased on a year-on-year basis thanks to the reinforced sales promotion ofhigh-value-added products including lenses for astigmatic eyes and bifocal lenses and of products backedby our “E-System” of lens compensation services. It was also helped by the effects of the Scrapping &Building of retail outlets.
Sales of intraocular lenses increased solidly on a year-on-year basis as shipment of “ Acryfold,” a newsoft lens product, commenced following the acquisition at the end of October of approval formanufacturing the product. Sales of hearing aids decreased on a year-on-year basis following theclosure of unprofitable outlets.
Quarterly Net Sales of Eye Care (Millions of Yen)
0
5,000
10,000
15,000
20,000
25,000
30,000
35,000
Jun-99 Sep-99 Dec-99 Mar-00 Jun-00 Sep-00 Dec-00 Mar-01 Jun-01 Sep-01 Dec-01 Mar-02
Vision Care Health Care
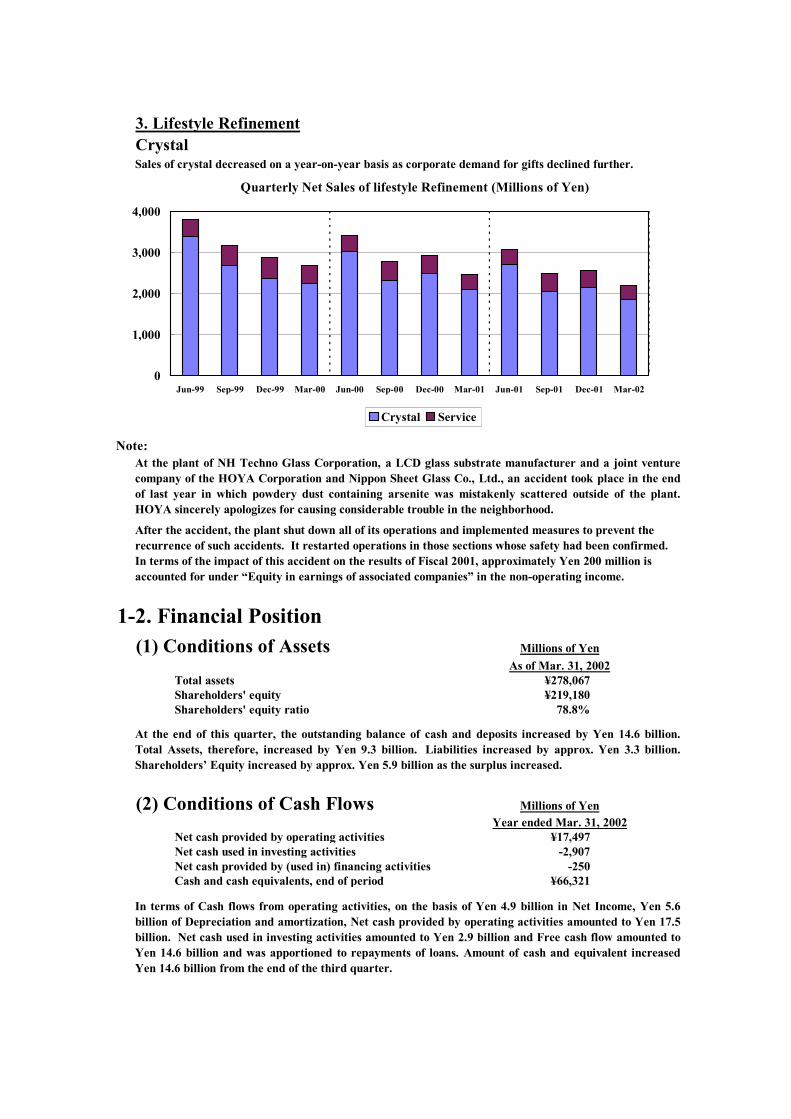
3. Lifestyle RefinementCrystal
Note:
1-2. Financial Position(1) Conditions of Assets Millions of Yen
As of Mar. 31, 2002Total assets ¥278,067Shareholders' equity ¥219,180Shareholders' equity ratio 78.8%
(2) Conditions of Cash Flows Millions of YenYear ended Mar. 31, 2002
Net cash provided by operating activities ¥17,497Net cash used in investing activities -2,907Net cash provided by (used in) financing activities -250Cash and cash equivalents, end of period ¥66,321
In terms of Cash flows from operating activities, on the basis of Yen 4.9 billion in Net Income, Yen 5.6billion of Depreciation and amortization, Net cash provided by operating activities amounted to Yen 17.5billion. Net cash used in investing activities amounted to Yen 2.9 billion and Free cash flow amounted toYen 14.6 billion and was apportioned to repayments of loans. Amount of cash and equivalent increasedYen 14.6 billion from the end of the third quarter.
Sales of crystal decreased on a year-on-year basis as corporate demand for gifts declined further.
Quarterly Net Sales of lifestyle Refinement (Millions of Yen)
At the plant of NH Techno Glass Corporation, a LCD glass substrate manufacturer and a joint venturecompany of the HOYA Corporation and Nippon Sheet Glass Co., Ltd., an accident took place in the endof last year in which powdery dust containing arsenite was mistakenly scattered outside of the plant.HOYA sincerely apologizes for causing considerable trouble in the neighborhood.
After the accident, the plant shut down all of its operations and implemented measures to prevent therecurrence of such accidents. It restarted operations in those sections whose safety had been confirmed.In terms of the impact of this accident on the results of Fiscal 2001, approximately Yen 200 million isaccounted for under “Equity in earnings of associated companies” in the non-operating income.
At the end of this quarter, the outstanding balance of cash and deposits increased by Yen 14.6 billion.Total Assets, therefore, increased by Yen 9.3 billion. Liabilities increased by approx. Yen 3.3 billion.Shareholders’ Equity increased by approx. Yen 5.9 billion as the surplus increased.
0
1,000
2,000
3,000
4,000
Jun-99 Sep-99 Dec-99 Mar-00 Jun-00 Sep-00 Dec-00 Mar-01 Jun-01 Sep-01 Dec-01 Mar-02
Crystal Service

3. Consolidated Financial Statements (unaudited)(1) Consolidated Balance Sheets Millions of Yen
HOYA CORPORATION and Consolidated Subsidiaries As of Variance(%) Mar.31,2001
ASSETSCurrent assets ¥169,587 ¥158,041 -6.8 ¥154,763
Cash and deposits 66,321 51,769 44,697Notes and accounts receivable - trades 59,095 59,073 55,143Marketable securities - - 7,000Inventories 35,595 37,085 36,506Deferred taxes 3,615 3,313 4,499Other current assets 6,352 7,920 7,975Allowance for doubtful receivables -1,392 -1,118 -1,059
Fixed asstes 108,051 110,200 -101.0 112,361 Tangible fixed assets 85,272 87,035 29.2 84,479
Buildings and structures 26,272 26,399 25,604Machinery and vehicles 37,447 36,944 38,041Lands 9,445 9,411 9,032Other tangible fixed assets 12,107 14,280 11,800
Intangible fixed assets 4,754 4,914 200.4 4,413 Investments and other assets 18,025 18,250 -72.7 23,468
Investment securities 5,816 6,427 9,741Long-term deferred taxes 7,411 7,025 8,654Other investments and other assets 6,378 6,461 8,429Allowance for doubtful receivables -1,580 -1,663 -3,357
Deferred charges 429 506 -487.6 485Total Assets 278,067 268,749 -99.8 267,610LIABILITIES AND SHAREHOLDERS' EQUITY Current liabilities 49,113 45,615 447.2 61,640
Notes and accounts payable - trades 19,918 20,550 23,610Short-term loan payable 3,378 3,487 4,630Income tax payable 4,867 1,977 9,679Accrued bonus 3,881 2,093 4,022Other current liabilities 17,066 17,505 19,697
Long-term liabilities 9,617 9,842 2.3 10,003Long-term loan payable 569 597 424Employees retirement benefits 7,311 7,815 8,360Directors retirement benefits 254 235 343Other long-term liabilities 1,482 1,194 875
Total Liabilities 58,731 55,458 -5.6 71,643Minority interest 155 5 -96.8 633Common stock 6,264 6,264 - 6,264Additional paid-in capital 15,898 15,898 - 15,898Retained earnings 202,255 197,250 -2.5 184,361Evaluation difference of investments securitis 110 126 - -Foreign currency statement translation adjustments -5,331 -6,249 - -10,675Treasury stock, at cost -16 -5 - 0Total Shareholders' Equity 219,180 213,285 -2.7 195,333Total ¥278,067 ¥268,749 -3.4 ¥267,610notes: Millions of Yen
Accumulated depreciation ¥141,431 ¥140,550 ¥128,850Sales of trade notes receivable for trust - - 10,356Guarantees of borrowings and lease obligations for customers ¥570 ¥450 ¥332Number of shares of treasury stock 2,059 708 30
Dec.31,2001Mar.31,2002

(2) Consolidated Statements of Income HOYA CORPORATION and Consolidated Subsidiaries(Three months ended Mar. 31, 2002 and 2001) Three months ended Mar. 31,
2002 2001 Value (%)Net sales ¥59,819 ¥60,578 ¥-759 -1.3 Cost of sales 33,820 34,907 -1,087 -3.1
Gross profit 25,999 25,671 328 1.3Selling, general and administrative expenses 15,016 14,504 512 3.5Operating income 10,982 11,166 -184 -1.6 Non-operating income 1,424 2,105 -681 -32.4
Interest income 141 166 -25Foreign exchange gains 408 680 -272Equity in earnings of associated companies 51 183 -132Others 824 1,076 -252
Non-operating expenses 697 896 -199 -22.2 Interest expense 163 274 -111Others 534 623 -89
Ordinary income 11,709 12,376 -667 -5.4 Extra-ordinary income 215 207 8 3.9
Gain on sales of investment securities 135 117 18Gain on sales of property, plant and equipment 45 89 -44Others 34 - 34
Extra-ordinary losses 3,778 15,676 -11,898 -75.9 Loss on sales of investment securities - 363 -363Additional retirement benefits paid to employees 1,126 9 1,117Loss on disposal of property, plant and equipment 1,165 226 939Expense on stoppage of operation 455 - 455Amortization of goodwill 469 14,347 -13,878Loss on evaluation of investment securities 563 731 -168
Income before income taxes and other items 8,145 -3,095 11,240 -363.2 Income taxes - Curent 3,613 2,241 1,372 61.2Income taxes - Deferred -409 -5,728 5,319 -92.9 Minority interests in net income 3 31 -28 -90.3 Net income ¥4,938 ¥364 ¥4,574 1,256.6Net income per share(Yen) ¥42.53 ¥3.14 ¥39.39
Notes:1.
2002 A 2002 B influencesNet sales ¥59,819 ¥58,279 ¥1,540Operating income 10,982 10,618 364 Ordinary income 11,709 11,343 366Net income ¥4,938 ¥4,794 ¥144
2. Average rates of major foreign currencies 2002 2001 Variance(%)US$ ¥133.50 ¥118.78 -12.4%Euro ¥115.65 ¥107.89 -7.2%Thail Baht ¥3.05 ¥2.73 -11.7%
3. Due to the reorganization, approx. Yen 14,347 million was amortized at once and appropriated into the extra-ordinary loss in the fourth quarter of the PREVIOUS fiscal year.
Millions of YenVariance
Influences of Exchange Currency ("2002 A" is the actual value of this period. "2002 B" is the nominal valueof this period which temporarily exchanged by the currency rate of the same period last year. unit : millions ofYen)
Three months ended Mar. 31,

(3) Consolidated Statements of Retained Earnings HOYA CORPORATION and Consolidated Subsidiaries(Three months ended Mar. 31, 2002 and 2001) Three months ended,
Mar.31, Mar.31, Dec.31,Items 2002 2001 variance 2001
Balance at the beginning of the period ¥197,250 ¥184,817 ¥12,433 ¥194,550Adjustment of retained earnings 65 - 65 462
for the merged non-consolidated subsidiaries - - - 462Others 65 - 65 -
Appropriations - 820 -820 2,9031. Cash dividends - - - 2,9032. - 820 -820 -
Net income 4,938 364 4,574 5,142Balance at the end of the period ¥202,255 ¥184,361 ¥17,894 ¥197,250
Three months ended,
Transfer of retained earnings of the subsidiaryreorganized to branch
Millions of Yen

(4) Consolidated Statements of Cash Flows (unaudited)HOYA CORPORATION and Consolidated Subsidiaries
(Three months ended Mar. 31, 2002 and 2001)2002 2001 variance
OPERATING ACTIVITIES:Net Income ¥4,938 ¥363 ¥4,575Adjustments for:
Depreciation and amortization 5,550 4,988 562Amortization of Goodwill 469 14,347 -13,878Reversal of accrued retirement benefits -491 -4 -487Provision for (Reversal of ) reserve for periodic repairs 29 -123 152Equity in earnings of associated companies -51 -183 132Minority interest in net income 2 30 -28Foreign exchange gain -110 -434 324Devaluation losses on non-current marketable securities 281 731 -450Gain on sales of property, plant and equipment and investment securities -181 -206 25Loss on disposal of property, plant and equipment and investment securities 1,166 589 577Other 114 156 -42Changes in assets and liabilities:
(Increase) decrease in notes and accounts receivable 395 -309 704(Increase) decrease in inventories 1,820 294 1,526(Increase) decrease in other current assets 420 336 84Increase (decrease) in notes and accounts payable -738 -2,056 1,318Increase (decrease) in income taxes payable 2,425 -3,458 5,883Increase (decrease) in other current liabilities 1,454 2,993 -1,539
Total adjustmentNet cash provided by operating activities 17,497 18,055 -558
INVESTING ACTIVITIES:Purchases of property, plant and equipment -3,788 -7,368 3,580Proceeds from sales of property, plant and equipment 124 173 -49Purchases of investment securities 0 - 0Proceeds from sales of investment securities 1,601 - 1,601Payments for purchases of affiliates (Thai) net of cash acquired -400 - -400Increase in investments and other assets -674 -945 271Decrease in investments and other assets 230 1,959 -1,729
Net cash used in investing activities -2,907 -6,181 3,274FINANCING ACTIVITIES:
Net increase (decrease) in short-term borrowings -153 -8,952 8,799Proceeds from long-term bank loans - 4 -4Repayment of long term bank loans -85 -28 -57Net (increase) decrease in treasury stock -11 0 -11Dividends paid - -3 3 Net cash used in financing activities -250 -8,979 8,729
NET INCREASE (DECREASE) IN CASH AND CASH EQUIVALENTS 14,339 2,894 11,445Effect of Exchange Rate Changes on Cash and Cash Equivalents 212 779 -567
CASH AND CASH EQUIVALENTS, BEGINNING OF THE YEAR 51,769 48,024 3,745CASH AND CASH EQUIVALENTS, END OF YEAR ¥66,321 ¥51,697 14,624
Three months ended Mar.31,Millions of Yen
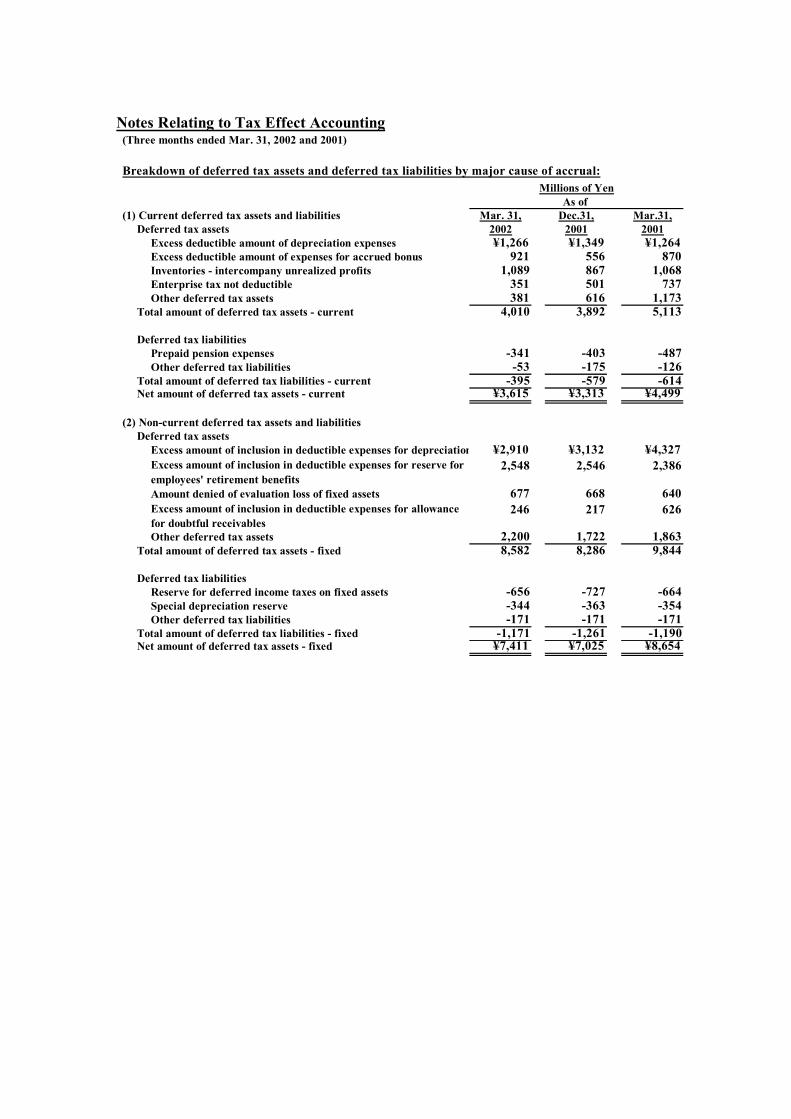
Notes Relating to Tax Effect Accounting(Three months ended Mar. 31, 2002 and 2001)
(1) Current deferred tax assets and liabilities Mar. 31, Dec.31, Mar.31,Deferred tax assets 2002 2001 2001
Excess deductible amount of depreciation expenses ¥1,266 ¥1,349 ¥1,264Excess deductible amount of expenses for accrued bonus 921 556 870Inventories - intercompany unrealized profits 1,089 867 1,068Enterprise tax not deductible 351 501 737Other deferred tax assets 381 616 1,173
Total amount of deferred tax assets - current 4,010 3,892 5,113
Deferred tax liabilitiesPrepaid pension expenses -341 -403 -487Other deferred tax liabilities -53 -175 -126
Total amount of deferred tax liabilities - current -395 -579 -614Net amount of deferred tax assets - current ¥3,615 ¥3,313 ¥4,499
(2) Non-current deferred tax assets and liabilitiesDeferred tax assets
Excess amount of inclusion in deductible expenses for depreciation ¥2,910 ¥3,132 ¥4,3272,548 2,546 2,386
Amount denied of evaluation loss of fixed assets 677 668 640246 217 626
Other deferred tax assets 2,200 1,722 1,863Total amount of deferred tax assets - fixed 8,582 8,286 9,844
Deferred tax liabilitiesReserve for deferred income taxes on fixed assets -656 -727 -664Special depreciation reserve -344 -363 -354Other deferred tax liabilities -171 -171 -171
Total amount of deferred tax liabilities - fixed -1,171 -1,261 -1,190Net amount of deferred tax assets - fixed ¥7,411 ¥7,025 ¥8,654
Breakdown of deferred tax assets and deferred tax liabilities by major cause of accrual:
Excess amount of inclusion in deductible expenses for reserve foremployees' retirement benefits
Excess amount of inclusion in deductible expenses for allowancefor doubtful receivables
As of Millions of Yen

Notes Relating to Employees' Retirement Benefits(Three months ended Mar. 31, 2002 and 2001)
1. Systems of employees' retirement benefits the Company adoptsLump-sum retirement benefit plan and multi-employer pension plan grants and of welfare pension
2. Details of liabilities for employees' retirement benefits Mar.31, Dec.31, Mar.31,(1) Breakdown of liabilities for employees' retirement benefits 2002 2001 2001
Liabilities for employees' retirement benefits ¥66,510 ¥55,255 ¥54,237Pension assets -37,126 -41,914 -40,107Accrued liabilities for employees' retirement benefits 29,383 13,341 14,130
2,745 2,797 2,955
Unrecognized prior service cost (decrease in liabilities) 1,696 1,737 1,858Unrecognized actuarial differences (increase in liabilities) -27,756 -11,537 -12,300Prepaid pension expenses 1,243 1,473 1,716Reserve for employees' retirement benefits ¥7,311 ¥7,815 ¥8,360
Dec.31,(2) Breakdown of expenses for employees' retirement benefits 2002 2001 2001
Service cost ¥419 ¥444 ¥416Interest expenses 470 452 469Expected return of investments -549 -642 -548Difference arising from the change in accounting standards -53 -53 -52Prior service cost -41 -82 -40Actuariaal differences 257 - 254
sub total 504 119 498Additional retirement benefits paid to employees 1,126 9 474Expenses for employees' retirement benefits ¥1,630 ¥128 ¥973
Dec.31,(3) Calculation basis of liabilities for employees' retirement benefits 2002 2001 2001
1. Discount rate 2.5% 3.5% 3.5%2. Expected rate of return of investments 3.5% 3.5% 3.5%3.
4.15 years 15 years 15 years
5. Number of years over which the prior service cost is amortized 12 years 12 years 12 years6. Number of years over which the actuarial differences are amortized 12 years 12 years 12 years
Number of years over which the difference arising from the changein accounting standards is amortized
Mar.31,
Mar.31,
Three months ended
Three months ended
pro rata division over the period
As of Millions of Yen
Unappropriated amount of the difference arising from the changein accounting standards
Method of periodical allocation of the estimated amount ofemployees' retirement benefits

3.Segment Information (unaudited)HOYA CORPORATION and Consolidated Subsidiaries
(1) Operations in Different Industries
Fourth quarter : for the three months ended March 31, 2002Millions of Yen
Electro-Optics
Photo-nics
VisionCare
HealthCare Crystal Service Total Elimin.
or corp.* Consolidated
Net sales: To outside customers ¥25,203 ¥1,956 ¥24,432 ¥6,030 ¥1,855 ¥345 ¥59,819 - ¥59,819 Intersegment 55 - 5 0 4 919 984 ¥-984 -
Total 25,258 1,956 24,437 6,030 1,858 1,263 60,803 -984 59,819Operating expenses 18,638 2,113 20,069 5,207 1,956 1,244 49,227 -391 48,837Operating income ¥6,619 ¥-157 ¥4,368 ¥823 ¥-97 ¥20 ¥11,576 ¥-593 ¥10,982Operating profit ratio 26.2% -8.0% 17.9% 13.6% -5.2% 1.6% 19.0% - 18.4%Assets ¥111,805 ¥4,515 ¥92,309 ¥15,815 ¥8,683 ¥3,444 ¥236,575 ¥41,492 ¥278,067Depreciation 3,884 37 1,321 142 128 8 5,520 30 5,550Capital Expenditures ¥2,866 ¥18 ¥1,293 ¥112 ¥8 - ¥4,296 ¥0 ¥4,297
*Elimi. or corp. : Elimination or corporate
Fourth quarter : for the three months ended March 31, 2001Millions of Yen
Electro-Optics
Photo-nics
VisionCare
HealthCare Crystal Service Total Elimin.
or corp.* Consolidated
Net sales: To outside customers ¥28,307 ¥1,943 ¥22,822 ¥5,037 ¥2,102 ¥368 ¥60,578 - ¥60,578 Intersegment 148 - 7 350 2 876 1,383 ¥-1,383 -
Total 28,455 1,943 22,829 5,387 2,104 1,244 61,961 -1,383 60,578Operating expenses 19,423 2,269 20,274 4,883 2,200 1,214 50,265 -853 49,411Operating income ¥9,032 ¥-325 ¥2,554 ¥504 ¥-97 ¥29 ¥11,697 ¥-530 ¥11,166Operating profit ratio 31.7% -16.7% 11.2% 9.4% -4.6% 2.3% 18.9% - 18.4%Assets ¥112,256 ¥4,941 ¥83,343 ¥13,366 ¥9,828 ¥4,906 ¥228,642 ¥38,968 ¥267,610Depreciation 2,744 94 1,823 129 150 15 4,955 32 4,988Capital Expenditures ¥4,045 ¥158 ¥2,243 ¥475 ¥81 - ¥7,002 ¥6 ¥7,008
*Elimi. or corp. : Elimination or corporateRef:
Differences between the three months of this year and the same period last yearMillions of Yen
Electro-Optics
Photo-nics
VisionCare
HealthCare Crystal Service Total Elimi. or
corp.*Consolidated
Net sales: To outside customers ¥-3,104 ¥13 ¥1,610 ¥993 ¥-247 ¥-23 ¥-759 - ¥-759 Variance(%) -11.0% 0.7% 7.1% 19.7% -11.8% -6.3% -1.3% - -1.3% Intersegment ¥-93 - ¥-2 ¥-350 ¥2 ¥43 ¥-399 ¥399 -
Total -3,197 13 1,608 643 -246 19 -1,158 399 -759Operating expenses -785 -156 -205 324 -244 30 -1,038 462 -574Operating income ¥-2,413 ¥168 ¥1,814 ¥319 ¥0 ¥-9 ¥-121 ¥-63 ¥-184 Variance(%) -26.7% - 71.0% 63.3% - -31.0% -1.0% - -1.6%Assets ¥-451 ¥-426 ¥8,966 ¥2,449 ¥-1,145 ¥-1,462 ¥7,933 ¥2,524 ¥10,457Depreciation 1,140 -57 -502 13 -22 -7 565 -2 562Capital Expenditures ¥-1,179 ¥-140 ¥-950 ¥-363 ¥-73 - ¥-2,706 ¥-6 ¥-2,711
*Elimi. or corp. : Eliminations or corporate

Notes:1. The Business Categories and Industries are as follows:
Business Category Industries Products and ServicesInformation Technology Electro-Optics Photomasks and Maskblanks for semiconductors,
Masks and Devices for liquid-crystal displays (LCDs)Glass disks for hard disk drives (HDDs), Optical Communication,Optical lenses, optical glasses, electronic glasses, etc.
Photonics Lazer equipments for industrial, research & laboratory, and medical purposes, etc.
Eye Care Vision Care Eyeglass lenses, eyeglass frames, ophthalmic equipments, etc. Health Care Contact lenses, intraocular lenses, hearing aids, etc.
Lifestyle Refinement Crystal Crystal glass productsService Design of information systems, placement of temporary staff, etc.
2.
2002 2001¥650 million ¥537 million
3.
2002 2001¥51,631 million ¥47,210 million
Corporate operating expenses mainly consist of the administration expenses of the headquarters of the Company andthe overseas regional holding companies in the two geographic areas, which are not allocated to each industrysegment. Corporate operating expenses for the three months ended Mar. 31, 2002 and 2001 are as follows:
Corporate assets mainly consist of cash, time deposits, marketable securities, investments securities andadministrative assets of the Company and the overseas regional holding companies in the two geographic areas.Corporate assets as of Mar. 31, 2002 and 2001 are as follows:

(2) Geographic SegmentsFourth quarter : for the three months ended March 31, 2002
Millions of Yen
JapanNorth
America Europe Asia Total Eliminationsor corporate Consolidated
Net sales: To outside customers ¥38,448 ¥10,358 ¥8,324 ¥2,690 ¥59,819 - ¥59,819 Intersegment 4,011 18 363 11,171 15,564 (¥15,564) -
Total 42,460 10,377 8,687 13,860 75,383 (15,564) 59,819Operating expenses 35,316 9,668 7,386 12,056 64,426 (15,589) 48,837Operating income ¥7,144 ¥708 ¥1,301 ¥1,803 ¥10,957 ¥25 ¥10,982Operating income ratio 16.8% 6.8% 15.0% 13.0% 14.5% - 18.4%Assets ¥138,962 ¥21,000 ¥30,356 ¥55,412 ¥245,730 ¥32,336 ¥278,067
Fourth quarter : for the three months ended March 31, 2001Millions of Yen
JapanNorth
America Europe Asia Total Eliminationsor corporate Consolidated
Net sales: To outside customers ¥42,450 ¥8,582 ¥7,273 ¥2,272 ¥60,578 - ¥60,578 Intersegment 4,240 155 298 9,610 14,304 (¥14,304) -
Total 46,690 8,738 7,571 11,882 74,881 (14,304) 60,578Operating expenses 38,323 8,437 6,528 10,351 63,641 (14,230) 49,411Operating income ¥8,367 ¥300 ¥1,042 ¥1,532 ¥11,240 (¥74) ¥11,166Operating income ratio 17.9% 3.4% 13.8% 12.9% 15.0% - 18.4%Assets ¥139,320 ¥21,072 ¥26,999 ¥48,143 ¥235,536 ¥32,074 ¥267,610
Ref: Differences between the three months of this year and the same period last year
Millions of Yen
JapanNorth
America Europe Asia Total Elimi. orcorp. Consolidated
Net sales: To outside customers ¥-4,002 ¥1,776 ¥1,051 ¥418 ¥-759 - ¥-759
Variance(%) -9.4% 20.7% 14.5% 18.4% -1.3% - -1.3% Intersegment ¥-229 ¥-137 ¥65 ¥1,561 ¥1,260 ¥-1,260 -
Total -4,230 1,639 1,116 1,978 502 -1,260 -759Operating expenses -3,007 1,231 858 1,705 785 -1,359 -574Operating income ¥-1,223 ¥408 ¥259 ¥271 ¥-283 ¥99 ¥-184
Variance(%) -14.6% 136.0% 24.9% 17.7% -2.5% - -1.6%Assets ¥-358 ¥-72 ¥3,357 ¥7,269 ¥10,194 ¥262 ¥10,457
Notes:1.
North America: United States of America and Canada Europe: Netherlands, Germany, United Kingdom, etc. Asia: Singapore, Republic of Korea, Taiwan, etc.
2.
2002 ¥569 million 2001 ¥483 million3.
2002 ¥48,341 million 2001 ¥44,663 million
The Company and its consolidated subsidiaries are summarized in four segments by geographic area based on the countrieswhere the Companies are located. The segments consisted of the following countries:
Corporate operating expenses mainly consist of the administration expenses of the headquarters of the Company and theoverseas regional holding companies in the two geographic areas. Corporate operating expenses for the three months endedMar. 31, 2002 and 2001 are as follows:
Corporate assets mainly consist of cash, time deposits, marketable securities, investments securities and administrative assetsof the Company and the overseas regional holding companies in the two geographic areas. Corporate assets as of Mar. 31,2002 and 2001 are as follows:
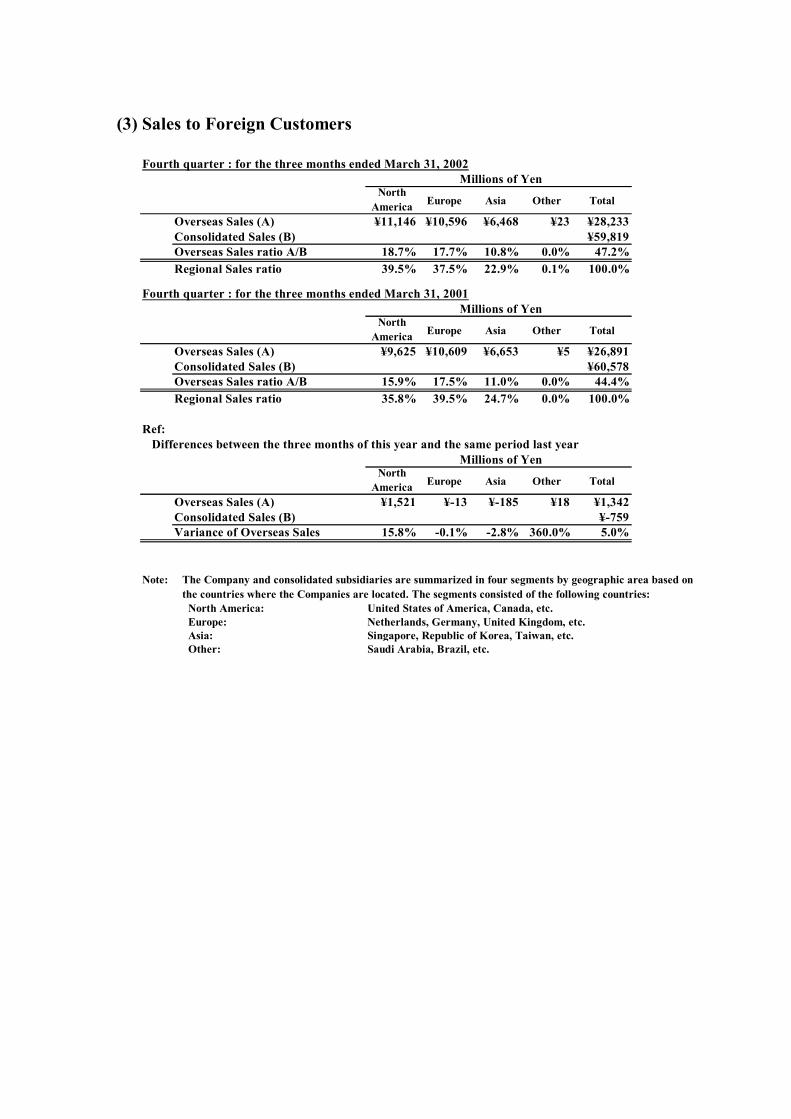
(3) Sales to Foreign Customers
Fourth quarter : for the three months ended March 31, 2002Millions of Yen
NorthAmerica Europe Asia Other Total
Overseas Sales (A) ¥11,146 ¥10,596 ¥6,468 ¥23 ¥28,233Consolidated Sales (B) ¥59,819Overseas Sales ratio A/B 18.7% 17.7% 10.8% 0.0% 47.2%Regional Sales ratio 39.5% 37.5% 22.9% 0.1% 100.0%
Fourth quarter : for the three months ended March 31, 2001Millions of Yen
NorthAmerica Europe Asia Other Total
Overseas Sales (A) ¥9,625 ¥10,609 ¥6,653 ¥5 ¥26,891Consolidated Sales (B) ¥60,578Overseas Sales ratio A/B 15.9% 17.5% 11.0% 0.0% 44.4%Regional Sales ratio 35.8% 39.5% 24.7% 0.0% 100.0%
Ref: Differences between the three months of this year and the same period last year
Millions of YenNorth
America Europe Asia Other Total
Overseas Sales (A) ¥1,521 ¥-13 ¥-185 ¥18 ¥1,342Consolidated Sales (B) ¥-759Variance of Overseas Sales 15.8% -0.1% -2.8% 360.0% 5.0%
Note:
North America: United States of America, Canada, etc. Europe: Netherlands, Germany, United Kingdom, etc. Asia: Singapore, Republic of Korea, Taiwan, etc. Other: Saudi Arabia, Brazil, etc.
The Company and consolidated subsidiaries are summarized in four segments by geographic area based onthe countries where the Companies are located. The segments consisted of the following countries:

4.Composition of Net Sales by Business Category HOYA CORPORATION and Consolidated Subsidiaries (Unaudited)(Three months ended March 31, 2002 and 2001)
Business Category Three months ended March 31, Three months ended Company 2002 2001 Value %Electro-Optics
Domestic ¥13,206 ( 52.4 ) ¥15,419 ( 54.5 ) ¥-2,213 -14.4 ¥13,769 ( 56.6 )Overseas 11,996 ( 47.6 ) 12,887 ( 45.5 ) -891 -6.9 10,544 ( 43.4 )
total 25,203 [ 42.1 ] 28,307 [ 46.7 ] -3,104 -11.0 24,313 [ 42.6 ]Photonics
Domestic 1,168 ( 59.7 ) 1,127 ( 58.0 ) 41 3.6 725 ( 43.9 )Overseas 788 ( 40.3 ) 815 ( 42.0 ) -27 -3.3 927 ( 56.1 )
total 1,956 [ 3.3 ] 1,943 [ 3.2 ] 13 0.7 1,652 [ 2.9 ]Information Technology
Domestic 14,373 ( 52.9 ) 16,547 ( 54.7 ) -2,174 -13.1 14,494 ( 55.8 )Overseas 12,785 ( 47.1 ) 13,703 ( 45.3 ) -918 -6.7 11,471 ( 44.2 )
total 27,158 [ 45.4 ] 30,250 [ 49.9 ] -3,092 -10.2 25,965 [ 45.5 ]
Vision Care Domestic 9,207 ( 37.7 ) 9,827 ( 43.1 ) -620 -6.3 9,300 ( 41.3 )Overseas 15,225 ( 62.3 ) 12,994 ( 56.9 ) 2,231 17.2 13,233 ( 58.7 )
total 24,432 [ 40.8 ] 22,822 [ 37.7 ] 1,610 7.1 22,534 [ 39.5 ]Health Care
Domestic 6,012 ( 99.7 ) 5,013 ( 99.5 ) 999 19.9 6,003 ( 99.6 )Overseas 18 ( 0.3 ) 24 ( 0.5 ) -6 -25.0 21 ( 0.4 )
total 6,030 [ 10.1 ] 5,037 [ 8.3 ] 993 19.7 6,025 [ 10.6 ]Eye Care
Domestic 15,219 ( 50.0 ) 14,840 ( 53.3 ) 379 2.6 15,304 ( 53.6 )Overseas 15,244 ( 50.0 ) 13,018 ( 46.7 ) 2,226 17.1 13,254 ( 46.4 )
total 30,462 [ 50.9 ] 27,858 [ 46.0 ] 2,604 9.3 28,559 [ 50.0 ]
CrystalDomestic 1,649 ( 88.9 ) 1,931 ( 91.9 ) -282 -14.6 1,980 ( 91.9 )Overseas 205 ( 11.1 ) 170 ( 8.1 ) 35 20.6 174 ( 8.1 )
total 1,855 [ 3.1 ] 2,102 [ 3.5 ] -247 -11.8 2,154 [ 3.8 ]Service
Domestic 344 ( 99.7 ) 368 ( 100.0 ) -24 -6.5 409 ( 100.0 )Overseas 0 ( 0.3 ) - ( - ) 0 - 0 ( - )
total 345 [ 0.6 ] 368 [ 0.6 ] -23 -6.3 409 [ 0.7 ]Lifestyle Refinement
Domestic 1,993 ( 90.6 ) 2,299 ( 93.1 ) -306 -13.3 2,390 ( 93.2 )Overseas 205 ( 9.4 ) 170 ( 6.9 ) 35 20.6 174 ( 6.8 )
total 2,199 [ 3.7 ] 2,470 [ 4.1 ] -271 -11.0 2,564 [ 4.5 ]
Total Net Sales Domestic 31,587 ( 52.8 ) 33,687 ( 55.6 ) ¥-2,100 -6.2 ¥32,187 ( 56.4 )Overseas 28,233 ( 47.2 ) 26,891 ( 44.4 ) 1,342 5.0 24,900 ( 43.6 )
Total 59,819 [ 100.0 ] 60,578 [ 100.0 ] ¥-759 -1.3 ¥57,088 [ 100.0 ]
Notes: 1.Figures of less than a million yen are omitted. 2.Figures in ( ) are percentages of business category sales. 3.Figures in [ ] are percentages of total net sales.
VarianceMillions of Yen [%]
Dec.31, 2001