quarterly financial report half-year ... - henkel.com€¦ · results of operations in the second...
TRANSCRIPT
April through June January through June
Q2 Quarterly financial report Half-year financial report
April through June 2018 January through June 2018

Contents
3 Overview second quarter 2018 4 Report second quarter 2018 11 Financial report first half year 2018 18 Outlook 20 Interim consolidated financial statements 26 Selected explanatory notes 38 Independent review report
39 Responsibility statement 40 Report of the Audit Committee
of the Supervisory Board 41 Multi-year summary 42 Contacts 42 Credits 43 Financial calendar
Henkel Group key financialsin million euros 1 Q2/2017 Q2/2018 +/– 1–6/2017 1–6/2018 +/–
Sales 5,098 5,143 0.9 % 10,162 9,978 – 1.8 %
Adhesive Technologies 2,370 2,432 2.6 % 4,665 4,702 0.8 %
Beauty Care 997 1,035 3.8 % 2,007 2,000 – 0.4 %
Laundry & Home Care 1,703 1,644 – 3.4 % 3,429 3,213 – 6.3 %
Operating profit (EBIT) 839 814 – 3.0 % 1,662 1,553 – 6.6 %
Adjusted 2 operating profit (EBIT) 909 926 1.8 % 1,763 1,768 0.3 %
Return on sales (EBIT) in percent 16.4 15.8 – 0.6 pp 16.4 15.6 – 0.8 pp
Adjusted 2 return on sales (EBIT) in percent 17.8 18.0 0.2 pp 17.4 17.7 0.3 pp
Net income 631 602 – 4.6 % 1,238 1,150 – 7.1 %
Attributable to non-controlling interests 7 4 – 42.9 % 17 9 – 47.1 %
Attributable to shareholders of Henkel AG & Co. KGaA 624 598 – 4.2 % 1,221 1,141 – 6.6 %
Earnings per preferred share in euros 1.44 1.38 – 4.2 % 2.82 2.63 – 6.7 %
Adjusted 2 earnings per preferred share in euros 1.55 1.58 1.9 % 2.96 3.01 1.7 %
Return on capital employed (ROCE) in percent 18.0 16.3 – 1.7 pp 17.8 15.9 – 1.9 pp
pp = percentage points1 Calculated on the basis of units of 1,000 euros; figures commercially rounded.2 Adjusted for one-time charges / gains and restructuring expenses.
Henkel Q2 Quarterly financial report / Half-year financial report 20182 Key financials / Contents

Key facts
Sales exceed 5.1 billion euros, driven by strong organic growth.
Continuous improvement in adjusted return on sales.
Service levels return to normal in our con-sumer goods businesses in North America.
Adjusted earnings per preferred share increase despite persisting negative foreign exchange effects.
1 Adjusted for one-time charges (32 million euros) / one-time gains (0 million euros) and restructuring expenses (80 million euros).
Overview second quarter 2018Key financials
€ 5,143 msales
€ 814 moperating profit (EBIT)
+ 3.5 % organic sales growth+ 5.2 % Adhesive Technologies+ 0.4 % Beauty Care+ 2.9 % Laundry & Home Care
€ 1.38earnings per preferred share (EPS)
€ 598 mnet income attributable to shareholders of Henkel AG & Co. KGaA
€ 926 m / + 1.8 %adjusted 1 operating profit (EBIT) / year-on-year increase
€ 1.58 / + 1.9 %adjusted 1 earnings per preferred share (EPS) / year-on-year increase
18.0 %adjusted 1 return on sales (EBIT):up 0.2 percentage points19.0 % Adhesive Technologies18.1 % Beauty Care17.9 % Laundry & Home Care
6.3 % net working capital in percent of sales
Henkel Q2 Quarterly financial report / Half-year financial report 2018 3 Overview second quarter 2018
Results of operations
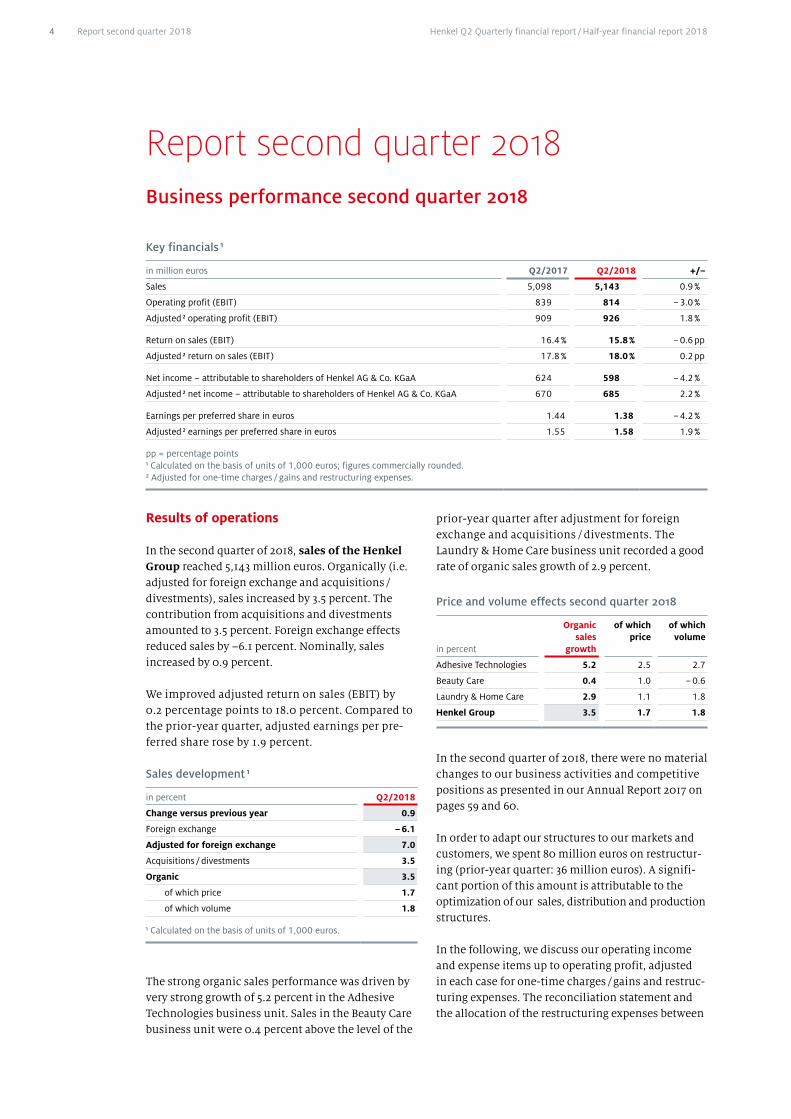
In the second quarter of 2018, sales of the Henkel Group reached 5,143 million euros. Organically (i.e. adjusted for foreign exchange and acquisitions / divestments), sales increased by 3.5 percent. The contribution from acquisitions and divestments amounted to 3.5 percent. Foreign exchange effects reduced sales by –6.1 percent. Nominally, sales increased by 0.9 percent.
We improved adjusted return on sales (EBIT) by 0.2 percentage points to 18.0 percent. Compared to the prior-year quarter, adjusted earnings per pre-ferred share rose by 1.9 percent.
Sales development 1
in percent Q2/2018
Change versus previous year 0.9
Foreign exchange – 6.1
Adjusted for foreign exchange 7.0
Acquisitions / divestments 3.5
Organic 3.5
of which price 1.7
of which volume 1.8
1 Calculated on the basis of units of 1,000 euros.
The strong organic sales performance was driven by very strong growth of 5.2 percent in the Adhesive Technologies business unit. Sales in the Beauty Care business unit were 0.4 percent above the level of the
prior-year quarter after adjustment for foreign exchange and acquisitions / divestments. The Laundry & Home Care business unit recorded a good rate of organic sales growth of 2.9 percent.
Price and volume effects second quarter 2018
in percent
Organic sales
growth
of which price
of which volume
Adhesive Technologies 5.2 2.5 2.7
Beauty Care 0.4 1.0 – 0.6
Laundry & Home Care 2.9 1.1 1.8
Henkel Group 3.5 1.7 1.8
In the second quarter of 2018, there were no material changes to our business activities and competitive positions as presented in our Annual Report 2017 on pages 59 and 60.
In order to adapt our structures to our markets and customers, we spent 80 million euros on restructur-ing (prior-year quarter: 36 million euros). A signifi-cant portion of this amount is attributable to the optimization of our sales, distribution and production structures.
In the following, we discuss our operating income and expense items up to operating profit, adjusted in each case for one-time charges / gains and restruc-turing expenses. The reconciliation statement and the allocation of the restructuring expenses between
Report second quarter 2018
Key financials 1
in million euros Q2/2017 Q2/2018 +/–
Sales 5,098 5,143 0.9 %
Operating profit (EBIT) 839 814 – 3.0 %
Adjusted 2 operating profit (EBIT) 909 926 1.8 %
Return on sales (EBIT) 16.4 % 15.8 % – 0.6 pp
Adjusted 2 return on sales (EBIT) 17.8 % 18.0 % 0.2 pp
Net income – attributable to shareholders of Henkel AG & Co. KGaA 624 598 – 4.2 %
Adjusted 2 net income – attributable to shareholders of Henkel AG & Co. KGaA 670 685 2.2 %
Earnings per preferred share in euros 1.44 1.38 – 4.2 %
Adjusted 2 earnings per preferred share in euros 1.55 1.58 1.9 %
pp = percentage points 1 Calculated on the basis of units of 1,000 euros; figures commercially rounded.2 Adjusted for one-time charges / gains and restructuring expenses.
Business performance second quarter 2018
Henkel Q2 Quarterly financial report / Half-year financial report 20184 Report second quarter 2018
the various expense items of the consolidated state-ment of income can be found on page 29.
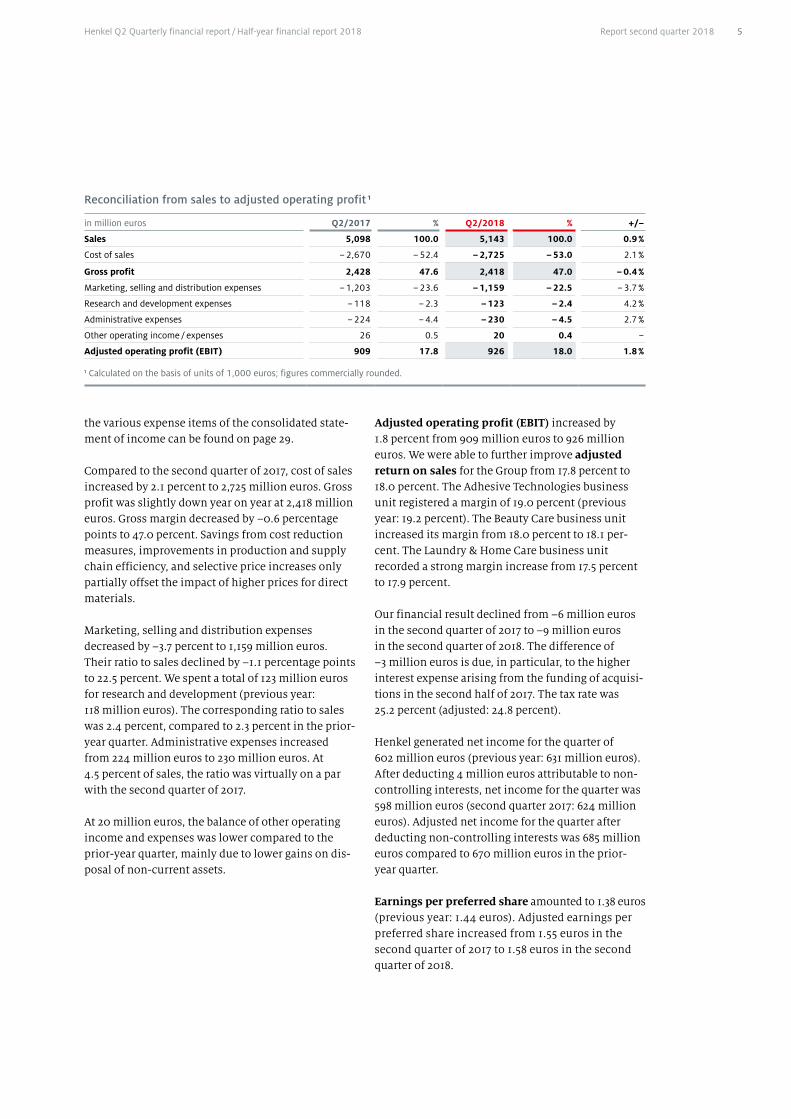
Compared to the second quarter of 2017, cost of sales increased by 2.1 percent to 2,725 million euros. Gross profit was slightly down year on year at 2,418 million euros. Gross margin decreased by –0.6 percentage points to 47.0 percent. Savings from cost reduction measures, improvements in production and supply chain efficiency, and selective price increases only partially offset the impact of higher prices for direct materials.
Marketing, selling and distribution expenses decreased by –3.7 percent to 1,159 million euros. Their ratio to sales declined by –1.1 percentage points to 22.5 percent. We spent a total of 123 million euros for research and development (previous year: 118 million euros). The corresponding ratio to sales was 2.4 percent, compared to 2.3 percent in the prior-year quarter. Administrative expenses increased from 224 million euros to 230 million euros. At 4.5 percent of sales, the ratio was virtually on a par with the second quarter of 2017.
At 20 million euros, the balance of other operating income and expenses was lower compared to the prior-year quarter, mainly due to lower gains on dis-posal of non-current assets.
Adjusted operating profit (EBIT) increased by 1.8 percent from 909 million euros to 926 million euros. We were able to further improve adjusted return on sales for the Group from 17.8 percent to 18.0 percent. The Adhesive Technologies business unit registered a margin of 19.0 percent (previous year: 19.2 percent). The Beauty Care business unit increased its margin from 18.0 percent to 18.1 per-cent. The Laundry & Home Care business unit recorded a strong margin increase from 17.5 percent to 17.9 percent.
Our financial result declined from –6 million euros in the second quarter of 2017 to –9 million euros in the second quarter of 2018. The difference of –3 million euros is due, in particular, to the higher interest expense arising from the funding of acquisi-tions in the second half of 2017. The tax rate was 25.2 percent (adjusted: 24.8 percent).
Henkel generated net income for the quarter of 602 million euros (previous year: 631 million euros). After deducting 4 million euros attributable to non-controlling interests, net income for the quarter was 598 million euros (second quarter 2017: 624 million euros). Adjusted net income for the quarter after deducting non-controlling interests was 685 million euros compared to 670 million euros in the prior-year quarter.
Earnings per preferred share amounted to 1.38 euros (previous year: 1.44 euros). Adjusted earnings per preferred share increased from 1.55 euros in the second quarter of 2017 to 1.58 euros in the second quarter of 2018.
Reconciliation from sales to adjusted operating profit 1
in million euros Q2/2017 % Q2/2018 % +/–
Sales 5,098 100.0 5,143 100.0 0.9 %
Cost of sales – 2,670 – 52.4 – 2,725 – 53.0 2.1 %
Gross profit 2,428 47.6 2,418 47.0 – 0.4 %
Marketing, selling and distribution expenses – 1,203 – 23.6 – 1,159 – 22.5 – 3.7 %
Research and development expenses – 118 – 2.3 – 123 – 2.4 4.2 %
Administrative expenses – 224 – 4.4 – 230 – 4.5 2.7 %
Other operating income / expenses 26 0.5 20 0.4 –
Adjusted operating profit (EBIT) 909 17.8 926 18.0 1.8 %
1 Calculated on the basis of units of 1,000 euros; figures commercially rounded.
Henkel Q2 Quarterly financial report / Half-year financial report 2018 5 Report second quarter 2018

Key figures by region 1 second quarter 2018
in million euros
Western Europe
Eastern Europe
Africa /Middle
East
North America
Latin America
Asia- Pacific
Corporate 2 Henkel Group
Sales April–June 2018 1,567 732 310 1,348 299 855 32 5,143
Sales April–June 2017 1,541 749 334 1,310 291 845 29 5,098
Change from previous year 1.7 % – 2.2 % – 7.1 % 2.9 % 2.8 % 1.1 % – 0.9 %
Adjusted for foreign exchange 2.1 % 8.2 % 5.5 % 11.4 % 18.2 % 4.5 % – 7.0 %
Organic 0.1 % 8.2 % 4.7 % 4.9 % 6.3 % 1.9 % – 3.5 %
Proportion of Henkel sales April–June 2018 30 % 14 % 6 % 26 % 6 % 17 % 1 % 100 %
Proportion of Henkel sales April–June 2017 30 % 15 % 6 % 26 % 6 % 16 % 1 % 100 %
Operating profit (EBIT) April–June 2018 396 76 5 173 37 149 – 22 814
Operating profit (EBIT) April–June 2017 398 82 20 181 30 154 – 27 839
Change from previous year – 0.5 % – 7.1 % – 76.4 % – 4.9 % 20.9 % – 3.1 % – – 3.0 %
Adjusted for foreign exchange – 0.4 % 7.9 % – 72.8 % 5.2 % 42.0 % 2.0 % – 1.3 %
Return on sales (EBIT) April–June 2018 25.3 % 10.4 % 1.6 % 12.8 % 12.3 % 17.4 % – 15.8 %
Return on sales (EBIT) April–June 2017 25.8 % 10.9 % 6.1 % 13.8 % 10.5 % 18.2 % – 16.4 %
1 Calculated on the basis of units of 1,000 euros; figures commercially rounded.2 Corporate = sales and services not assignable to the individual regions and business units.
Performance by region
In the following, we comment on our results in the second quarter 2018:
In a highly competitive market environment, organic sales growth in the Western Europe region was flat at 0.1 percent. Sales in Italy and the United Kingdom declined, whereas the trend in Germany and France was positive.
Operating profit in the region declined by –0.4 per-cent adjusted for foreign exchange. Return on sales in the region decreased by –0.5 percentage points to 25.3 percent.
In the Eastern Europe region, we increased sales organically by 8.2 percent. The main contribution to this performance came from our business in Turkey.
Our operating profit in the region improved by 7.9 percent adjusted for foreign exchange. Return on sales in the region decreased by –0.5 percentage points to 10.4 percent.
In the Africa / Middle East region, we increased sales organically by 4.7 percent.
Operating profit adjusted for foreign exchange decreased by –72.8 percent in the region, mainly as a result of higher restructuring expenses. Return on sales decreased by –4.5 percentage points to 1.6 per-cent.
The service levels in our consumer goods businesses in North America returned to normal in the course of the second quarter. Sales in the region increased organically by 4.9 percent.
Operating profit in the region improved by 5.2 per-cent adjusted for foreign exchange. Return on sales in the region decreased by –1.0 percentage points to 12.8 percent.
Henkel Q2 Quarterly financial report / Half-year financial report 20186 Report second quarter 2018
Sales in the Latin America region increased organi-cally by 6.3 percent. Business performance in Mexico was the main contributor to this improvement.
We were able to increase operating profit by 42.0 per-cent adjusted for foreign exchange. Return on sales in the region improved by 1.8 percentage points to 12.3 percent.
Sales in the Asia-Pacific region grew organically by 1.9 percent. This organic growth resulted primarily from our business performance in China and India.
We increased operating profit by 2.0 percent adjusted for foreign exchange. Return on sales decreased year on year by –0.8 percentage points to 17.4 percent.
The emerging markets of Eastern Europe, Africa /Middle East, Latin America and Asia (excluding Japan) again made an above-average contribution to the organic growth of the Group with an increase of 5.4 percent. Nominally, sales decreased by –0.8 per-cent to 2,056 million euros due to foreign exchange effects. At 40 percent, the share of Group sales from emerging markets was slightly below the level of the second quarter of 2017.
Henkel Q2 Quarterly financial report / Half-year financial report 2018 7Report second quarter 2018
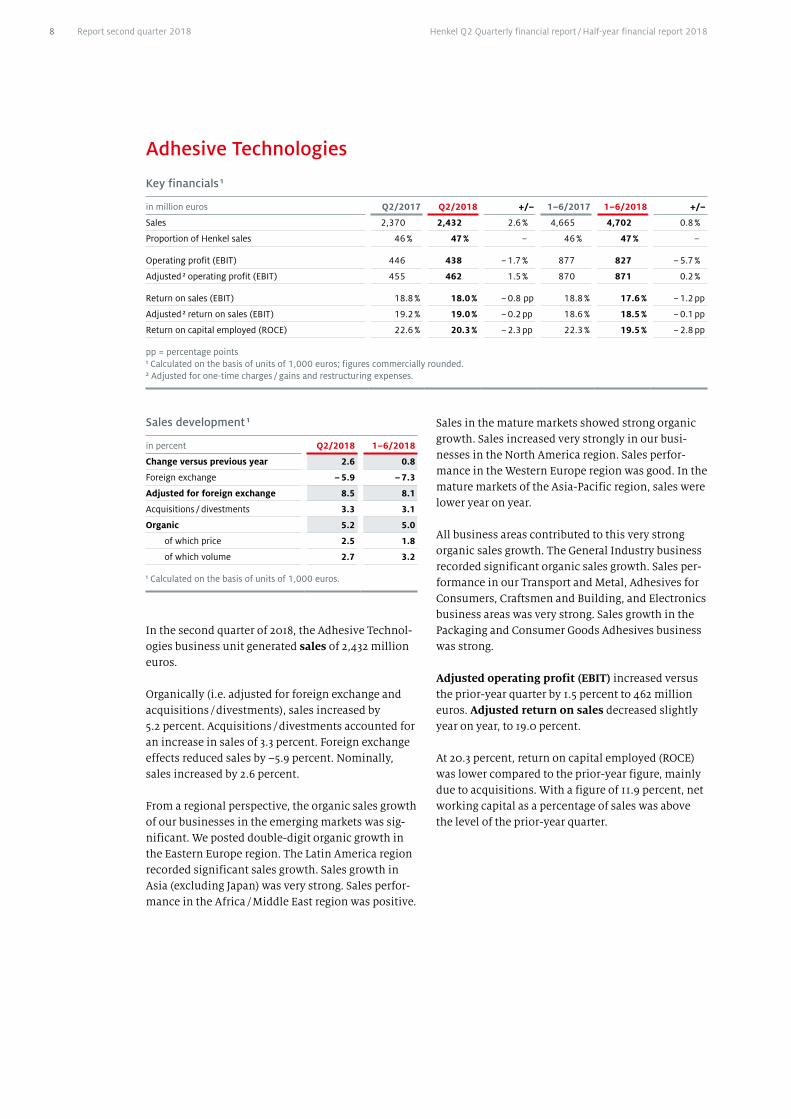
In the second quarter of 2018, the Adhesive Technol-ogies business unit generated sales of 2,432 million euros.
Organically (i.e. adjusted for foreign exchange and acquisitions / divestments), sales increased by 5.2 percent. Acquisitions / divestments accounted for an increase in sales of 3.3 percent. Foreign exchange effects reduced sales by –5.9 percent. Nominally, sales increased by 2.6 percent.
From a regional perspective, the organic sales growth of our businesses in the emerging markets was sig-nificant. We posted double-digit organic growth in the Eastern Europe region. The Latin America region recorded significant sales growth. Sales growth in Asia (excluding Japan) was very strong. Sales perfor-mance in the Africa / Middle East region was positive.
Adhesive Technologies
Key financials 1
in million euros Q2/2017 Q2/2018 +/– 1–6/2017 1–6/2018 +/–
Sales 2,370 2,432 2.6 % 4,665 4,702 0.8 %
Proportion of Henkel sales 46 % 47 % – 46 % 47 % –
Operating profit (EBIT) 446 438 – 1.7 % 877 827 – 5.7 %
Adjusted 2 operating profit (EBIT) 455 462 1.5 % 870 871 0.2 %
Return on sales (EBIT) 18.8 % 18.0 % – 0.8 pp 18.8 % 17.6 % – 1.2 pp
Adjusted 2 return on sales (EBIT) 19.2 % 19.0 % – 0.2 pp 18.6 % 18.5 % – 0.1 pp
Return on capital employed (ROCE) 22.6 % 20.3 % – 2.3 pp 22.3 % 19.5 % – 2.8 pp
pp = percentage points 1 Calculated on the basis of units of 1,000 euros; figures commercially rounded.2 Adjusted for one-time charges / gains and restructuring expenses.
Sales development 1
in percent Q2/2018 1–6/2018
Change versus previous year 2.6 0.8
Foreign exchange – 5.9 – 7.3
Adjusted for foreign exchange 8.5 8.1
Acquisitions / divestments 3.3 3.1
Organic 5.2 5.0
of which price 2.5 1.8
of which volume 2.7 3.2
1 Calculated on the basis of units of 1,000 euros.
Sales in the mature markets showed strong organic growth. Sales increased very strongly in our busi-nesses in the North America region. Sales perfor-mance in the Western Europe region was good. In the mature markets of the Asia-Pacific region, sales were lower year on year.
All business areas contributed to this very strong organic sales growth. The General Industry business recorded significant organic sales growth. Sales per-formance in our Transport and Metal, Adhesives for Consumers, Craftsmen and Building, and Electronics business areas was very strong. Sales growth in the Packaging and Consumer Goods Adhesives business was strong.
Adjusted operating profit (EBIT) increased versus the prior-year quarter by 1.5 percent to 462 million euros. Adjusted return on sales decreased slightly year on year, to 19.0 percent.
At 20.3 percent, return on capital employed (ROCE) was lower compared to the prior-year figure, mainly due to acquisitions. With a figure of 11.9 percent, net working capital as a percentage of sales was above the level of the prior-year quarter.
Henkel Q2 Quarterly financial report / Half-year financial report 20188 Report second quarter 2018

In the second quarter of 2018, the Beauty Care busi-ness unit generated sales of 1,035 million euros.
Organically (i.e. adjusted for foreign exchange and acquisitions / divestments), sales increased by 0.4 percent. Acquisitions / divestments accounted for an increase in sales of 9.3 percent. Foreign exchange effects reduced sales by –5.9 percent. Nominally, sales increased by 3.8 percent.
From a regional perspective, the organic growth rate of our business in the emerging markets was positive versus the level of the second quarter of 2017. In par-ticular, the Africa / Middle East region contributed very strong sales growth to the positive result. Sales growth in the Eastern Europe region was good. Organically, sales in the Latin America region decreased slightly. Sales performance in Asia (excluding Japan) was below the prior-year quarter.
Beauty Care
Key financials 1
in million euros Q2/2017 Q2/2018 +/– 1–6/2017 1–6/2018 +/–
Sales 997 1,035 3.8 % 2,007 2,000 – 0.4 %
Proportion of Henkel sales 20 % 20 % – 20 % 20 % –
Operating profit (EBIT) 155 151 – 2.4 % 304 303 – 0.2 %
Adjusted 2 operating profit (EBIT) 180 187 4.4 % 348 349 0.0 %
Return on sales (EBIT) 15.5 % 14.6 % – 0.9 pp 15.1 % 15.2 % 0.1 pp
Adjusted 2 return on sales (EBIT) 18.0 % 18.1 % 0.1 pp 17.4 % 17.4 % 0.0 pp
Return on capital employed (ROCE) 21.0 % 15.4 % – 5.6 pp 20.5 % 16.1 % – 4.4 pp
pp = percentage points 1 Calculated on the basis of units of 1,000 euros; figures commercially rounded.2 Adjusted for one-time charges / gains and restructuring expenses.
Sales development 1
in percent Q2/2018 1–6/2018
Change versus previous year 3.8 – 0.4
Foreign exchange – 5.9 – 7.1
Adjusted for foreign exchange 9.7 6.7
Acquisitions / divestments 9.3 8.7
Organic 0.4 – 2.0
of which price 1.0 0.1
of which volume – 0.6 – 2.1
1 Calculated on the basis of units of 1,000 euros.
Organic sales growth in our businesses in mature markets was flat. Sales growth in the North America region was good. Performance in the Western Europe region was slightly negative, impacted by continuing fierce crowding-out competition and intense price pressure. Sales in the mature markets of the Asia-Pacific region were lower compared to the second quarter of 2017.
Sales in our Branded Consumer Goods business declined slightly compared to the second quarter of the prior year. The Hair Salon business area contin-ued its successful development with strong organic sales growth.
Adjusted operating profit (EBIT) came in at 187 million euros, 4.4 percent higher than the second quarter of 2017. Adjusted return on sales showed positive development to 18.1 percent.
At 15.4 percent, return on capital employed (ROCE) was lower compared to the prior-year figure, mainly due to acquisitions. With a figure of 6.1 percent, net working capital as a percentage of sales was above the level of the second quarter of 2017.
Henkel Q2 Quarterly financial report / Half-year financial report 2018 9 Report second quarter 2018

In the second quarter of 2018, the Laundry & Home Care business unit generated sales of 1,644 million euros.
Organically (i.e. adjusted for foreign exchange and acquisitions / divestments), sales in the business unit increased by 2.9 percent. Acquisitions / divestments accounted for an increase in sales of 0.4 percent. Foreign exchange effects reduced sales by –6.7 percent. Nominally, sales decreased by –3.4 percent.
This good organic sales growth was mainly driven by our very strong sales performance in our emerging markets. We achieved very strong growth in Eastern Europe and the Africa / Middle East region. Latin America contributed to the sales performance with strong growth.
Laundry & Home Care
Key financials 1
in million euros Q2/2017 Q2/2018 +/– 1–6/2017 1–6/2018 +/–
Sales 1,703 1,644 – 3.4 % 3,429 3,213 – 6.3 %
Proportion of Henkel sales 33 % 32 % – 33 % 32 % –
Operating profit (EBIT) 265 246 – 7.4 % 539 465 – 13.7 %
Adjusted 2 operating profit (EBIT) 298 295 – 1.0 % 596 586 – 1.8 %
Return on sales (EBIT) 15.6 % 14.9 % – 0.7 pp 15.7 % 14.5 % – 1.2 pp
Adjusted 2 return on sales (EBIT) 17.5 % 17.9 % 0.4 pp 17.4 % 18.2 % 0.8 pp
Return on capital employed (ROCE) 13.8 % 13.6 % – 0.2 pp 13.9 % 12.8 % – 1.1 pp
pp = percentage points 1 Calculated on the basis of units of 1,000 euros; figures commercially rounded.2 Adjusted for one-time charges / gains and restructuring expenses.
Organic sales performance in the mature markets was good. Compared to the prior-year quarter, the increase in sales in the North America region and the mature markets of the Asia-Pacific region was very strong. In a highly competitive environment, sales decreased in the Western Europe region.
In the Laundry Care business area, we recorded very strong organic growth in the second quarter. The Home Care business area posted negative organic sales growth in the second quarter.
Adjusted operating profit (EBIT) decreased versus the prior-year quarter by –1.0 percent to 295 million euros. We were able to increase adjusted return on sales by 0.4 percentage points year on year.
At 13.6 percent, return on capital employed (ROCE) was slightly lower compared to the prior-year quarter. With a figure of –1.4 percent, net working capital as a percentage of sales was above the level of the prior-year quarter.
Sales development 1
in percent Q2/2018 1–6/2018
Change versus previous year – 3.4 – 6.3
Foreign exchange – 6.7 – 7.7
Adjusted for foreign exchange 3.3 1.4
Acquisitions / divestments 0.4 0.3
Organic 2.9 1.1
of which price 1.1 0.8
of which volume 1.8 0.3
1 Calculated on the basis of units of 1,000 euros.
Henkel Q2 Quarterly financial report / Half-year financial report 201810 Report second quarter 2018

Financial report first half year 2018Sectors of importance for Henkel
According to IHS Markit, private consumption increased by approximately 3 percent in the first six months of 2018. Performance in the mature markets was solid. Consumers in North America increased their spending by 2.5 percent; consumer spending in Western Europe grew by 1.5 percent. Consumption in the emerging markets rose in the first six months by 4.5 percent.
According to IHS Markit, the industrial production index (IPX) gained 3.5 percent in the first six months of 2018. In the mature markets, IPX growth was approximately 3 percent, whereas the index showed an increase of approximately 4 percent in the emerg-ing markets.
Effects on Henkel
In conditions characterized by moderate private spending, organic sales performance in our con-sumer businesses was flat. Organic sales in the Adhe-sive Technologies business unit grew by 5.0 percent between January and June 2018, thus outperforming the industrial production index.
Adjusted gross margin decreased by –0.5 percentage points to 47.3 percent. Savings from cost reduction measures, improvements in production and supply chain efficiency, and selective price increases were only able to partially offset the impacts of higher prices for direct materials.
Underlying economic conditions
The general economic conditions described in this section are based on data published by IHS Markit.
The world economy grew by around 3 percent in the first six months of 2018 compared to the prior-year period.
The mature markets registered robust economic growth. In the first six months of 2018, the North American economy grew by approximately 3 percent, the Western European economy by approximately 2 percent, and Japan by approximately 1 percent.
The emerging markets of Asia (excluding Japan) grew by approximately 6 percent in the first six months of 2018. Compared to the first half year of 2017, economic output in Latin America increased by 1.5 percent. Growth was at 3.5 percent in Eastern Europe and approximately 2.5 percent in Africa / Middle East.
Global unemployment was approximately 7 percent. Across the world, consumer prices rose by around 3 percent.
Prices for raw materials, packaging and purchased goods and services increased moderately compared to the first six months of 2017.
On the currency markets, the US dollar weakened in the first six months of 2018 compared to the prior- year period, to 1.21 US dollars versus the euro. Some key currencies in emerging markets also weakened.
Henkel Q2 Quarterly financial report / Half-year financial report 2018 11Financial report first half year 2018

Key financials 1
in million euros 1–6/2017 1–6/2018 +/–
Sales 10,162 9,978 – 1.8 %
Operating profit (EBIT) 1,662 1,553 – 6.6 %
Adjusted 2 operating profit (EBIT) 1,763 1,768 0.3 %
Return on sales (EBIT) 16.4 % 15.6 % – 0.8 pp
Adjusted 2 return on sales (EBIT) 17.4 % 17.7 % 0.3 pp
Net income – attributable to shareholders of Henkel AG & Co. KGaA 1,221 1,141 – 6.6 %
Adjusted 2 net income – attributable to shareholders of Henkel AG & Co. KGaA 1,283 1,303 1.6 %
Earnings per preferred share in euros 2.82 2.63 – 6.7 %
Adjusted 2 earnings per preferred share in euros 2.96 3.01 1.7 %
pp = percentage points1 Calculated on the basis of units of 1,000 euros; figures commercially rounded.2 Adjusted for one-time charges / gains and restructuring expenses.
Business performance January – June 2018
Results of operations
In the first six months of 2018, sales of the Henkel Group reached 9,978 million euros. Organically (i.e. adjusted for foreign exchange and acquisitions / divestments), sales increased by 2.3 percent. Acquisi-tions and divestments accounted for sales growth of 3.3 percent. Foreign exchange effects reduced sales by –7.4 percent. Nominally, sales decreased by –1.8 percent.
We improved adjusted return on sales (EBIT) by 0.3 percentage points to 17.7 percent. Year on year, adjusted earnings per preferred share rose by 1.7 percent.
Sales development 1
in percent 1–6/2018
Change versus previous year – 1.8
Foreign exchange – 7.4
Adjusted for foreign exchange 5.6
Acquisitions / divestments 3.3
Organic 2.3
of which price 1.1
of which volume 1.2
1 Calculated on the basis of units of 1,000 euros.
The good organic sales performance was driven by very strong growth of 5.0 percent in the Adhesive Technolo-gies business unit. Sales in our consumer goods busi-ness were adversely affected by delivery difficulties in
North America in the first quarter of 2018. Sales in the Beauty Care business unit decreased by –2.0 percent. The Laundry & Home Care business unit was able to increase sales organically by 1.1 percent.
Price and volume effects first half year 2018
in percent
Organic sales
growth
of which price
of which
volume
Adhesive Technologies 5.0 1.8 3.2
Beauty Care – 2.0 0.1 – 2.1
Laundry & Home Care 1.1 0.8 0.3
Henkel Group 2.3 1.1 1.2
In the first half of 2018, there were no material changes to our business activities and competitive positions as presented in our Annual Report 2017 on pages 59 and 60.
In order to adapt our structures to our markets and cus-tomers, we spent 164 million euros on restructuring (first half year 2017: 47 million euros). A significant por-tion of this amount is attributable to the optimization of our sales, distribution and production structures.
In the following, we discuss our operating income and expense items up to operating profit, adjusted in each case for one-time charges / gains and restructuring expenses. The reconciliation statement and the alloca-tion of the restructuring expenses between the various expense items of the consolidated statement of income can be found on page 29.
Henkel Q2 Quarterly financial report / Half-year financial report 201812 Financial report first half year 2018

Compared to the first six months of 2017, cost of sales decreased by –0.9 percent to 5,263 million euros. Gross profit decreased by –2.8 percent to 4,715 million euros. Gross margin decreased by –0.5 percentage points to 47.3 percent. Savings from cost reduction measures, improvements in production and supply chain effi-ciency, and selective price increases were only able to partially offset the impacts of higher prices for direct materials.
Marketing, selling and distribution expenses decreased by –4.7 percent from 2,412 million euros to 2,299 mil-lion euros. Year on year, their ratio to sales declined by –0.7 percentage points to 23.0 percent. We spent a total of 239 million euros on research and development. The ratio to sales, at 2.4 percent, was on a par with the prior- year figure. Administrative expenses decreased com-pared to the prior-year period from 467 million euros to 448 million euros. At 4.5 percent, administrative expenses in relation to sales were slightly lower versus the first six months of 2017.
At 39 million euros, the balance of other operating income and expenses was higher versus the previous year. The rise was attributable to numerous individual transactions relating to operations.
Adjusted operating profit (EBIT) increased from 1,763 million euros to 1,768 million euros. We increased adjusted return on sales of the Henkel Group from 17.4 percent to 17.7 percent. The Adhesive Technologies business unit registered a margin of 18.5 percent (previous year: 18.6 percent). At 17.4 per-cent, the margin in the Beauty Care business unit was on a par with the level of the previous year. The Laundry & Home Care business unit recorded a very strong margin increase from 17.4 percent to 18.2 percent.
Our financial result declined from –19 million euros in the first six months of 2017 to –24 million euros in the first half of 2018. The difference of –5 million euros is due, in particular, to the higher interest expense relating to the funding of acquisitions in the second half of 2017. The tax rate was 24.8 percent (adjusted: 24.7 percent).
Henkel generated net income for the half year of 1,150 million euros (previous year: 1,238 million euros). After deducting 9 million euros attributable to non-controlling interests, net income for the first six months was 1,141 million euros (first six months 2017: 1,221 million euros). Adjusted net income for the first six months after deducting non-controlling interests was 1,303 million euros compared to 1,283 million euros in the first six months of 2017.
Earnings per preferred share amounted to 2.63 euros (previous year: 2.82 euros). Adjusted earnings per preferred share increased from 2.96 euros in the first six months of 2017 to 3.01 euros in the first half of 2018.
Reconciliation from sales to adjusted operating profit 1
in million euros 1–6/2017 % 1–6/2018 % +/–
Sales 10,162 100.0 9,978 100.0 – 1.8 %
Cost of sales – 5,309 – 52.2 – 5,263 – 52.7 – 0.9 %
Gross profit 4,853 47.8 4,715 47.3 – 2.8 %
Marketing, selling and distribution expenses – 2,412 – 23.7 – 2,299 – 23.0 – 4.7 %
Research and development expenses – 238 – 2.4 – 239 – 2.4 0.4 %
Administrative expenses – 467 – 4.6 – 448 – 4.5 – 4.1 %
Other operating income / expenses 27 0.3 39 0.3 –
Adjusted operating profit (EBIT) 1,763 17.4 1,768 17.7 0.3 %
1 Calculated on the basis of units of 1,000 euros; figures commercially rounded.
Henkel Q2 Quarterly financial report / Half-year financial report 2018 13Financial report first half year 2018
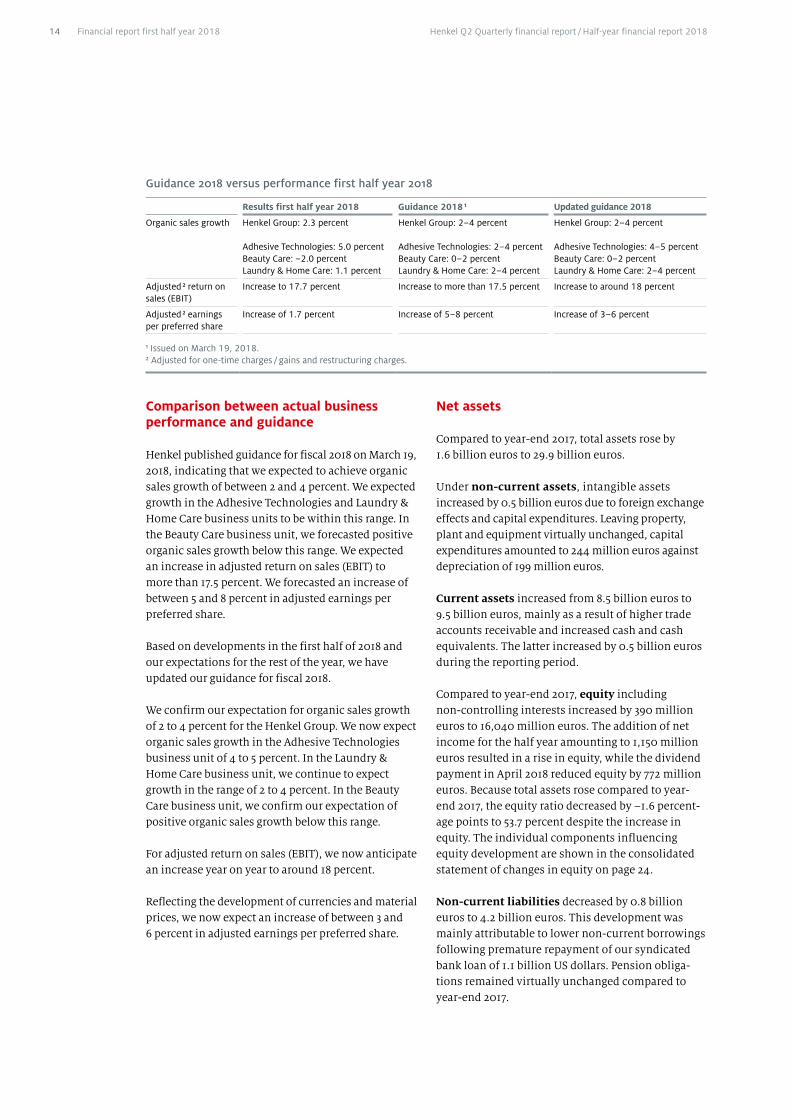
Comparison between actual business performance and guidance
Henkel published guidance for fiscal 2018 on March 19, 2018, indicating that we expected to achieve organic sales growth of between 2 and 4 percent. We expected growth in the Adhesive Technologies and Laundry & Home Care business units to be within this range. In the Beauty Care business unit, we forecasted positive organic sales growth below this range. We expected an increase in adjusted return on sales (EBIT) to more than 17.5 percent. We forecasted an increase of between 5 and 8 percent in adjusted earnings per preferred share.
Based on developments in the first half of 2018 and our expectations for the rest of the year, we have updated our guidance for fiscal 2018.
We confirm our expectation for organic sales growth of 2 to 4 percent for the Henkel Group. We now expect organic sales growth in the Adhesive Technologies business unit of 4 to 5 percent. In the Laundry & Home Care business unit, we continue to expect growth in the range of 2 to 4 percent. In the Beauty Care business unit, we confirm our expectation of positive organic sales growth below this range.
For adjusted return on sales (EBIT), we now anticipate an increase year on year to around 18 percent.
Reflecting the development of currencies and material prices, we now expect an increase of between 3 and 6 percent in adjusted earnings per preferred share.
Net assets
Compared to year-end 2017, total assets rose by 1.6 billion euros to 29.9 billion euros.
Under non-current assets, intangible assets increased by 0.5 billion euros due to foreign exchange effects and capital expenditures. Leaving property, plant and equipment virtually unchanged, capital expenditures amounted to 244 million euros against depreciation of 199 million euros.
Current assets increased from 8.5 billion euros to 9.5 billion euros, mainly as a result of higher trade accounts receivable and increased cash and cash equivalents. The latter increased by 0.5 billion euros during the reporting period.
Compared to year-end 2017, equity including non-controlling interests increased by 390 million euros to 16,040 million euros. The addition of net income for the half year amounting to 1,150 million euros resulted in a rise in equity, while the dividend payment in April 2018 reduced equity by 772 million euros. Because total assets rose compared to year-end 2017, the equity ratio decreased by –1.6 percent-age points to 53.7 percent despite the increase in equity. The individual components influencing equity development are shown in the consolidated statement of changes in equity on page 24.
Non-current liabilities decreased by 0.8 billion euros to 4.2 billion euros. This development was mainly attributable to lower non-current borrowings following premature repayment of our syndicated bank loan of 1.1 billion US dollars. Pension obliga-tions remained virtually unchanged compared to year-end 2017.
Guidance 2018 versus performance first half year 2018
Results first half year 2018 Guidance 2018 1 Updated guidance 2018
Organic sales growth Henkel Group: 2.3 percent
Adhesive Technologies: 5.0 percent Beauty Care: –2.0 percent Laundry & Home Care: 1.1 percent
Henkel Group: 2–4 percent
Adhesive Technologies: 2–4 percent Beauty Care: 0–2 percent Laundry & Home Care: 2–4 percent
Henkel Group: 2–4 percent
Adhesive Technologies: 4–5 percent Beauty Care: 0–2 percent Laundry & Home Care: 2–4 percent
Adjusted 2 return on sales (EBIT)
Increase to 17.7 percent Increase to more than 17.5 percent Increase to around 18 percent
Adjusted 2 earnings per preferred share
Increase of 1.7 percent Increase of 5–8 percent Increase of 3–6 percent
1 Issued on March 19, 2018.2 Adjusted for one-time charges / gains and restructuring charges.
Henkel Q2 Quarterly financial report / Half-year financial report 201814 Financial report first half year 2018
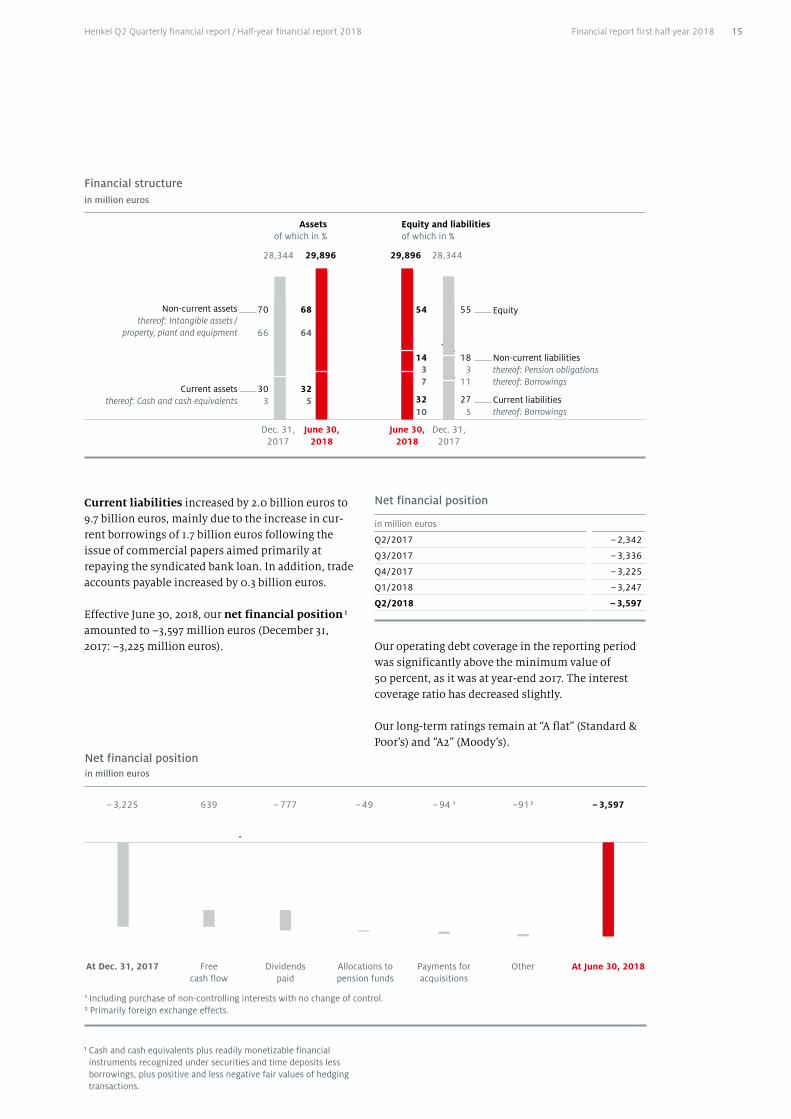
Current liabilities increased by 2.0 billion euros to 9.7 billion euros, mainly due to the increase in cur-rent borrowings of 1.7 billion euros following the issue of commercial papers aimed primarily at repaying the syndicated bank loan. In addition, trade accounts payable increased by 0.3 billion euros.
Effective June 30, 2018, our net financial position 1 amounted to –3,597 million euros (December 31, 2017: –3,225 million euros).
Net financial position
in million euros
Q2/2017 – 2,342
Q3/2017 – 3,336
Q4/2017 – 3,225
Q1/2018 – 3,247
Q2/2018 – 3,597
Our operating debt coverage in the reporting period was significantly above the minimum value of 50 percent, as it was at year-end 2017. The interest coverage ratio has decreased slightly.
Our long-term ratings remain at “A flat” (Standard & Poor’s) and “A2” (Moody’s).
Financial structure in million euros
Assets of which in %
Equity and liabilities of which in %
29,896 28,34429,89628,344
Non-current liabilitiesthereof: Pension obligationsthereof: Borrowings
Current liabilitiesthereof: Borrowings
Non-current assetsthereof: Intangible assets /
property, plant and equipment
18
527
Equity55
311
14
1032
54
37
70
66
Current assets thereof: Cash and cash equivalents
30 3
68
64
32 5
Dec. 31, 2017
June 30, 2018
June 30, 2018
Dec. 31, 2017
Net financial position in million euros
– 3,597– 3,225 639 – 777 – 49 – 94 1 –91 2
1 Including purchase of non-controlling interests with no change of control.2 Primarily foreign exchange effects.
At June 30, 2018 At Dec. 31, 2017 Free cash flow
Dividends paid
Allocations to pension funds
Payments for acquisitions
Other
1 Cash and cash equivalents plus readily monetizable financial instruments recognized under securities and time deposits less borrowings, plus positive and less negative fair values of hedging transactions.
Henkel Q2 Quarterly financial report / Half-year financial report 2018 15Financial report first half year 2018
Key financial ratios
Dec. 31, 2017
June 30, 2018
Operating debt coverage (net income + amortization and depreciation, impairment and write-ups + interest element of pension obligations) / net borrowings and pension obligations 80.9 % 66.1 %
Interest coverage ratio EBITDA / interest result including interest element of pension obligations 79.3 70.7
Equity ratio equity / total assets 55.3 % 53.7 %
Financial position
The development of our financial position is indi-cated in detail in the consolidated statement of cash flows on page 25.
At 1,070 million euros, cash flow from operating activities in the first six months of 2018 was above the comparable figure of the prior-year period (959 million euros). The slight decrease in operating profit year on year and higher outflows for trade accounts receivable were offset by higher inflows for trade accounts payable and lower outflows for other liabilities. Year on year, the ratio of net working capi-tal 1 to sales increased by 1.1 percentage points to 6.3 percent.
The cash outflow in cash flow from investing activities (–554 million euros) was above the figure of the prior-year period (–260 million euros) as a result of higher capital expenditures on intangible assets and property, plant and equipment.
Cash flow from financing activities showed a slight outflow of –32 million euros compared to a cash inflow of 366 million euros in the prior-year period, due to both higher dividend payments and lower cash inflows from borrowings. During the reporting period, we prematurely repaid our syndi-cated bank loan of 1.1 billion US dollars in full and increased our outstanding commercial papers. Developments in 2017 were influenced by inflows from the issuance of a bond.
Cash and cash equivalents rose compared to December 31, 2017 by 486 million euros to 1,402 mil-lion euros.
The slight increase in free cash flow from 617 mil-lion euros to 639 million euros in the first half of 2018 was due to higher cash flow from operating activities and cash inflows relating to other changes in pensions following reimbursement of pension payments. Higher capital expenditures on intangible assets and property, plant and equipment, including payments on account, had a countervailing effect.
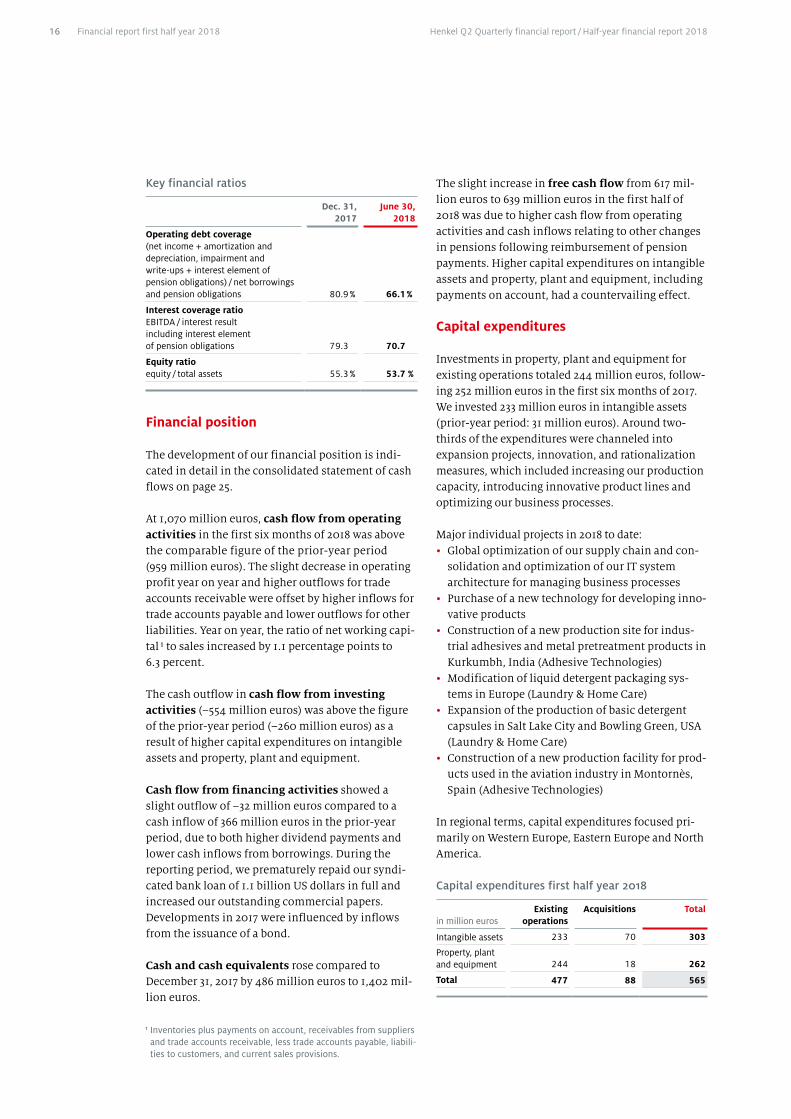
Capital expenditures
Investments in property, plant and equipment for existing operations totaled 244 million euros, follow-ing 252 million euros in the first six months of 2017. We invested 233 million euros in intangible assets (prior-year period: 31 million euros). Around two-thirds of the expenditures were channeled into expansion projects, innovation, and rationalization measures, which included increasing our production capacity, introducing innovative product lines and optimizing our business processes.
Major individual projects in 2018 to date:• Global optimization of our supply chain and con-
solidation and optimization of our IT system architecture for managing business processes
• Purchase of a new technology for developing inno-vative products
• Construction of a new production site for indus-trial adhesives and metal pretreatment products in Kurkumbh, India (Adhesive Technologies)
• Modification of liquid detergent packaging sys-tems in Europe (Laundry & Home Care)
• Expansion of the production of basic detergent capsules in Salt Lake City and Bowling Green, USA (Laundry & Home Care)
• Construction of a new production facility for prod-ucts used in the aviation industry in Montornès, Spain (Adhesive Technologies)
In regional terms, capital expenditures focused pri-marily on Western Europe, Eastern Europe and North America.
Capital expenditures first half year 2018
in million eurosExisting
operationsAcquisitions Total
Intangible assets 233 70 303
Property, plant and equipment 244 18 262
Total 477 88 565
1 Inventories plus payments on account, receivables from suppliers and trade accounts receivable, less trade accounts payable, liabili-ties to customers, and current sales provisions.
Henkel Q2 Quarterly financial report / Half-year financial report 201816 Financial report first half year 2018
Acquisitions and divestments
Effective January 3, 2018, we completed the acquisi-tion of all shares of Unión Técnico Comercial S.R.L. based in Lima, Peru. The acquisition strengthens the market position of the General Industry business of Adhesive Technologies in the field of maintenance, repair and overhaul in Latin America.
Effective June 1, 2018, we completed the acquisition of all shares of JemPak Corporation based in Concord, Canada. The acquisition complements and strength-ens the existing Laundry & Home Care portfolio in North America; it will help to further expand Henkel’s position in this attractive market and to strengthen our leading position in the retailer brands category in North America.
Further details can be found in the selected explana-tory notes on page 33. There were no resulting changes to our business and organizational struc-ture. For detailed information on our organization and business activities, please refer to the disclo-sures in our Annual Report 2017 on page 59.
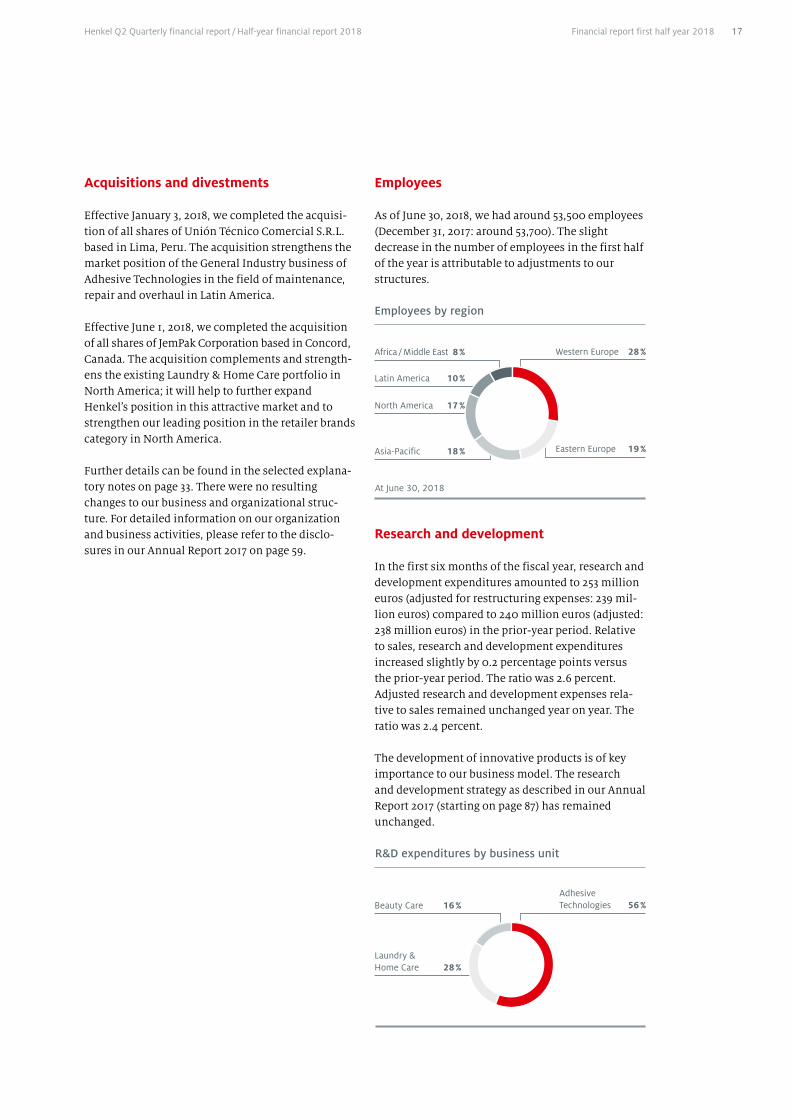
Employees
As of June 30, 2018, we had around 53,500 employees (December 31, 2017: around 53,700). The slight decrease in the number of employees in the first half of the year is attributable to adjustments to our structures.
Employees by region
Latin America 10 %
Africa / Middle East 8 %
North America 17 %
Asia-Pacific 18 %
At June 30, 2018
Western Europe 28 %
Eastern Europe 19 %
Research and development
In the first six months of the fiscal year, research and development expenditures amounted to 253 million euros (adjusted for restructuring expenses: 239 mil-lion euros) compared to 240 million euros (adjusted: 238 million euros) in the prior-year period. Relative to sales, research and development expenditures increased slightly by 0.2 percentage points versus the prior-year period. The ratio was 2.6 percent. Adjusted research and development expenses rela-tive to sales remained unchanged year on year. The ratio was 2.4 percent.
The development of innovative products is of key importance to our business model. The research and development strategy as described in our Annual Report 2017 (starting on page 87) has remained unchanged.
R&D expenditures by business unit
Beauty Care 16 %
Laundry & Home Care 28 %
Adhesive Technologies 56 %
Henkel Q2 Quarterly financial report / Half-year financial report 2018 17Financial report first half year 2018
Our assessment of future world economic develop-ment is based on data provided by IHS Markit.
Global economic growth is expected to remain no more than moderate in 2018. IHS Markit expects gross domestic product to rise by around 3 percent.
For the mature markets, IHS Markit anticipates growth of approximately 2.5 percent. For Western Europe, the expected increase is approximately 2 per-cent, and for North America, growth of around 3 per-cent is predicted for the full year. The Japanese econ-omy is expected to grow by approximately 1 percent.
The emerging markets are likely to achieve economic growth of approximately 5 percent in 2018. IHS Markit expects economic output to increase by approximately 6 percent in Asia (excluding Japan) and by approximately 3 percent in the Africa / Middle East region. Growth of approximately 1 percent is forecasted for Latin America. The economy of East-ern Europe is expected to grow by approximately 3 percent in 2018.
Global inflation of approximately 3 percent is pre-dicted in 2018. IHS Markit anticipates an increase in price levels of approximately 2 percent in the mature markets, while inflation of approximately 4 percent is expected for the emerging markets.
We expect prices for raw materials, packaging and purchased goods and services to increase moderately compared to the previous year.
We anticipate continued high volatility in the cur-rency markets. We expect a weaker average US dollar rate for 2018 compared to 2017. In addition, some major currencies in the emerging markets could weaken.
IHS Markit predicts that global private consumption will increase by approximately 3 percent in 2018. Consumers in mature markets are expected to spend approximately 2 percent more than in the previous year. Private spending in the emerging markets is expected to grow by approximately 4 percent in 2018.
Year on year, the industrial production index (IPX) is expected to gain approximately 3.5 percent world-wide. IHS Markit expects the IPX to gain around 3 percent in the mature markets and approximately 4 percent in the emerging markets.
Opportunities and risks
Our evaluation of opportunities and risks remains largely unchanged from the analysis provided in our Annual Report 2017. Within the macroeconomic and sector-specific risk category there has been a deterioration in the geopolitical environment. The presentation of the major risk and opportunity cate-gories can be found on pages 96 to 103 of our Annual Report 2017.
At the time this report was prepared, there were no identifiable risks related to future developments that could endanger the existence either of Henkel AG & Co. KGaA, or a material subsidiary included in the consolidation, or the Group, as a going concern.
Outlook
Henkel Q2 Quarterly financial report / Half-year financial report 201818 Financial report first half year 2018
Outlook for the Henkel Group in 2018
Guidance 2018
Guidance 2018 1 Updated guidance 2018
Organic sales growth Henkel Group: 2–4 percent
Adhesive Technologies: 2–4 percent Beauty Care: 0–2 percent Laundry & Home Care: 2–4 percent
Henkel Group: 2–4 percent
Adhesive Technologies: 4–5 percent Beauty Care: 0–2 percent Laundry & Home Care: 2–4 percent
Adjusted 2 return on sales (EBIT) Increase to more than 17.5 percent Increase to around 18 percent
Adjusted 2 earnings per preferred share Increase of 5–8 percent Increase of 3–6 percent
1 Issued on March 19, 2018.2 Adjusted for one-time charges / gains and restructuring charges.
We have updated our guidance for fiscal 2018.
We confirm our expectation for organic sales growth of 2 to 4 percent for the Henkel Group. We now expect organic sales growth in the Adhesive Technologies business unit of 4 to 5 percent. In the Laundry & Home Care business unit, we continue to expect growth in the range of 2 to 4 percent. In the Beauty Care business unit, we confirm our expectation of positive organic sales growth below this range.
We expect the contribution to the nominal sales growth of the Henkel Group from our acquisitions in 2017 and 2018 to be in the low single-digit percentage range. The translation of sales in foreign currencies is expected to have a negative effect in the middle single-digit percentage range.
For adjusted return on sales (EBIT), we now antici-pate an increase year on year to around 18 percent. All three business units are expected to contribute to this positive performance.
Reflecting the development of currencies and material prices, we now expect an increase of between 3 and 6 percent in adjusted earnings per preferred share.
Furthermore, we confirm the following expectations for 2018:• Restructuring expenses of 200 to 250 million euros • Investments in intangible assets and property,
plant and equipment of between 750 and 850 mil-lion euros
Henkel Q2 Quarterly financial report / Half-year financial report 2018 19Financial report first half year 2018
Interim consolidated financial statements
Assets
in million eurosJune 30,
2017% Dec. 31,
2017% June 30,
2018%
Intangible assets 14,729 1 51.7 15,690 2 55.3 16,180 54.1
Property, plant and equipment 2,811 9.9 3,005 10.6 3,031 10.2
Other financial assets 63 0.2 50 0.2 63 0.2
Income tax refund claims 7 – 8 – 9 –
Other assets 171 0.6 169 0.6 184 0.6
Deferred tax assets 976 1 3.4 949 3.4 965 3.2
Non-current assets 18,757 65.8 19,871 70.1 20,432 68.3
Inventories 1,995 7.0 2,080 7.3 2,249 7.5
Trade accounts receivable 3,567 12.5 3,544 12.5 4,014 13.4
Other financial assets 978 3.4 1,072 3.8 1,036 3.5
Income tax refund claims 299 1.0 329 1.2 271 0.9
Other assets 429 1.5 451 1.6 411 1.4
Cash and cash equivalents 2,404 8.4 916 3.2 1,402 4.7
Assets held for sale 83 0.3 81 0.3 81 0.3
Current assets 9,755 34.2 8,473 29.9 9,464 31.7
Total assets 28,512 100.0 28,344 100.0 29,896 100.0
1 Adjusted following final allocation of the purchase price for the acquisition of The Sun Products Corporation.2 Adjusted following updated allocation of the purchase price for the acquisition of Zotos International Inc.
Consolidated statement of financial position
Henkel Q2 Quarterly financial report / Half-year financial report 201820 Interim consolidated financial statements
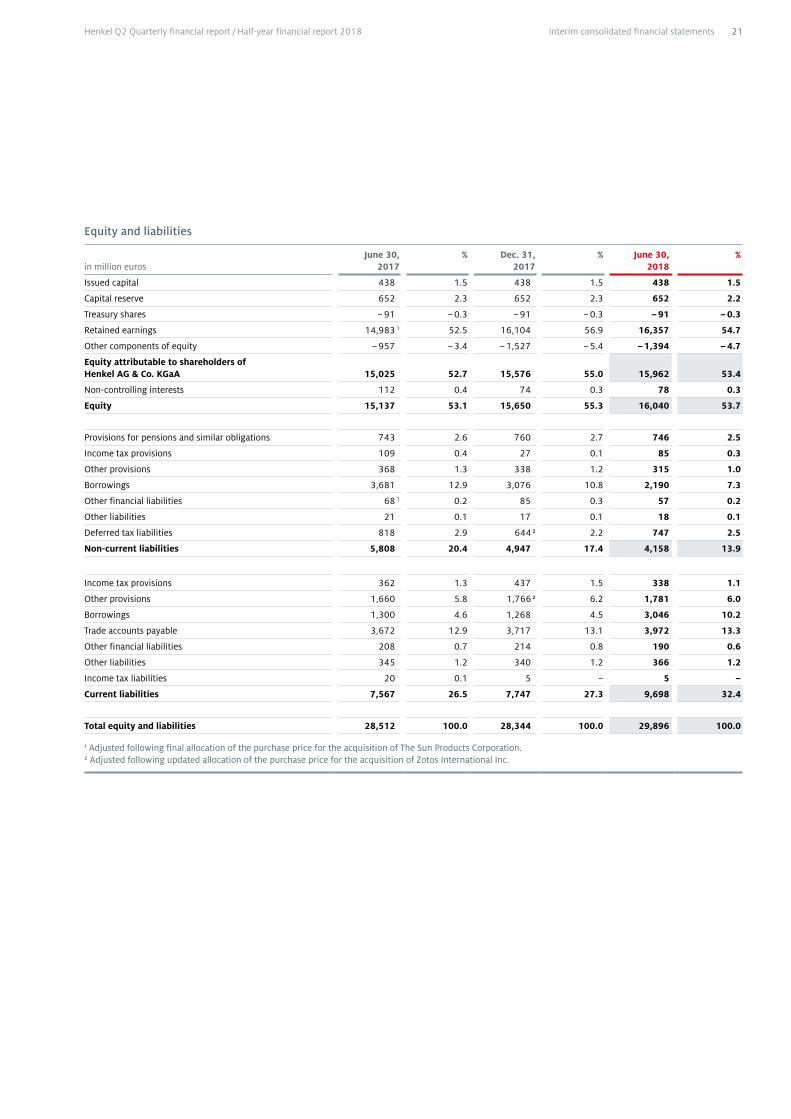
Equity and liabilities
in million eurosJune 30,
2017% Dec. 31,
2017% June 30,
2018%
Issued capital 438 1.5 438 1.5 438 1.5
Capital reserve 652 2.3 652 2.3 652 2.2
Treasury shares – 91 – 0.3 – 91 – 0.3 – 91 – 0.3
Retained earnings 14,983 1 52.5 16,104 56.9 16,357 54.7
Other components of equity – 957 – 3.4 – 1,527 – 5.4 – 1,394 – 4.7
Equity attributable to shareholders of Henkel AG & Co. KGaA 15,025 52.7 15,576 55.0 15,962 53.4
Non-controlling interests 112 0.4 74 0.3 78 0.3
Equity 15,137 53.1 15,650 55.3 16,040 53.7
Provisions for pensions and similar obligations 743 2.6 760 2.7 746 2.5
Income tax provisions 109 0.4 27 0.1 85 0.3
Other provisions 368 1.3 338 1.2 315 1.0
Borrowings 3,681 12.9 3,076 10.8 2,190 7.3
Other financial liabilities 68 1 0.2 85 0.3 57 0.2
Other liabilities 21 0.1 17 0.1 18 0.1
Deferred tax liabilities 818 2.9 644 2 2.2 747 2.5
Non-current liabilities 5,808 20.4 4,947 17.4 4,158 13.9
Income tax provisions 362 1.3 437 1.5 338 1.1
Other provisions 1,660 5.8 1,766 2 6.2 1,781 6.0
Borrowings 1,300 4.6 1,268 4.5 3,046 10.2
Trade accounts payable 3,672 12.9 3,717 13.1 3,972 13.3
Other financial liabilities 208 0.7 214 0.8 190 0.6
Other liabilities 345 1.2 340 1.2 366 1.2
Income tax liabilities 20 0.1 5 – 5 –
Current liabilities 7,567 26.5 7,747 27.3 9,698 32.4
Total equity and liabilities 28,512 100.0 28,344 100.0 29,896 100.0
1 Adjusted following final allocation of the purchase price for the acquisition of The Sun Products Corporation.2 Adjusted following updated allocation of the purchase price for the acquisition of Zotos International Inc.
Henkel Q2 Quarterly financial report / Half-year financial report 2018 21Interim consolidated financial statements

in million euros Q2/2017 % Q2/2018 % +/–
Sales 5,098 100.0 5,143 100.0 0.9 %
Cost of sales – 2,678 – 52.5 – 2,738 – 53.2 2.2 %
Gross profit 2,420 47.5 2,405 46.8 – 0.6 %
Marketing, selling and distribution expenses – 1,242 – 24.4 – 1,192 – 23.2 – 4.0 %
Research and development expenses – 119 – 2.3 – 137 – 2.7 15.1 %
Administrative expenses – 248 – 4.9 – 271 – 5.3 9.3 %
Other operating income 36 0.7 26 0.5 – 27.8 %
Other operating expenses – 8 – 0.2 – 17 – 0.3 >100 %
Operating profit (EBIT) 839 16.4 814 15.8 – 3.0 %
Interest income 6 0.1 2 – – 66.7 %
Interest expense – 13 – 0.2 – 22 – 0.5 69.2 %
Other financial result 1 – 8 0.2 >100 %
Investment result – – 3 0.1 –
Financial result – 6 – 0.1 – 9 – 0.2 50.0 %
Income before tax 833 16.3 805 15.6 – 3.4 %
Taxes on income – 202 – 3.9 – 203 – 3.9 0.5 %
Tax rate in % 24.2 25.2
Net income 631 12.4 602 11.7 – 4.6 %
Attributable to non-controlling interests 7 0.1 4 0.1 – 42.9 %
Attributable to shareholders of Henkel AG & Co. KGaA 624 12.3 598 11.6 – 4.2 %
Earnings per ordinary share – basic and diluted in euros 1.44 1.38 – 4.2 %
Earnings per preferred share – basic and diluted in euros 1.44 1.38 – 4.2 %
Consolidated statement of income
Henkel Q2 Quarterly financial report / Half-year financial report 201822 Interim consolidated financial statements
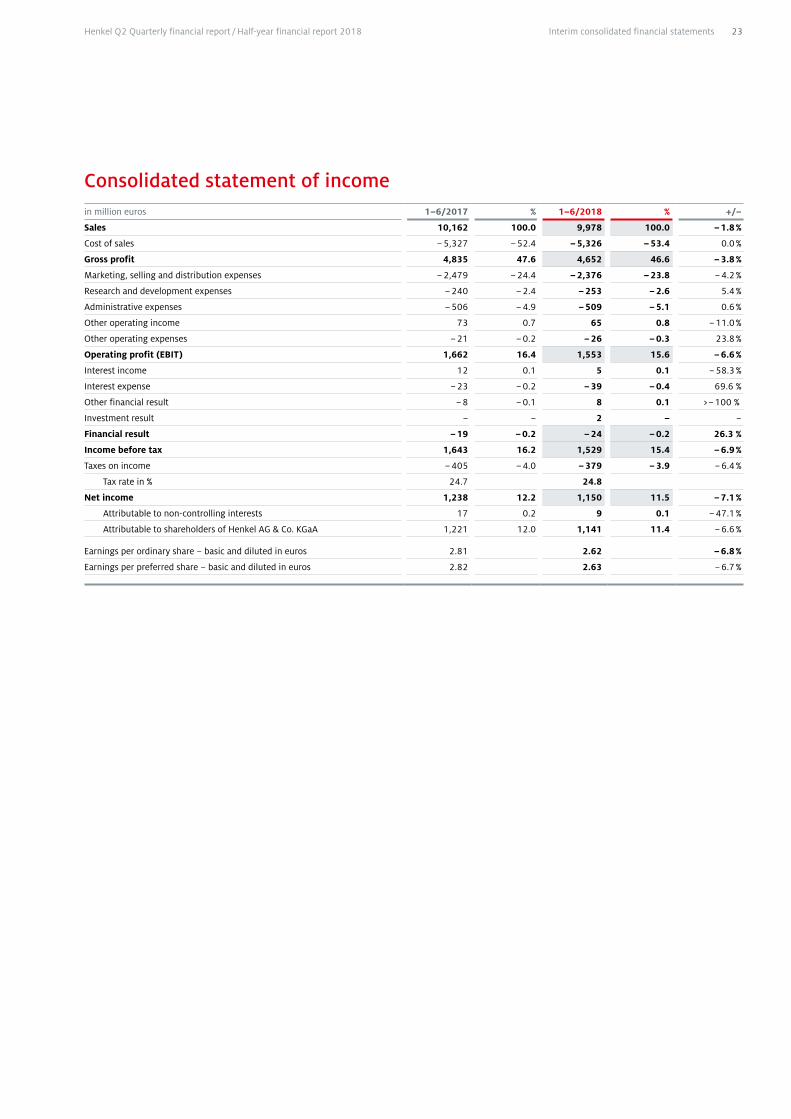
in million euros 1–6/2017 % 1–6/2018 % +/–
Sales 10,162 100.0 9,978 100.0 – 1.8 %
Cost of sales – 5,327 – 52.4 – 5,326 – 53.4 0.0 %
Gross profit 4,835 47.6 4,652 46.6 – 3.8 %
Marketing, selling and distribution expenses – 2,479 – 24.4 – 2,376 – 23.8 – 4.2 %
Research and development expenses – 240 – 2.4 – 253 – 2.6 5.4 %
Administrative expenses – 506 – 4.9 – 509 – 5.1 0.6 %
Other operating income 73 0.7 65 0.8 – 11.0 %
Other operating expenses – 21 – 0.2 – 26 – 0.3 23.8 %
Operating profit (EBIT) 1,662 16.4 1,553 15.6 – 6.6 %
Interest income 12 0.1 5 0.1 – 58.3 %
Interest expense – 23 – 0.2 – 39 – 0.4 69.6 %
Other financial result – 8 – 0.1 8 0.1 >– 100 %
Investment result – – 2 – –
Financial result – 19 – 0.2 – 24 – 0.2 26.3 %
Income before tax 1,643 16.2 1,529 15.4 – 6.9 %
Taxes on income – 405 – 4.0 – 379 – 3.9 – 6.4 %
Tax rate in % 24.7 24.8
Net income 1,238 12.2 1,150 11.5 – 7.1 %
Attributable to non-controlling interests 17 0.2 9 0.1 – 47.1 %
Attributable to shareholders of Henkel AG & Co. KGaA 1,221 12.0 1,141 11.4 – 6.6 %
Earnings per ordinary share – basic and diluted in euros 2.81 2.62 – 6.8 %
Earnings per preferred share – basic and diluted in euros 2.82 2.63 – 6.7 %
Consolidated statement of income
Henkel Q2 Quarterly financial report / Half-year financial report 2018 23Interim consolidated financial statements
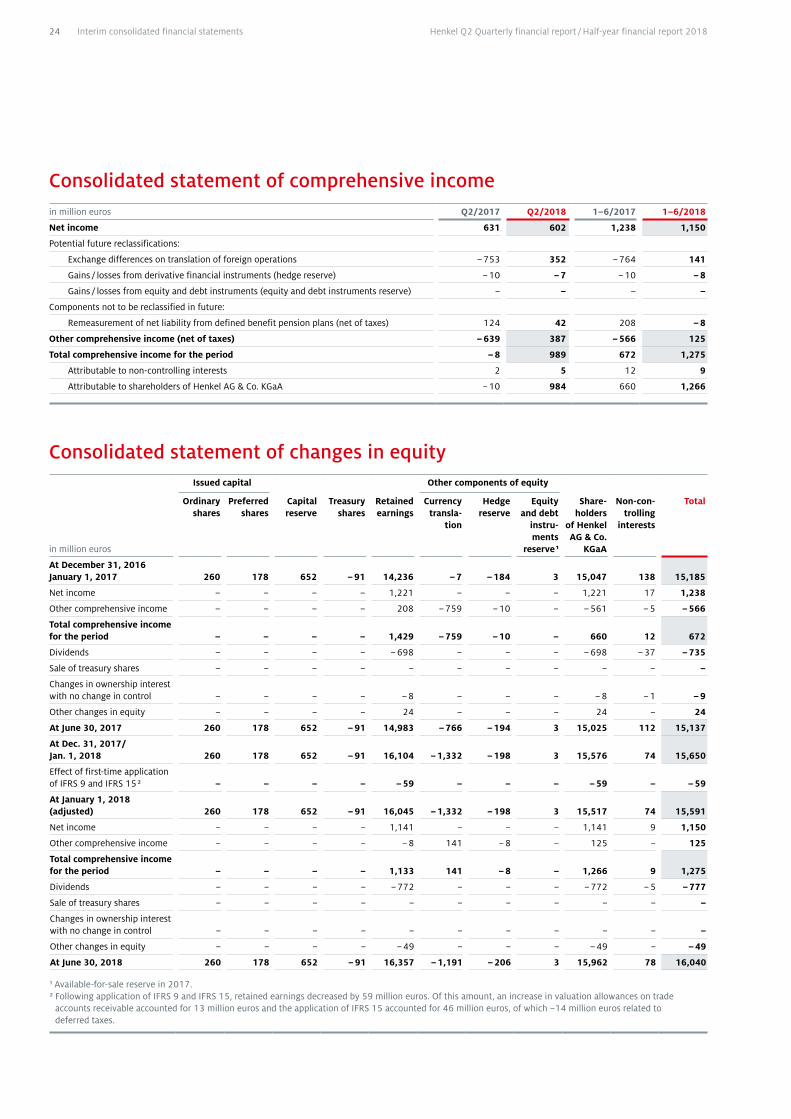
in million euros Q2/2017 Q2/2018 1–6/2017 1–6/2018
Net income 631 602 1,238 1,150
Potential future reclassifications:
Exchange differences on translation of foreign operations – 753 352 – 764 141
Gains / losses from derivative financial instruments (hedge reserve) – 10 – 7 – 10 – 8
Gains / losses from equity and debt instruments (equity and debt instruments reserve) – – – –
Components not to be reclassified in future:
Remeasurement of net liability from defined benefit pension plans (net of taxes) 124 42 208 – 8
Other comprehensive income (net of taxes) – 639 387 – 566 125
Total comprehensive income for the period – 8 989 672 1,275
Attributable to non-controlling interests 2 5 12 9
Attributable to shareholders of Henkel AG & Co. KGaA – 10 984 660 1,266
Issued capital Other components of equity
in million euros
Ordinary shares
Preferred shares
Capital reserve
Treasury shares
Retained earnings
Currency transla-
tion
Hedge reserve
Equity and debt
instru-ments
reserve 1
Share-holders
of Henkel AG & Co.
KGaA
Non-con-trolling
interests
Total
At December 31, 2016 January 1, 2017 260 178 652 – 91 14,236 – 7 – 184 3 15,047 138 15,185
Net income – – – – 1,221 – – – 1,221 17 1,238
Other comprehensive income – – – – 208 – 759 – 10 – – 561 – 5 – 566
Total comprehensive income for the period – – – – 1,429 – 759 – 10 – 660 12 672
Dividends – – – – – 698 – – – – 698 – 37 – 735
Sale of treasury shares – – – – – – – – – – –
Changes in ownership interest with no change in control – – – – – 8 – – – – 8 – 1 – 9
Other changes in equity – – – – 24 – – – 24 – 24
At June 30, 2017 260 178 652 – 91 14,983 – 766 – 194 3 15,025 112 15,137
At Dec. 31, 2017/ Jan. 1, 2018 260 178 652 – 91 16,104 – 1,332 – 198 3 15,576 74 15,650
Effect of first-time application of IFRS 9 and IFRS 15 2 – – – – – 59 – – – – 59 – – 59
At January 1, 2018 (adjusted) 260 178 652 – 91 16,045 – 1,332 – 198 3 15,517 74 15,591
Net income – – – – 1,141 – – – 1,141 9 1,150
Other comprehensive income – – – – – 8 141 – 8 – 125 – 125
Total comprehensive income for the period – – – – 1,133 141 – 8 – 1,266 9 1,275
Dividends – – – – – 772 – – – – 772 – 5 – 777
Sale of treasury shares – – – – – – – – – – –
Changes in ownership interest with no change in control – – – – – – – – – – –
Other changes in equity – – – – – 49 – – – – 49 – – 49
At June 30, 2018 260 178 652 – 91 16,357 – 1,191 – 206 3 15,962 78 16,040
1 Available-for-sale reserve in 2017.2 Following application of IFRS 9 and IFRS 15, retained earnings decreased by 59 million euros. Of this amount, an increase in valuation allowances on trade
accounts receivable accounted for 13 million euros and the application of IFRS 15 accounted for 46 million euros, of which –14 million euros related to deferred taxes.
Consolidated statement of comprehensive income
Consolidated statement of changes in equity
Henkel Q2 Quarterly financial report / Half-year financial report 201824 Interim consolidated financial statements
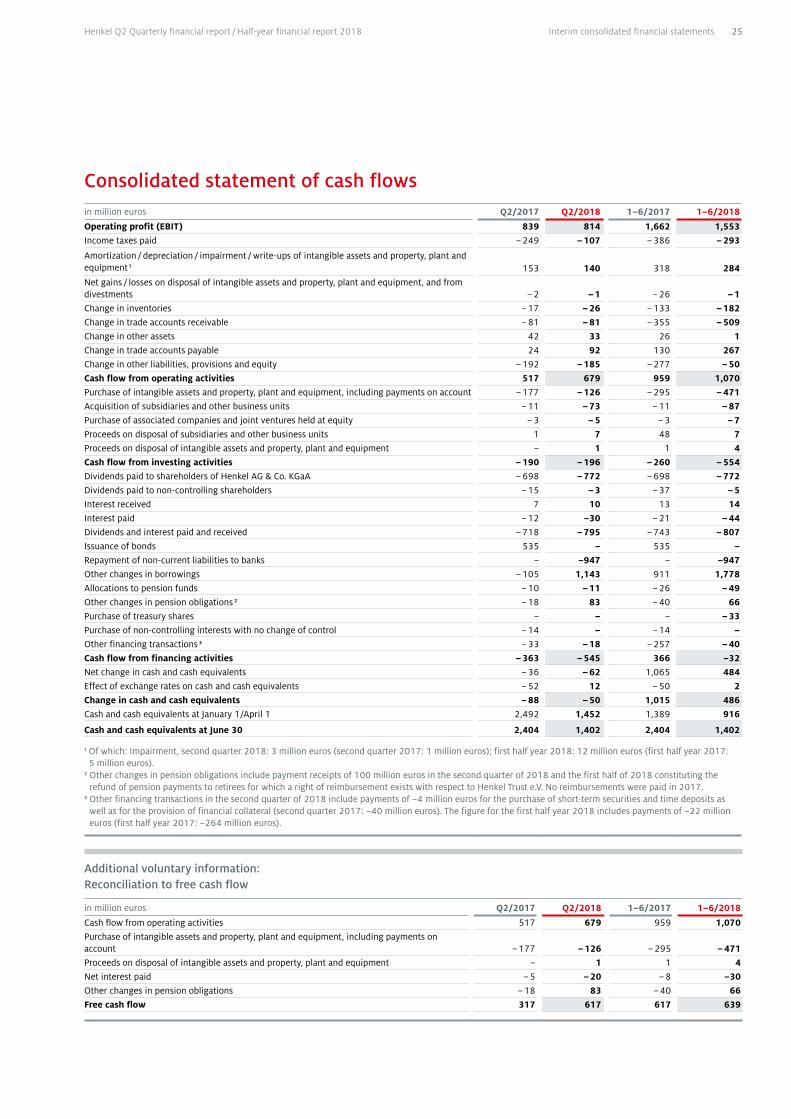
in million euros Q2/2017 Q2/2018 1–6/2017 1–6/2018
Operating profit (EBIT) 839 814 1,662 1,553Income taxes paid – 249 – 107 – 386 – 293
Amortization / depreciation / impairment / write-ups of intangible assets and property, plant and equipment 1 153 140 318 284Net gains / losses on disposal of intangible assets and property, plant and equipment, and from divestments – 2 – 1 – 26 – 1Change in inventories – 17 – 26 – 133 – 182Change in trade accounts receivable – 81 – 81 – 355 – 509Change in other assets 42 33 26 1Change in trade accounts payable 24 92 130 267Change in other liabilities, provisions and equity – 192 – 185 – 277 – 50Cash flow from operating activities 517 679 959 1,070Purchase of intangible assets and property, plant and equipment, including payments on account – 177 – 126 – 295 – 471Acquisition of subsidiaries and other business units – 11 – 73 – 11 – 87 Purchase of associated companies and joint ventures held at equity – 3 – 5 – 3 – 7 Proceeds on disposal of subsidiaries and other business units 1 7 48 7Proceeds on disposal of intangible assets and property, plant and equipment – 1 1 4Cash flow from investing activities – 190 – 196 – 260 – 554Dividends paid to shareholders of Henkel AG & Co. KGaA – 698 – 772 – 698 – 772 Dividends paid to non-controlling shareholders – 15 – 3 – 37 – 5Interest received 7 10 13 14Interest paid – 12 –30 – 21 – 44Dividends and interest paid and received – 718 – 795 – 743 – 807Issuance of bonds 535 – 535 –Repayment of non-current liabilities to banks – –947 – –947Other changes in borrowings – 105 1,143 911 1,778Allocations to pension funds – 10 – 11 – 26 – 49Other changes in pension obligations 2 – 18 83 – 40 66Purchase of treasury shares – – – – 33Purchase of non-controlling interests with no change of control – 14 – – 14 –Other financing transactions 3 – 33 – 18 – 257 – 40Cash flow from financing activities – 363 – 545 366 –32Net change in cash and cash equivalents – 36 – 62 1,065 484Effect of exchange rates on cash and cash equivalents – 52 12 – 50 2Change in cash and cash equivalents – 88 – 50 1,015 486Cash and cash equivalents at January 1/April 1 2,492 1,452 1,389 916
Cash and cash equivalents at June 30 2,404 1,402 2,404 1,402
1 Of which: Impairment, second quarter 2018: 3 million euros (second quarter 2017: 1 million euros); first half year 2018: 12 million euros (first half year 2017: 5 million euros).
2 Other changes in pension obligations include payment receipts of 100 million euros in the second quarter of 2018 and the first half of 2018 constituting the refund of pension payments to retirees for which a right of reimbursement exists with respect to Henkel Trust e.V. No reimbursements were paid in 2017.
3 Other financing transactions in the second quarter of 2018 include payments of –4 million euros for the purchase of short-term securities and time deposits as well as for the provision of financial collateral (second quarter 2017: –40 million euros). The figure for the first half year 2018 includes payments of –22 million euros (first half year 2017: –264 million euros).
Additional voluntary information: Reconciliation to free cash flow
in million euros Q2/2017 Q2/2018 1–6/2017 1–6/2018
Cash flow from operating activities 517 679 959 1,070Purchase of intangible assets and property, plant and equipment, including payments on account – 177 – 126 – 295 – 471Proceeds on disposal of intangible assets and property, plant and equipment – 1 1 4Net interest paid – 5 – 20 – 8 –30Other changes in pension obligations – 18 83 – 40 66Free cash flow 317 617 617 639
Consolidated statement of cash flows
Henkel Q2 Quarterly financial report / Half-year financial report 2018 25Interim consolidated financial statements

Selected explanatory notes
Second quarter 2018 in million euros
Adhesives for Consu-
mers, Craftsmen and Build-
ing
Industrial Adhesives
Total Adhesive Technolo-
gies
Beauty Care
Laundry & Home
Care
Operating business
units total
Corporate Henkel Group
Sales April–June 2018 471 1,962 2,432 1,035 1,644 5,112 32 5,143
Proportion of Henkel sales 9 % 38 % 47 % 20 % 32 % 99 % 1 % 100 %
Sales April–June 2017 491 1,879 2,370 997 1,703 5,070 29 5,098
Change from previous year – 4.1 % 4.4 % 2.6 % 3.8 % – 3.4 % 0.8 % 10 % 0.9 %
Adjusted for foreign exchange 2.3 % 10.1 % 8.5 % 9.7 % 3.3 % 7.0 % – 7.0 %
Organic 4.9 % 5.3 % 5.2 % 0.4 % 2.9 % 3.5 % – 3.5 %
EBIT April–June 2018 72 367 438 151 246 835 – 22 814
EBIT April–June 2017 82 364 446 155 265 866 – 27 839
Change from previous year – 12.4 % 0.7 % – 1.7 % – 2.4 % – 7.4 % – 3.6 % – – 3.0 %
Return on sales (EBIT) April–June 2018 15.2 % 18.7 % 18.0 % 14.6 % 14.9 % 16.3 % – 15.8 %
Return on sales (EBIT) April–June 2017 16.7 % 19.4 % 18.8 % 15.5 % 15.6 % 17.1 % – 16.4 %
Adjusted EBIT April–June 2018 77 384 462 187 295 944 – 18 926
Adjusted EBIT April–June 2017 81 373 455 180 298 932 – 23 909
Change from previous year – 4.6 % 2.9 % 1.5 % 4.4 % – 1.0 % 1.3 % – 1.8 %
Adjusted return on sales (EBIT) April–June 2018 16.4 % 19.6 % 19.0 % 18.1 % 17.9 % 18.5 % – 18.0 %
Adjusted return on sales (EBIT) April–June 2017 16.5 % 19.9 % 19.2 % 18.0 % 17.5 % 18.4 % – 17.8 %
Capital employed April–June 2018 2 866 7,787 8,653 3,915 7,249 19,818 135 19,953
Capital employed April–June 2017 2 838 7,039 7,877 2,949 7,705 18,531 72 18,603
Change from previous year 3.4 % 10.6 % 9.9 % 32.8 % – 5.9 % 6.9 % – 7.3 %
Return on capital employed (ROCE) April–June 2018 33.1 % 18.8 % 20.3 % 15.4 % 13.6 % 16.9 % – 16.3 %
Return on capital employed (ROCE) April–June 2017 39.0 % 20.7 % 22.6 % 21.0 % 13.8 % 18.7 % – 18.0 %
Amortization / depreciation / impairment / write-ups of intangible assets and property, plant and equipment April–June 2018 9 56 65 18 53 136 4 140
of which impairment losses 2018 – – – – 3 3 – 3
of which write-ups 2018 – – – – – – – –
Amortization / depreciation / impairment / write-ups of intangible assets and property, plant and equipment April–June 2017 9 53 62 24 64 150 3 153
of which impairment losses 2017 – 1 1 – – 1 – 1
of which write-ups 2017 – – – – – – – –
Capital expenditures (excluding financial assets) April–June 2018 6 57 63 13 133 209 1 210
Capital expenditures (excluding financial assets) April–June 2017 26 41 67 27 140 234 3 237
Operating assets April–June 2018 3 1,474 9,876 11,350 5,342 10,531 27,223 573 27,796
Operating liabilities April–June 2018 695 2,586 3,281 1,737 2,977 7,996 438 8,434
Net operating assets April–June 2018 3 779 7,290 8,069 3,605 7,554 19,227 135 19,362
Operating assets April–June 2017 3 1,454 8,766 10,220 4,392 10,626 25,237 540 25,777
Operating liabilities April–June 2017 653 2,223 2,876 1,632 2,723 7,231 468 7,699
Net operating assets April–June 2017 3 801 6,543 7,343 2,761 7,902 18,006 72 18,078
1 Calculated on the basis of units of 1,000 euros.2 Including goodwill at cost prior to any accumulated impairment in accordance with IFRS 3.79 (b).3 Including goodwill at net book value.
Group segment report by business unit 1
26 Selected explanatory notes Henkel Q2 Quarterly financial report / Half-year financial report 2018
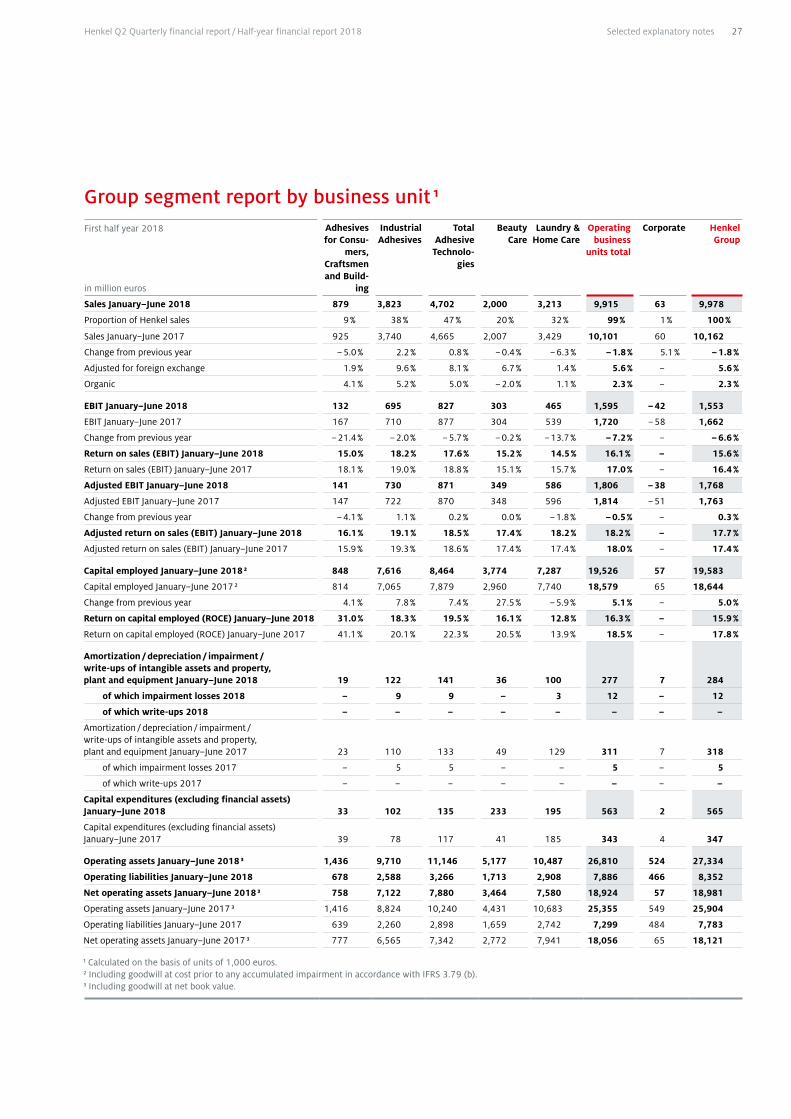
First half year 2018 in million euros
Adhesives for Consu-
mers, Craftsmen and Build-
ing
Industrial Adhesives
Total Adhesive Technolo-
gies
Beauty Care
Laundry & Home Care
Operating business
units total
Corporate Henkel Group
Sales January–June 2018 879 3,823 4,702 2,000 3,213 9,915 63 9,978
Proportion of Henkel sales 9 % 38 % 47 % 20 % 32 % 99 % 1 % 100 %
Sales January–June 2017 925 3,740 4,665 2,007 3,429 10,101 60 10,162
Change from previous year – 5.0 % 2.2 % 0.8 % – 0.4 % – 6.3 % – 1.8 % 5.1 % – 1.8 %
Adjusted for foreign exchange 1.9 % 9.6 % 8.1 % 6.7 % 1.4 % 5.6 % – 5.6 %
Organic 4.1 % 5.2 % 5.0 % – 2.0 % 1.1 % 2.3 % – 2.3 %
EBIT January–June 2018 132 695 827 303 465 1,595 – 42 1,553
EBIT January–June 2017 167 710 877 304 539 1,720 – 58 1,662
Change from previous year – 21.4 % – 2.0 % – 5.7 % – 0.2 % – 13.7 % – 7.2 % – – 6.6 %
Return on sales (EBIT) January–June 2018 15.0 % 18.2 % 17.6 % 15.2 % 14.5 % 16.1 % – 15.6 %
Return on sales (EBIT) January–June 2017 18.1 % 19.0 % 18.8 % 15.1 % 15.7 % 17.0 % – 16.4 %
Adjusted EBIT January–June 2018 141 730 871 349 586 1,806 – 38 1,768
Adjusted EBIT January–June 2017 147 722 870 348 596 1,814 – 51 1,763
Change from previous year – 4.1 % 1.1 % 0.2 % 0.0 % – 1.8 % – 0.5 % – 0.3 %
Adjusted return on sales (EBIT) January–June 2018 16.1 % 19.1 % 18.5 % 17.4 % 18.2 % 18.2 % – 17.7 %
Adjusted return on sales (EBIT) January–June 2017 15.9 % 19.3 % 18.6 % 17.4 % 17.4 % 18.0 % – 17.4 %
Capital employed January–June 2018 2 848 7,616 8,464 3,774 7,287 19,526 57 19,583
Capital employed January–June 2017 2 814 7,065 7,879 2,960 7,740 18,579 65 18,644
Change from previous year 4.1 % 7.8 % 7.4 % 27.5 % – 5.9 % 5.1 % – 5.0 %
Return on capital employed (ROCE) January–June 2018 31.0 % 18.3 % 19.5 % 16.1 % 12.8 % 16.3 % – 15.9 %
Return on capital employed (ROCE) January–June 2017 41.1 % 20.1 % 22.3 % 20.5 % 13.9 % 18.5 % – 17.8 %
Amortization / depreciation / impairment / write-ups of intangible assets and property, plant and equipment January–June 2018 19 122 141 36 100 277 7 284
of which impairment losses 2018 – 9 9 – 3 12 – 12
of which write-ups 2018 – – – – – – – –
Amortization / depreciation / impairment / write-ups of intangible assets and property, plant and equipment January–June 2017 23 110 133 49 129 311 7 318
of which impairment losses 2017 – 5 5 – – 5 – 5
of which write-ups 2017 – – – – – – – –
Capital expenditures (excluding financial assets) January–June 2018 33 102 135 233 195 563 2 565
Capital expenditures (excluding financial assets) January–June 2017 39 78 117 41 185 343 4 347
Operating assets January–June 2018 3 1,436 9,710 11,146 5,177 10,487 26,810 524 27,334
Operating liabilities January–June 2018 678 2,588 3,266 1,713 2,908 7,886 466 8,352
Net operating assets January–June 2018 3 758 7,122 7,880 3,464 7,580 18,924 57 18,981
Operating assets January–June 2017 3 1,416 8,824 10,240 4,431 10,683 25,355 549 25,904
Operating liabilities January–June 2017 639 2,260 2,898 1,659 2,742 7,299 484 7,783
Net operating assets January–June 2017 3 777 6,565 7,342 2,772 7,941 18,056 65 18,121
1 Calculated on the basis of units of 1,000 euros.2 Including goodwill at cost prior to any accumulated impairment in accordance with IFRS 3.79 (b).3 Including goodwill at net book value.
Group segment report by business unit 1
Henkel Q2 Quarterly financial report / Half-year financial report 2018 27Selected explanatory notes

Performance by regionKey figures by region 1 first half year 2018
in million euros
Western Europe
Eastern Europe
Africa / Middle
East
North America
Latin America
Asia- Pacific
Corporate 2 Henkel Group
Sales January–June 2018 3,154 1,433 642 2,444 581 1,661 63 9,978
Sales January–June 2017 3,080 1,444 690 2,648 568 1,672 60 10,162
Change from previous year 2.4 % – 0.7 % – 6.9 % – 7.7 % 2.2 % – 0.7 % – – 1.8 %
Adjusted for foreign exchange 2.4 % 8.0 % 7.4 % 5.1 % 17.7 % 5.2 % – 5.6 %
Organic 0.1 % 7.9 % 6.7 % – 0.9 % 6.8 % 3.0 % – 2.3 %
Proportion of Henkel sales January–June 2018 32 % 14 % 6 % 24 % 6 % 17 % 1 % 100 %
Proportion of Henkel sales January–June 2017 30 % 14 % 7 % 26 % 6 % 16 % 1 % 100 %
Operating profit (EBIT) January – June 2018 850 142 – 18 284 69 268 – 42 1,553
Operating profit (EBIT) January–June 2017 833 138 47 361 64 277 – 58 1,662
Change from previous year 1.9 % 3.1 % – 138.8 % – 21.3 % 9.0 % – 3.2 % – – 6.6 %
Adjusted for foreign exchange 2.2 % 17.0 % – 129.7 % – 12.1 % 29.1 % 4.1 % – – 1.9 %
Return on sales (EBIT) January–June 2018 26.9 % 9.9 % – 2.8 % 11.6 % 12.0 % 16.1 % – 15.6 %
Return on sales (EBIT) January–June 2017 27.1 % 9.6 % 6.8 % 13.6 % 11.2 % 16.6 % – 16.4 %
1 Calculated on the basis of units of 1,000 euros; figures commercially rounded.2 Corporate = sales and services not assignable to the individual regions and business units.
28 Selected explanatory notes Henkel Q2 Quarterly financial report / Half-year financial report 2018
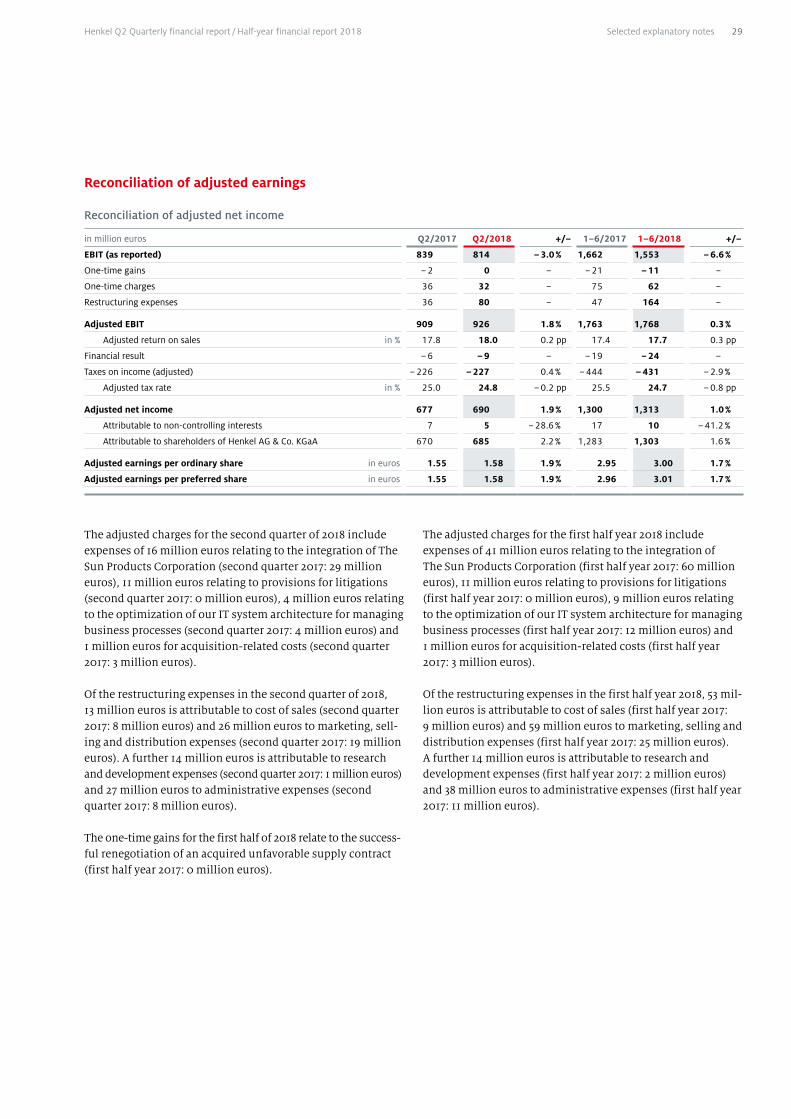
Reconciliation of adjusted earnings
Reconciliation of adjusted net income
in million euros Q2/2017 Q2/2018 +/– 1–6/2017 1–6/2018 +/–
EBIT (as reported) 839 814 – 3.0 % 1,662 1,553 – 6.6 %
One-time gains – 2 0 – – 21 – 11 –
One-time charges 36 32 – 75 62 –
Restructuring expenses 36 80 – 47 164 –
Adjusted EBIT 909 926 1.8 % 1,763 1,768 0.3 %
Adjusted return on sales in % 17.8 18.0 0.2 pp 17.4 17.7 0.3 pp
Financial result – 6 – 9 – – 19 – 24 –
Taxes on income (adjusted) – 226 – 227 0.4 % – 444 – 431 – 2.9 %
Adjusted tax rate in % 25.0 24.8 – 0.2 pp 25.5 24.7 – 0.8 pp
Adjusted net income 677 690 1.9 % 1,300 1,313 1.0 %
Attributable to non-controlling interests 7 5 – 28.6 % 17 10 – 41.2 %
Attributable to shareholders of Henkel AG & Co. KGaA 670 685 2.2 % 1,283 1,303 1.6 %
Adjusted earnings per ordinary share in euros 1.55 1.58 1.9 % 2.95 3.00 1.7 %
Adjusted earnings per preferred share in euros 1.55 1.58 1.9 % 2.96 3.01 1.7 %
The adjusted charges for the second quarter of 2018 include expenses of 16 million euros relating to the integration of The Sun Products Corporation (second quarter 2017: 29 million euros), 11 million euros relating to provisions for litigations (second quarter 2017: 0 million euros), 4 million euros relating to the optimization of our IT system architecture for managing business processes (second quarter 2017: 4 million euros) and 1 million euros for acquisition-related costs (second quarter 2017: 3 million euros).
Of the restructuring expenses in the second quarter of 2018, 13 million euros is attributable to cost of sales (second quarter 2017: 8 million euros) and 26 million euros to marketing, sell-ing and distribution expenses (second quarter 2017: 19 million euros). A further 14 million euros is attributable to research and development expenses (second quarter 2017: 1 million euros) and 27 million euros to administrative expenses (second quarter 2017: 8 million euros).
The one-time gains for the first half of 2018 relate to the success-ful renegotiation of an acquired unfavorable supply contract (first half year 2017: 0 million euros).
The adjusted charges for the first half year 2018 include expenses of 41 million euros relating to the integration of The Sun Products Corporation (first half year 2017: 60 million euros), 11 million euros relating to provisions for litigations (first half year 2017: 0 million euros), 9 million euros relating to the optimization of our IT system architecture for managing business processes (first half year 2017: 12 million euros) and 1 million euros for acquisition-related costs (first half year 2017: 3 million euros).
Of the restructuring expenses in the first half year 2018, 53 mil-lion euros is attributable to cost of sales (first half year 2017: 9 million euros) and 59 million euros to marketing, selling and distribution expenses (first half year 2017: 25 million euros). A further 14 million euros is attributable to research and development expenses (first half year 2017: 2 million euros) and 38 million euros to administrative expenses (first half year 2017: 11 million euros).
Henkel Q2 Quarterly financial report / Half-year financial report 2018 29Selected explanatory notes
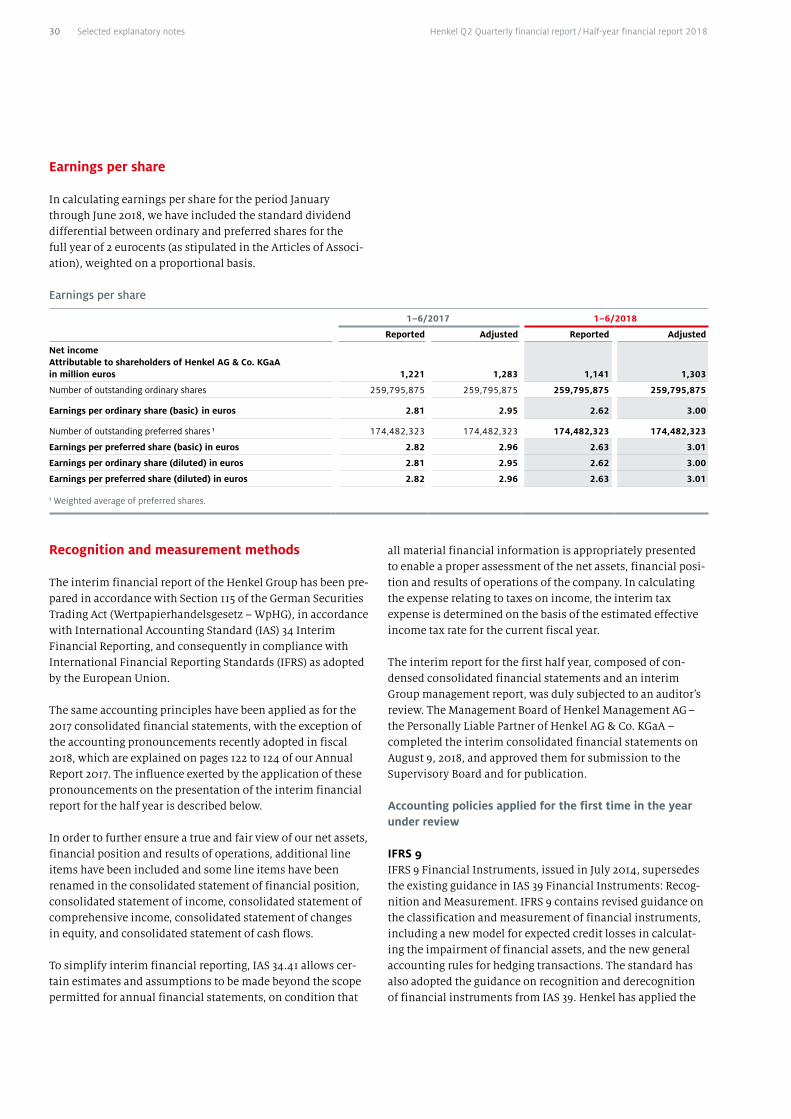
Earnings per share
In calculating earnings per share for the period January through June 2018, we have included the standard dividend differential between ordinary and preferred shares for the full year of 2 eurocents (as stipulated in the Articles of Associ-ation), weighted on a proportional basis.
Earnings per share
1–6/2017 1–6/2018
Reported Adjusted Reported Adjusted
Net income Attributable to shareholders of Henkel AG & Co. KGaA in million euros 1,221 1,283 1,141 1,303
Number of outstanding ordinary shares 259,795,875 259,795,875 259,795,875 259,795,875
Earnings per ordinary share (basic) in euros 2.81 2.95 2.62 3.00
Number of outstanding preferred shares 1 174,482,323 174,482,323 174,482,323 174,482,323
Earnings per preferred share (basic) in euros 2.82 2.96 2.63 3.01
Earnings per ordinary share (diluted) in euros 2.81 2.95 2.62 3.00
Earnings per preferred share (diluted) in euros 2.82 2.96 2.63 3.01
1 Weighted average of preferred shares.
Recognition and measurement methods
The interim financial report of the Henkel Group has been pre-pared in accordance with Section 115 of the German Securities Trading Act (Wertpapierhandelsgesetz – WpHG), in accordance with International Accounting Standard (IAS) 34 Interim Financial Reporting, and consequently in compliance with International Financial Reporting Standards (IFRS) as adopted by the European Union.
The same accounting principles have been applied as for the 2017 consolidated financial statements, with the exception of the accounting pronouncements recently adopted in fiscal 2018, which are explained on pages 122 to 124 of our Annual Report 2017. The influence exerted by the application of these pronouncements on the presentation of the interim financial report for the half year is described below.
In order to further ensure a true and fair view of our net assets, financial position and results of operations, additional line items have been included and some line items have been renamed in the consolidated statement of financial position, consolidated statement of income, consolidated statement of comprehensive income, consolidated statement of changes in equity, and consolidated statement of cash flows.
To simplify interim financial reporting, IAS 34.41 allows cer-tain estimates and assumptions to be made beyond the scope permitted for annual financial statements, on condition that
all material financial information is appropriately presented to enable a proper assessment of the net assets, financial posi-tion and results of operations of the company. In calculating the expense relating to taxes on income, the interim tax expense is determined on the basis of the estimated effective income tax rate for the current fiscal year.
The interim report for the first half year, composed of con-densed consolidated financial statements and an interim Group management report, was duly subjected to an auditor’s review. The Management Board of Henkel Management AG – the Personally Liable Partner of Henkel AG & Co. KGaA – completed the interim consolidated financial statements on August 9, 2018, and approved them for submission to the Supervisory Board and for publication.
Accounting policies applied for the first time in the year under review IFRS 9IFRS 9 Financial Instruments, issued in July 2014, supersedes the existing guidance in IAS 39 Financial Instruments: Recog-nition and Measurement. IFRS 9 contains revised guidance on the classification and measurement of financial instruments, including a new model for expected credit losses in calculat-ing the impairment of financial assets, and the new general accounting rules for hedging transactions. The standard has also adopted the guidance on recognition and derecognition of financial instruments from IAS 39. Henkel has applied the
30 Selected explanatory notes Henkel Q2 Quarterly financial report / Half-year financial report 2018
classification and measurement rules of IFRS 9 retrospectively as of January 1, 2018, in accordance with the transitional requirements, and has exercised the option of presenting prior-year periods under IAS 39. The rules for hedge account-ing have been applied prospectively.
Classification: IFRS 9 contains three categories for classifying financial assets: measured at amortized cost, measured at fair value through profit or loss and measured at fair value through other comprehensive income. The standard eliminates the categories held to maturity, loans and receivables and avail-able for sale that were specified in IAS 39. Financial instru-ments must be allocated to the IFRS 9 categories on the basis of the business model in which the financial instruments are held, and on the basis of the contractual cash flows. Most of the financial instruments recognized by Henkel at amortized cost under IAS 39 will continue to be recognized at amortized cost under IFRS 9. The cash flows relating to these financial instruments consist solely of principal and interest and are held by Henkel in a business model whose objective is to col-lect contractual cash flows. Together with securities and time deposits, certain investments in money market funds included in cash and cash equivalents will be measured at fair value through profit or loss in future. Henkel holds these financial instruments with the intention of selling them to cover its cash flow needs. Reconciliation of the valuation cat-egories and carrying amounts from IAS 39 to IFRS 9 is shown in the table starting on page 34. The Group exercises its right to recognize changes in the fair value of equity instruments in other comprehensive income on an instrument-by-instrument basis. Accordingly, upon application of IFRS 9 starting on Jan-uary 1, 2018, losses of less than 1 million euros were reclassi-fied from retained earnings to the equity and debt instruments reserve.
The application of IFRS 9 has not affected the presentation of Henkel Group’s financial liabilities.
Impairment: Under IAS 39, valuation allowances were only recognized for impairment that had occurred but was as yet unidentified (incurred loss model), whereas IFRS 9 takes into account expected credit losses when quantifying valuation allowances (expected loss model). Valuation allowances must be recognized for all financial assets measured at amortized cost and for all debt instruments measured at fair value through comprehensive income.
Generally, IFRS 9 provides a three-level model for this purpose. Impairment losses are recognized either on the basis of the expected 12-month credit losses (level 1) or on the basis of the credit losses expected over the lifetime of the asset if the credit risk has increased significantly since initial recognition (level 2), or if the asset is credit-impaired (level 3). The simplified approach is used for most of the financial assets, including trade accounts receivable that do not contain a material financing component. Here, expected credit losses are deter-mined over the entire lifetime of the financial instruments.
To calculate expected credit losses, counterparties are grouped by similar credit risks. Individual valuation allowances are recognized on a case-by-case basis to reflect specific circum-stances and risk indicators. The calculation of the valuation allowance amounts includes both data from the past – histori-cal default rates, for example – and information relating to the future, such as individual and macroeconomic conditions. Default rates are initially determined on the basis of both data from external sources and actual defaults. In future, this infor-mation will increasingly be based on actual defaults.
In the event of a default of a counterparty, all outstanding receivables are impaired. In this case, the default is deter-mined on the basis of individual assessment, such as notice-able changes in payment behavior. A financial instrument is derecognized when, after due consideration, a financial asset is not expected to be recoverable partly or in total, for example after completion of insolvency proceedings or in recognition of other local legislation requirements.
Upon its first-time application on January 1, 2018, IFRS 9 resulted in an increase in valuation allowances of 13 million euros on trade accounts receivable, this being recognized through other comprehensive income in retained earnings.
Henkel Q2 Quarterly financial report / Half-year financial report 2018 31Selected explanatory notes

Hedge accounting: Henkel applies the new IFRS 9 rules for hedge accounting. In doing so, the Group ensures that its hedge accounting is consistent with the Group risk manage-ment objectives and strategy and that a qualitative and for-ward-looking approach is adopted when assessing the effec-tiveness of its hedging transactions.
Within the Henkel Group, forward exchange contracts are used to hedge future cash flows in foreign currencies. The Group only designates the spot component of these hedging transac-tions. The (effective) portion of the change in fair value of the spot component is recognized in the hedge reserve in equity. When hedging cash flows for non-financial assets, the amounts are included as part of the cost of purchase upon rec-ognition of the underlying. The amounts recognized in the hedge reserve or as part of the cost of purchase impact profit or loss in the period in which the hedged transaction influ-ences those earnings. The non-designated components are also recognized in the hedge reserve and – when hedging non-financial assets – included as part of the cost of purchase upon recognition of the underlying.
IFRS 15In May 2014, the IASB published the new IFRS 15 Revenue from Contracts with Customers. IFRS 15 specifies a comprehensive framework for determining whether, when and in what amount revenue is recognized. Under IFRS 15, revenue is only recognized when no substantial adjustments to the cumula-tive recognized revenue are expected. The standard specifies that, when control of goods or intangible assets passes to a customer or when services are provided, the consideration for transfer or provision must be recognized as revenue.
This principle is applied in five steps. In step 1, the contract with the customer is identified. In step 2, the distinct perfor-mance obligations in the contract are identified. In step 3, the transaction price is determined. In step 4, this transaction price is allocated to the distinct performance obligations. Finally, in step 5, revenue is recognized when the identified distinct performance obligations are satisfied, either over time or at a point in time.
The objective of the new standard is to bring together the dif-ferent regulations contained in various other standards and interpretations. It replaces the existing guidance on revenue recognition, including IAS 18 Revenue, IAS 11 Construction Contracts, and IFRIC 13 Customer Loyalty Programmes. Clarify-ing amendments to IFRS 15 were published in April 2016, pri-marily relating to the identification of separate performance obligations and the clear distinction between principals and agents.
Upon first-time adoption of IFRS 15, Henkel applied the cumu-lative method to all contracts, according to which the effects of first-time application must be recognized cumulatively in equity upon first-time application as of January 1, 2018.
Henkel’s first-time application of IFRS 15 resulted, firstly, in changes to the accounting procedure for product returns. If goods are sold with a right of return, IFRS 15 forbids the recog-nition of revenue for goods that are likely to be returned. In addition to the provision for the product return, an asset needs to be recognized for the right of return in the case of goods where the returns can be reliably estimated.
Secondly, IFRS 15 specifies new regulations governing the accounting procedure for variable considerations with impact on the timing of sales deductions.
Application of IFRS 15 resulted overall in an increase of 11 mil-lion euros in sundry current assets and of 71 million euros in other current provisions, leading to a reduction in equity of 60 million euros before, and of 46 million euros after, deduction of deferred taxes. The statements of financial position and income for the comparable period have not been adjusted. As of June 30, 2018, the increase in sundry current assets attribut-able to the new IFRS 15 rules amounted to 14 million euros and the increase in other current provisions to 73 million euros. Under the former rules, revenues as of June 30, 2018, would have been 2 million euros higher and cost of sales 3 million euros lower.
For details of the disaggregation of revenues under IAS 34.16A (l) in conjunction with IFRS 15.114 and IFRS 15.115, please refer to the Group segment report by business unit and to the key financials by region starting on page 26.
32 Selected explanatory notes Henkel Q2 Quarterly financial report / Half-year financial report 2018

Scope of consolidation
In addition to Henkel AG & Co. KGaA as the ultimate parent company, the scope of consolidation at June 30, 2018, included 15 German and 219 non-German companies in which Henkel AG & Co. KGaA has a dominating influence over financial and operating policies, based on the concept of control. The Group has a dominating influence on a company when it is exposed, or has rights, to variable returns from its involvement with the company and has the ability to affect those returns through its power over the company.
The following table shows the changes to the scope of consoli-dation compared to December 31, 2017:
Scope of consolidation
At 1 January 2018 242
Additions 5
Mergers – 11
Disposals – 1
At 30 June 2018 235
The changes in the scope of consolidation have not had any material effect on the main items of the consolidated financial statements.
Acquisitions and divestments
Effective January 3, 2018, we completed the acquisition of all shares of Unión Técnico Comercial S.R.L. based in Lima, Peru. The purchase price was 15 million euros, settled in cash. The acquisition strengthens the market position of the General Industry business of Adhesive Technologies in the field of maintenance, repair and overhaul in Latin America.
Effective June 1, 2018, we completed the acquisition of all shares of JemPak Corporation based in Concord, Canada. The purchase price was 78 million euros, settled in cash. The acquisition complements and strengthens the existing Laundry & Home Care portfolio in North America and will help to further expand Henkel’s position in this attractive market and to strengthen our leading position in the retailer brands category in North America.
Consolidated statement of comprehensive income
Of the components included in other comprehensive income, tax expenses relating to actuarial gains amount to 16 million euros (June 30, 2017: tax income of 65 million euros) and tax expenses relating to cash flow hedges amount to 1 million euros (June 30, 2017: tax income of 2 million euros).
Henkel Q2 Quarterly financial report / Half-year financial report 2018 33Selected explanatory notes
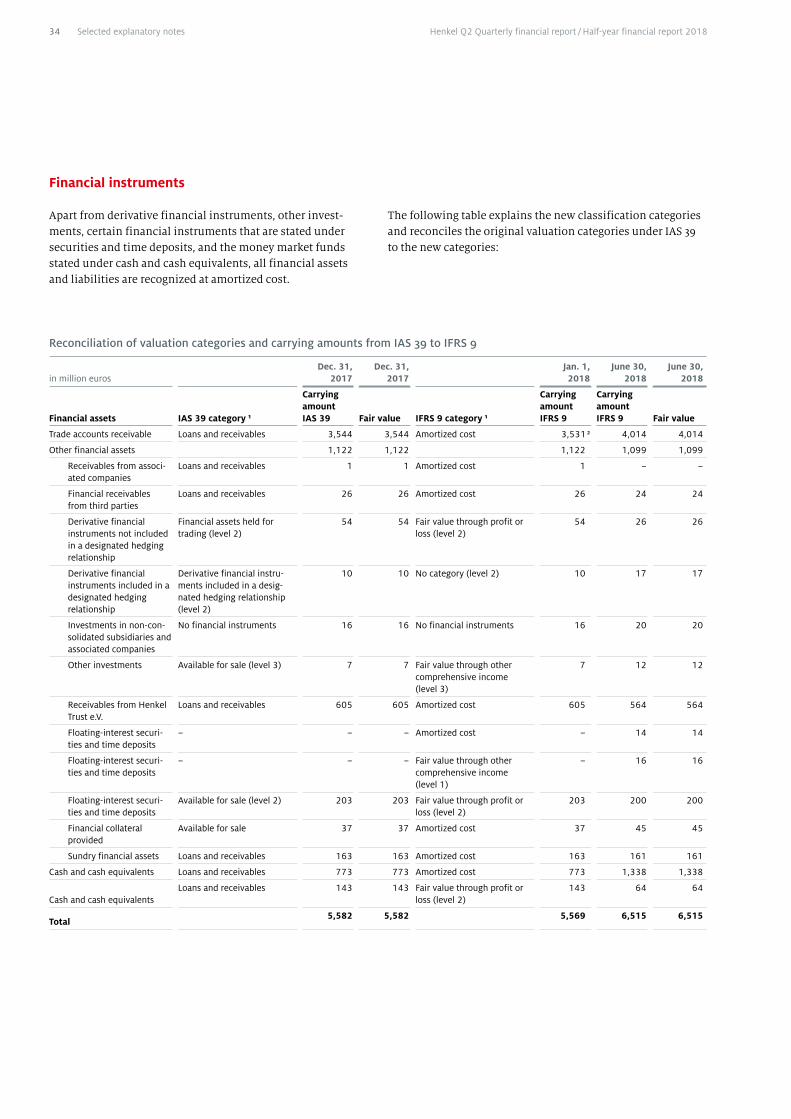
Financial instruments
Apart from derivative financial instruments, other invest-ments, certain financial instruments that are stated under securities and time deposits, and the money market funds stated under cash and cash equivalents, all financial assets and liabilities are recognized at amortized cost.
The following table explains the new classification categories and reconciles the original valuation categories under IAS 39 to the new categories:
Reconciliation of valuation categories and carrying amounts from IAS 39 to IFRS 9
in million eurosDec. 31,
2017Dec. 31,
2017Jan. 1, 2018
June 30, 2018
June 30, 2018
Financial assets IAS 39 category 1
Carrying amount IAS 39 Fair value IFRS 9 category 1
Carrying amount IFRS 9
Carrying amount IFRS 9 Fair value
Trade accounts receivable Loans and receivables 3,544 3,544 Amortized cost 3,531 2 4,014 4,014
Other financial assets 1,122 1,122 1,122 1,099 1,099
Receivables from associ-ated companies
Loans and receivables 1 1 Amortized cost 1 – –
Financial receivables from third parties
Loans and receivables 26 26 Amortized cost 26 24 24
Derivative financial instruments not included in a designated hedging relationship
Financial assets held for trading (level 2)
54 54 Fair value through profit or loss (level 2)
54 26 26
Derivative financial instruments included in a designated hedging relationship
Derivative financial instru-ments included in a desig-nated hedging relationship (level 2)
10 10 No category (level 2) 10 17 17
Investments in non-con-solidated subsidiaries and associated companies
No financial instruments 16 16 No financial instruments 16 20 20
Other investments Available for sale (level 3) 7 7 Fair value through other comprehensive income (level 3)
7 12 12
Receivables from Henkel Trust e.V.
Loans and receivables 605 605 Amortized cost 605 564 564
Floating-interest securi-ties and time deposits
– – – Amortized cost – 14 14
Floating-interest securi-ties and time deposits
– – – Fair value through other comprehensive income (level 1)
– 16 16
Floating-interest securi-ties and time deposits
Available for sale (level 2) 203 203 Fair value through profit or loss (level 2)
203 200 200
Financial collateral provided
Available for sale 37 37 Amortized cost 37 45 45
Sundry financial assets Loans and receivables 163 163 Amortized cost 163 161 161
Cash and cash equivalents Loans and receivables 773 773 Amortized cost 773 1,338 1,338
Cash and cash equivalentsLoans and receivables 143 143 Fair value through profit or
loss (level 2) 143 64 64
Total 5,582 5,582 5,569 6,515 6,515
34 Selected explanatory notes Henkel Q2 Quarterly financial report / Half-year financial report 2018

Reconciliation of valuation categories and carrying amounts from IAS 39 to IFRS 9 (continued)
in million eurosDec. 31,
2017Dec. 31,
2017Jan. 1, 2018
June 30, 2018
June 30, 2018
Financial liabilities IAS 39 category
Carrying amount IAS 39 Fair value IFRS 9 category
Carrying amount IFRS 9
Carrying amount IFRS 9 Fair value
Trade accounts payable Amortized cost 3,717 3,717 Amortized cost 3,717 3,972 3,972
Bonds Amortized cost (level 1) 2,666 2,662 Amortized cost (level 1) 2,666 2,700 2,684
Other borrowings Amortized cost 1,678 1,678 Amortized cost 1,678 2,536 2,536
Other financial liabilities 299 299 299 247 247
Derivative financial instruments not included in a designated hedging relationship
Financial assets held for trading
61 61 Fair value through profit or loss
61 21 21
Derivative financial instruments included in a designated hedging relationship
Derivative financial instru-ments included in a desig-nated hedging relationship
39 39 No category 39 48 48
Others Amortized cost 199 199 Amortized cost 199 178 178
Total 8,360 8,356 8,360 9,455 9,439
1 Indication of the hierarchy level of fair values for the figures indicated in the “Fair values” column.2 Upon first-time application of IFRS 9, the carrying amount of trade accounts receivable decreased by 13 million euros due to higher valuation
allowances.
No reclassifications between categories were necessary in the first half year.
During the reporting period, we prematurely repaid our syndi-cated bank loan of 1.1 billion US dollars in full and increased our outstanding commercial papers by 1.7 billion euros to 2.4 billion euros.
The following hierarchy is applied in order to determine and disclose the fair value of financial instruments: • Level 1: Fair values which are determined on the basis of
quoted, unadjusted prices in active markets.• Level 2: Fair values which are determined on the basis of
parameters for which either directly or indirectly derived market prices are available.
• Level 3: Fair values which are determined on the basis of parameters for which the input factors are not derived from observable market data.
The fair value of securities and time deposits, and investments in money market funds, classified as level 2 is based on the quoted market prices on the reporting date. For forward exchange contracts and cross-currency interest rate swaps, we determine the fair value on the basis of the reference exchange rates of the European Central Bank prevailing at the reporting date, taking into account forward premiums / forward discounts for the remaining term of the respective contract versus the contracted foreign exchange rate. Foreign exchange options are measured using price quotations or recognized models for the determination of option prices.
We measure interest rate hedging instruments on the basis of discounted cash flows expected in the future, taking into account market interest rates applicable for the remaining term of the contracts. These are indicated for the two most important currencies in the following table. It shows the inter-est rates quoted on the interbank market in each case on December 31 and June 30.
Interest rates in percent p. a.
At Dec. 31/June 30Term
Euro US dollar
2017 2018 2017 2018
1 month – 0.37 – 0.42 1.56 2.14
3 months – 0.33 – 0.38 1.69 2.39
6 months – 0.27 – 0.32 1.84 2.56
1 year – 0.19 – 0.22 2.11 2.83
2 years – 0.15 – 0.17 2.68 2.76
5 years 0.31 0.27 2.25 2.86
10 years 0.89 0.89 2.40 2.90
The fair value of the other investments is based either on information derived from recent financing transactions, using a cost-based method, or is determined from a business valua-tion using the discounted cash flow method taking into account the free cash flows of the investment (level 3). The discount rate applied takes into account respective risk-adjusted capital costs.
Henkel Q2 Quarterly financial report / Half-year financial report 2018 35Selected explanatory notes
When measuring derivative financial instruments, counter-party credit risk is taken into account with an adjustment to the fair values concerned determined on the basis of credit risk premiums.
Determination of the fair value of the contingent purchase price liability recognized under other financial liabilities and resulting from our acquisition in Nigeria is assignable to level 3. At December 31, 2017, the fair value of the contingent purchase price liability was 27 million euros. At June 30, 2018, this value had increased by 4 million euros to 31 million euros, primarily as a result of remeasurement in the first half year 2018. The measurement effects were recognized directly in equity and reported in the statement of changes in equity as other changes in equity. The fair value was determined using the discounted cash flow method, taking into account the free cash flows of the acquired company based on a detailed planning horizon up to 2025. A discount rate was applied as derived from the capital costs in euros. A further material valuation parameter – in addition to the long-term growth rate reflected in the perpetual annuity of 1.5 percent and the weighted average cost of capital (WACC) of 9.9 percent that was used as the discount rate – is the exchange rate of the Nigerian naira. A rise in interest rates or a depreciation of the naira would result in a lower negative fair value of the liability. An interest rate reduction or an appreciation of the naira would result in a higher fair value.
Voting rights / Related party disclosures
The company has been notified that, on December 17, 2015, the proportion of voting rights held by the members of the Henkel family share-pooling agreement represented in total a share of 61.02 percent of the voting rights (158,535,741 votes) in Henkel AG & Co. KGaA.
Notes to the Group segment report
There have been no changes in the basis by which the seg-ments are classified or in the presentation of the segment results as compared to the consolidated financial statements of December 31, 2017. For definitions of net operating assets, capital employed and ROCE, please refer to our Annual Report 2017, pages 169 and 194.
Notes to the consolidated statement of cash flows
The main items of the consolidated statement of cash flows and the changes thereto are explained on page 25. The other changes in borrowings take into account a number of cash inflows and outflows, particularly arising from the issuance and redemption of commercial papers and current liabilities to banks. Of the dividend of 772 million euros paid to share-holders of Henkel AG & Co. KGaA, an amount of 460 million euros was paid on ordinary shares, while an amount of 312 million euros was paid on preferred shares.
36 Selected explanatory notes Henkel Q2 Quarterly financial report / Half-year financial report 2018
Subsequent events
On July 13, 2018, we signed an agreement to acquire Aislantes Nacionales S.A., Santiago, Chile. With this acquisition Henkel will enter into the attractive Chilean market for tile adhesives and building materials in a strong position. In fiscal 2017, Aislantes Nacionales S.A. generated sales of around 80 million euros. The acquisition is not expected to have any significant impact on Henkel’s net assets, financial position and results of operations.
Düsseldorf, August 9, 2018
Henkel Management AG, Personally Liable Partner of Henkel AG & Co. KGaA
Management Board Hans Van Bylen, Jan-Dirk Auris, Carsten Knobel, Kathrin Menges, Bruno Piacenza, Jens-Martin Schwärzler
Henkel Q2 Quarterly financial report / Half-year financial report 2018 37Selected explanatory notes
To Henkel AG & Co. KGaA, Düsseldorf:
We have reviewed the condensed interim consolidated finan-cial statements – comprising the consolidated statement of financial position, the consolidated statement of income, the consolidated statement of comprehensive income, the consolidated statement of changes in equity, the consolidated statement of cash flows, and selected notes – and the interim Group management report (pages 4 to 19) of Henkel AG & Co. KGaA, Düsseldorf, for the period from January 1, 2018 to June 30, 2018, which form part of the half-year financial report in accordance with Section 115 of the German Securities Trading Act (Wertpapierhandelsgesetz – WpHG).
The preparation of the condensed interim consolidated finan-cial statements in accordance with International Accounting Standard (IAS) 34 Interim Financial Reporting as adopted by the EU, and of the interim Group management report in accor-dance with the requirements of the German Securities Trading Act applicable to interim group management reports, is the responsibility of the Company’s legal representatives. Our responsibility is to issue a report on the condensed interim consolidated financial statements and on the interim Group management report based on our review.
We conducted our review of the condensed interim consoli-dated financial statements and the interim Group manage-ment report in accordance with the German generally accepted standards for the review of financial statements promulgated by the Institut der Wirtschaftsprüfer (IDW) and in supplemen-tary compliance with the International Standard on Review Engagements 2410 (ISRE 2410). Those standards require that we plan and perform the review so that we can preclude through critical evaluation, with a certain level of assurance, that the condensed interim consolidated financial statements have not been prepared, in material aspects, in accordance with IAS 34 Interim Financial Reporting as adopted by the EU, and that the interim Group management report has not been prepared, in material aspects, in accordance with the regula-tions of the German Securities Trading Act applicable to interim group management reports. A review is limited pri-marily to inquiries of company employees and analytical assessments and therefore does not provide the assurance attainable in a financial statement audit. Since, in accordance with our engagement, we have not performed a financial state-ment audit, we cannot issue an auditor’s report.
Based on our review, no matters have come to our attention that cause us to believe that the condensed interim consoli-dated financial statements have not been prepared, in material respects, in accordance with IAS 34 Interim Financial Report-ing as adopted by the EU, or that the interim Group manage-ment report has not been prepared, in material respects, in accordance with the regulations of the German Securities Trading Act applicable to interim group management reports.
Düsseldorf, August 9, 2018
KPMG AG Wirtschaftsprüfungsgesellschaft
Becker RohrbachWirtschaftsprüfer Wirtschaftsprüfer (German Public Auditor) (German Public Auditor)
Independent review report
Henkel Q2 Quarterly financial report / Half-year financial report 201838
To the best of our knowledge, and in accordance with the applicable accounting principles for interim financial report-ing, the interim consolidated financial statements for the half year give a true and fair view of the net assets, financial posi-tion and results of operations of the Group, and the interim management report of the Group includes a fair review of the development, performance and results of the business and the position of the Group, together with a cogent description of the principal opportunities and risks associated with the expected development of the Group over the remainder of the fiscal year.
Düsseldorf, August 9, 2018
Henkel Management AG, Personally Liable Partner of Henkel AG & Co. KGaA
Management Board Hans Van Bylen, Jan-Dirk Auris, Carsten Knobel, Kathrin Menges, Bruno Piacenza, Jens-Martin Schwärzler
Responsibility statement
Henkel Q2 Quarterly financial report / Half-year financial report 2018 39
In the meeting of August 9, 2018, the interim consolidated financial report for the first six months of fiscal 2018 and the report prepared by KPMG AG, Wirtschaftsprüfungsgesellschaft, on its review of the condensed interim consolidated financial statements and the interim Group management report were presented to the Audit Committee, who also received verbal explanations from the Management Board and KPMG pertain-ing to the above. The Audit Committee has approved and endorses the interim consolidated financial report.
Düsseldorf, August 9, 2018
Chairman of the Audit Committee Prof. Dr. Theo Siegert
Report of the Audit Committee of the Supervisory Board
Henkel Q2 Quarterly financial report / Half-year financial report 201840
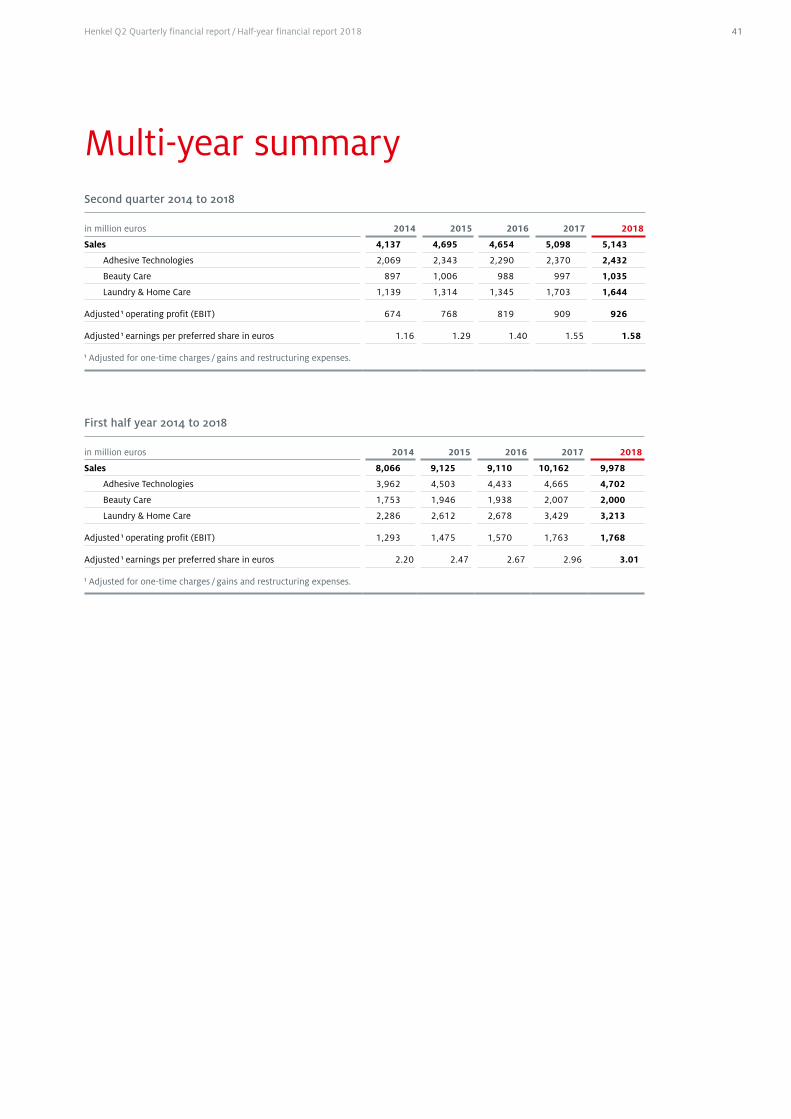
Multi-year summarySecond quarter 2014 to 2018
in million euros 2014 2015 2016 2017 2018
Sales 4,137 4,695 4,654 5,098 5,143
Adhesive Technologies 2,069 2,343 2,290 2,370 2,432
Beauty Care 897 1,006 988 997 1,035
Laundry & Home Care 1,139 1,314 1,345 1,703 1,644
Adjusted 1 operating profit (EBIT) 674 768 819 909 926
Adjusted 1 earnings per preferred share in euros 1.16 1.29 1.40 1.55 1.58
1 Adjusted for one-time charges / gains and restructuring expenses.
First half year 2014 to 2018
in million euros 2014 2015 2016 2017 2018
Sales 8,066 9,125 9,110 10,162 9,978
Adhesive Technologies 3,962 4,503 4,433 4,665 4,702
Beauty Care 1,753 1,946 1,938 2,007 2,000
Laundry & Home Care 2,286 2,612 2,678 3,429 3,213
Adjusted 1 operating profit (EBIT) 1,293 1,475 1,570 1,763 1,768
Adjusted 1 earnings per preferred share in euros 2.20 2.47 2.67 2.96 3.01
1 Adjusted for one-time charges / gains and restructuring expenses.
Henkel Q2 Quarterly financial report / Half-year financial report 2018 41
Corporate CommunicationsPhone: +49 (0) 211-797-3533 Fax: +49 (0) 211-798-2484 E-mail: [email protected]
Investor RelationsPhone: +49 (0) 211-797-3937 Fax: +49 (0) 211-798-2863 E-mail: [email protected]
Contacts
Published by: Henkel AG & Co. KGaA 40191 Düsseldorf, Germany Phone: +49 (0) 211-797-0
© 2018 Henkel AG & Co. KGaA
Edited by: Corporate Communications, Investor Relations, Corporate Accounting Coordination: Lars Korinth, Rabea Laakmann, Dr. Hannes Schollenberger English translation: SDL plc Design and typesetting: MPM Corporate Communication Solutions, Mainz Pre-print proofing: Paul Knighton, Cambridge; Thomas Krause, Krefeld Printed by: Druckpartner, Essen
Date of publication of this Report: August 16, 2018
PR No.: 08 18 250
Credits
This quarterly and half-year financial report is printed on LuxoArt Silk FSC. The paper is made from pulp bleached without chlorine. It has been certified and verified in accordance with the rules of the Forest Stewardship Council (FSC). The printing inks contain no heavy metals.
Except as otherwise noted, all marks used in this publication are trademarks and / or registered trademarks of the Henkel Group in Germany and elsewhere.
This document contains forward-looking statements which are based on the current estimates and assumptions made by the corporate management of Henkel AG & Co. KGaA. Forward-looking statements are characterized by the use of words such as expect, intend, plan, predict, assume, believe, estimate, anticipate, forecast and simi-lar formulations. Such statements are not to be understood as in any way guarantee-ing that those expectations will turn out to be accurate. Future performance and the results actually achieved by Henkel AG & Co. KGaA and its affiliated companies depend on a number of risks and uncertainties and may therefore differ materially from the forward-looking statements. Many of these factors are outside Henkel’s con-trol and cannot be accurately estimated in advance, such as the future economic environment and the actions of competitors and others involved in the marketplace. Henkel neither plans nor undertakes to update forward-looking statements. This doc-ument has been issued for information purposes only and is not intended to consti-tute an investment advice or an offer to sell securities, or a solicitation of an offer to buy securities.
Henkel Q2 Quarterly financial report / Half-year financial report 201842
Financial calendarPublication of Statement for the Third Quarter / Nine Months 2018: Thursday, November 15, 2018
Publication of Report for Fiscal 2018: Thursday, February 21, 2019
Annual General Meeting Henkel AG & Co. KGaA 2019: Monday, April 8, 2019
Up-to-date facts and figures on Henkel also available on the internet:
www.henkel.com
Henkel Q2 Quarterly financial report / Half-year financial report 2018 43

Henkel AG & Co. KGaA40191 Düsseldorf, GermanyPhone: +49 (0) 211-797-0www.henkel.com