quarterly financial statements - bashundharapapermills.com
TRANSCRIPT

Quarterly Financial Statements For the Quarter Ended March 31, 2021
Bashundhara Paper Mills Ltd.
Phone: +88 02 8432289-93
Fax: +88 02 55037257
[email protected] www.bashundharapapermills.com
Plot# 125/A, Road# 2,
Block# A, Bashundhara
R/A, Dhaka-1229,
Bangladesh
Phone: +88 02
8432008-17 Fax: +88

Contents
01 Statement of Financial Position 1
02 Statement of Profit or Loss and Other Comprehensive Income 2
03 Statement of Changes in Equity 3
04 Statement Cash Flows 4
05 Selected Explanatory Notes to the Financial Statements 5-10

BASHUNDHARA PAPER MILLS LIMITED Statement of financial position
As at 31 March 202131-Mar-21 30-Jun-20
ASSETSNon-current assets 17,760,925,725 17,200,941,398
Property, plant and equipment, net 15,799,793,982 15,407,776,066
Intangible Assets, net 151,591,229 158,794,592
Right-of-use assets 28,567,126 41,169,020
Capital work-in-progress 1,515,973,387 1,328,201,720 Investment 265,000,000 265,000,000
Current assets 12,829,190,160 10,343,421,434
Inventories 8,680,772,958 7,464,742,402
Trade and other receivables 2,277,504,505 1,404,774,156
Advances, deposits and prepayments 877,358,528 708,955,164
Advance income tax 401,496,293 483,959,470 Cash and bank equivalents 592,057,878 280,990,242
Total assets 30,590,115,885 27,544,362,832
EQUITY AND LIABILITIESCapital and reserves 7,901,457,840 7,727,026,535
Share capital 2 1,737,914,410 1,737,914,410
Share premium 3 1,739,583,292 1,739,583,292
Revaluation reserve 4 2,058,109,453 2,072,945,223 Retained earnings 5 2,365,850,685 2,176,583,610
LiabilitiesNon-current Liability 14,100,098,498 12,713,532,431
Long term borrowings 12,608,769,378 11,181,370,158
Lease Liabilities 240,213,804 343,036,876 Deferred tax liability 6 1,251,115,316 1,189,125,397
Current liabilities 8,588,559,547 7,103,803,866
Long term borrowings-current portion 1,970,045,826 1,974,333,458
Short term borrowings 5,153,201,238 3,126,622,374
Trade and other payables 1,024,597,537 1,576,257,948
Provision for expenses 280,400,407 110,078,848 Income tax provision 160,314,539 316,511,236
Total liabilities 22,688,658,045 19,817,336,297 Total equity and liabilities 30,590,115,885 27,544,362,832
Net Asset Value Per Share 10 44.59 43.55
Sd/- Sd/- Sd/-
Chief Financial Officer Company Secretary
Sd/- Sd/-
Director Chairman
NotesAmount in Taka
The annexed notes form an integral part of these financial statements.
Managing Director
Financial Statements March 31, 2021 I 1

BASHUNDHARA PAPER MILLS LIMITED Statement of profit or loss and other comprehensive income
for the period ended 31 March 202101-Jul-2020 to
31-Mar-2021
01-Jul-2019 to
31-Mar-2020
01-Jan-2021 to
31-Mar-2021
01-Jan-2020 to
31-Mar-2020
Revenue, net 7,132,035,125 7,271,720,726 2,754,920,746 2,566,612,883
Cost of sales (5,746,740,617) (5,820,232,724) (2,302,508,883) (2,178,366,459)
Gross profit 1,385,294,508 1,451,488,002 452,411,863 388,246,423
Other income 63,522,750 55,312,954 21,678,279 23,457,387
Administrative expenses (274,235,561) (253,310,552) (114,156,905) (75,237,618)
Selling & distribution expenses (139,480,813) (148,102,861) (42,806,737) (23,082,766)
Finance costs (774,090,699) (798,548,539) (271,928,116) (259,985,619)
Profit before distribution of WPP & WF 261,010,186 306,839,004 45,198,384 53,397,808
Workers' profit participation & welfare fund (13,050,509) (15,341,950) (2,259,919) (2,669,890)
Profit before tax 247,959,676 291,497,054 42,938,465 50,727,917
Income tax expenses 7 (47,486,705) (116,514,416) 30,034,081 (28,088,894)
Current tax expense 14,503,214 (43,640,153) 40,768,697 (15,406,916)
Deferred tax (expense)/income (61,989,919) (72,874,263) (10,734,616) (12,681,979)
Profit after tax 200,472,971 174,982,638 72,972,546 22,639,023
Other comprehensive income
Items that will not be reclassified subsequently to profit or loss - - - -
Items that may be reclassified subsequently to profit or loss - - - -
Total Comprehensive Income for the period 200,472,971 174,982,638 72,972,546 22,639,023
Earnings per share
Basic earnings per share (per value of Tk. 10) 8 1.15 1.01 0.42 0.13
Sd/- Sd/- Sd/-
Chief Financial Officer Company Secretary
Sd/- Sd/-
Director Chairman
Notes
Managing Director
The annexed notes form an integral part of these financial statements.
Amount in Taka
Financial Statements March 31, 2021 I 2

BASHUNDHARA PAPER MILLS LIMITED Statement of changes in equity for the period ended 31 March 2021
Share
Capital
Balance as on 01 July 2019 1,737,914,410 1,739,583,292 2,092,726,250 1,910,028,348 7,480,252,300
Transfer to retained earnings - - (14,835,770) 14,835,770 -
Payment of cash dividend - - - (39,062,499) (39,062,499)
Total Comprehensive Income for the period - - - 174,982,638 174,982,638
Balance as at 31 March 2020 1,737,914,410 1,739,583,292 2,077,890,480 2,060,784,256 7,616,172,438
Balance as at 01 July 2020 1,737,914,410 1,739,583,292 2,072,945,224 2,176,583,610 7,727,026,535
Transfer to retained earnings - - (14,835,770) 14,835,770 -
Payment of cash dividend - - - (26,041,666) (26,041,666)
Total Comprehensive Income for the period - - - 200,472,971 200,472,971
Balance as at 31 March 2021 1,737,914,410 1,739,583,292 2,058,109,453 2,365,850,685 7,901,457,840
Sd/- Sd/- Sd/-
Company Secretary
Sd/- Sd/-
Director Chairman
Total
Equity
Amount in Taka
Managing Director
Revaluation
Reserve
Retained
Earnings
Chief Financial Officer
Share
Premium
Financial Statements March 31, 2021 I 3

BASHUNDHARA PAPER MILLS LIMITED Statement of cash flows
for the period ended 31 March 2021
01-Jul-2020 to
31-Mar-2021
01-Jul-2019 to
31-Mar-2020
A) Cash flows from operating activities
Receipts from customers 6,759,434,758 7,936,243,305
Receipts from other income 47,902,841 28,355,622
6,807,337,599 7,964,598,927
Payment to suppliers, employees & others (6,953,015,081) (5,771,456,997)
Cash generated from operations (145,677,482) 2,193,141,930
VAT paid (467,259,519) (352,104,183)
SD Paid (17,250,553) (20,658,364)
Income taxes paid (59,240,397) (51,152,276)
Bank charges and commission (3,933,794) (10,301,878)
Net cash (used in)/ generated by operating activities (693,361,745) 1,758,925,229
B) Cash flows from investing activities
Payments for property, plant and equipment (324,161,700) 16,095,001
Adjustment/ transfer of intangible assets - 5,703,750
Adjustment/ transfer for property, plant and equipment 955,629 292,951
Receipts/ transfer of capital work-in-progress (1,223,033,356) (1,755,134,318)
Net cash (used in)/ generated by investing activities (1,546,239,427) (1,733,042,616)
C) Cash flows from financing activities
Received/ (repayment) of short term borrowings 2,026,578,863 (388,349,274)
Payments of Bank interest and other charges (770,156,906) (789,828,405)
Payments of dividends to owners of the company (26,041,666) (39,062,499)
Received/ (repayment) of lease liabilities (102,823,072) 401,637,015
Received/ (repayment) of long term borrowings 1,423,111,588 (341,577,393)
Net cash (used in)/ generated by financing activities 2,550,668,808 (1,157,180,556)
D) Net increase in cash and cash equivalents (A+B+C) 311,067,636 (1,131,297,944)
E) Cash and cash equivalents at the beginning 280,990,242 1,336,654,791
F) Cash and cash equivalents at the end (D+E) 592,057,878 205,356,847
Net Operating Cash Flows per share 11 (3.99) 10.12
Sd/- Sd/- Sd/-
Chief Financial Officer Company Secretary
Sd/- Sd/-
Director Chairman
Managing Director
Notes
Amount in Taka
The annexed notes form an integral part of these financial statements.
Financial Statements March 31, 2021 I 4
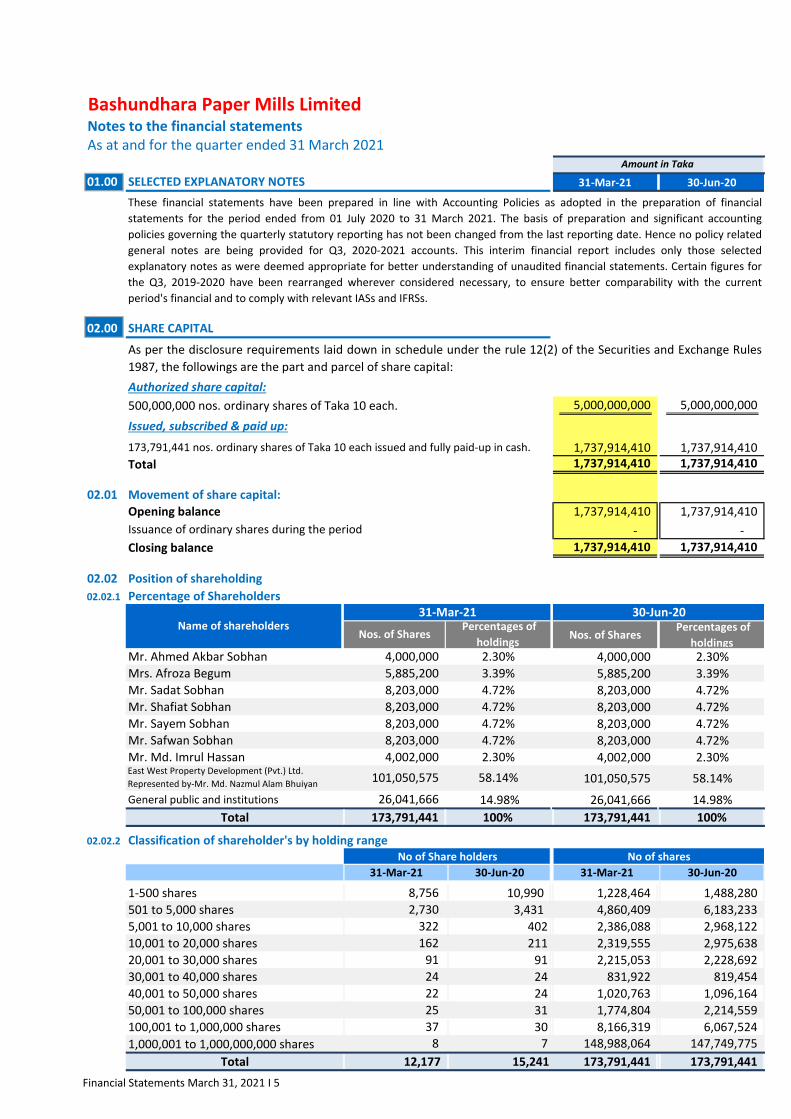
Bashundhara Paper Mills LimitedNotes to the financial statementsAs at and for the quarter ended 31 March 2021
01.00 SELECTED EXPLANATORY NOTES 31-Mar-21 30-Jun-20
02.00 SHARE CAPITAL
Authorized share capital:
5,000,000,000 5,000,000,000
Issued, subscribed & paid up:
1,737,914,410 1,737,914,410
Total 1,737,914,410 1,737,914,410
02.01 Movement of share capital:
Opening balance 1,737,914,410 1,737,914,410
Issuance of ordinary shares during the period - -
Closing balance 1,737,914,410 1,737,914,410
02.02 Position of shareholding
02.02.1 Percentage of Shareholders
Nos. of Shares Percentages of
holdings 4,000,000 2.30%
5,885,200 3.39%
8,203,000 4.72%
8,203,000 4.72%
8,203,000 4.72%
8,203,000 4.72%
4,002,000 2.30%
101,050,575 58.14%
General public and institutions 14.98% 26,041,666 14.98%
173,791,441 100%
02.02.2 Classification of shareholder's by holding range
30-Jun-20 30-Jun-20
1-500 shares 10,990 1,228,464 1,488,280
501 to 5,000 shares 3,431 4,860,409 6,183,233
5,001 to 10,000 shares 402 2,386,088 2,968,122
10,001 to 20,000 shares 211 2,319,555 2,975,638
20,001 to 30,000 shares 91 2,215,053 2,228,692
30,001 to 40,000 shares 24 831,922 819,454
40,001 to 50,000 shares 24 1,020,763 1,096,164
50,001 to 100,000 shares 31 1,774,804 2,214,559
100,001 to 1,000,000 shares 30 8,166,319 6,067,524
1,000,001 to 1,000,000,000 shares 7 148,988,064 147,749,775
173,791,441 173,791,441
500,000,000 nos. ordinary shares of Taka 10 each.
As per the disclosure requirements laid down in schedule under the rule 12(2) of the Securities and Exchange Rules
1987, the followings are the part and parcel of share capital:
Mr. Shafiat Sobhan
Amount in Taka
Mr. Sadat Sobhan 8,203,000 4.72%
3.39%
Name of shareholders31-Mar-21
5,885,200 Mrs. Afroza Begum
30-Jun-20
Nos. of Shares Percentages of
holdings Mr. Ahmed Akbar Sobhan 4,000,000 2.30%
173,791,441 nos. ordinary shares of Taka 10 each issued and fully paid-up in cash.
4.72%
Mr. Safwan Sobhan
Total
No of shares
8,203,000 4.72%
24
22
25
37
8
173,791,441
2,730
322
8,756
Mr. Md. Imrul Hassan
58.14%
162
91
101,050,575
No of Share holders
100%
31-Mar-2131-Mar-21
Total 12,177 15,241
East West Property Development (Pvt.) Ltd.
Represented by-Mr. Md. Nazmul Alam Bhuiyan
26,041,666
4,002,000 2.30%
8,203,000 4.72%
Mr. Sayem Sobhan 8,203,000
These financial statements have been prepared in line with Accounting Policies as adopted in the preparation of financial
statements for the period ended from 01 July 2020 to 31 March 2021. The basis of preparation and significant accounting
policies governing the quarterly statutory reporting has not been changed from the last reporting date. Hence no policy related
general notes are being provided for Q3, 2020-2021 accounts. This interim financial report includes only those selected
explanatory notes as were deemed appropriate for better understanding of unaudited financial statements. Certain figures for
the Q3, 2019-2020 have been rearranged wherever considered necessary, to ensure better comparability with the current
period's financial and to comply with relevant IASs and IFRSs.
Financial Statements March 31, 2021 I 5

03.00 SHARE PREMIUM 31-Mar-21 30-Jun-20
Opening Balance 1,739,583,292 1,739,583,292 Add: Addition during the period - - Less: Adjustment during the period - -
Closing Balance 1,739,583,292 1,739,583,292
03.01
04.00 REVALUATION RESERVE.
Opening Balance 2,072,945,223 2,092,726,250 Add: Increase arising on revaluation of properties - - Less: Transferred to retained earnings (14,835,770) (19,781,027)
Closing Balance 2,058,109,453 2,072,945,223
05.00 RETAINED EARNINGS
Opening balance 2,176,583,610 1,910,028,347 Add: Profit attributable to the owners of the Company 200,472,971 285,836,735
Transferred from properties revaluation reserve 14,835,770 19,781,027
Less: Adjustment for current tax of prior years - -
Payment of dividend (26,041,666) (39,062,499)
Closing balance 2,365,850,685 2,176,583,610
06.00 DEFERRED TAX (ASSETS) / LIABILITIES
31-Mar-21 30-Jun-20
Opening balance 1,189,125,397 1,076,753,353
Provided during the period: 61,989,919 112,372,044
Deferred tax income - -
Deferred tax expense NOTE 06.01 61,989,919 112,372,044
Adjustment made during the period - - Closing balance 1,251,115,316 1,189,125,397
06.01 Temporary timing difference:
Property, Plant and equipment 13,118,040,842 (7,977,806,471) 5,140,234,371
Right-of-use assets 28,567,126 (28,702,489) (135,362)
Intangible assets 151,591,229 (114,810,713) 36,780,516
Pre-operating expenses - (53,999,288) (53,999,288)
Unused tax loss carry forward - (1,015,825,314) (1,015,825,314)
Difference for vehicle - (3,631,161) (3,631,161)
Net taxable temporary difference 13,298,199,198 (9,194,775,434) 4,103,423,763
Applicable tax rate 25%
Deferred tax liability-31 March 2021 1,025,855,941
Deferred tax liability-30 June 2020 (963,866,022)
Deferred tax expense/ (income) for the period 61,989,919
Tax baseAccounting base
Carrying AmountAs at March 31, 2021
Amount in Taka
In the year 2017-18 the Company issued 26,041,666 ordinary shares, from which 60% i.e. 15,625,000 ordinary shares
for Eligible Investors (EIs) at cut-off price of Tk. 80.00 at a premium Tk. 70 and remaining 40% i.e 10,416,667 ordinary
shares at a 10% discounted from the cut-off price of Tk. 72.00 per share at a premium Tk. 62 for General Public
including NRB and Others totaling Tk. 2,000,000,000 (approx.)
Deferred tax assets and liabilities have been recognized and measured in accordance with the provisions of IAS 12:
Income Taxes. The following is the analysis of deferred tax (assets)/liabilities presented in the statement of financial
position:
Temporary
Difference
Amount in Taka
Financial Statements March 31, 2021 I 6

Property, Plant and equipment 12,726,022,925 (8,004,050,536) 4,721,972,389
Right-of-use assets 41,169,020 (33,767,634) 7,401,386
Intangible assets 158,794,592 (124,129,432) 34,665,160
Pre-operating expenses - (56,841,355) (56,841,355)
Unused tax loss carry forward - (847,461,539) (847,461,539)
Difference for vehicle - (4,271,954) (4,271,954)
Net taxable temporary difference 12,925,986,537 (9,070,522,450) 3,855,464,087
Applicable tax rate 25%
Deferred tax liability-30 June 2020 963,866,022
Less: Deferred tax liability-30 June 2019 (851,493,978)
Deferred tax expense/ (income) for the year 112,372,044
07.00 INCOME TAX EXPENSE 2020-2021 2019-2020
a. Current tax expense: (14,503,214) 43,640,153
Current tax expense in respect of the current period 42,795,029 43,640,153
(57,298,243) -
b. Deferred tax expense/ (income): 61,989,919 72,874,263
Deferred tax expenses recognized in the period 61,989,919 72,874,263
- -
c. Total income tax expense recognized in the current period (a+b) 47,486,705 116,514,416
07.01 The income tax expense for the year can be reconciled to the accounting profit as follows:
Accounting profit for the period 247,959,676 291,497,054
Less: Share of profit of equity - -
247,959,676 291,497,054
Tax on accounting profits @ 25% 61,989,919 72,874,263
Effect of income that is exempt from taxation - -
Effect of expenses that are not deductible in determining taxable profit - -
Effect of concessions (research and development and other allowances) - -
Impairment losses on goodwill that are not deductible - -
Effect of minimum tax 42,795,029 43,640,153
Effect of unused tax losses and tax offsets not recognized as deferred tax assets - -
- -
Effect of different tax rates of subsidiaries operating in other jurisdictions - -
Effect on deferred tax balances due to the change in income tax rate - -
Effect of unused tax credits - -
104,784,948 116,514,416
(57,298,243) -
47,486,705 116,514,416
As at June 30, 2020
Accounting base
Carrying AmountTax base
Adjustments to deferred tax attributable to changes in tax rates
and laws
Adjustments recognized in the current year in relation to the
current tax of prior year's
Income tax expense recognized in profit or loss
In compliance with the requirements of para-81 (c) of IAS-12: (Income tax), the reconciliation of tax expense and
product of accounting profit are given below:
Adjustments recognized in the current year in relation to the current tax of
prior years
Effect of previously unrecognized and unused tax losses and deductible
temporary differences now recognized as deferred tax assets
Temporary
Difference
Amount in Taka
In compliance with the requirements of Para 79 of IAS-12: Income Tax, the major components of tax expenses are
given below:
Financial Statements March 31, 2021 I 7

08.00 EARNINGS PER SHARE (EPS) 2020-2021 2019-2020
08.01 Basic Earnings per Share
Profit attributable to the Ordinary Shareholders 200,472,971 174,982,638
Weighted Average Number of shares 173,791,441 173,791,441
1.15 1.01
09.00 RELATED PARTY TRANSACTIONS
09.01 Loans to/from related parties:
(729,381,919) Market Price
East West Media Group Ltd. 140,442,846 Market Price
Bashundhara Steel and Engineering Ltd. 57,390,293 Market Price
Bashundhara Multi-Paper Industries Ltd. 62,760,000 Market Price
Bashundhara Infrastructure Development Ltd. 3,281,222 Market Price
Bashundhara Industrial Complex Ltd. (164,966,492) Market Price
Bashundhara Industrial Complex Ltd. 265,000,000 Market Price
Bashundhara Cement Industries Ltd. 2,518,436 Market Price
Sundarban Industrial Complex Ltd. 7,367,465 Market Price
Bashundhara Food & Beverage Industries Ltd. 4,065,831 Market Price
800,000 Market Price
1,371,500 Market Price
Bashundhara LP Gas Ltd. (190,746,366) Market Price
Bashundhara Airways Ltd. 167,443,646 Market Price
Bashundhara Amusement Park Ltd. 22,897,872 Market Price
Meghna Cement Mills Limited 54,363,621 Market Price
Bashundhara Industrial Economic Zone 112,989,776 Market Price
Bashundhara Chemical Industries Ltd. 23,040,000 Market Price
Toggi Services Ltd. 72,300,000 Market Price
Toggi Real Estate & Construction Ltd. 2,222,000 Market Price
Bashundhara Multi Steel Industries Ltd. 21,006,280 Market Price
Toggi Shipping & Logistics Ltd. 65,000,000 Market Price
Millennium Media Ltd. 20,000,000 Market Price
Bashundhara Multi Trading Ltd. (18,371,760) Market Price
09.02
19,000,000 22,500,000
Post-employment benefits - -
Other long term benefits - -
Termination benefits - - 19,000,000 22,500,000
09.03 Disclosure requirements of IAS 24, Para 18 minimum disclosure shall include
a) The amount of transaction 19,000,000 22,500,000
b) The amount of outstanding balance, including commitments, and: 80,617,444 717,011,184
i) Remuneration,
Working Capital
Management
Remuneration,
Working Capital
Management
ii) details of any guarantee given or received Nil Nil
Nil Nil
Nil Nil
Sister Concern
Sister Concern
Short term Loan
Compensation of key management personnel during the year as follows:
Sister Concern
Sister Concern
Their terms & condition, including whether they are secured,
and the nature of the consideration to be provided in
settlement; and
d) The expenses recognized during the period in respect of bad or doubtful
debts due from related parties
c) Provisions for doubtful debts related to the amount of outstanding balances; and
Short term Loan
Sister Concern Short term Loan
Sister Concern Short term Loan
Short term Loan
Sister Concern
Short-term benefits
Short term Loan
Sister Concern
Short term Loan
Short term Loan
Long term Loan
Short term Loan
Short term Loan
Short term Loan
Relationship
Sister Concern
Investment
Sister Concern Short term Loan
Short term Loan
Sister Concern
Bashundhara Fine Paper Mills Ltd.
Bashundhara Glass Industries Ltd.
Sister Concern
Compensation
Sister Concern
Shareholder &
Sister Concern
Sister Concern
Sister Concern Short term Loan
Sister Concern
Sister Concern
Sister Concern Short term Loan
Sister Concern Short term Loan
Sister Concern Short term Loan
Sister Concern Short term Loan
Sister Concern
Short term Loan
Short term Loan
Balances and transactions between the Company and its sister concern, and shareholders, which are related parties
of the company, have been eliminated are not disclosed in this note. Details of transactions between the Company
and other related parties are disclosed below:
Basic Earnings Per Share
Amount in Taka
31-Mar-21
Short term Loan
Short term Loan
Sister Concern
East West Property Development (Pvt.)
Ltd.
Name of related CompaniesNature of
transaction
Financial Statements March 31, 2021 I 8

10.00 NET ASSET VALUE (NAV) PER SHARE 31-Mar-21 30-Jun-20
Total Assets 30,590,115,885 27,544,362,832
Less: Intangible Assets (151,591,229) (158,794,592)
Total Liabilities (22,688,658,045) (19,817,336,297)
Net Asset Value (NAV) 7,749,866,611 7,568,231,943
173,791,441 173,791,441 Net Asset Value (NAV) Per Share (per value Tk. 10 each) 44.59 43.55
11.00 NET OPERATING CASH FLOW (NOCFPS) PER SHARE 2020-2021 2019-2020
Net Operating Cash Flows (693,361,745) 1,758,925,229 Weighted Average Number of Ordinary shares outstanding 173,791,441 173,791,441 Net Operating Cash Flows per share (per value Tk. 10 each) (3.99) 10.12
12.00 RECONCILIATION OF OPERATING CASH FLOW WITH NET PROFIT
Total Comprehensive Income for the period 200,472,971 174,982,637 Adjustment for:Income tax expense recognized in profit and loss 47,486,705 116,514,416 Workers' profit participation & welfare fund 13,050,509 15,341,950 Amortization of intangible assets 7,203,362 5,710,097 Depreciation of non-current assets 974,104,694 884,267,754
1,242,318,242 1,196,816,855 Adjustment for separate consideration
Finance cost recognized in profit and loss 770,156,906 788,246,661
Movements in working capital:
(Increase)/decrease in inventories (1,216,030,555) (158,112,432) (Increase)/decrease in trade and other receivables (872,730,349) 264,802,700 (Increase)/decrease in advance, deposit and prepayment (159,614,927) (329,933,308) Increase/(decrease) in trade payables & other payables (568,552,312) (212,902,649) Increase/(decrease) in provision for expense 170,321,558 261,159,678
Cash generated from operations (2,646,596,496) (174,986,011) Income taxes paid (59,240,397) (51,152,276) Net cash (used in)/ generated by operating activities (693,361,745) 1,758,925,229
13.00 SIGNIFICANT DEVIATIONS
As a result, sales is decreased for the period ended on 31 march 2021 compared to previous period. In contrast,
supply chain broke down, rendering our products distribution difficult and expensive then before pandemic.
Sourcing of raw material become very hard and higher price too. Consequently, production costs and operational
costs are increased. Despite very low sales, the Company is regularly paying salaries and other benefits to employees,
utilities cost, rentals and other operational fixed costs.
Weighted Average Number of Ordinary shares outstanding
The consumption and the economic activities has been deteriorated due to the impact of COVID-19 started in
December, 2019 in China. The influence is too profound to predict when the pandemic wanes or how the price
trends of raw materials fluctuate or when the demands in our products recover. Regarding the new corona virus
pandemic, we are assuming the huge impact on all kinds of Paper and Paper allied products business locally and
internationally.
In the third quarter of the year has been marked by challenging harvesting conditions, decrease in sales price due to
the Covid-19 pandemic. Lower prices and volumes during the quarter had a negative impact on sales and operational
EBIT, compared to the third quarter of last year. Nevertheless, we have faced some logistical challenges and a major
shutdown of operations in China due to COVID-19. From the very beginning we experienced a significant reduction of
orders due to of the lockdown condition, demand of the certain products have been decreasing. Schools, offices,
retailers and other business sectors locally and abroad are closed from middle of March 2020. Majority of products
do not have any demand as they are largely used in School, College, Universities and Corporate Offices till now.
Amount in Taka
Amount in Taka
Financial Statements March 31, 2021 I 9

13.01
13.02
14.00 EVENTS AFTER THE REPORTING PERIOD
15.00 IMPACT OF COVID19 AND GOING CONCERN STATEMENT
Net Operating cash flow per share (NOCFPS):
Net Operating cash flow per share decreased from same period previous year because of increase in value of
imported raw materials and decreased in collection of trade and other receivables.
A pandemic is unpredictable in nature and has the potential to affect our people, markets and operations in various
ways. The pervasive impact of a pandemic means that it has the potential to affect various of our strategic, financial,
operational and compliance risks in the long-term depending on how it evolves.
In December 2019, COVID-19 emerged and has subsequently spread worldwide. The World Health Organization has
declared COVID-19 a pandemic resulting in governments offices, Service Providers and private and public entities
mandating various restrictions, including travel restrictions, restrictions on public gatherings, stay at home orders
and advisories and quarantining of people who may have been exposed to the virus. After close monitoring and
responses and guidance from governments, in an effort to mitigate the spread of COVID-19, effective March 19,
2020, the Company closed its production due to lockdown at Narayangonj and its distribution centers and its offices
with Associates working remotely where possible. The Company continues to monitor developments, including
government requirements and recommendations at the national, state, and local level to evaluate possible
extensions to all or part of such closures.
As a consequence of COVID-19, the Company may experience material and labour shortages, supply chain or
operational interruptions, higher input costs and changes in demand for its products. As a result, that have a material
adverse effect on the Companys’s business. In addition, we have taken several steps to further strengthen our
financial position, and maintain financial liquidity and flexibility, including, reviewing operating expenses, evaluating
raw materials purchases, reducing capital expenditures etc. Going into the 3rd quarter of 2020-2021, heightened
uncertainties remain. Pricing across our key paper products is reduce. Demand for tissue and hygiene products
remains robust.
The Board of Directors have reviewed the Company’s current financial position and performance, including
consideration of the anticipated impact of the COVID-19 pandemic and the other principal risks which may impact
the Company’s performance in the near term. They are confident that the Company will continue to demonstrate its
resilience and remaining well-positioned when the recovery takes place.
Following its assessment, the directors have formed a judgement, at the time of approving the quarterly financial
statements for the quarter ended March 31, 2021, that there are no material uncertainties that cast doubt on the
Company’s going concern status and that it is a reasonable expectation that the Company has adequate resources to
continue in operational existence for the foreseeable future. For this reason, the Company continues to adopt the
going concern basis in preparing the financial statements.
There are no other events identified after the date of the 3rd quarter statement of financial position which require
adjustment or disclosure in the accompanying financial statements
Earnings per share (EPS):
Net profit before tax decreased same period of previous year. Decline in profit is driven by slashing the sales rate as
result of lower sales volume, impact of COVID-19 pandemic, decrease in production volume, increase in utility costs
and other fixed overhead costs, bank interest, increased in depreciation expenses as well. But profit after tax as well
as EPS increased due to adjustments recognized in the current year in relation to the current tax of prior year's
Financial Statements March 31, 2021 I 10