quarterly market review 2014 | q3
TRANSCRIPT

Q3 Quarterly Market Review
Third Quarter 2014
Quarterly Market Review Third Quarter 2014
Overview:
Market Summary
World Stock Market Performance
World Asset Classes
US Stocks
International Developed Stocks
Emerging Markets Stocks
Select Country Performance
Real Estate Investment Trusts (REITs)
Commodities
Fixed Income
Global Diversification
Quarterly Topic: CAPE Fear—Valuation Ratios and Market Timing
This report features world capital market performance and a timeline of events for the past quarter. It begins with a global overview, then features the returns of stock and bond asset classes in the US and international markets.
The report also illustrates the performance of globally diversified portfolios and features a topic of the quarter.
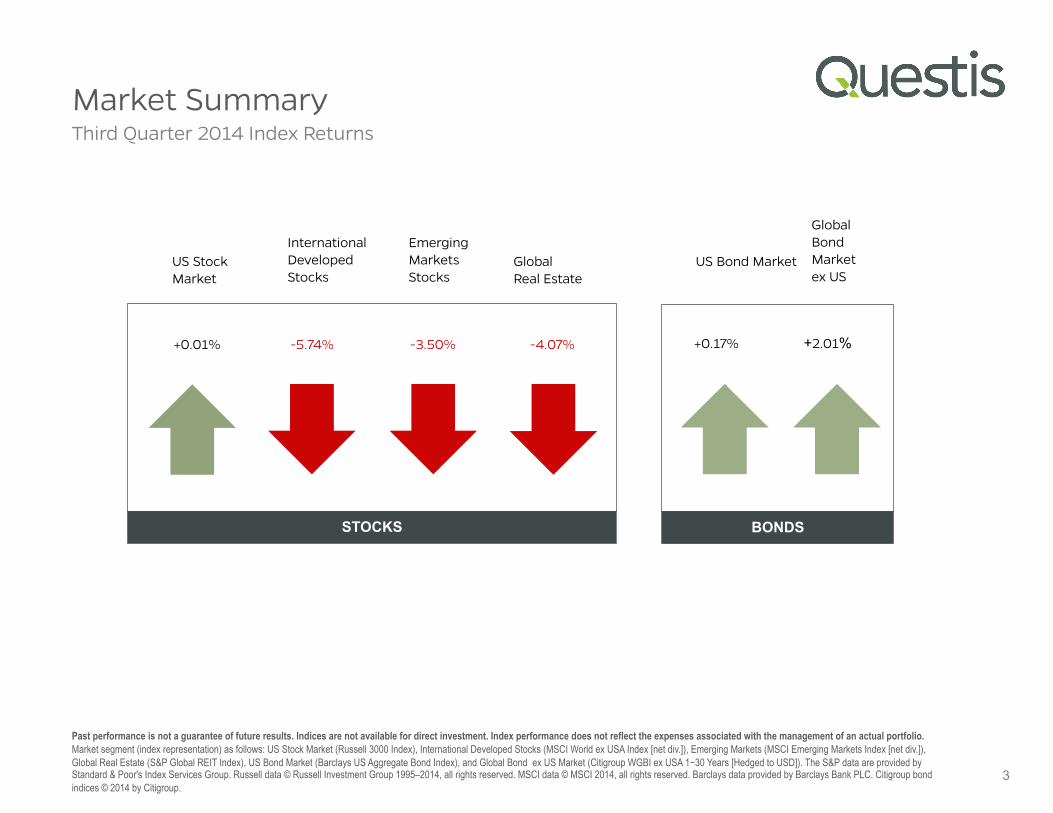
US Stock Market
Global Real Estate
International Developed Stocks
US Bond Market
Global Bond Market ex US
+0.01% -5.74% -4.07% +0.17%
Emerging Markets Stocks
BONDS STOCKS
-3.50%
Market Summary
3
Past performance is not a guarantee of future results. Indices are not available for direct investment. Index performance does not reflect the expenses associated with the management of an actual portfolio. Market segment (index representation) as follows: US Stock Market (Russell 3000 Index), International Developed Stocks (MSCI World ex USA Index [net div.]), Emerging Markets (MSCI Emerging Markets Index [net div.]), Global Real Estate (S&P Global REIT Index), US Bond Market (Barclays US Aggregate Bond Index), and Global Bond ex US Market (Citigroup WGBI ex USA 1−30 Years [Hedged to USD]). The S&P data are provided by Standard & Poor's Index Services Group. Russell data © Russell Investment Group 1995–2014, all rights reserved. MSCI data © MSCI 2014, all rights reserved. Barclays data provided by Barclays Bank PLC. Citigroup bond indices © 2014 by Citigroup.
Third Quarter 2014 Index Returns
+2.01%
180
185
190
195
200
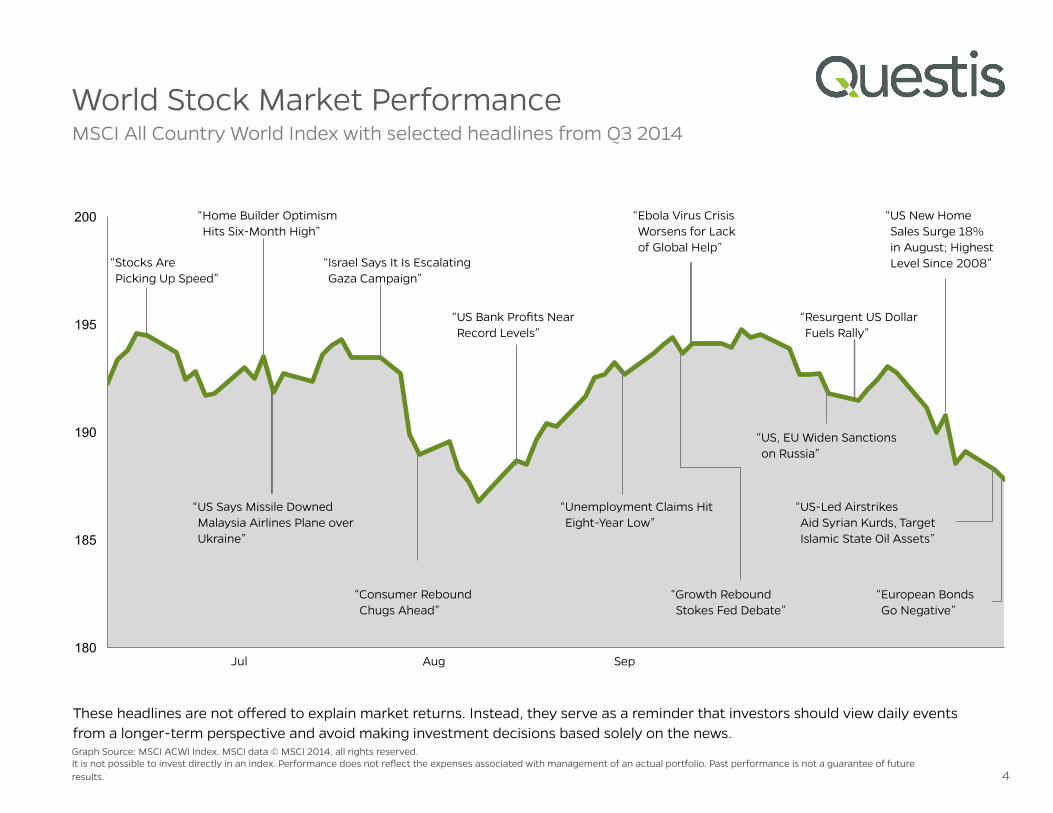
World Stock Market Performance
4
Graph Source: MSCI ACWI Index. MSCI data © MSCI 2014, all rights reserved. It is not possible to invest directly in an index. Performance does not reflect the expenses associated with management of an actual portfolio. Past performance is not a guarantee of future results.
These headlines are not offered to explain market returns. Instead, they serve as a reminder that investors should view daily events from a longer-term perspective and avoid making investment decisions based solely on the news.
MSCI All Country World Index with selected headlines from Q3 2014
Jul Aug Sep
“Stocks Are Picking Up Speed”
“Home Builder Optimism Hits Six-Month High”
“Consumer Rebound Chugs Ahead”
“US Says Missile Downed Malaysia Airlines Plane over Ukraine”
“Unemployment Claims Hit Eight-Year Low”
“Ebola Virus Crisis Worsens for Lack of Global Help”
“Growth Rebound Stokes Fed Debate”
“US, EU Widen Sanctions on Russia”
“Resurgent US Dollar Fuels Rally”
“Israel Says It Is Escalating Gaza Campaign”
“US Bank Profits Near Record Levels”
“US New Home Sales Surge 18% in August; Highest Level Since 2008”
“US-Led Airstrikes Aid Syrian Kurds, Target Islamic State Oil Assets”
“European Bonds Go Negative”
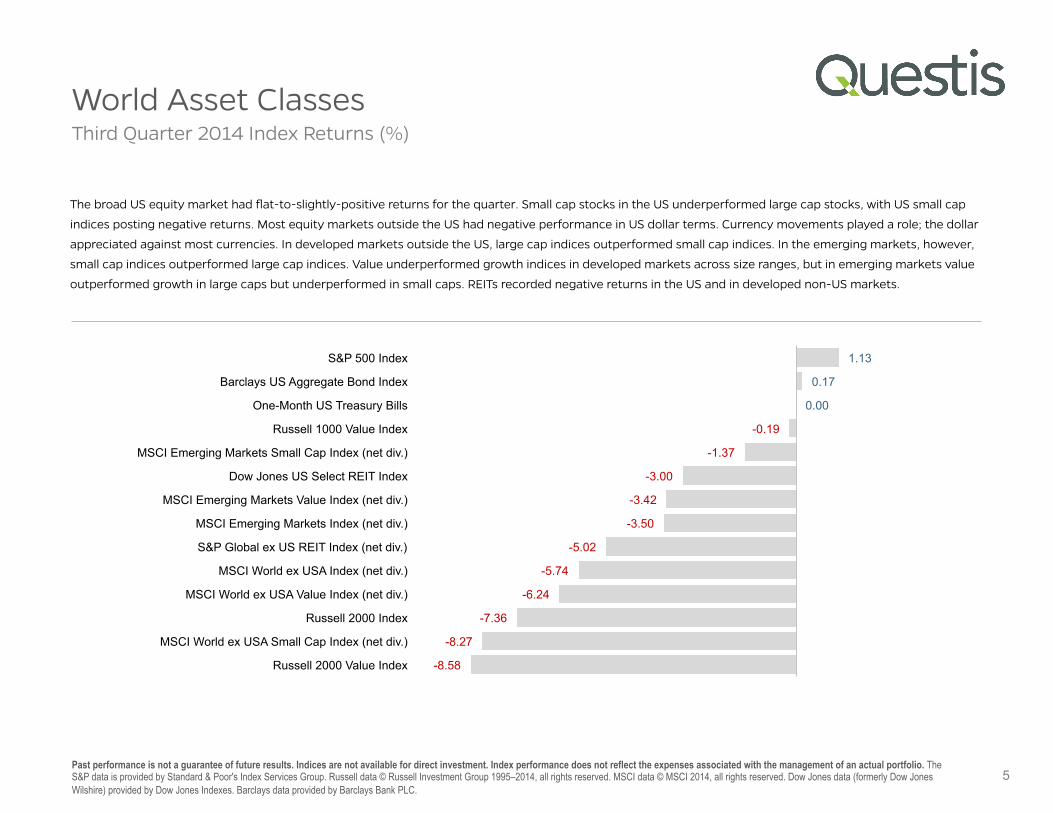
The broad US equity market had flat-to-slightly-positive returns for the quarter. Small cap stocks in the US underperformed large cap stocks, with US small cap
indices posting negative returns. Most equity markets outside the US had negative performance in US dollar terms. Currency movements played a role; the dollar
appreciated against most currencies. In developed markets outside the US, large cap indices outperformed small cap indices. In the emerging markets, however,
small cap indices outperformed large cap indices. Value underperformed growth indices in developed markets across size ranges, but in emerging markets value
outperformed growth in large caps but underperformed in small caps. REITs recorded negative returns in the US and in developed non-US markets.
World Asset Classes
5 Past performance is not a guarantee of future results. Indices are not available for direct investment. Index performance does not reflect the expenses associated with the management of an actual portfolio. The S&P data is provided by Standard & Poor's Index Services Group. Russell data © Russell Investment Group 1995–2014, all rights reserved. MSCI data © MSCI 2014, all rights reserved. Dow Jones data (formerly Dow Jones Wilshire) provided by Dow Jones Indexes. Barclays data provided by Barclays Bank PLC.
Third Quarter 2014 Index Returns (%)
-8.58
-8.27
-7.36
-6.24
-5.74
-5.02
-3.50
-3.42
-3.00
-1.37
-0.19
0.00
0.17
1.13
Russell 2000 Value Index
MSCI World ex USA Small Cap Index (net div.)
Russell 2000 Index
MSCI World ex USA Value Index (net div.)
MSCI World ex USA Index (net div.)
S&P Global ex US REIT Index (net div.)
MSCI Emerging Markets Index (net div.)
MSCI Emerging Markets Value Index (net div.)
Dow Jones US Select REIT Index
MSCI Emerging Markets Small Cap Index (net div.)
Russell 1000 Value Index
One-Month US Treasury Bills
Barclays US Aggregate Bond Index
S&P 500 Index
US Stocks
6
Third Quarter 2014 Index Returns
Past performance is not a guarantee of future results. Indices are not available for direct investment. Index performance does not reflect the expenses associated with the management of an actual portfolio. Market segment (index representation) as follows: Marketwide (Russell 3000 Index), Large Cap (S&P 500 Index), Large Cap Value (Russell 1000 Value Index), Large Cap Growth (Russell 1000 Growth Index), Small Cap (Russell 2000 Index), Small Cap Value (Russell 2000 Value Index), and Small Cap Growth (Russell 2000 Growth Index). World Market Cap represented by Russell 3000 Index, MSCI World ex USA IMI Index, and MSCI Emerging Markets IMI Index. Russell 3000 Index is used as the proxy for the US market. Russell data © Russell Investment Group 1995–2014, all rights reserved. The S&P data are provided by Standard & Poor's Index Services Group.
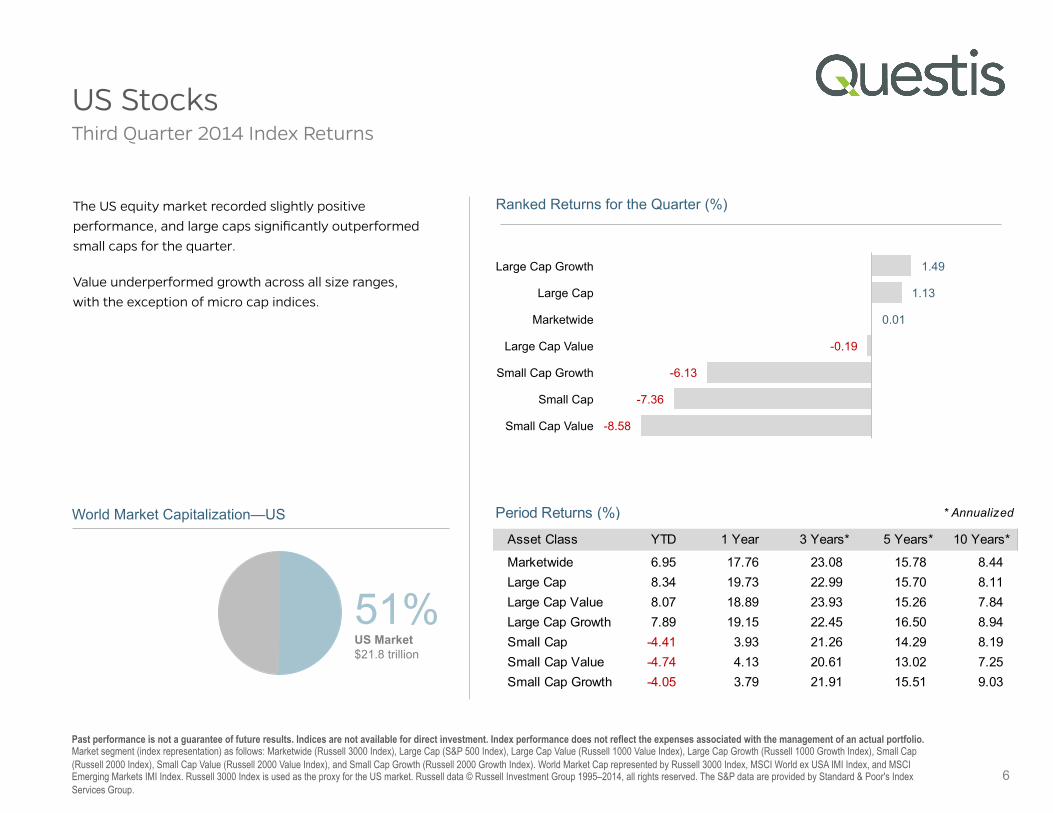
The US equity market recorded slightly positive performance, and large caps significantly outperformed small caps for the quarter.
Value underperformed growth across all size ranges, with the exception of micro cap indices.
51%
US Market $21.8 trillion
World Market Capitalization—US
-8.58
-7.36
-6.13
-0.19
0.01
1.13
1.49
Small Cap Value
Small Cap
Small Cap Growth
Large Cap Value
Marketwide
Large Cap
Large Cap Growth
Ranked Returns for the Quarter (%)
Period Returns (%) * Annualized
Asset Class YTD 1 Year 3 Years** 5 Years** 10 Years**
Marketwide 6.95 17.76 23.08 15.78 8.44Large Cap 8.34 19.73 22.99 15.70 8.11Large Cap Value 8.07 18.89 23.93 15.26 7.84Large Cap Growth 7.89 19.15 22.45 16.50 8.94Small Cap -4.41 3.93 21.26 14.29 8.19Small Cap Value -4.74 4.13 20.61 13.02 7.25Small Cap Growth -4.05 3.79 21.91 15.51 9.03
International Developed Stocks Third Quarter 2014 Index Returns
Past performance is not a guarantee of future results. Indices are not available for direct investment. Index performance does not reflect the expenses associated with the management of an actual portfolio. Market segment (index representation) as follows: Large Cap (MSCI World ex USA Index), Small Cap (MSCI World ex USA Small Cap Index), Value (MSCI World ex USA Value Index), and Growth (MSCI World ex USA Growth). All index returns are net of withholding tax on dividends. World Market Cap represented by Russell 3000 Index, MSCI World ex USA IMI Index, and MSCI Emerging Markets IMI Index. MSCI World ex USA IMI Index used as the proxy for the International Developed market. MSCI data © MSCI 2014, all rights reserved.
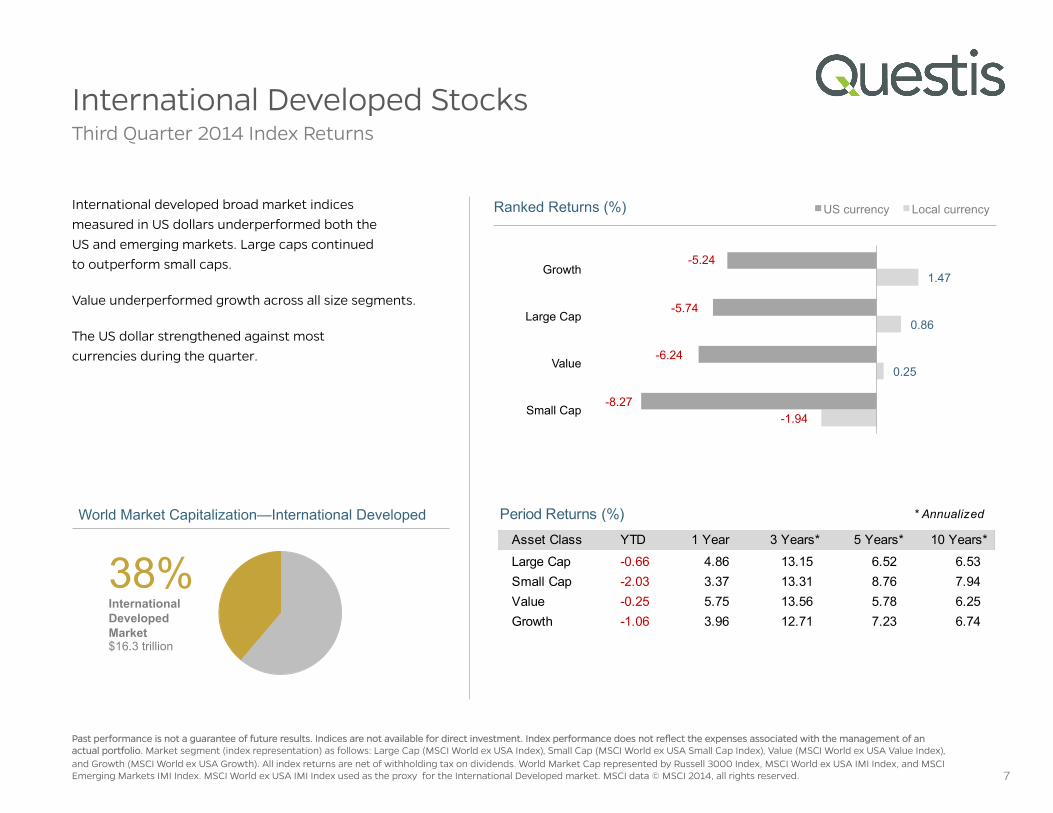
International developed broad market indices measured in US dollars underperformed both the US and emerging markets. Large caps continued to outperform small caps.
Value underperformed growth across all size segments.
The US dollar strengthened against most currencies during the quarter.
7
-1.94
0.25
0.86
1.47
-8.27
-6.24
-5.74
-5.24
Small Cap
Value
Large Cap
Growth
Ranked Returns (%) US currency Local currency
38% International Developed Market $16.3 trillion
World Market Capitalization—International Developed * Annualized
Asset Class YTD 1 Year 3 Years** 5 Years** 10 Years**
Large Cap -0.66 4.86 13.15 6.52 6.53Small Cap -2.03 3.37 13.31 8.76 7.94Value -0.25 5.75 13.56 5.78 6.25Growth -1.06 3.96 12.71 7.23 6.74
Period Returns (%)
Emerging Markets Stocks
8
Third Quarter 2014 Index Returns
Past performance is not a guarantee of future results. Indices are not available for direct investment. Index performance does not reflect the expenses associated with the management of an actual portfolio. Market segment (index representation) as follows: Large Cap (MSCI Emerging Markets Index), Small Cap (MSCI Emerging Markets Small Cap Index), Value (MSCI Emerging Markets Value Index), and Growth (MSCI Emerging Markets Growth Index). All index returns are net of withholding tax on dividends. World Market Cap represented by Russell 3000 Index, MSCI World ex USA IMI Index, and MSCI Emerging Markets IMI Index. MSCI Emerging Markets IMI Index used as the proxy for the emerging market portion of the market. MSCI data © MSCI 2014, all rights reserved.
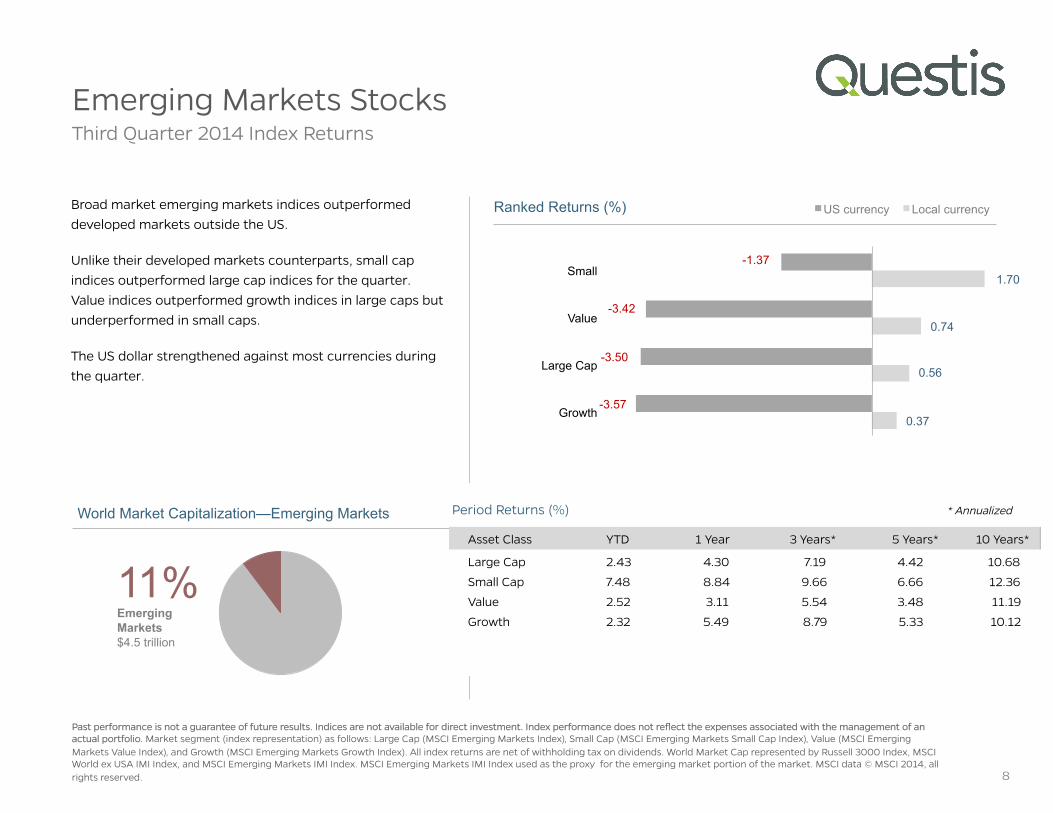
Broad market emerging markets indices outperformed developed markets outside the US.
Unlike their developed markets counterparts, small cap indices outperformed large cap indices for the quarter. Value indices outperformed growth indices in large caps but underperformed in small caps.
The US dollar strengthened against most currencies during the quarter.
0.37
0.56
0.74
1.70
-3.57
-3.50
-3.42
-1.37
Growth
Large Cap
Value
Small
Ranked Returns (%) US currency Local currency
11% Emerging Markets $4.5 trillion
World Market Capitalization—Emerging Markets * Annualized
Asset Class YTD 1 Year 3 Years** 5 Years** 10 Years**
Large Cap 2.43 4.30 7.19 4.42 10.68
Small Cap 7.48 8.84 9.66 6.66 12.36
Value 2.52 3.11 5.54 3.48 11.19
Growth 2.32 5.49 8.79 5.33 10.12
Period Returns (%)
-19.75 -18.29
-11.44 -9.60
-8.56 -8.37 -7.95 -7.93 -7.79 -7.14 -6.25 -5.58 -5.57 -5.44 -4.78 -4.78 -4.11 -3.27 -2.87 -2.50 -1.79
-0.81 0.01
Portugal Austria
Germany Italy
France New Zealand
Norway Australia
Spain Sweden
United Kingdom Finland Canada
Netherlands Denmark
Switzerland Belgium Ireland
Hong Kong Japan
Singapore Israel
US
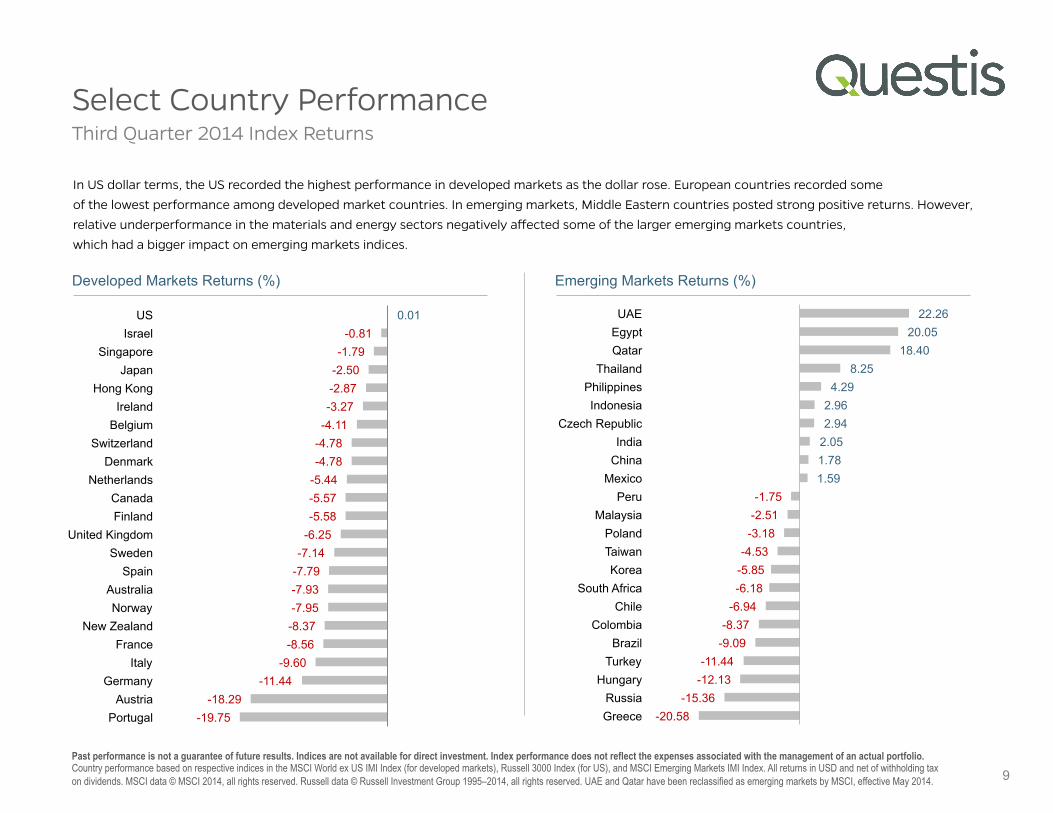
Developed Markets Returns (%)
Select Country Performance
9 Past performance is not a guarantee of future results. Indices are not available for direct investment. Index performance does not reflect the expenses associated with the management of an actual portfolio. Country performance based on respective indices in the MSCI World ex US IMI Index (for developed markets), Russell 3000 Index (for US), and MSCI Emerging Markets IMI Index. All returns in USD and net of withholding tax on dividends. MSCI data © MSCI 2014, all rights reserved. Russell data © Russell Investment Group 1995–2014, all rights reserved. UAE and Qatar have been reclassified as emerging markets by MSCI, effective May 2014.
In US dollar terms, the US recorded the highest performance in developed markets as the dollar rose. European countries recorded some of the lowest performance among developed market countries. In emerging markets, Middle Eastern countries posted strong positive returns. However, relative underperformance in the materials and energy sectors negatively affected some of the larger emerging markets countries, which had a bigger impact on emerging markets indices.
Third Quarter 2014 Index Returns
-20.58 -15.36
-12.13 -11.44
-9.09 -8.37
-6.94 -6.18 -5.85 -4.53 -3.18 -2.51 -1.75
1.59 1.78 2.05 2.94 2.96 4.29
8.25 18.40
20.05 22.26
Greece Russia
Hungary Turkey
Brazil Colombia
Chile South Africa
Korea Taiwan Poland
Malaysia Peru
Mexico China India
Czech Republic Indonesia
Philippines Thailand
Qatar Egypt UAE
Emerging Markets Returns (%)
Real Estate Investment Trusts (REITs) Third Quarter 2014 Index Returns
Past performance is not a guarantee of future results. Indices are not available for direct investment. Index performance does not reflect the expenses associated with the management of an actual portfolio. Number of REIT stocks and total value based on the two indices. All index returns are net of withholding tax on dividends. Total value of REIT stocks represented by Dow Jones US Select REIT Index and the S&P Global ex US REIT Index. Dow Jones US Select REIT Index used as proxy for the US market and S&P Global ex US REIT Index used as proxy for the World ex US market. Dow Jones US Select REIT Index data provided by Dow Jones ©. S&P Global ex US REIT Index data provided by Standard and Poor’s © 2014.
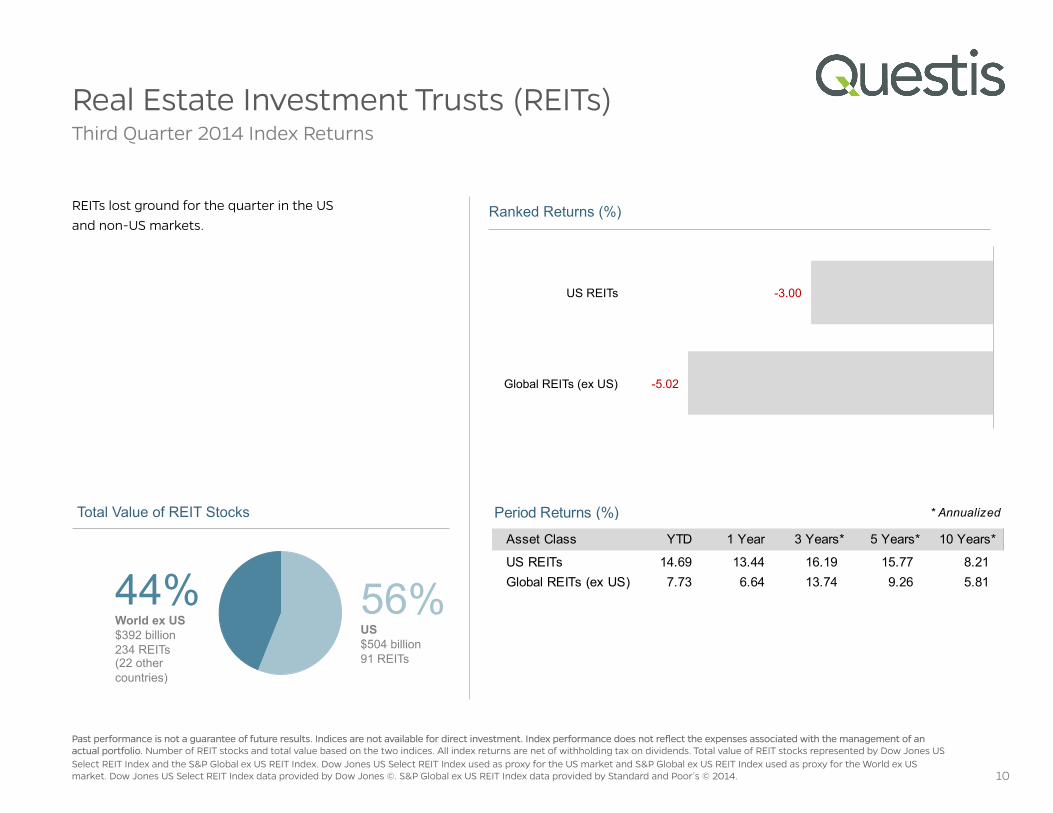
REITs lost ground for the quarter in the US and non-US markets.
10
56% US $504 billion 91 REITs
44% World ex US $392 billion 234 REITs (22 other countries)
Total Value of REIT Stocks
-5.02
-3.00
Global REITs (ex US)
US REITs
Ranked Returns (%)
Period Returns (%) * Annualized
Asset Class YTD 1 Year 3 Years** 5 Years** 10 Years**
US REITs 14.69 13.44 16.19 15.77 8.21 Global REITs (ex US) 7.73 6.64 13.74 9.26 5.81
Commodities Third Quarter 2014 Index Returns
Past performance is not a guarantee of future results. Index is not available for direct investment. Index performance does not reflect the expenses associated with the management of an actual portfolio. All index returns are net of withholding tax on dividends. Securities and commodities data provided by Bloomberg.
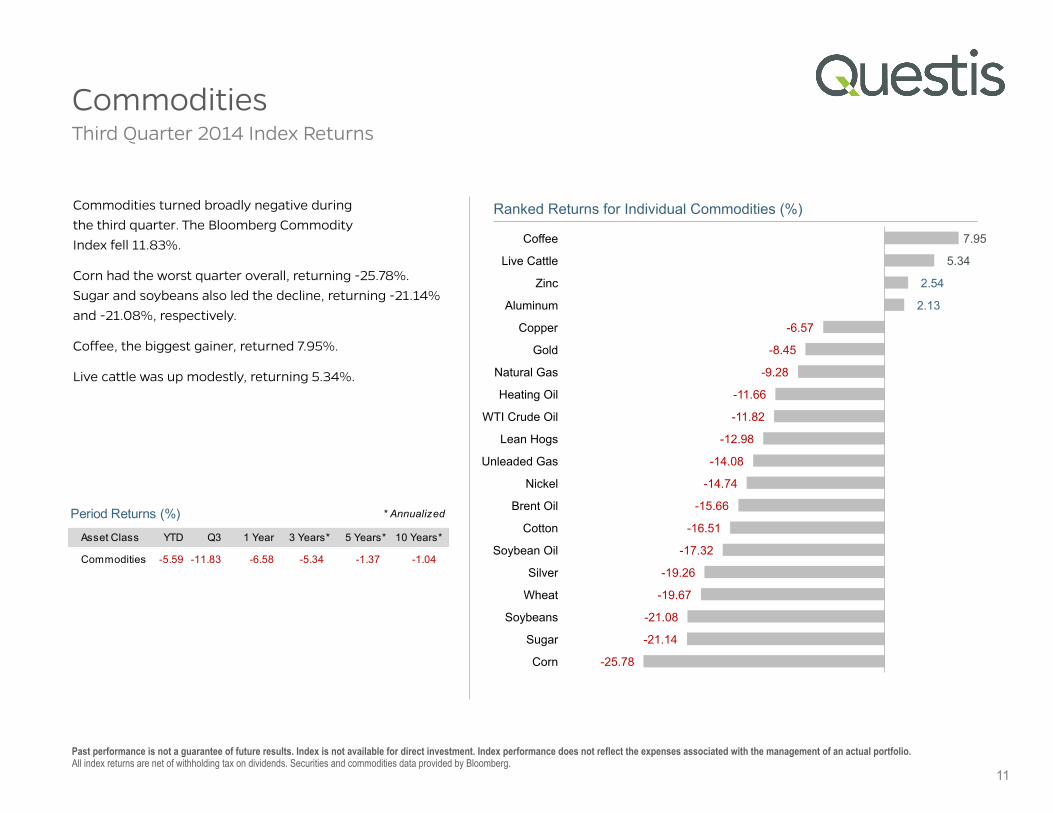
Commodities turned broadly negative during the third quarter. The Bloomberg Commodity Index fell 11.83%.
Corn had the worst quarter overall, returning -25.78%. Sugar and soybeans also led the decline, returning -21.14% and -21.08%, respectively.
Coffee, the biggest gainer, returned 7.95%.
Live cattle was up modestly, returning 5.34%.
-25.78
-21.14
-21.08
-19.67
-19.26
-17.32
-16.51
-15.66
-14.74
-14.08
-12.98
-11.82
-11.66
-9.28
-8.45
-6.57
2.13
2.54
5.34
7.95
Corn
Sugar
Soybeans
Wheat
Silver
Soybean Oil
Cotton
Brent Oil
Nickel
Unleaded Gas
Lean Hogs
WTI Crude Oil
Heating Oil
Natural Gas
Gold
Copper
Aluminum
Zinc
Live Cattle
Coffee
Ranked Returns for Individual Commodities (%)
11
Asset Class YTD Q3 1 Year 3 Years** 5 Years** 10 Years**
Commodities -5.59 -11.83 -6.58 -5.34 -1.37 -1.04
Period Returns (%) * Annualized
4.11
2.57 3.24
10-Year US Treasury
State and Local
Municipals
AAA-AA Corporates
A-BBB Corporates
Bond Yields across Issuers (%)
Fixed Income
Past performance is not a guarantee of future results. Indices are not available for direct investment. Index performance does not reflect the expenses associated with the management of an actual portfolio. Yield curve data from Federal Reserve. State and local bonds are from the Bond Buyer Index, general obligation, 20 years to maturity, mixed quality. AAA-AA Corporates represent the Bank of America Merrill Lynch US Corporates, AA-AAA rated. A-BBB Corporates represent the Bank of America Merrill Lynch US Corporates, BBB-A rated. Barclays data provided by Barclays Bank PLC. US long-term bonds, bills, inflation, and fixed income factor data © Stocks, Bonds, Bills, and Inflation (SBBI) Yearbook™, Ibbotson Associates, Chicago (annually updated work by Roger G. Ibbotson and Rex A. Sinquefield). Citigroup bond indices © 2014 by Citigroup. The BofA Merrill Lynch Indices are used with permission; © 2014 Merrill Lynch, Pierce, Fenner & Smith Incorporated; all rights reserved. Merrill Lynch, Pierce, Fenner & Smith Incorporated is a wholly owned subsidiary of Bank of America Corporation.
Third Quarter 2014 Index Returns
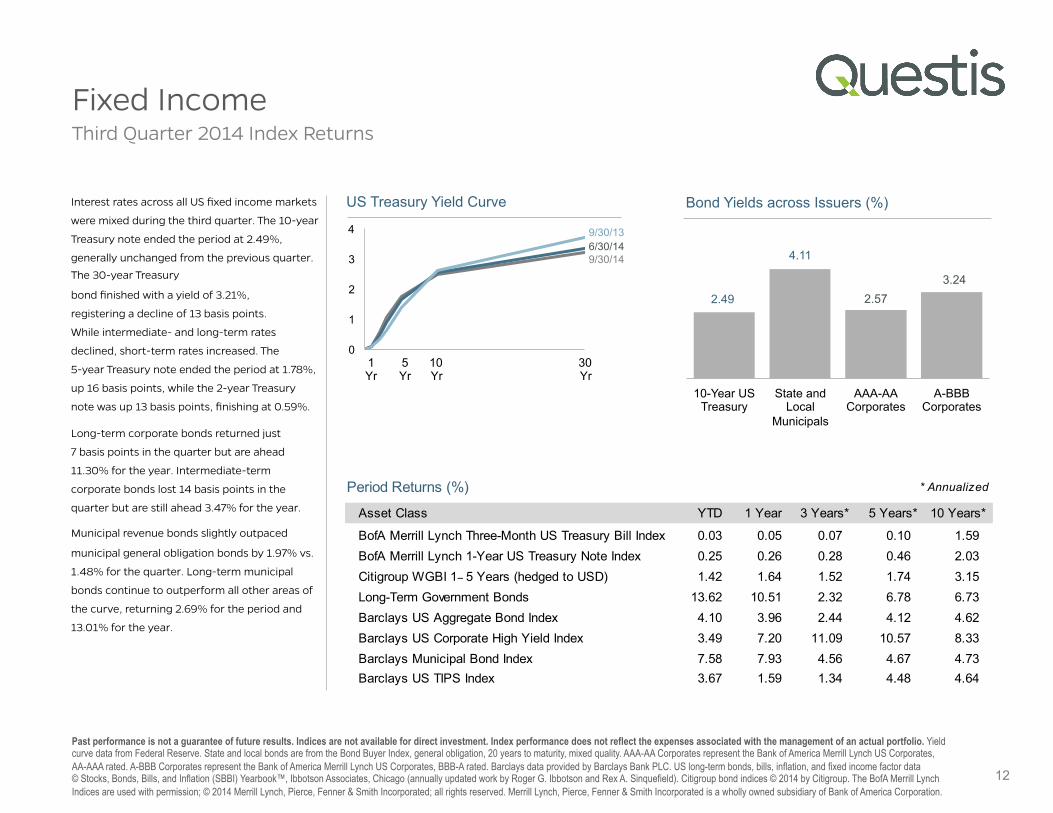
Interest rates across all US fixed income markets
were mixed during the third quarter. The 10-year
Treasury note ended the period at 2.49%,
generally unchanged from the previous quarter. The 30-year Treasury
bond finished with a yield of 3.21%,
registering a decline of 13 basis points.
While intermediate- and long-term rates
declined, short-term rates increased. The
5-year Treasury note ended the period at 1.78%,
up 16 basis points, while the 2-year Treasury
note was up 13 basis points, finishing at 0.59%.
Long-term corporate bonds returned just
7 basis points in the quarter but are ahead
11.30% for the year. Intermediate-term
corporate bonds lost 14 basis points in the
quarter but are still ahead 3.47% for the year.
Municipal revenue bonds slightly outpaced
municipal general obligation bonds by 1.97% vs.
1.48% for the quarter. Long-term municipal
bonds continue to outperform all other areas of
the curve, returning 2.69% for the period and
13.01% for the year.
12
2.49
Period Returns (%)
Asset Class YTD 1 Year 3 Years** 5 Years** 10 Years**
BofA Merrill Lynch Three-Month US Treasury Bill Index 0.03 0.05 0.07 0.10 1.59BofA Merrill Lynch 1-Year US Treasury Note Index 0.25 0.26 0.28 0.46 2.03Citigroup WGBI 1− 5 Years (hedged to USD) 1.42 1.64 1.52 1.74 3.15Long-Term Government Bonds 13.62 10.51 2.32 6.78 6.73Barclays US Aggregate Bond Index 4.10 3.96 2.44 4.12 4.62Barclays US Corporate High Yield Index 3.49 7.20 11.09 10.57 8.33Barclays Municipal Bond Index 7.58 7.93 4.56 4.67 4.73Barclays US TIPS Index 3.67 1.59 1.34 4.48 4.64
* Annualized
0
1
2
3
4
US Treasury Yield Curve
1 Yr
5 Yr
10 Yr
30 Yr
9/30/14
9/30/13 6/30/14
$10,000
$20,000
$30,000
$40,000
$50,000
$60,000
$70,000
$80,000
09/1988 09/1993 09/1998 09/2003 09/2008 09/2013
Growth of Wealth: The Relationship between Risk and Return
Stock/Bond Mix
100% Stocks
75/25
50/50
25/75
100% Treasury Bills
Global Diversification
13
Third Quarter 2014 Index Returns
Diversification does not eliminate the risk of market loss. Past performance is not a guarantee of future results. Indices are not available for direct investment. Index performance does not reflect expenses associated with the management an actual portfolio. Asset allocations and the hypothetical index portfolio returns are for illustrative purposes only and do not represent actual performance. Global Stocks represented by MSCI All Country World Index (gross div.) and Treasury Bills represented by US One-Month Treasury Bills. Globally diversified allocations rebalanced monthly, no withdrawals. Data © MSCI 2014, all rights reserved. Treasury bills © Stocks, Bonds, Bills, and Inflation Yearbook™, Ibbotson Associates, Chicago (annually updated work by Roger G. Ibbotson and Rex A. Sinquefield).
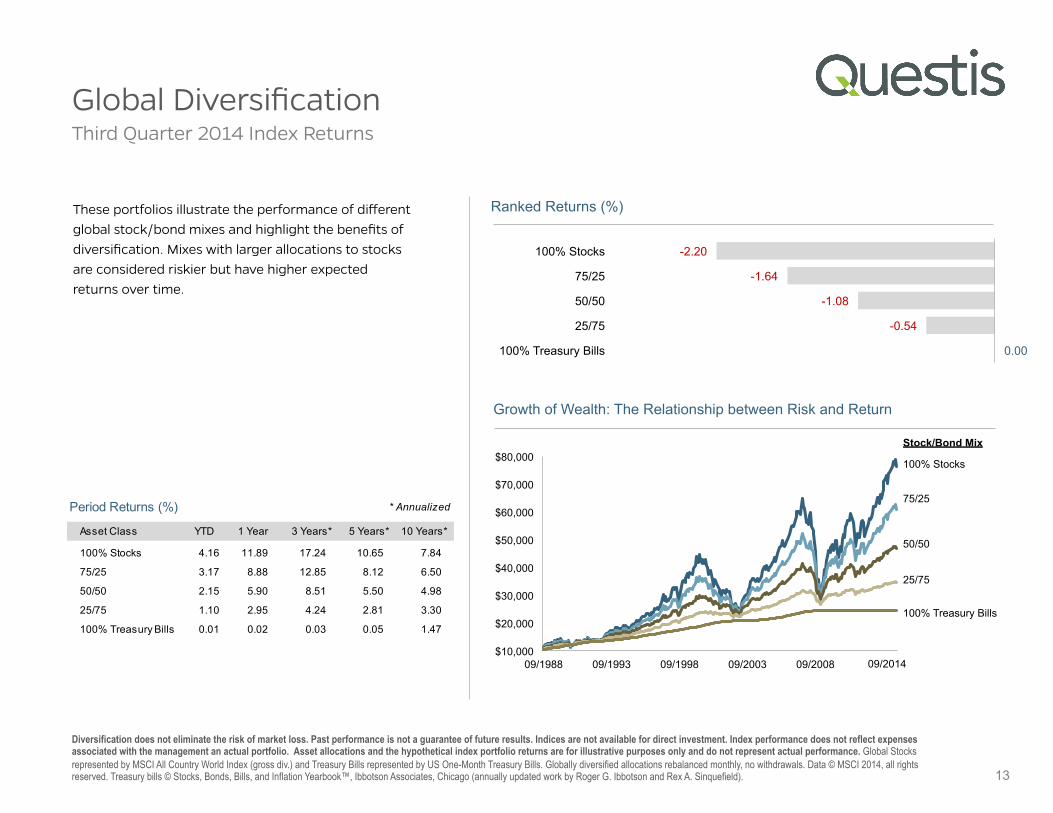
These portfolios illustrate the performance of different global stock/bond mixes and highlight the benefits of diversification. Mixes with larger allocations to stocks are considered riskier but have higher expected returns over time.
0.00
-0.54
-1.08
-1.64
-2.20
100% Treasury Bills
25/75
50/50
75/25
100% Stocks
Ranked Returns (%)
Asset Class YTD 1 Year 3 Years** 5 Years** 10 Years**
100% Stocks 4.16 11.89 17.24 10.65 7.84
75/25 3.17 8.88 12.85 8.12 6.50
50/50 2.15 5.90 8.51 5.50 4.98
25/75 1.10 2.95 4.24 2.81 3.30
100% Treasury Bills 0.01 0.02 0.03 0.05 1.47
* AnnualizedPeriod Returns (%)
09/2014
Developed by Robert Shiller of Yale University and John Campbell of Harvard University, the CAPE ratio seeks to provide a road map of stock market valuation by comparing current prices to average inflation-adjusted earnings over the previous 10 years.1 The idea is to smooth out the peaks and valleys of the business cycle and arrive at a more stable measure of corporate earning power. Shiller suggests that investors can improve their portfolio performance relative to a static equity allocation by overweighting stocks during periods of low valuation and underweighting stocks during periods of high valuation.
A CAPE-based strategy has the virtue of using clearly defined quantitative measures rather than vague assessments of investor exuberance or despair. From January 1926 through December 2013, the CAPE ratio has ranged from a low of 5.57 in June 1932 to 44.20 in December 1999, with an average of 17.54.
Using the CAPE ratio might appear to offer a sensible way to improve portfolio results by periodically adjusting equity exposure, and many financial writers have focused on this methodology in recent years. As an example, a timing newsletter publisher earlier this year observed, “For the S&P 500, this ratio currently
exceeds 25.6, which is higher than what prevailed at 29 of the 35 tops since 1900.”2
Many investors find such an approach very appealing. Does it work?
The challenge of profiting from CAPE measures or any other quantitative indicator is to come up with a trading rule to identify the correct time to underweight or overweight stocks. It is not enough to know that stocks are above or below their long-run average valuation. How far above average should the indicator be before investors should reduce equity exposure? And at what point will stocks be sufficiently attractive for repurchase–below average? Average? Slightly above average? It may be easy to find rules that have worked in the past, but much more difficult to achieve success following the same rule in the future.
This implementation challenge appears to be the Achilles’ heel of timing-based strategies. A study in 2013 by professors at the London Business School applied CAPE ratios to time market entry and exit points. “Sadly,” they concluded, “we learn far less from valuation ratios about how to make profits in the future than about how we might have profited in the past.”3
As an example of the potential difficulty, consider the CAPE data as of year-end 1996. The CAPE ratio stood at 27.72, 82% above its long-run average of 15.23 at that point. Federal Reserve Chairman Alan Greenspan had delivered his much-discussed “irrational exuberance” speech just three weeks earlier. The last time the CAPE ratio had flirted with this number was October 1929; the CAPE was at 28.96 as stock prices were about to head over the cliff. It seems plausible that followers of the CAPE strategy would have been easily persuaded that investing at year-end 1996 would be a painful experience.
The actual result was more cheerful. The next three years were especially rewarding, with total return of over 107% for the S&P 500 Index. For the period January 1997–June 2014, the annualized return for the S&P 500 Index was 7.67%, compared to 2.42% for one-month US Treasury bills. Stock returns were modestly below their long-run average for this period, but the equity premium was still strongly positive.
By comparison, a timing strategy over the same period that was fully invested in stocks only during periods when the CAPE ratio was below its long-run average produced an annualized return of 3.09%. All timing strategies face a
fundamental problem: Since markets have generally gone up more often than they have gone down in the last 90 years, avoiding losses in a down market runs the risk of avoiding even heftier gains associated with an up market.
A successful timing strategy is the fountain of youth of the investment world. For decades, financial researchers have explored dozens of quantitative indicators as well as various measures of investor sentiment in an effort to discover the ones with predictive value. The performance record of professional money managers over the past 50 years offers compelling evidence that this effort has failed.
Despite this evidence, the potential rewards of successful market timing are so great that each new generation sees a fresh group of market participants eager to try. Searching for the key to outwitting other investors may be fun for those with a sense of adventure and time on their hands. For those seeking the highest probability of a successful investment experience, maintaining a consistent allocation strategy is likely to be the sounder choice.
CAPE Fear: Valuation Ratios and Market Timing
14
1. CAPE data available at http://www.econ.yale.edu/~shiller/data.htm; 2. Mark Hulbert, “This Bull Market is Starting to Look Long in the Tooth,” Wall Street Journal, January 18, 2014; 3. John Authers, “Clash of the CAPE Crusaders,” Financial Times, September 3, 2013. Adapted from “CAPE Fear: Valuation Ratios and Market Timing” by Weston Wellington, Down to the Wire column on Dimensional’s website, September 2014. Dimensional Fund Advisors LP ("Dimensional") is an investment advisor registered with the Securities and Exchange Commission. All expressions of opinion are subject to change without notice in reaction to shifting market conditions. This content is provided for informational purposes, and it is not to be construed as an offer, solicitation, recommendation or endorsement of any particular security, products, or services.
Third Quarter 2014 As broad market indices such as the S&P 500 have set new record highs in recent weeks, many investors have become apprehensive. They fear another
major decline is likely to occur and are eager to find strategies that promise to avoid the pain of an extended downturn while preserving the opportunity to
profit in up markets. One approach that has attracted considerable attention in recent years is adjusting investments based on the CAPE ratio–the Cyclically Adjusted Price / Earnings
ratio.