quarterly market update - fidelity investments 2 4 6 8 10 1-nov 11-nov 21-nov 1-dec 21-dec 31-dec...
TRANSCRIPT

LEADERSHIP SERIES
Quarterly Market Update PRIMARY CONTRIBUTORS
Lisa Emsbo-Mattingly Director of Asset Allocation Research
Dirk Hofschire, CFA SVP, Asset Allocation Research
Austin Litvak Senior Analyst, Asset Allocation Research
Jake Weinstein, CFA Senior Analyst, Asset Allocation Research
Cait Dourney Analyst, Asset Allocation Research
SECOND QUARTER 2017

Economy/Macro Backdrop 3.
Table of Contents Market Summary 1.
Theme: Crosswinds for Earnings 2.
U.S. Equity Markets 4.
International Equity Markets & Global Assets 5.
Fixed-income Markets 6.
Asset Allocation Themes 7.

Market Summary

SU
MM
AR
Y
4
• Synchronized global expansion – Continued recovery in industrial activity,
trade-solidified global backdrop – Global deflationary pressures abated, though
headline inflation may have peaked – U.S. expansion a mix of mid and late cycle
• Political uncertainty remained high – No clarity on U.S. legislation prospects – Worries about populism in European
elections • Global monetary policy still accommodative
but incrementally less so – Fed hiked again; China short rates rose
• Global expansion on firm ground, non-U.S. economies close gap – Low odds of recession in advanced economies,
though business cycles are maturing – China emphasizes stability, but upside is
constrained • U.S. business cycle becoming more mature;
wide distribution of policy outcomes − Tighter Fed and labor markets imply
progression in cycle − Solid earnings recovery but growth peaking − Potential policy changes make higher U.S.
growth possible, inflation upside probable • Firmer floors for inflation and yields than in
recent years
Q1 2017 TRENDS OUTLOOK Q2 2017
MACRO
MARKETS • Low volatility and broad rise in asset prices • Sharpest post-election trades lost steam,
including a move lower for the U.S. dollar
• Smaller allocation tilts at this point in the cycle • Favor international equities and inflation-resistant
assets • Policy risks could boost market volatility
Overview: Global Expansion Outweighs Political Uncertainty The continued worldwide recovery in industrial activity, trade, and commodity industries bolstered the most synchronized global expansion in the past several years, overshadowing political uncertainty in the U.S. and Europe. With the inflation backdrop firming and monetary policymakers moving to a less accommodative stance, the U.S. business cycle is becoming more mature, which warrants smaller allocation tilts at this point in the cycle.

SU
MM
AR
Y
-40-30-20-10
01020
Dec
-08
Sep
-02
Sep
-01
Jun-
10S
ep-9
0M
ar-0
8S
ep-0
8S
ep-1
5S
ep-9
9S
ep-0
4M
ar-0
3Ju
n-93
Jun-
05S
ep-9
2S
ep-0
7M
ar-0
5Ju
n-91
Jun-
06S
ep-8
8M
ar-9
4M
ar-1
5Ju
n-08
Dec
-97
Sep
-91
Jun-
16Ju
n-89
Sep
-14
Dec
-05
Sep
-96
Jun-
15D
ec-8
8D
ec-9
3D
ec-9
1Ju
n-95
Mar
-97
Jun-
14S
ep-1
6M
ar-1
0S
ep-0
5Ju
n-04
Dec
-92
Mar
-17
Dec
-96
Sep
-12
Dec
-06
Sep
-95
Mar
-99
Jun-
87D
ec-1
6Ju
n-99
Dec
-02
Dec
-04
Sep
-89
Dec
-11
Dec
-01
Mar
-98
Dec
-03
Sep
-09
Jun-
97
5
Q1 2017 (%) 1-Year (%) Q1 2017 (%) 1-Year (%)
Emerging-Market Stocks 11.5 17.7 High-Yield Bonds 2.7 16.9
Gold 8.6 0.6 Real Estate Stocks 2.5 5.3
Non-U.S. Small-Cap Stocks 8.1 11.4 U.S. Small-Cap Stocks 2.5 26.2
Non-U.S. Developed-Country Stocks 7.4 12.2 Long Government & Credit Bonds 1.6 1.0
U.S. Large-Cap Stocks 6.1 17.2 U.S. Corporate Bonds 1.3 3.0
U.S. Mid-Cap Stocks 5.1 17.0 Investment-Grade Bonds 0.8 0.4
Emerging-Market Bonds 3.9 8.8 Commodities -2.5 8.3
Risk Meter: U.S. Large-Cap Stock minus Treasury Bond Returns, 1987–2017 Quarterly Return Difference (%)
Risk Off
Risk On Mar-17 5.4%
Past performance is no guarantee of future results. It is not possible to invest directly in an index. See appendix for important index information. Assets represented by: Commodities – Bloomberg Commodity Index; Emerging-Market Bonds – JP Morgan EMBI Global Index; Emerging-Market Stocks – MSCI EM Index; Gold – Gold Bullion, LBMA PM Fix; High Yield Bonds – Bank of America Merrill Lynch (BofA ML) High Yield Bond Index; Investment-Grade Bonds – Bloomberg Barclays U.S. Aggregate Bond Index; Non-U.S. Developed-Country Stocks – MSCI EAFE Index; Non-U.S. Small-Cap Stocks – MSCI EAFE Small Cap Index; Real Estate Stocks – FTSE NAREIT Equity Index; U.S. Corporate Bonds – Bloomberg Barclays U.S. Credit Index; U.S. Large-Cap Stocks – S&P 500 Index; U.S. Mid-Cap Stocks – Russell Midcap Index; U.S. Small-Cap Stocks – Russell 2000 Index; U.S. Treasury Bonds – Bloomberg Barclays U.S. Treasury Index. Sources: Bloomberg Finance L.P., Haver Analytics, Fidelity Investments (AART), as of 3/31/17.
Non-U.S. Assets Led Widespread Q1 Gains Bolstered by a weaker dollar, non-U.S. equities led the Q1 global stock market rally, with emerging-market equities pushing past U.S. large-cap performance on a one-year basis for the first time in years. Flattish bond yields amid signs of moderate-but-not-overheating economic expansion provided a solid backdrop for most asset categories.

SU
MM
AR
Y
6
Relative Stock Market Performance U.S. Dollar
LEFT: Sources: U.S.: S&P 500 Index, Rest of World: Dow Jones World Ex-US Index. Small Cap: Russell 2000 Index. Large Cap: S&P 500, Haver Analytics, Fidelity Investments (AART), as of 3/31/2017. RIGHT: Sources: Federal Reserve, Haver Analytics, Fidelity Investments (AART), as of 3/31/17.
123
126
129
1-N
ov
11-N
ov
21-N
ov
1-D
ec
11-D
ec
21-D
ec
31-D
ec
10-J
an
20-J
an
30-J
an
9-Fe
b
19-F
eb
1-M
ar
11-M
ar
21-M
ar
31-M
ar
Broad Trade Weighted Dollar Index
3-Day Moving Average
0
2
4
6
8
10
1-N
ov
11-N
ov
21-N
ov
1-D
ec
11-D
ec
21-D
ec
31-D
ec
10-J
an
20-J
an
30-J
an
9-Fe
b
19-F
eb
1-M
ar
11-M
ar
21-M
ar
31-M
ar
US - Rest of World Small Cap - Large Cap
Nov. 8, 2016 = 0
Sharp Post-Election Trades Faded During Q1 After the U.S. elections on Nov. 8, 2016, investors bid up asset prices in anticipation of faster U.S. growth relative to the rest of the world, a stronger U.S. dollar, and an improved outlook for smaller U.S. businesses relative to large ones. Perhaps in recognition of the slower and more uncertain outlook for U.S. policy changes than originally perceived, many of these relative trades reversed during the first three months of 2017.

SU
MM
AR
Y
0
10
20
30
40
50
60
70
0
50
100
150
200
250
300
350
2000
2001
2002
2003
2004
2005
2006
2007
2008
2009
2010
2011
2012
2013
2014
2015
2016
2017
Global Policy Uncertainty Index VIX Index
7
Policy Uncertainty and Equity Market Volatility
Sources: Bloomberg Finance L.P., Fidelity Investments (AART), as of 3/31/17.
Index Level Index Level
Market Volatility Subdued Despite Political Uncertainty Stock market volatility remained at extremely low levels, even as the high level of global political uncertainty persisted. The uncertain outlook for U.S. economic legislation and upcoming elections in core European countries—including presidential elections in France during Q2—are likely to keep politics on the minds of many investors.

Theme: Crosswinds for Earnings

THE
ME
9
ROE =
Outlook
Profit Margins
Operating Efficiency
Interest Burden Leverage Tax
Burden x x x x
High but falling Peaking Low
but rising High
but peaking High
but might fall
Cost of labor, goods, interest rising
Sales growth up but productivity growth
waning
Will rise as borrowing rates rise
Will be hard to add to high level as rates rise
Corporate tax cut legislation possible
ROE is return on equity. The equation represents an illustrative diagram of the DuPont formula: ROE = (earnings before interest and taxes/sales) x (sales/assets – interest expense/assets) x (assets/equity) x (1- tax rate). AART as of 3/31/17.
Components of Return on Equity Not Moving in Lockstep Corporate earnings growth is rebounding off the profit-recession lows of early 2016, but the outlook points to a more moderate growth trend ahead. Historically high profit margins and corporate leverage will be increasingly difficult to expand if wages and interest costs continue to rise, although the possibility of a cut in the corporate tax rate offers a potential positive offset for profit growth.

THE
ME
10
6%
7%
8%
9%
10%
11%
12%
13%
14%
52%
53%
54%
55%
56%
57%
58%
59%
1965
1970
1975
1980
1985
1990
1995
2000
2005
2010
2015
Employee Compensation Profits
Compensation and Profit Margins
Shading represents U.S. economic recession as defined by the National Bureau of Economic Research (NBER). Sources: Bureau of Economic Analysis, NBER, Haver Analytics, Fidelity Investments (AART), as of 12/31/16.
Share of GDP, 4-quarter average Share of GDP, 4-quarter average
Rising Wages Chip Away at Record-High Profit Margins In a multi-decade trend reaching extremes in recent years, worker compensation dropped to all-time lows as a share of U.S. economic output, while the share of corporate profits rose to record highs. Amid signs of a secular peak in globalization and a cyclical pick-up in wages, these trends have faded, indicating the difficulty companies may have in expanding profit margins from such elevated levels.

THE
ME
0.0%
0.5%
1.0%
1.5%
2.0%
2.5%
3.0%
3.5%
4.0%
4.5%
1968
1970
1972
1974
1976
1978
1980
1982
1984
1986
1988
1990
1992
1994
1996
1998
2000
2002
2004
2006
2008
2010
2012
2014
2016
Labor Force Productivity Real GDP
11
Real GDP Components
Year-over-Year Growth (20-Year Average)
Sources: Bureau of Economic Analysis, Bureau of Labor Statistics, Haver Analytics, Fidelity Investments (AART), as of 12/31/16.
0.9%
1.4%
2.3%
Labor Force Peak (1962-1982): 2.3%
Productivity Peak (1949-1969): 3.0%
Scenarios for 4% Growth
20-Year AART Projections
Labor Force Growth 2.3% 1.0% 0.5% Labor Market Productivity 1.7% 3.0% 1.1% Real GDP Growth 4.0% 4.0% 1.6%
48% of labor force growth since 2000 comes from immigration
Much Higher 4% GDP Growth Not Likely over the Long Run A jump to 4% GDP growth on a secular basis would require some unlikely developments. Labor force growth would need to accelerate back to peak levels seen in the 1960s-’70s or productivity would need to rise to the pace of the postwar 1950-’60s boom. While government policy changes could boost the long-term outlook, slower population growth and aging demographics make a sustained move to much higher growth a tough proposition.

THE
ME
12
LEFT: Sources: Congressional Budget Office, Fidelity Investments (AART), as of 2/28/15. RIGHT: Shading represents U.S. economic recession as defined by the National Bureau of Economic Research (NBER). The seven-year lead in real intellectual capex compares what happened with capital investment (capex) seven years ago to what is going on with productivity today, to highlight the importance of capex in generating future productivity gains. Sources: NBER, Bureau of Economic Analysis, Bureau of Labor Statistics, Haver Analytics, Fidelity Investments (AART), as of 12/31/16.
Impact of $1 Fiscal Stimulus Boost over Next Two Years
$0.0
$0.5
$1.0
$1.5
Output below potential andFed's response limited
Output close to potential andFed's response typical
0.0%
0.5%
1.0%
1.5%
2.0%
2.5%
3.0%
3.5%
0%
2%
4%
6%
8%
10%
12%
1963
1967
1971
1975
1979
1983
1987
1991
1995
1999
2003
2007
2011
2015
2019
Real Intellectual Property Capex Real Productivity
U.S. Capex and Productivity
10-Year Annualized Rate, Leading 7 Years 10-Year Annualized Rate
Cyclical Boost to Growth Harder After Under-investment Government policies can boost cyclical growth, but the multiplier tends to be higher for stimulus when there is a large amount of economic slack and monetary policy is accommodative. Stronger productivity growth has tended to follow periods of higher capital expenditures. Boosting growth through fiscal stimulus may be more difficult now following a sustained period of low investment coupled with tighter labor markets and Fed policy.

THE
ME
13
5%
15%
25%
35%
0%
20%
40%
60%
80%
100%
120%
1988 1990 1992 1994 1996 1998 2000 2002 2004 2006 2008 2010 2012 2014 2016
Non-Financial Interest Expense as % of Profits Corp Debt Outstanding
Interest Expense and U.S. Corporate Debt
Corporate Debt Outstanding: Total amount of bonds in the Bloomberg Barclays U.S. Corporate IG and HY Bond Indices. High yield bonds have ratings of BB or lower as determined by Bloomberg Barclays with S&P/Moody’s and Fitch credit ratings. Shading represents U.S. economic recession as defined by the National Bureau of Economic Research (NBER). Sources: Bloomberg Barclays, NBER, Bureau of Economic Analysis, Haver Analytics, Fidelity Investments (AART), as of 12/31/16.
Share of GDP Share of Profits
Rising Rates May Raise Interest Expense, Limit Leverage Despite the significant increase in corporate debt since the 2008 recession, U.S. corporations have maintained a low interest expense ratio due to extremely low bond yields. With the Federal Reserve picking up the pace of monetary tightening, interest expense may begin to rise and it might be difficult for corporations to continue to boost return-on-equity via higher levels of leverage.

Economy/Macro Backdrop

EC
ON
OM
Y
15
Multi-Time-Horizon Asset Allocation Framework Fidelity’s Asset Allocation Research Team (AART) believes that asset price fluctuations are driven by a confluence of various factors that evolve over different time horizons. As a result, we employ a framework that analyzes trends among three temporal segments: tactical (short term), business cycle (medium term), and secular (long term).
DYNAMIC ASSET ALLOCATION TIMELINE
Business Cycle (10–30 years) Secular
HORIZONS
(1–10 years)
Tactical (1–12 months)
Portfolio Construction Asset Class | Country/Region | Sectors | Correlations
For illustrative purposes only. Source: Fidelity Investments (AART).

EC
ON
OM
Y
16
Note: The diagram above is a hypothetical illustration of the business cycle. There is not always a chronological, linear progression among the phases of the business cycle, and there have been cycles when the economy has skipped a phase or retraced an earlier one. Source: Fidelity Investments (AART), as of 3/31/17.
Business Cycle Framework
Most Synchronized Global Expansion in Years The global economy is experiencing a relatively steady, synchronized expansion. Broadly speaking, most developed economies are in more mature (mid to late) stages of the business cycle, with the eurozone not as far along as the United States. China’s improved cyclical trajectory has helped boost many emerging-market economies and catalyzed a recovery in the global manufacturing, trade, and commodity industries.

EC
ON
OM
Y
40%
45%
50%
55%
60%
65%
70%
75%
80%
85%
90%
2013
2014
2015
2016
2017
China Growth Recession Share of Components Rising (Y/Y)
Chinese Industrial Activity
2%
3%
4%
5%
6%
Jan-
2015
Mar
-201
5
May
-201
5
Jul-2
015
Sep
-201
5
Nov
-201
5
Jan-
2016
Mar
-201
6
May
-201
6
Jul-2
016
Sep
-201
6
Nov
-201
6
Jan-
2017
Mar
-201
7
1-Month SHIBOR
Chinese Interbank Rates
LEFT: Index is a proprietary diffusion index of underlying industrial production components. *A growth recession is a significant decline in activity relative to a country’s long-term economic potential. Sources: China National Bureau of Statistics, Haver Analytics, Fidelity Investments (AART), as of 2/28/17. RIGHT: SHIBOR = Shanghai Interbank Offered Rate. Sources: Haver Analytics, Fidelity Investments (AART), as of 3/31/17.
Share Rate
17
Positive Conditions in China, But Less Policy Support Boosted by extremely accommodative monetary and fiscal policy, China exited its growth recession in 2016 as economic activity in the manufacturing and housing sectors rebounded off multiyear lows.* Broader activity has continued to stabilize and improve on the margins, but policymakers’ shift to a less accommodative stance amid continued excess capacity and corporate leverage implies a ceiling to China’s cyclical upswing.

EC
ON
OM
Y
18
U.S. Economic Surprise Index
LEFT: Chart: Shading represents U.S. economic recession as defined by the National Bureau of Economic Research (NBER). Sources: Institute for Supply Management, NBER, Haver Analytics, Fidelity Investments (AART), as of 3/31/17. Table: Sources: Organization for Economic Cooperation & Development, Bank for International Settlements, Haver Analytics, Fidelity Investments (AART), as of 12/31/16. RIGHT: Sources: Morgan Stanley, Bloomberg Finance L.P., Fidelity Investments (AART), as of 2/28/17.
0
0
0
0
0
1
1
1
1
30
35
40
45
50
55
60
65
2006
2007
2008
2009
2010
2011
2012
2013
2014
2015
2016
2017
Index, > 50 signifies expansion
ISM Manufacturing PMI
Change in Real Manufacturing Unit Labor Costs Since 2008
U.S. Germany Canada Japan
27% 7% -4% -11%
-2.5
-2.0
-1.5
-1.0
-0.5
0.0
0.5
1.0
1.5
2.0
2.5
2010 2011 2012 2013 2014 2015 2016 2017
Activity Indicators Sentiment Indicators
Z-score
U.S. Economy Solid, Hopeful for Animal Spirits U.S. manufacturing and other external-oriented sectors have rebounded alongside the global industrial recovery, although the rise in U.S. labor costs during the past several years may limit future upside. The post-election surge in positive business and consumer sentiment continued during Q1 and may represent potential upside for growth, although activity measures have yet to climb in line with sentiment.
EC
ON
OM
Y
200
300
400
500
600
700
1%
2%
3%
4%
5%
2006
2007
2008
2009
2010
2011
2012
2013
2014
2015
2016
2017
Unemployment Claims Atlanta Fed Wage Growth
19 Sources: Department of Labor, Federal Reserve, Haver Analytics, Fidelity Investments (AART), as of 2/28/2017.
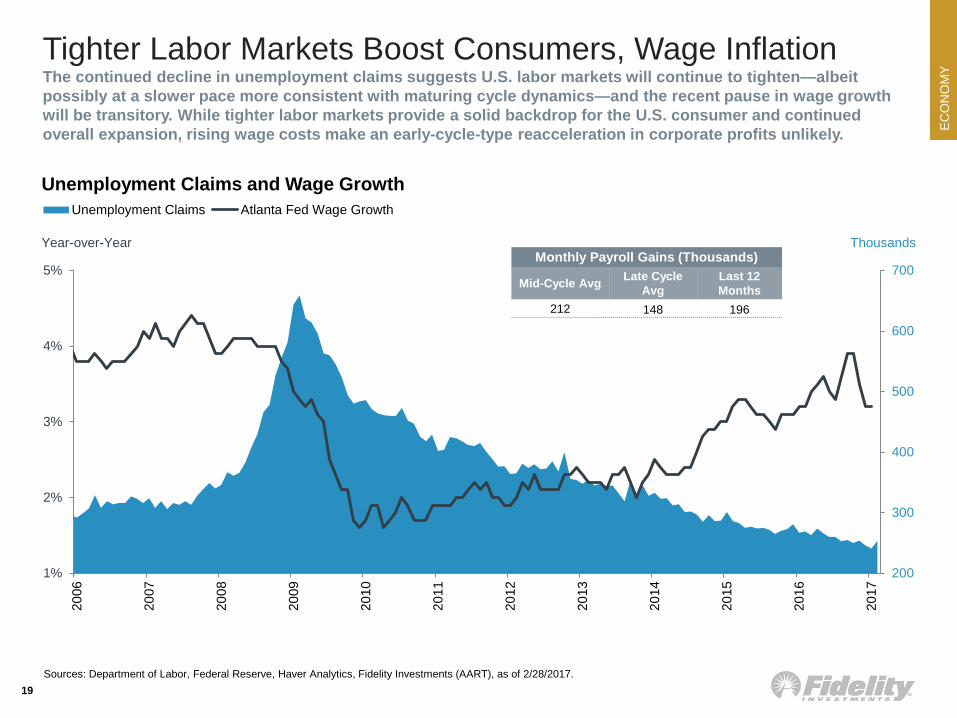
Unemployment Claims and Wage Growth
Year-over-Year Thousands Monthly Payroll Gains (Thousands)
Mid-Cycle Avg Late Cycle Avg
Last 12 Months
212 148 196
Tighter Labor Markets Boost Consumers, Wage Inflation The continued decline in unemployment claims suggests U.S. labor markets will continue to tighten—albeit possibly at a slower pace more consistent with maturing cycle dynamics—and the recent pause in wage growth will be transitory. While tighter labor markets provide a solid backdrop for the U.S. consumer and continued overall expansion, rising wage costs make an early-cycle-type reacceleration in corporate profits unlikely.

EC
ON
OM
Y
20
Globalization and Inflation
LEFT: KOF = KOF Swiss Economic Institute. Sources: KOF, International Monetary Fund (IMF), World Bank, Haver Analytics, Fidelity Investments (AART), as of 12/31/16. RIGHT: Fidelity Investments proprietary analysis of historical commodity performance, using data from BP Statistical Review of World Energy, U.S. Department of Agriculture, U.S. Geological Survey, and U.S. Foreign Agricultural Service. Wages = average hourly earnings. Sources: Bureau of Labor Statistics, Haver Analytics, Fidelity Investments (AART), as of 12/31/16.
Average Annualized Inflation
0%
10%
20%
Commodity Prices Wages
Mid Late
Mid- vs. Late-Cycle Inflation, 1966–2010
Secular and Cyclical Inflation Risks May Be on the Rise Secularly, while rising global integration removed barriers to trade and decreased the cost to produce consumer goods, peaking globalization may eliminate this source of disinflation for consumer prices. Cyclically, transitions to the late-cycle phase typically involve a pickup in commodity prices and wages. Today, wage inflation is gaining traction and commodity prices have recovered, although the overall level of inflation remains low.
%
2%
4%
6%
8%
10%
12%
40
45
50
55
60
65
1982
1984
1986
1988
1990
1992
1994
1996
1998
2000
2002
2004
2006
2008
2010
2012
2014
2016
KOF Globalization Index (Economic Component)U.S. Consumer Price Index
Change (5-Year Annualized) Index Level

EC
ON
OM
Y
21
0.2%
-4%
-2%
0%
2%
4%
6%
8%
2010 2011 2012 2013 2014 2015 2016 2017
Year-over-year %
Change in OECD Petroleum Inventories
LEFT: Sources: Energy Information Administration, Organization for Economic Cooperation & Development, Haver Analytics, Fidelity Investments (AART), as of 12/31/16. RIGHT: Sources: Based on IEA data from the IEA Oil Data Service.( © 2017 OECD/IEA), IEA Publishing, Baker Hughes, Haver Analytics, Fidelity Investments (AART), as of 3/31/17.
-1.0
-0.5
0.0
0.5
1.0
1.5
2.0
0
200
400
600
800
1000
1200
1400
1600
1800
2010 2011 2012 2013 2014 2015 2016 2017
U.S. Oil Rig Count U.S. Oil Production
# Rigs Annual Change, Millions of barrels/day
U.S. Oil Production
Mixed Fundamentals for Crude Oil Prices The stabilization of global oil inventories suggests the oil market is much better balanced than it has been during the past two years and indicates tightening supply-demand dynamics. However, the rebound in the U.S. oil rig count is helping to stabilize U.S. production and suggests producers may, at least temporarily, be able to increase production at current price levels—a dynamic that would limit near-term upside potential.

EC
ON
OM
Y
LEFT: Market is defined as the Fed Funds futures market. Sources: Federal Reserve, Bloomberg Finance L.P., Haver Analytics, Fidelity Investments (AART), as of 3/31/17. RIGHT: Data post-3/31/2017 from futures market. Sources: Bloomberg Finance L.P., Fidelity Investments (AART), as of 3/31/2017.
22
0
1
2
3
4
5
6
7
8
9
Dec-2015 Jun-2016 Dec-2016 Mar-2017
Federal Reserve Market
Total Number of Hikes (25 bps)
Total Expected Rate Hikes by Year-End 2017 Interest Rate Differential (U.S. vs. Germany)
Percentage Points
-2
-1
0
1
2
3
1994
1996
1998
2000
2002
2004
2006
2008
2010
2012
2014
2016
2018
U.S. Minus Germany 2-Year Gov't Bond Yields
Fed’s Tightening Outlook Firmer, Rest of World to Follow? After years of diminishing monetary tightening expectations and the market anticipating Fed rate hikes at a slower pace than the central bank’s forecast, both the market and the Fed aligned in Q1 on an outlook for more regular rate hikes ahead. But the market appears to expect minimal change in ECB policy, as the gap between U.S. and German short rates stood at its widest in 17 years and futures prices indicated an expectation to expand further.

EC
ON
OM
Y
23
-7%
-6%
-5%
-4%
-3%
-2%
-1%
0%20
10
2011
2012
2013
2014
2015
2016
G-7 China
Fiscal Deficits
g Tightening
g Neutral
g Easing ?
Mexico U.S.
Australia Canada
U.K. S. Korea
India
China Europe Russia Japan
Brazil
Brazil U.S. U.K.
Mexico
India Russia Canada Australia S. Korea
China Europe Japan
2015 2017
LEFT: For illustrative purposes only. Sources: Country central banks, Haver Analytics, Fidelity Investments (AART), as of 3/31/17. RIGHT: Sources: China National Bureau of Statistics, OECD (2016 data for OECD are estimates), Haver Analytics, Fidelity Investments (AART), as of 12/31/16.
% of GDP (Inverted)
Global Monetary Policy Heat Map
A Global Shift Away from Monetary Toward Fiscal Easing? Improved growth and higher inflation have transformed the landscape of global monetary policy from one dominated by extraordinary easing to a general drift toward less accommodation. With a growing number of industrialized countries no longer reducing government budget deficits after a multiyear period of austerity, policy action may be shifting from monetary to fiscal measures.

EC
ON
OM
Y
24 Source: Fidelity Investments, as of 12/12/16.
President GOP Congress
Fiscal Spending
Protectionism
Fiscal Austerity
Free Trade
Deregulation Tax Reform/ Tax Cuts Stricter Migration
+ growth + inflation
– growth + inflation
– growth + inflation
+ growth + corporate profits
Still a Wide Distribution of Possible U.S. Policy Outcomes Potential changes in economic policy can influence the cyclical outlook, but the political path ahead remains uncertain. President Trump and the GOP Congress generally intersect on pro-growth deregulation and tax-cut policies, but they have different views of fiscal and trade policy. Many of these policies tend to boost inflation, making the most likely outcome an upside risk to prices regardless of the policy mix.

EC
ON
OM
Y
25
The size of the circles represents total trade. The thickness of lines represents the volume of trade flows. Grey circles represent other countries. Sources: International Monetary Fund, Haver Analytics, as of 12/31/15.
Risk of U.S./China Trade War Is Worst-Case Scenario China and the U.S. are not only the world’s two largest economies but they are also the most central to worldwide trade, sitting at the heart of the global trade network. The potential for a more confrontational approach to trade relations is therefore a risk to the entire global economy because it would likely reverberate throughout the global system.
Global Trade Network

EC
ON
OM
Y
26
Fed: Federal Reserve. Sources: Market Assessment Statement of Global Asset Allocation’s Business Cycle Board, Fidelity Investments, as of 3/31/17
Potential Risks • Political uncertainty, particularly in several developed
markets, may incite volatility in the markets
• China’s economy continues to face cyclical headwinds and is one of the largest risks to the global environment
Asset Allocation Considerations • Less reliable relative asset performance patterns
generally merit smaller cyclical tilts
• Possibility of higher volatility emphasizes the importance of diversification and a disciplined investment strategy
U.S. economy is between mid and late cycle, and recession
risks remain low.
The global economy is experiencing synchronized
expansion.
Pace of Fed tightening will likely be gradual.
Outlook: Market Assessment Fidelity’s Business Cycle Board, composed of portfolio managers responsible for a variety of asset allocation strategies across Fidelity’s asset management unit, believes that the global economy is experiencing a synchronized expansion, and risks of recession are low. However, at this point in the cycle, smaller asset allocation tilts may be warranted, and the board emphasizes the importance of diversification.

U.S. Equity Markets

U.S
. EQ
UIT
Y
28
Q1 2017 Total Return
1-Year 16.3% 17.2% 17.0% 20.0% 26.2%
8.6%
6.1% 5.1%
3.0% 2.5%
Growth Large Caps Mid Caps Value Small Caps
Past performance is no guarantee of future results. It is not possible to invest directly in an index. All indices are unmanaged. Please see appendix for important index information. Equity market returns represented by: Growth – Russell 3000 Growth Index; Large Caps – S&P 500 Index; Mid Caps – Russell Midcap Index; REITs (Real Estate Investment Trusts) – FTSE NAREIT Equity Index; Small Caps – Russell 2000 Index; Value – Russell 3000 Value Index. Sources: FactSet, Fidelity Investments (AART), as of 3/31/17.
Growth Stocks, Large-Caps Led U.S. Equity Market Rally In a reversal of the performance trend that’s taken place since the U.S. election in November 2016, value and small-cap stocks lagged the broader market in Q1. Growth and large-caps outperformed, potentially signaling less investor conviction in the timing and direction of potential changes to economic policy.

U.S
. EQ
UIT
Y
1-Year 24.9% 13.2% 11.6% 7.1% 6.2% 19.2% 18.4% 2.5% 32.6% 1.7% 14.3% 17.2%
29
Q1 2017 Total Return 12.6%
8.4% 8.4%
6.4% 6.4% 5.9% 4.6%
3.5% 2.5%
-4.0%
-6.7%
6.1%
Info Tech ConsumerDiscretionary
Health Care Utilities ConsumerStaples
Materials Industrials Real Estate Financials TelecomServices
Energy S&P 500
Past performance is no guarantee of future results. It is not possible to invest directly in an index. All indices are unmanaged. Please see appendix for important index information. Sector investing involves risk. Because of its narrow focus, sector investing may be more volatile than investing in more diversified baskets of securities. Sector returns represented by S&P 500 sectors. Sources: FactSet, Fidelity Investments (AART), as of 3/31/17.
Technology Powered Broad-Based Gains Across Sectors Most U.S. equity sectors posted solid returns during Q1, although post-election leadership trends reversed somewhat. Financials underperformed the broader market, information technology and health care outperformed, and bond-proxy sectors (e.g., utilities and consumer staples) bounced back as bond yields moved sideways. Energy stocks lagged, as the recovery in crude oil prices lost steam.

U.S
. EQ
UIT
Y
30
0.4
0.5
0.6
0.7
0.8
0.9
1.0
2006
2007
2008
2009
2010
2011
2012
2013
2014
2015
2016
2017
Positive-to-Negative Guidance Ratio
Ratio (12-Month Average)
Company Earnings Guidance
LEFT: Sources: Standard & Poor’s, Fidelity Investments (AART), as of 3/31/17. RIGHT: Sources: Bloomberg Finance L.P., Fidelity Investments (AART), as of 2/28/17.
-$30
-$20
-$10
$0
$10
$20
$30
$40
$50
-15%
-10%
-5%
0%
5%
10%
15%
20%
25%
Mar
-12
Jun-
12S
ep-1
2D
ec-1
2M
ar-1
3Ju
n-13
Sep
-13
Dec
-13
Mar
-14
Jun-
14S
ep-1
4D
ec-1
4M
ar-1
5Ju
n-15
Sep
-15
Dec
-15
Mar
-16
Jun-
16S
ep-1
6D
ec-1
6M
ar-1
7 E
st20
17 E
st
S&P 500 Index Energy Sector
Y/Y Growth (4-Quarter Trailing) Earnings (4-Quarter Trailing)
Large-Cap Earnings per Share
Earnings Rebound Alongside Energy-Sector Improvement Corporate earnings recovered in Q4 2016 after six consecutive quarters of negative growth, helped by energy-sector profits moving into positive territory for the first time since oil prices began to tumble. The rebound from the profit recession should continue and is supported by an increasing share of companies giving positive guidance, although the trend growth rate is likely to moderate in coming quarters.

U.S
. EQ
UIT
Y
11x
13x
16x 15x
14x
11x
8x
4x
8x
12x
16x
<0 0-1 1-2 2-3 3-5 5-7 7+CPI (Year-over-Year) %
Price/5-Year Peak Real Earnings Ratio (average)
31
S&P 500 Valuations vs. Inflation (1925–2017)
Past performance is no guarantee of future results. Price and five-year peak earnings are adjusted for inflation. Sources: Standard & Poor’s, Bureau of Labor Statistics, Haver Analytics, Fidelity Investments (AART), as of 3/31/17.
Ratio
5x
10x
15x
20x
25x
30x
1977
1981
1985
1989
1993
1997
2001
2005
2009
2013
2017
Price/5-Year Peak Real Earnings Ratio
S&P 500 Valuations
Ratio
20-Year Average
Long-Term Average (1925–2017)
U.S. Stock Valuations No Longer Cheap but Not Extreme U.S. large-cap price-to-earnings (P/E) ratios are somewhat above their long-term historical averages, but we believe over the long term that stocks will sustain a valuation level closer to the average of the past 20 years. Valuations have historically had a negative relationship with inflation, but there is room for inflation to rise from today’s relatively low levels and still be generally supportive of high P/Es.

U.S
. EQ
UIT
Y
32
Past performance is no guarantee of future results. Sectors as defined by GICS. LEFT: Unshaded (white) portions above suggest no clear pattern of over- or underperformance vs. broader market. Double +/– signs indicate that the sector is showing a consistent signal across all three metrics: full-phase average performance, median monthly difference, and cycle hit rate. A single +/– indicates a mixed or less consistent signal. Sources: The Business Cycle Approach to Sector Investing, Fidelity Investments (AART), October 2016. RIGHT: This chart highlights the best-performing sectors in each of the mid-cycle, late-cycle, and recession phases, with an emphasis on the best performing sectors of the late cycle given the recent rise in late-cycle indicators in the U.S. TEC: Technology; ENE: energy; HTH: health care; MAT: materials. CNS: consumer staples. Hit rate calculates the frequency of a sector outperforming the broader equity market over each business cycle phase since 1962. Sources: Haver Analytics, Fidelity Investments (AART), as of 3/31/16.
Business Cycle Approach to Sectors
Sector Early Mid Late Recession
Financials +
Real Estate ++ -- Consumer
Discretionary ++ --
Technology + + -- --
Industrials ++ + --
Materials -- ++ - Consumer
Staples - + ++
Health Care - ++ ++
Energy -- ++
Telecom -- ++
Utilities -- - + ++ 0%
20%
40%
60%
80%
100%
0%
4%
8%
12%
16%
TEC ENE HTH MAT CNS
Geometric Average Median Hit Rate
Mid Cycle Late Cycle Recession
Magnitude of Sector Outperformance (1962–2010)
Annualized Returns Frequency
Sector Considerations: Think Through the Cycle A disciplined business cycle approach to sector allocation can produce active returns by favoring industries that may benefit from cyclical trends. While the mid-cycle phase generally offers more limited opportunities for relative sector performance, the late-cycle and recession phases have historically provided a number of sectors that more consistently outperformed the broader market.

International Equity Markets & Global Assets

INTE
RN
ATI
ON
AL
8.1% 7.6% 7.4%
4.6% 2.7%
13.4% 12.1% 11.5%
2.8%
8.6%
-2.5% EAFE
Small CapEurope EAFE Japan Canada EM Asia Latin
AmericaEmergingMarkets
EMEA Gold Commodities
Q1 2017 Total Return
Q1 2017 LC 5.2% 6.2% 4.9% 0.0% 2.1% 9.7% 7.7% 7.8% -0.1% #N/A #N/A
1-Year USD 11.4% 10.5% 12.2% 14.8% 15.6% 18.5% 23.6% 17.7% 9.7% 0.6% 8.3%
EM: emerging markets. LC: local currency. All returns are gross in U.S. dollars unless otherwise noted. Past performance is no guarantee of future results. It is not possible to invest directly in an index. All indices are unmanaged. Please see appendix for important index information. Index returns represented by: Canada – MSCI Canada Index; Commodities – S&P GSCI Commodities Index; EAFE – MSCI Europe, Australasia, Far East Index; EAFE Small Cap – MSCI EAFE Small Cap Index; EM Asia – MSCI Emerging Markets Asia Index; EMEA (Europe, Middle East, and Africa) – MSCI EM EMEA Index; Emerging Markets (EM) – MSCI EM Index; Europe – MSCI Europe Index; Gold – Gold Bullion Price, LBMA PM Fix; Japan – MSCI Japan Index; Latin America – MSCI EM Latin America Index. Sources: FactSet, Fidelity Investments (AART), as of 3/31/17.
Developed-Market Equities Emerging-Market Equities Commodities
34
Widespread Gains for International Equities Non-U.S. equity markets generally posted strong returns during Q1, with currency appreciation enhancing gains in U.S. dollar terms. Emerging-market equities surged, led by Asia and Latin America. Commodity prices generally weakened, but gold bounced back amid sustained political uncertainty in the U.S. and Europe.

INTE
RN
ATI
ON
AL
35
-4%
-2%
0%
2%
4%
6%
8%
2012 2013 2014 2015 2016
U.S. Global ex U.S. DM ex U.S. EM
Leading Economic Indicator, Y/Y %, GDP Weighted
Global Leading Economic Indicators
LEFT: DM ex US: Australia, Austria, Belgium, Canada, Denmark. Finland, France, Germany, Ireland, Italy, Japan, Netherlands, New Zealand, Norway, Portugal, Spain, Sweden, Switzerland, and United Kingdom, EM: Brazil, Chile, China, Czech Republic, Estonia, Greece, Hungary, India, Indonesia, Korea, Malaysia, Mexico, Poland, Russia, Slovakia, Slovenia, South Africa, Taiwan, Thailand and Turkey. Sources: Organization for Economic Cooperation & Development, Foundation for International Business & Economic Research, International Monetary Fund, Haver Analytics, Fidelity Investments (AART), as of 11/30/16. RIGHT: Sources: MSCI, FactSet, Fidelity Investments (AART), as of 1/31/17.
Global EPS Growth (Trailing 12 Months)
-25%
-20%
-15%
-10%
-5%
0%
5%
10%
15%
20%
2012 2013 2014 2015 2016 2017
MSCI USA MSCI ACWI ex USMSCI EAFE MSCI EM
Y/Y %
International Earnings Growth Closes Gap with U.S. After two years of weaker leading economic indicators, international economies have shown renewed cyclical growth momentum relative to the U.S. in recent months. Accordingly, the gap in corporate earnings growth has also narrowed, making the cyclical outlook for international equities relatively more attractive after several years of underperformance.

INTE
RN
ATI
ON
AL
0%
10%
20%
30%
40%
50%
60%
70%
80%
90%
100%
MXN GBP EUR CAD JPY
3/31/2017Last 12-Month Range
36
Valuation of Major Currencies vs. USD
Percentile vs. Long-term History
LEFT: DM: Developed Market. EM: Emerging Market. Past performance is no guarantee of future results. It is not possible to invest directly in an index. All indices are unmanaged. Please see appendix for important index information. Price-to-earnings (P/E) ratio (or multiple): stock price divided by earnings per share, which indicators how much investors are paying for a company’s earnings power. Five-year peak earnings are adjusted for inflation. DM countries: Australia, Austria, Belgium, Canada, Denmark, Finland, France, Germany, Ireland, Italy, Japan, Netherlands, New Zealand, Norway, Portugal, Spain, Sweden, Switzerland, and the UK. EM countries: Brazil, Chile, China, Czech Republic, Greece, Hungary, India, Indonesia, Malaysia, Mexico, Poland, Russia, South Africa, South Korea, Thailand, and Turkey. Sources: FactSet, MSCI, Haver Analytics, Fidelity Investments (AART), as of 2/28/17. Source: MSCI, FactSet, Fidelity Investments (AART), as of 2/28/17. RIGHT: Percentiles include period 2000-2017. Sources: Federal Reserve Board, Haver Analytics, Fidelity Investments (AART), as of 3/31/17. MXN: Mexican peso, GBP: British pound, EUR: euro, CAD: Canadian dollar, JPY: Japanese yen.
Valuation of Major Equity Indexes vs U.S.
0.0
0.2
0.4
0.6
0.8
1.0
1.2
1.4
1995
1996
1997
1998
1999
2000
2001
2002
2003
2004
2005
2006
2007
2008
2009
2010
2011
2012
2013
2014
2015
2016
2017
DM vs U.S. EM vs U.S.
Relative Price/Peak Real 5-Year Earnings
Relatively Expensive
Relatively Cheap
Valuations Are a Secular Positive for Non-U.S. Equities Price-to-earnings ratios for both developed and emerging-market equities remain attractive versus the U.S. Moreover, the U.S. dollar, despite weakening somewhat over the course of the first quarter, remains at the upper end of historical ranges versus many currencies. Both factors provide a favorable long-term valuation backdrop for international equity returns.

INTE
RN
ATI
ON
AL
37
LEFT: *Past 12-month correlation uses weekly return data. KOF = KOF Swiss Economic Institute. Past performance is no guarantee of future results. It is not possible to invest directly in an index. All indices are unmanaged. Please see appendix for important index information. International Equities – MSCI ACWI ex-U.S. U.S. Equities – S&P 500 Index. Sources: MSCI, Standard & Poor’s, Bloomberg Finance, L.P., Swiss Economic Institute, Fidelity Investments (AART), as of 3/31/17. RIGHT: Excess returns represent industry average returns for each set of funds (active or passive, including closed or merged funds). International funds labeled as “foreign large growth/value/blend” by Morningstar. Average excess returns: the average of all monthly one-year rolling excess returns for all funds in the set under analysis, using overlapping one-year periods and data from Jan. 1, 1992, to Dec. 31, 2016. Excess returns are returns relative to the primary prospectus benchmark of each fund, net of fees. Basis point: 1/100th of a percentage point. Past performance is no guarantee of future results. This chart does not represent actual or future performance of any individual investment option. Industry aggregate returns are equal-weighted for all funds in each set. Periods determined by availability of sufficient passive index fund data. Sources: Fidelity Leadership Series paper “Finding Superior Active Equity Managers: A Simple Approach for Investors” (May 2015), Morningstar, Fidelity Investments, as of 12/31/16.
84
-31 -40
-20
0
20
40
60
80
100
Active Passive
Basis Points
International Large-Cap Excess Returns (Avg. 1-Year Rolling) 1992–2016
Equity Correlations and Globalization
Correlation over past 12 months*
40
45
50
55
60
65
0.0
0.1
0.2
0.3
0.4
0.5
0.6
0.7
0.8
0.9
1.0
1991
1993
1995
1997
1999
2001
2003
2005
2007
2009
2011
2013
2015
2017
U.S. and International Equity CorrelationKOF Index of Economic Globalization
Index Level Rolling 3-Year Correlation of Monthly Returns
Falling Correlations May Provide More Active Opportunities Over the past three decades, rising globalization has coincided with an increase in global equity correlations, but recently, anti-globalization pressures may be contributing to greater diversification benefits for non-U.S. equities. Lower correlations could further boost opportunities for active international equity managers, who have exceeded benchmark performance over the long term by taking advantage of less efficient markets.

Fixed-Income Markets

FIXE
D IN
CO
ME
39
Q1 2017 Total Return
1-Year 8.8% 16.9% 0.2% 1.0% 3.0% 1.5% 9.8% 0.9% 0.1% -1.4% 1.2% 0.2% 0.4%
3.9%
2.7%
1.6% 1.6% 1.3% 1.3% 1.2% 0.9% 0.8% 0.7% 0.5% 0.5%
0.8%
EM D
ebt
Hig
h Yi
eld
Mun
icip
al
Long
Gov
t & C
redi
t
Cre
dit
TIPS
Leve
rage
dLo
an CM
BS
Agen
cy
Trea
surie
s
ABS
MB
S
Aggr
egat
e
Past performance is no guarantee of future results. It is not possible to invest directly in an index. All indices are unmanaged. Index returns represented by: ABS (Asset-Backed Securities) – Bloomberg Barclays ABS Index; Agency – Bloomberg Barclays U.S. Agency Index; Aggregate – Bloomberg Barclays U.S. Aggregate Bond Index; CMBS (Commercial Mortgage-Backed Securities) – Bloomberg Barclays Investment-Grade CMBS Index; Credit – Bloomberg Barclays U.S. Credit Bond Index; EM Debt (Emerging-Market Debt) – JP Morgan EMBI Global Index; High Yield – BofA ML U.S. High Yield Index; Leveraged Loan – S&P/LSTA Leveraged Loan Index; Long Government & Credit (Investment-Grade) – Bloomberg Barclays Long Government & Credit Index; MBS (Mortgage-Backed Securities) – Bloomberg Barclays MBS Index; Municipal – Bloomberg Barclays Municipal Bond Index; TIPS (Treasury Inflation-Protected Securities) – Bloomberg Barclays U.S. TIPS Index; Treasuries – Bloomberg Barclays U.S. Treasury Index. Sources: FactSet, Fidelity Investments (AART), as of 3/31/17.
Credit Categories Boosted by Further Spread Tightening All fixed-income categories posted positive performance in Q1 amid flattish interest rates, with lower-credit-quality categories leading the way due to tightening credit spreads. Emerging-market debt was the best performer, benefiting from stable global growth. During the past year, lower-credit-quality assets have performed far better than their interest-rate-sensitive counterparts.

FIXE
D IN
CO
ME
40
Past performance is no guarantee of future results. It is not possible to invest directly in an index. All indices are unmanaged. Please see appendix for important index information. Percentile ranks of yields and spreads based on historical period from 2000 to 2016. MBS: mortgage-backed security; CMBS: commercial mortgage-backed security. All categories represented by respective Bloomberg Barclays bond indices. Sources: Bloomberg Barclays, Fidelity Investments (AART), as of 3/31/17.
34 26 27
22 8
8
19 19 17
29
20 13
0%
10%
20%
30%
40%
50%
60%
70%
80%
90%
100%
0%
1%
2%
3%
4%
5%
6%
7%
U.S. AggregateBond
MBS CMBS CorporateInvestment Grade
CorporateHigh Yield
Emerging-MarketDebt
Fixed-Income Yields and Spreads
Yield Yield and Spread Percentiles
Credit Spread Treasury Rates Spread Percentile Yield Percentile
Yields and Spreads Remain Low Relative to History Despite a third rate hike from the Federal Reserve in Q1, bond yields remain extremely low relative to history. Credit spreads compressed further in emerging-market debt and corporate high-yield categories, making them the most expensive categories relative to their own histories, although spreads are below average across the entire bond universe.

FIXE
D IN
CO
ME
0%
2%
4%
6%
8%
10%
12%
14%
16%
2017
2014
2011
2008
2005
2002
1999
1996
1993
1990
1987
1984
1981
1978
1975
1972
1969
1966
1963
1960
1957
1954
1951
1948
1945
1942
1939
1936
1933
1930
1927
1924
1921
1918
1915
1912
1909
1906
1903
1900
1897
1894
1891
1888
1885
1882
1879
1876
1873
41
Even When Rates Rise, Bond Returns Can Be Resilient The 35-year bull market for U.S. Treasury bonds included outsized returns and brought interest rates to their lowest levels in recent decades, but bond yields are only modestly lower when compared to long-term history. During the four decades of rising rates from 1941 to 1981, high-quality investment-grade bonds provided positive nominal returns as increasing coupons helped offset the negative impact of price declines.
IG: Investment Grade. Past performance is no guarantee of future results. Asset class total returns are represented by indexes from Fidelity Investments, Morningstar, and Bloomberg Barclays. Fidelity Investments proprietary analysis of historical asset class performance, which is not indicative of future performance. Sources: U.S. Treasury, Barclays, Bloomberg Finance L.P., Fidelity Investments (AART) as of 2/28/2017.
Yield
10-Year U.S. Treasury Yields Period of Rising Rates
(1941-1981) Period of Falling Rates
(1982-2017)
Average Annualized IG Bond Returns 3.4% 8.0%

FIXE
D IN
CO
ME
11%
1% 0% 0%
25%
17%
13%
5%
0%
5%
10%
15%
20%
25%
1 Year 3 Year 5 Year 10 Year
Investment-Grade Bonds Stocks
42
Percentage of Holding Periods with Negative Returns, 1926–2016
Rolling Periods
Worst Total Returns over Various Holding Periods
1 Year 3 Year 5 Year 10 Year
Bonds -9% -1% 0% 1%
Stocks -68% -42% -17% -5%
Based on rolling monthly holding periods. Past performance is no guarantee of future results. Asset class total returns are represented by indexes from Fidelity Investments, Morningstar, Standard & Poor’s and Bloomberg Barclays. Fidelity Investments proprietary analysis of historical asset class performance, which is not indicative of future performance. Source: Fidelity Investments (AART) as of 12/31/2016.
Bonds Historically Much Less Volatile than Stocks Historically, investment-grade bonds—the most interest-rate-sensitive bond category—offered better downside protection than stocks, even when rates were rising. Bonds have had lower probabilities of negative returns and less severe episodes of losses. Bonds have posted positive returns during nearly all medium and longer-term time horizons—even during rising-rate environments—as higher coupons countered price declines.

FIXE
D IN
CO
ME
43
0.0%
0.5%
1.0%
1.5%
2.0%
2.5%
3.0%
Jan-
10
Apr
-10
Jul-1
0
Oct
-10
Jan-
11
Apr
-11
Jul-1
1
Oct
-11
Jan-
12
Apr
-12
Jul-1
2
Oct
-12
Jan-
13
Apr
-13
Jul-1
3
Oct
-13
Jan-
14
Apr
-14
Jul-1
4
Oct
-14
Jan-
15
Apr
-15
Jul-1
5
Oct
-15
Jan-
16
Apr
-16
Jul-1
6
Oct
-16
Jan-
17
Apr
-17
Jul-1
7
Oct
-17
Jan-
18
Average LIBOR Floor LIBOR
Index performance shown does not reflect the deduction of advisory fees, transaction charges, and other expenses, which if charged would reduce performance. All indices are unmanaged. Investing directly in an index is not possible. Past performance is no guarantee of future results. Dotted line reflects Eurodollar futures expectation of 3-month LIBOR going forward. Sources: S&P Global Market Intelligence, Bloomberg Barclays, Fidelity Investments (AART) as of 3/31/2017.
Percentage of Loans with LIBOR Floor
2010 2017
10% 85%
Yield
Leveraged Loan Floor Rates vs. 3-month LIBOR
Leveraged Loans: Income to Benefit from Rising Rates Most leveraged loans pay a variable-rate coupon equal to 3-month LIBOR plus a credit spread, and in recent years have included a LIBOR floor provision to ensure a minimum rate paid to investors. During Q1, LIBOR rose above the average floor for the first time in several years, thereby allowing the variable-rate feature to provide an upward coupon adjustment if short-term interest rates continue to rise.

FIXE
D IN
CO
ME
44
Past performance is no guarantee of future results. It is not possible to invest directly in an index. IG: investment grade. Index returns represented by: Emerging Market Debt – JPM EMBI Global Index; Foreign IG Bonds – Bloomberg Barclays Global Aggregate ex-USD Index Unhedged; Bond Index; Leveraged Loans – S&P/LSTA Performing Loan Index; U.S. Government – Bloomberg Barclays U.S. Government Index; U.S. High Yield – BofA ML High Yield Index; U.S. Investment Grade – Bloomberg Barclays U.S. Aggregate Bond Index. Sources: Morningstar, Fidelity Investments (AART), as of 12/31/16.
0%5%
10%15%20%25%30%35%
Cor
e Pl
us
Mul
ti-Se
ctor
U.S
. Gov
t
Leve
rage
d Lo
ans
IG C
orpo
rate
s
EM
Deb
t
Hig
h Yi
eld
Sov
erei
gn
1-Year Negative Return Periods, 1998–2016
-35%-30%-25%-20%-15%-10%
-5%0%
U.S
. Gov
t
Cor
e Pl
us
IG C
orpo
rate
s
Sov
erei
gn
Mul
ti-Se
ctor
EM
Deb
t
Leve
rage
d Lo
ans
Hig
h Yi
eld
% of Rolling Periods Total Return
Worst 1-Year Returns, 1998–2016
Portfolio Description
Core Plus
80% U.S. Investment Grade 10% U.S. High Yield 5% Leveraged Loans 5% Emerging Market
Portfolio Description
Multi- Sector
40% High Yield 25% U.S. Government 15% Emerging Market 15% Foreign IG Bonds
5% Leveraged Loans
The Benefits of Diversification in a Bond Portfolio Fixed-income strategies with designated allocations in both high-quality bonds and higher-yielding sectors have exhibited consistent downside protection. Both a “core-plus” and a “multi-sector” portfolio have generated fewer periods of negative returns than any individual bond sector, while providing a lower magnitude of losses than lower-quality sectors.

Asset Allocation Themes

AS
SE
T A
LLO
CA
TIO
N
46
Past performance is no guarantee of future results. Asset class total returns are represented by indexes from the following sources: Fidelity Investments, Morningstar, and Bloomberg Barclays. Fidelity Investments: proprietary analysis of historical asset class performance, which is not indicative of future performance.
0%
10%
20%
Mid Late
Stocks High Yield Commodities Investment-Grade Bonds
Asset Class Performance in Mid- and Late-Cycle Phases (1950–2010)
Mid-Cycle: Strong asset class performance • Favor economically sensitive assets • Broad-based gains
Late-Cycle: Mixed asset class performance • Favor inflation-resistant assets • Gains more muted
Annual Absolute Return (Average)
Historical Playbook for Mid- and Late-Cycle Phases Late cycles have the most mixed performance of any business cycle phase, with more limited overall upside than mid-cycle phases. There is less confidence in equity performance, though stocks have typically outperformed bonds. Inflation-resistant assets, such as commodities, energy stocks, short-duration bonds, and TIPS, have typically performed relatively well.

AS
SE
T A
LLO
CA
TIO
N
47
-2%
0%
2%
4%
6%
8%
10%
12%
14%
16%
Falling Inflation Rising Inflation Full Period
U.S. Stocks 10-Year Treasury
Returns of Major Asset Classes, 1935-2015
-0.2
-0.1
0.0
0.1
0.2
0.3
0.4
0%
1%
2%
3%
4%
5%
6%
7%
1969
1972
1974
1977
1979
1982
1984
1987
1989
1992
1994
1997
1999
2002
2004
2007
2009
2012
2014
InflationStock/Aggregate Bond Index CorrelationStock/Commodity Correlation
20-Year Rolling Inflation Rate vs Correlations
LEFT: Past performance is no guarantee of future results. It is not possible to invest directly in an index. Stocks – top 3,000 U.S. stocks by market capitalization. 10-Year Treasury – Bloomberg Barclays U.S. 10-Year Treasury Bond Index. Sources: Bureau of Labor Statistics, Global Financial Data, Haver Analytics, Fidelity Investments (AART), as of 12/31/15. RIGHT: Inflation as represented by personal consumption expenditure. Sources: Bureau of Economic Analysis, Bloomberg Finance L.P., Haver Analytics, Fidelity Investments (AART), as of 12/31/16.
Year-over-year change Rolling correlations
Annualized Real Return
Inflation Risk Matters, Even if Inflation Remains Subdued Any inflation erodes the purchasing power of portfolios. In addition, equity and bond returns have historically experienced headwinds during periods of rising inflation. Further, when inflation has been higher and more volatile—as it was in the 1970s—the performance correlation between stocks and bonds increased, leaving inflation-resistant assets such as commodities as one of the few diversifiers for stocks during these periods.
2016

AS
SE
T A
LLO
CA
TIO
N
48
-2%
0%
2%
4%
6%
8%
10%
12%
Sto
cks
Ene
rgy
Sto
cks
Mat
eria
l Sto
cks
Com
mod
ities
Gol
d
Inv.
Gra
de B
onds
Trea
surie
s
T-bi
lls
Annualized Real Return
U.S. Falling Inflation Periods, 1966-2015
-1%
0%
1%
2%
3%
4%
5%
6%
7%
Sto
cks
Ene
rgy
Sto
cks
Gol
d
Mat
eria
l Sto
cks
Com
mod
ities
Inv.
Gra
de B
onds
Trea
surie
s
T-bi
lls
Annualized Real Return
U.S. Rising Inflation Periods, 1966-2015
Past performance is no guarantee of future results. It is not possible to invest directly in an index. Index returns represented by: Stocks – top 3000 U.S. stocks by market capitalization; Gold – Gold Bullion Price, LBMA PM Fix; Commodities – Bloomberg Commodity Index; Investment-Grade Bonds – Bloomberg Barclays Long Government & Credit Index; Treasuries – Bloomberg Barclays U.S. Treasury Index; and Treasury Bills – Bloomberg Barclays U.S. 1-3 Month Treasury Bill Index. Sectors as defined by GICS. Sources: Bureau of Labor Statistics, Haver Analytics, Fidelity Investments (AART), as of 12/31/15.
Investors May Be Able to Mitigate Inflation Risks Even though the performance of the major asset classes tends to deteriorate when inflation is rising, inflation-resistant asset classes—such as commodities, gold, commodity-producing equities, and short-duration bonds—have historically held up better in such environments. A strategic allocation to a basket of such assets may help investors manage the risk that inflation could be higher than anticipated over the long term.

AS
SE
T A
LLO
CA
TIO
N
0%
2%
4%
6%
8%
10%
12%
14%
16%
18%
0% 2% 4% 6% 8% 10% 12% 14% 16% 18%
GDP Growth (20-Year Average)
U.S. current yield (2.4%)
U.S. next 20 years forecast yield (3.6%)
49 Sources: Official Country Estimates, Haver Analytics, Fidelity Investments (AART), as of 3/31/17.
U.S. Secular Growth Forecast
Nominal Government Bond Yields and GDP Growth
10-Year Sovereign Yield (20-Year Average)
Historical Observations of Various Countries
Secular Rate Outlook: Higher than Now, Lower than History Over long periods of time, GDP growth has a tight positive relationship with long-term government bond yields (yields generally have averaged the same rate as nominal growth). We expect interest rates will rise over the long term to an average closer to our 3.6% nominal GDP forecast, but this implies they would settle at a significantly lower level than their historical averages.

AS
SE
T A
LLO
CA
TIO
N
50
*2017 as of 3/31/17. Past performance is no guarantee of future results. Diversification/asset allocation does not ensure a profit or guarantee against loss. It is not possible to invest directly in an index. All indices are unmanaged. Please see appendix for important index information. Asset classes represented by: Commodities – Bloomberg Commodity Index; Emerging-Market – MSCI Emerging Markets Index; Foreign-Developed Country – MSCI EAFE Index; Growth – Russell 3000 Growth Index; High Yield – Bank of America Merrill Lynch U.S. High Yield Index; Investment-Grade – Bloomberg Barclays U.S. Aggregate Bond Index; Large Cap – S&P 500 Index; Real Estate – FTSE NAREIT Equity Index; Small Cap – Russell 2000 Index; Value – Russell 3000 Value Index. Sources: Morningstar, Standard & Poor’s, Haver Analytics, Fidelity Investments (AART), as of 3/31/17.
Periodic Table of Returns
1992 1993 1994 1995 1996 1997 1998 1999 2000 2001 2002 2003 2004 2005 2006 2007 2008 2009 2010 2011 2012 2013 2014 2015 2016 2017* Legend
18% 75% 17% 38% 35% 35% 35% 66% 32% 14% 26% 56% 32% 35% 35% 40% 5% 79% 28% 8% 20% 39% 28% 5% 21% 12% Emerging-Market Stocks
17% 33% 8% 37% 23% 33% 29% 34% 26% 8% 10% 47% 26% 21% 33% 16% -20% 58% 27% 8% 19% 34% 14% 3% 18% 9% Growth Stocks
15% 20% 3% 37% 23% 29% 21% 27% 12% 5% 4% 39% 21% 14% 27% 12% -26% 37% 19% 4% 18% 33% 13% 1% 18% 7% Foreign-Developed Country Stocks
15% 19% 2% 30% 22% 24% 20% 24% 8% 2% -2% 37% 18% 12% 22% 11% -34% 32% 18% 4% 18% 32% 12% 1% 12% 6% Large Cap Stocks
11% 19% 1% 28% 22% 22% 14% 21% -1% -2% -6% 31% 17% 7% 18% 7% -36% 28% 17% 2% 16% 23% 11% 1% 12% 4% 60% Large Cap40% IG Bonds
8% 17% 0% 20% 16% 20% 9% 21% -3% -4% -9% 31% 11% 5% 16% 6% -36% 27% 16% 2% 16% 19% 6% 0% 11% 3% Value Stocks
8% 10% -1% 18% 15% 13% 3% 12% -5% -4% -15% 29% 11% 5% 12% 5% -37% 26% 15% 0% 16% 7% 5% -4% 9% 3% High-Yield Bonds
7% 10% -2% 15% 11% 10% -3% 7% -9% -12% -16% 28% 9% 5% 11% 2% -38% 20% 15% -4% 15% 3% 3% -4% 8% 3% Small Cap Stocks
5% 10% -2% 15% 6% 2% -18% 3% -14% -20% -20% 24% 8% 4% 9% -1% -38% 19% 12% -12% 11% -2% -2% -5% 7% 3% REITs
4% 4% -3% 12% 6% -3% -25% -1% -22% -20% -22% 19% 7% 3% 4% -2% -43% 18% 8% -13% 4% -2% -4% -15% 3% 1% Investment-Grade Bonds
-12% -1% -7% -5% 4% -12% -27% -5% -31% -21% -28% 4% 4% 2% 2% -16% -53% 6% 7% -18% -1% -10% -17% -25% 2% -3% Commodities
Performance Rotations Underscore Need for Diversification The performance of different assets has fluctuated widely from year to year, and the magnitude of returns can vary significantly among asset classes in any given year—even among asset classes that are moving in the same direction. A simple portfolio allocation with 60% in U.S. equities and 40% in U.S. bonds illustrates the potential benefits of diversification.

51
Appendix: Important Information Information presented herein is for discussion and illustrative purposes only and is not a recommendation or an offer or solicitation to buy or sell any securities. Views expressed are as of the date indicated, based on the information available at that time, and may change based on market and other conditions. Unless otherwise noted, the opinions provided are those of the authors and not necessarily those of Fidelity Investments or its affiliates. Fidelity does not assume any duty to update any of the information. Unless otherwise disclosed to you, any investment or management recommendation in this document is not meant to be impartial investment advice or advice in a fiduciary capacity, is intended to be educational and is not tailored to the investment needs of any specific individual. Fidelity and its representatives have a financial interest in any investment alternatives or transactions described in this document. Fidelity receives compensation from Fidelity funds and products, certain third-party funds and products, and certain investment services. The compensation that is received, either directly or indirectly, by Fidelity may vary based on such funds, products and services, which can create a conflict of interest for Fidelity and its representatives. Fiduciaries are solely responsible for exercising independent judgment in evaluating any transaction(s) and are assumed to be capable of evaluating investment risks independently, both in general and with regard to particular transactions and investment strategies. Investment decisions should be based on an individual’s own goals, time horizon, and tolerance for risk. Nothing in this content should be considered to be legal or tax advice and you are encouraged to consult your own lawyer, accountant, or other advisor before making any financial decision. These materials are provided for informational purposes only and should not be used or construed as a recommendation of any security, sector, or investment strategy.
Fidelity does not provide legal or tax advice and the information provided herein is general in nature and should not be considered legal or tax advice. Consult with an attorney or a tax professional regarding your specific legal or tax situation.
Past performance and dividend rates are historical and do not guarantee future results.
Investing involves risk, including risk of loss.
Diversification does not ensure a profit or guarantee against loss.
Index or benchmark performance presented in this document does not reflect the deduction of advisory fees, transaction charges, and other expenses, which would reduce performance.
Indexes are unmanaged. It is not possible to invest directly in an index.
Although bonds generally present less short-term risk and volatility than stocks, bonds do contain interest rate risk (as interest rates rise, bond prices usually fall, and vice versa) and the risk of default, or the risk that an issuer will be unable to make income or principal payments.
Additionally, bonds and short-term investments entail greater inflation risk—or the risk that the return of an investment will not keep up with increases in the prices of goods and services—than stocks. Increases in real interest rates can cause the price of inflation-protected debt securities to decrease.
Stock markets, especially non-U.S. markets, are volatile and can decline significantly in response to adverse issuer, political, regulatory, market, or economic developments. Foreign securities are subject to interest rate, currency exchange rate, economic, and political risks, all of which are magnified in emerging markets.
The securities of smaller, less well-known companies can be more volatile than those of larger companies.
Growth stocks can perform differently from the market as a whole and from other types of stocks, and can be more volatile than other types of stocks. Value stocks can perform differently from other types of stocks and can continue to be undervalued by the market for long periods of time.
Lower-quality debt securities generally offer higher yields but also involve greater risk of default or price changes due to potential changes in the credit quality of the issuer. Any fixed-income security sold or redeemed prior to maturity may be subject to loss.
Floating-rate loans generally are subject to restrictions on resale, and sometimes trade infrequently in the secondary market; as a result, they may be more difficult to value, buy, or sell. A floating-rate loan may not be fully collateralized and therefore may decline significantly in value.
The municipal market can be affected by adverse tax, legislative, or political changes, and by the financial condition of the issuers of municipal securities. Interest income generated by municipal bonds is generally expected to be exempt from federal income taxes and, if the bonds are held by an investor resident in the state of issuance, from state and local income taxes. Such interest income may be subject to federal and/or state alternative minimum taxes. Investing in municipal bonds for the purpose of generating tax-exempt income may not be appropriate for investors in all tax brackets. Generally, tax-exempt municipal securities are not appropriate holdings for tax-advantaged accounts such as IRAs and 401(k)s.
The commodities industry can be significantly affected by commodity prices, world events, import controls, worldwide competition, government regulations, and economic conditions.
The gold industry can be significantly affected by international monetary and political developments, such as currency devaluations or revaluations, central bank movements, economic and social conditions within a country, trade imbalances, or trade or currency restrictions between countries.
Changes in real estate values or economic downturns can have a significant negative effect on issuers in the real estate industry.
Leverage can magnify the impact that adverse issuer, political, regulatory, market, or economic developments have on a company. In the event of bankruptcy, a company’s creditors take precedence over the company’s stockholders.

52
Appendix: Important Information Market Indices
BofA ML Corporate Real Estate Index, a subset of BofA ML U.S. Corporate Index, is a market capitalization-weighted index of U.S. dollar-denominated investment-grade corporate debt publicly issued in the U.S. domestic market by real estate issuers. Qualifying securities must have an investment-grade rating (based on an average of Moody’s, S&P, and Fitch). In addition, qualifying securities must have at least one year remaining to final maturity, a fixed coupon schedule, and a minimum amount outstanding of $250 million. BofA ML U.S. Real Estate Index is a subset of the BofA ML Real Estate Corporate Index; qualifying securities must have an investment grade rating and an investment grade-rated country of risk. BofA ML U.S. High Yield Bond Index is a market capitalization-weighted index of U.S. dollar denominated below investment grade corporate debt publicly issued in the U.S. domestic market.
The BofA/Merrill Lynch High-Yield Bond Master II Index is an unmanaged index that tracks the performance of below-investment-grade, U.S.-dollar-denominated corporate bonds publicly issued in the U.S. domestic market. Bloomberg Barclays U.S. 1-3 (1-5) Year Government Credit Index includes all publicly issued U.S. government and corporate securities that have a remaining maturity between one and three (five) years and are rated investment grade. Bloomberg Barclays U.S. 1-5 Year Credit Index is designed to cover publicly issued U.S. corporate and specified non-U.S. debentures and secured notes with a maturity between one and five years and meet the specified liquidity and quality requirements; bonds must be SEC-registered to qualify. Bloomberg Barclays U.S. 1-5 Year Municipal Index covers the one- to five-year maturity, U.S. dollar-denominated, tax-exempt bond market with four main sectors: state and local general obligation bonds, revenue bonds, insured bonds, and pre-refunded bonds. Bloomberg Barclays ABS Index is a market value-weighted index that covers fixed-rate asset-backed securities with average lives greater than or equal to one year and that are part of a public deal; the index covers the following collateral types: credit cards, autos, home equity loans, stranded-cost utility (rate-reduction bonds), and manufactured housing. Bloomberg Barclays CMBS Index is designed to mirror commercial mortgage-backed securities of investment-grade quality (Baa3/BBB-/BBB- or above) using Moody’s, S&P, and Fitch, respectively, with maturities of at least one year. Bloomberg Barclays Emerging Market Bond Index is an unmanaged index that tracks total returns for external-currency-denominated debt instruments of the emerging markets. Bloomberg Barclays Euro Aggregate Bond Index is a broad-based flagship benchmark that measures the investment grade, euro-denominated, fixed rate bond market, including treasuries, government-related, corporate and securitized issues. Bloomberg Barclays Long U.S. Government Credit Index includes all publicly issued U.S. government and corporate securities that have a remaining maturity of 10 or more years, are rated investment grade, and have $250 million or more of outstanding face value. Bloomberg Barclays Municipal Bond Index is a market value-weighted index of investment-grade municipal bonds with maturities of one year or more. Bloomberg Barclays U.S. Agency Bond Index is a market value-weighted index of U.S. Agency government and investment-grade corporate fixed-rate debt issues. Bloomberg Barclays U.S. Aggregate Bond is a broad-based, market-value-weighted benchmark that measures the performance of the investment-grade, U.S. dollar-denominated, fixed-rate taxable bond market. Bloomberg Barclays U.S. Corporate High Yield Bond Index is a market value-weighted index that covers the universe of dollar-denominated, fixed-rate, non-investment grade debt. Bloomberg Barclays U.S. Credit Bond Index is a market value-weighted index of investment-grade corporate fixed-rate debt issues with maturities of one year or more.
Bloomberg Barclays U.S. Government Index is a market value-weighted index of U.S. Government fixed-rate debt issues with maturities of one year or more. Bloomberg Barclays Global Aggregate ex-USD Index Unhedged is a measure of global investment grade debt from 24 local currency markets. This multi- currency benchmark includes treasury, government-related, corporate and securitized fixed-rate bonds from both developed and emerging markets issuers. Bloomberg Barclays U.S. MBS Index is a market value-weighted index of fixed-rate securities that represent interests in pools of mortgage loans, including balloon mortgages, with original terms of 15 and 30 years that are issued by the Government National Mortgage Association (GNMA), the Federal National Mortgage Association (FNMA), and the Federal Home Loan Mortgage Corp. (FHLMC). Bloomberg Barclays U.S. Treasury Inflation-Protected Securities (TIPS) Index (Series-L) is a market value-weighted index that measures the performance of inflation-protected securities issued by the U.S. Treasury. Bloomberg Barclays U.S. Treasury Bond Index is a market value-weighted index of public obligations of the U.S. Treasury with maturities of one year or more. Bloomberg Commodity Index measures the performance of the commodities market. It consists of exchange-traded futures contracts on physical commodities that are weighted to account for the economic significance and market liquidity of each commodity. Dow Jones U.S. Select Real Estate Securities Index is a float-adjusted, market capitalization-weighted index of publicly traded real estate securities, such as real estate investment trusts (REITs) and real estate operating companies (REOCs). FTSE 100 Index is a market capitalization-weighted index of the 100 most highly capitalized blue chip companies listed on the London Stock Exchange. FTSE National Association of Real Estate Investment Trusts (NAREIT) All REITs Index is a market capitalization-weighted index that is designed to measure the performance of all tax-qualified REITs listed on the NYSE, the American Stock Exchange, or the NASDAQ National Market List. FTSE NAREIT Equity REIT Index is an unmanaged market value-weighted index based on the last closing price of the month for tax-qualified REITs listed on the New York Stock Exchange (NYSE). The IA SBBI U.S. Small Cap Stock Index is a custom index designed to measure the performance of small capitalization U.S. stocks. IA SBBI U.S. Intermediate-Term Government Bond Index is an unweighted index that measures the performance of five-year maturity U.S. Treasury bonds. Each year, a one-bond portfolio containing the shortest non-callable bond having a maturity of not less than five years is constructed. IA SBBI U.S. Long-Term Corporate Bond Index is a custom index designed to measure the performance of long-term U.S. corporate bonds. IA SBBI U.S. 30-Day Treasury Bill Index is an unweighted index that measures the performance of 30-day maturity U.S. Treasury bills. JPM® EMBI Global Index, and its country sub-indices, total returns for the U.S. dollar-denominated debt instruments issued by Emerging Market sovereign and quasi-sovereign entities, such as Brady bonds, loans, and Eurobonds. JPM® EMBI Global Investment Grade Index, and its country sub-indices, tracks total returns for traded external debt instruments issued by emerging-market sovereign and quasi-sovereign entities rated investment grade.

Market Indices (continued)
MSCI® All Country (AC) Europe Index is a market capitalization-weighted index that is designed to measure the equity market performance of Europe; it consists of the following developed and emerging-market country indices: Austria, Belgium, Czech Republic, Denmark, Finland, France, Germany, Greece, Hungary, Ireland, Italy, Netherlands, Norway, Poland, Portugal, Russia, Spain, Sweden, Switzerland, Turkey, and United Kingdom. MSCI All Country World Index (ACWI) is a market capitalization-weighted index that is designed to measure the investable equity market performance for global investors of developed and emerging markets. MSCI Europe Index is a market capitalization-weighted index that is designed to measure the investable equity market performance for global investors of the developed markets in Europe. MSCI Europe Financials Index (Total Return) captures large- and mid-cap representations of financial securities across 15 developed-market countries in Europe, represented by the MSCI Europe Index, MSCI Japan Financials Index (Total Return) captures large- and mid-cap representations of financial securities across Japan, represented by the MSCI Japan Index, an index designed to measure the performance of the large- and mid-cap segments of the Japanese equity market. With 318 constituents, the index covers approximately 85% of the free float-adjusted market capitalization in Japan. MSCI North America Index is a market capitalization-weighted index designed to measure the performance of large- and mid-cap segments of the U.S. and Canada markets. MSCI Pacific ex Japan Index is a market capitalization-weighted index that is designed to measure the equity market performance of four of the five developed market countries in the Pacific region including Australia, Hong Kong, New Zealand and Singapore. MSCI World Index is a market capitalization-weighted index that is designed to measure the investable equity market performance for global investors of developed markets. MSCI World ex USA Index is a market capitalization-weighted index designed to measure the equity market performance of developed markets excluding the U.S.
MSCI Emerging Markets (EM) Index is a market capitalization-weighted index that is designed to measure the investable equity market performance for global investors in emerging markets. MSCI EM Asia Index is a market capitalization-weighted index designed to measure equity market performance in Asia. MSCI EM Europe, Middle East, and Africa (EMEA) Index is a market capitalization-weighted index that is designed to measure the investable equity market performance for global investors in the emerging-market countries of Europe, the Middle East, and Africa. MSCI EM Latin America Index is a market capitalization-weighted index that is designed to measure the investable equity market performance for global investors in the emerging-market countries of Latin America. MSCI EM Large Cap Index is composed of those securities in the MSCI EM Index that are defined as large-capitalization stocks.
MSCI Europe, Australasia, Far East Index (EAFE) is a market capitalization-weighted index that is designed to measure the investable equity market performance for global investors in developed markets, excluding the U.S. and Canada. MSCI EAFE Small Cap Index is a market capitalization-weighted index that is designed to measure the investable equity market performance of small-cap stocks for global investors in developed markets, excluding the U.S. and Canada.
MSCI Canada Index is a market capitalization-weighted index designed to measure equity market performance in Canada. MSCI Japan Index is a market capitalization-weighted index designed to measure equity market performance in Japan. MSCI USA Index is a market capitalization-weighted index designed to measure the equity market performance of the U.S.
MSCI REIT Preferred Index is a preferred stock market capitalization-weighted total return index of certain exchange-traded perpetual preferred securities issued by U.S. Equity and U.S. Hybrid REITs.
Russell 2000® Index is a market capitalization-weighted index designed to measure the performance of the small-cap segment of the U.S. equity market. It includes approximately 2,000 of the smallest securities in the Russell 3000 Index. Russell 3000® Index is a market capitalization-weighted index designed to measure the performance of the 3,000 largest companies in the U.S. equity market. Russell 3000 Growth Index is a market capitalization-weighted index designed to measure the performance of the broad growth segment of the U.S. equity market. It includes those Russell 3000 Index companies with higher price-to-book ratios and higher forecasted growth rates. Russell 3000 Value Index is a market capitalization-weighted index designed to measure the performance of the small to mid-cap value segment of the U.S. equity market. It includes those Russell 3000 Index companies with lower price-to-book ratios and lower forecasted growth rates. Russell Midcap® Index is a market capitalization-weighted index designed to measure the performance of the mid-cap segment of the U.S. equity market. It contains approximately 800 of the smallest securities in the Russell 1000 Index.
The S&P 500® Index is a market capitalization-weighted index of 500 common stocks chosen for market size, liquidity, and industry group representation to represent U.S. equity performance. S&P 500 is a registered service mark of The McGraw-Hill Companies, Inc., and has been licensed for use by Fidelity Distributors Corporation and its affiliates. The S&P 500 Total Return Index represents the price changes and reinvested dividends of the S&P 500® Index. The S&P SmallCap 600 is a market capitalization-weighted index of 600 small-capitalization stocks. The S&P GSCI® Commodities Index provides investors with a reliable and publicly available benchmark for investment performance in the commodity markets. LIBOR is the London Interbank Offered Rate. It is the benchmark rate that some of the world’s leading banks charge each other for short-term loans. Global Policy Uncertainty Index a GDP-weighted average of national economic policy uncertainty indexes for 18 countries. It reflects the relative frequency of own-country newspaper articles that contain a trio of terms pertaining to the economy, policy, and uncertainty.
53
Appendix: Important Information

Market Indices (continued)
The Sectors and Industries defined by Global Industry Classification Standards (GICS®), except where noted otherwise. S&P 500 sectors are defined as follows: Consumer Discretionary – companies that tend to be the most sensitive to economic cycles. Consumer Staples – companies whose businesses are less sensitive to economic cycles. Energy – companies whose businesses are dominated by either of the following activities: the construction or provision of oil rigs, drilling equipment, and other energy-related services and equipment, including seismic data collection; or the exploration, production, marketing, refining, and/or transportation of oil and gas products, coal, and consumable fuels. Financials – companies involved in activities such as banking, consumer finance, investment banking and brokerage, asset management, insurance and investments, and real estate, including REITs. Health Care – companies in two main industry groups: health care equipment suppliers, manufacturers, and providers of health care services; and companies involved in research, development, production, and marketing of pharmaceuticals and biotechnology products. Industrials – companies whose businesses manufacture and distribute capital goods, provide commercial services and supplies, or provide transportation services. Information Technology – companies in technology software and services and technology hardware and equipment. Materials – companies that are engaged in a wide range of commodity-related manufacturing. Telecommunication Services – companies that provide communications services primarily through fixed-line, cellular, wireless, high bandwidth, and/or fiber-optic cable networks. Utilities – companies considered electric, gas, or water utilities, or companies that operate as independent producers and/or distributors of power.
Standard & Poor’s/Loan Syndications and Trading Association (S&P/LSTA) Leveraged Performing Loan Index is a market value-weighted index designed to represent the performance of U.S. dollar-denominated institutional leveraged performing loan portfolios (excluding loans in payment default) using current market weightings, spreads, and interest payments.
Other Indices
The Consumer Price Index (CPI) is a monthly inflation indicator that measures the change in the cost of a fixed basket of products and services, including housing, electricity, food, and transportation.
KOF Index of Globalization measures the economic, social, and political dimensions of globalization and is calculated referring to actual economic flows, economic restrictions, data on information flows, data on personal contact, and data on cultural proximity.
The London Bullion Market Association (LBMA) publishes the international benchmark price of gold in USD, twice daily. The LBMA Gold price auction takes place by ICE Benchmark Administration (IBA) at 10:30 and 15:00 with the price set in U.S. dollars per fine troy ounce.
The Philadelphia Gold and Silver Index is a market-capitalization index of precious metal mining company stocks.
A Purchasing Managers’ Index (PMI) is a survey of purchasing managers in a certain economic sector. A PMI over 50 represents expansion of the sector compared to the previous month, while a reading under 50 represents a contraction, and a reading of 50 indicates no change. The Institute for Supply Management ® reports the U.S. manufacturing PMI ®. Markit compiles non-U.S. PMIs.
S&P Global BMI Gold Capped Index is a modified market capitalization–weighted index of stocks designed to measure the performance of companies that produce gold and related products, including companies that mine or process gold and the South African finance houses that primarily invest in, but do not operate, gold mines.
Definitions
Correlation coefficient measures the interdependencies of two random variables that range in value from −1 to +1, indicating perfect negative correlation at −1, absence of correlation at 0, and perfect positive correlation at +1.
The Price-to-Earnings (P/E) ratio is the ratio of a company’s current share price to its current earnings, typically trailing 12-months earnings per share. A Forward P/E calculation will typically use an average of analysts’ published estimates of earnings for the next 12 months in the denominator.
Excess return: the amount by which a portfolio’s performance exceeds its benchmark, net (in the case of the analysis in this article) or gross of operating expenses, in percentage points.
Third-party marks are the property of their respective owners; all other marks are the property of FMR LLC.
If receiving this piece through your relationship with Fidelity Institutional Asset Management® (FIAM), this publication may be provided by Fidelity Investments Institutional Services Company, Inc., Fidelity Institutional Asset Management Trust Company, or FIAM LLC, depending on your relationship.
If receiving this piece through your relationship with Fidelity Personal & Workplace Investing (PWI) or Fidelity Family Office Services (FFOS) this publication is provided through Fidelity Brokerage Services LLC, Member NYSE, SIPC.
If receiving this piece through your relationship with Fidelity Clearing and Custody Solutions or Fidelity Capital Markets, this publication is for institutional investor or investment professional use only. Clearing, custody or other brokerage services are provided through National Financial Services LLC or Fidelity Brokerage Services LLC, Member NYSE, SIPC.
794080.1.0
© 2017 FMR LLC. All rights reserved.
54
Appendix: Important Information