quarterly performance reports: 2014/15 - 4th …
TRANSCRIPT
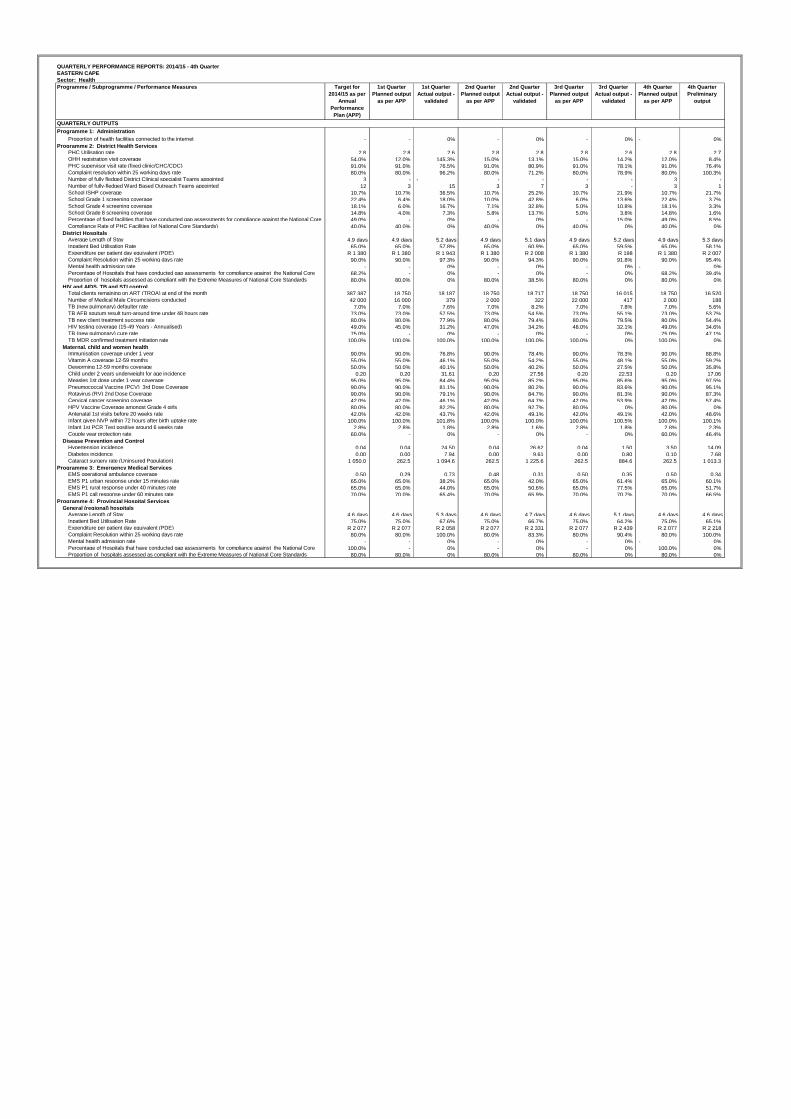
QUARTERLY PERFORMANCE REPORTS: 2014/15 - 4th Quarter
EASTERN CAPE
Sector: Health
Programme / Subprogramme / Performance Measures Target for
2014/15 as per
Annual
Performance
Plan (APP)
1st Quarter
Planned output
as per APP
1st Quarter
Actual output -
validated
2nd Quarter
Planned output
as per APP
2nd Quarter
Actual output -
validated
3rd Quarter
Planned output
as per APP
3rd Quarter
Actual output -
validated
4th Quarter
Planned output
as per APP
4th Quarter
Preliminary
output
QUARTERLY OUTPUTS
Programme 1: Administration
Proportion of health facilities connected to the internet - - 0% - 0% - 0% - 0%
Programme 2: District Health Services
PHC Utilisation rate 2.8 2.8 2.6 2.8 2.8 2.8 2.6 2.8 2.7
OHH registration visit coverage 54.0% 12.0% 145.3% 15.0% 13.1% 15.0% 14.2% 12.0% 8.4%
PHC supervisor visit rate (fixed clinic/CHC/CDC) 91.0% 91.0% 76.5% 91.0% 80.9% 91.0% 78.1% 91.0% 76.4%
Complaint resolution within 25 working days rate 80.0% 80.0% 96.2% 80.0% 71.2% 80.0% 78.9% 80.0% 100.3%
Number of fully fledged District Clinical specialist Teams appointed 3 - - - - - - 3 -
Number of fully-fledged Ward Based Outreach Teams appointed 12 3 15 3 7 3 - 3 1
School ISHP coverage 10.7% 10.7% 36.5% 10.7% 25.2% 10.7% 21.9% 10.7% 21.7%
School Grade 1 screening coverage 22.4% 6.4% 18.0% 10.0% 42.8% 6.0% 13.6% 22.4% 3.7%
School Grade 4 screening coverage 18.1% 6.0% 16.7% 7.1% 32.8% 5.0% 10.8% 18.1% 3.3%
School Grade 8 screening coverage 14.8% 4.0% 7.3% 5.8% 13.7% 5.0% 3.8% 14.8% 1.6%
Percentage of fixed facilities that have conducted gap assessments for compliance against the National Core 49.0% - 0% - 0% - 15.0% 49.0% 8.5%
Compliance Rate of PHC Facilities (of National Core Standards) 40.0% 40.0% 0% 40.0% 0% 40.0% 0% 40.0% 0%
District Hospitals
Average Length of Stay 4.9 days 4.9 days 5.2 days 4.9 days 5.1 days 4.9 days 5.2 days 4.9 days 5.3 days
Inpatient Bed Utilisation Rate 65.0% 65.0% 57.8% 65.0% 60.9% 65.0% 59.5% 65.0% 58.1%
Expenditure per patient day equivalent (PDE) R 1 380 R 1 380 R 1 943 R 1 380 R 2 008 R 1 380 R 198 R 1 380 R 2 007
Complaint Resolution within 25 working days rate 90.0% 90.0% 97.3% 90.0% 94.3% 90.0% 91.8% 90.0% 95.4%
Mental health admission rate - - 0% - 0% - 0% - 0%
Percentage of Hospitals that have conducted gap assessments for compliance against the National Core 68.2% - 0% - 0% - 0% 68.2% 39.4%
Proportion of hospitals assessed as compliant with the Extreme Measures of National Core Standards 80.0% 80.0% 0% 80.0% 38.5% 80.0% 0% 80.0% 0%
HIV and AIDS, TB and STI control
Total clients remaining on ART (TROA) at end of the month 387 387 18 750 18 187 18 750 18 717 18 750 16 015 18 750 16 520
Number of Medical Male Circumcisions conducted 42 000 16 000 379 2 000 322 22 000 417 2 000 188
TB (new pulmonary) defaulter rate 7.0% 7.0% 7.6% 7.0% 8.2% 7.0% 7.8% 7.0% 5.6%
TB AFB sputum result turn-around time under 48 hours rate 73.0% 73.0% 57.5% 73.0% 54.5% 73.0% 55.1% 73.0% 53.7%
TB new client treatment success rate 80.0% 80.0% 77.9% 80.0% 79.4% 80.0% 79.5% 80.0% 54.4%
HIV testing coverage (15-49 Years - Annualised) 49.0% 45.0% 31.2% 47.0% 34.2% 48.0% 32.1% 49.0% 34.6%
TB (new pulmonary) cure rate 75.0% - 0% - 0% - 0% 75.0% 47.1%
TB MDR confirmed treatment initiation rate 100.0% 100.0% 100.0% 100.0% 100.0% 100.0% 0% 100.0% 0%
Maternal, child and women health
Immunisation coverage under 1 year 90.0% 90.0% 76.8% 90.0% 78.4% 90.0% 78.3% 90.0% 88.8%
Vitamin A coverage 12-59 months 55.0% 55.0% 46.1% 55.0% 54.2% 55.0% 48.1% 55.0% 59.2%
Deworming 12-59 months coverage 50.0% 50.0% 40.1% 50.0% 40.2% 50.0% 27.5% 50.0% 35.8%
Child under 2 years underweight for age incidence 0.20 0.20 31.61 0.20 27.56 0.20 22.53 0.20 17.06
Measles 1st dose under 1 year coverage 95.0% 95.0% 84.4% 95.0% 85.2% 95.0% 85.6% 95.0% 97.5%
Pneumococcal Vaccine (PCV) 3rd Dose Coverage 90.0% 90.0% 81.1% 90.0% 80.2% 90.0% 83.6% 90.0% 95.1%
Rotavirus (RV) 2nd Dose Coverage 90.0% 90.0% 79.1% 90.0% 84.7% 90.0% 81.3% 90.0% 87.3%
Cervical cancer screening coverage 42.0% 42.0% 46.1% 42.0% 64.7% 42.0% 53.9% 42.0% 57.4%
HPV Vaccine Coverage amongst Grade 4 girls 80.0% 80.0% 82.2% 80.0% 92.7% 80.0% 0% 80.0% 0%
Antenatal 1st visits before 20 weeks rate 42.0% 42.0% 43.7% 42.0% 49.1% 42.0% 49.1% 42.0% 48.6%
Infant given NVP within 72 hours after birth uptake rate 100.0% 100.0% 101.8% 100.0% 100.0% 100.0% 100.5% 100.0% 100.1%
Infant 1st PCR Test positive around 6 weeks rate 2.8% 2.8% 1.8% 2.8% 1.6% 2.8% 1.8% 2.8% 2.3%
Couple year protection rate 60.0% - 0% - 0% - 0% 60.0% 46.4%
Disease Prevention and Control
Hypertension incidence 0.04 0.04 24.50 0.04 26.62 0.04 1.50 3.50 14.09
Diabetes incidence 0.00 0.00 7.94 0.00 9.61 0.00 0.80 0.10 7.68
Cataract surgery rate (Uninsured Population) 1 050.0 262.5 1 094.6 262.5 1 225.6 262.5 884.6 262.5 1 013.3
Programme 3: Emergency Medical Services
EMS operational ambulance coverage 0.50 0.29 0.73 0.48 0.31 0.50 0.35 0.50 0.34
EMS P1 urban response under 15 minutes rate 65.0% 65.0% 38.2% 65.0% 42.0% 65.0% 61.4% 65.0% 60.1%
EMS P1 rural response under 40 minutes rate 65.0% 65.0% 44.0% 65.0% 50.6% 65.0% 77.5% 65.0% 51.7%
EMS P1 call response under 60 minutes rate 70.0% 70.0% 65.4% 70.0% 65.9% 70.0% 70.7% 70.0% 66.5%
Programme 4: Provincial Hospital Services
General (regional) hospitals
Average Length of Stay 4.6 days 4.6 days 5.3 days 4.6 days 4.7 days 4.6 days 5.1 days 4.6 days 4.6 days
Inpatient Bed Utilisation Rate 75.0% 75.0% 67.6% 75.0% 66.7% 75.0% 64.2% 75.0% 65.1%
Expenditure per patient day equivalent (PDE) R 2 077 R 2 077 R 2 058 R 2 077 R 2 331 R 2 077 R 2 439 R 2 077 R 2 218
Complaint Resolution within 25 working days rate 80.0% 80.0% 100.0% 80.0% 83.3% 80.0% 90.4% 80.0% 100.0%
Mental health admission rate - - 0% - 0% - 0% - 0%
Percentage of Hospitals that have conducted gap assessments for compliance against the National Core 100.0% - 0% - 0% - 0% 100.0% 0%
Proportion of hospitals assessed as compliant with the Extreme Measures of National Core Standards 80.0% 80.0% 0% 80.0% 0% 80.0% 0% 80.0% 0%

QUARTERLY PERFORMANCE REPORTS: 2014/15 - 4th Quarter
EASTERN CAPE
Sector: Health
Programme / Subprogramme / Performance Measures Target for
2014/15 as per
Annual
Performance
Plan (APP)
1st Quarter
Planned output
as per APP
1st Quarter
Actual output -
validated
2nd Quarter
Planned output
as per APP
2nd Quarter
Actual output -
validated
3rd Quarter
Planned output
as per APP
3rd Quarter
Actual output -
validated
4th Quarter
Planned output
as per APP
4th Quarter
Preliminary
output
QUARTERLY OUTPUTS
Programme 5: Central Hospital Services
Tertiary Hospitals
Average Length of Stay 5.5 days 5.5 days 6.1 days 5.5 days 6.1 days 5.5 days 6.0 days 5.5 days 6.1 days
Inpatient Bed Utilisation Rate 75.0% 75.0% 74.1% 75.0% 76.4% 75.0% 74.2% 75.0% 72.3%
Expenditure per patient day equivalent (PDE) R 1 923 R 1 900 R 2 644 R 1 900 R 3 231 R 1 900 R 3 361 R 1 923 R 3 412
Complaint Resolution within 25 working days rate 80.0% 80.0% 100.0% 80.0% 84.8% 80.0% 83.9% 80.0% 100.0%
Mental health admission rate - - 0% - 0% - 0% 100.0% 0%
Percentage of Hospitals that have conducted gap assessments for compliance against the National Core 100.0% - 0% - 0% 100.0% 0% 100.0% 0%
Proportion of hospitals assessed as compliant with the Extreme Measures of National Core Standards 80.0% 100.0% 0% 100.0% 0% 100.0% 0% 100.0% 0%
Central Hospitals
Average Length of Stay 5.5 days 5.5 days 7.2 days 5.5 days 6.8 days 5.5 days 6.4 days 5.5 days 6.5 days
Inpatient Bed Utilisation Rate 75.0% 75.0% 91.9% 75.0% 95.0% 75.0% 87.4% 75.0% 83.5%
Expenditure per patient day equivalent (PDE) R 1 950 R 1 900 R 0 R 1 900 R 0 R 1 900 R 0 R 1 950 R 0
Complaint Resolution within 25 working days rate 80.0% 80.0% 100.0% 80.0% 97.3% 80.0% 100.0% 80.0% 100.0%
Mental health admission rate - - 0% - 0% - 0% - 0%
Percentage of Hospitals that have conducted gap assessments for compliance against the National Core 100.0% - 0% - 0% 100.0% 0% - 0%
Proportion of hospitals assessed as compliant with the Extreme Measures of National Core Standards 80.0% 80.0% 0% 80.0% 0% 80.0% 0% 80.0% 0%
Programme 8: Health Facilities Management
Proportion of Programme 8 budget spent on maintenance (preventative and scheduled) 29.0% 7.3% 14.9% 7.3% 23.6% 7.3% 23.6% 7.3% 11.1%
Number of districts spending more than 90% of maintenance budget 8 8 8 8 8 8 8 8 8
1. Information submitted by: Ms. T. Mbengashe Head Official: Health Eastern Cape Tel No (040) 608 1111 Ms. M.T.N. Mbina-Mthembu Head Official: Provincial Treasury Eastern Cape

QUARTERLY PERFORMANCE REPORTS: 2014/15 - 4th Quarter
FREE STATE
Sector: Health
Programme / Subprogramme / Performance Measures Target for
2014/15 as per
Annual
Performance
Plan (APP)
1st Quarter
Planned output
as per APP
1st Quarter
Actual output -
validated
2nd Quarter
Planned output
as per APP
2nd Quarter
Actual output -
validated
3rd Quarter
Planned output
as per APP
3rd Quarter
Actual output -
validated
4th Quarter
Planned output
as per APP
4th Quarter
Preliminary
output
QUARTERLY OUTPUTS
Programme 1: Administration
Proportion of health facilities connected to the internet 50.0% 0% 0% 0% 0% 0% 0% 0% 36.3%
Programme 2: District Health Services
PHC Utilisation rate 3.0 3.0 2.4 3.0 2.6 3.0 2.4 3.0 2.4
OHH registration visit coverage 10.9% 10.9% 2.6% 10.9% 3.0% 10.9% 2.1% 10.9% 1.3%
PHC supervisor visit rate (fixed clinic/CHC/CDC) 85.0% 85.0% 58.5% 85.0% 51.8% 85.0% 71.7% 85.0% 64.1%
Complaint resolution within 25 working days rate 75.0% 75.0% 92.2% 75.0% 89.3% 75.0% 96.4% 75.0% 95.6%
Number of fully fledged District Clinical specialist Teams appointed 5 - 5 - - - - - -
Number of fully-fledged Ward Based Outreach Teams appointed 60 - - - - - - 60 46
School ISHP coverage 50.0% 50.0% 70.6% 50.0% 51.7% 50.0% 24.8% 50.0% 20.9%
School Grade 1 screening coverage 35.5% 35.5% 65.9% 35.5% 39.4% 35.5% 29.3% 35.5% 7.0%
School Grade 4 screening coverage 47.3% 47.3% 76.0% 47.3% 45.1% 47.3% 41.2% 47.3% 10.8%
School Grade 8 screening coverage 29.5% 29.5% 15.3% 29.5% 45.1% 29.5% 18.6% 29.5% 13.3%
Percentage of fixed facilities that have conducted gap assessments for compliance against the National Core 100.0% 26.6% 22.4% 26.1% 58.6% 23.4% 19.0% 23.9% 0%
Compliance Rate of PHC Facilities (of National Core Standards) 7.5% 0% 0% 0% 0% 0% 0.0% 7.5% 0%
District Hospitals
Average Length of Stay 4.0 days 4.0 days 3.4 days 4.0 days 3.2 days 4.0 days 3.3 days 4.0 days 3.3 days
Inpatient Bed Utilisation Rate 70.0% 70.0% 61.5% 70.0% 61.3% 70.0% 61.4% 70.0% 51.6%
Expenditure per patient day equivalent (PDE) R 2 000 R 2 000 R 2 285 R 2 000 R 2 025 R 2 000 R 1 924 R 2 000 R 2 214
Complaint Resolution within 25 working days rate 75.0% 75.0% 92.8% 75.0% 93.9% 75.0% 79.3% 75.0% 96.4%
Mental health admission rate 1.0% 1.0% 0.6% 1.0% 0.7% 1.0% 0.7% 1.0% 0.5%
Percentage of Hospitals that have conducted gap assessments for compliance against the National Core 100.0% 25.0% 0% 25.0% 12.5% 16.7% 12.5% 33.3% 0%
Proportion of hospitals assessed as compliant with the Extreme Measures of National Core Standards 20.0% 0% 0% 0% 0% 0% 0% 20.0% 0%
HIV and AIDS, TB and STI control
Total clients remaining on ART (TROA) at end of the month 166 450 142 863 145 703 150 726 158 948 158 588 160 978 166 450 159 327
Number of Medical Male Circumcisions conducted 67 268 16 000 7 289 19 268 7 662 16 000 7 880 16 000 2 511
TB (new pulmonary) defaulter rate <5% <5% 4.1% <5% 4.1% <5% 4.4% <5% 4.4%
TB AFB sputum result turn-around time under 48 hours rate 82.0% 82.0% 79.6% 82.0% 81.1% 82.0% 79.5% 82.0% 82.2%
TB new client treatment success rate 82.0% 82.0% 82.2% 82.0% 83.3% 82.0% 82.6% 82.0% 74.3%
HIV testing coverage (15-49 Years - Annualised) 60.0% 60.0% 22.3% 60.0% 19.4% 60.0% 27.2% 60.0% 26.0%
TB (new pulmonary) cure rate 75.0% 75.0% 75.2% 75.0% 77.1% 75.0% 76.3% 75.0% 66.3%
TB MDR confirmed treatment initiation rate 90.0% 90.0% 100.0% 90.0% 100.0% 90.0% 81.8% 90.0% 100.0%
Maternal, child and women health
Immunisation coverage under 1 year 90.0% 90.0% 91.2% 90.0% 85.1% 90.0% 87.4% 90.0% 86.3%
Vitamin A coverage 12-59 months 60.0% 60.0% 57.5% 60.0% 60.5% 60.0% 56.8% 60.0% 57.9%
Deworming 12-59 months coverage 60.0% 60.0% 51.9% 60.0% 58.8% 60.0% 52.3% 60.0% 52.8%
Child under 2 years underweight for age incidence 25.00 25.00 23.76 25.00 23.84 25.00 25.29 25.00 25.31
Measles 1st dose under 1 year coverage 90.0% 90.0% 93.0% 90.0% 89.1% 90.0% 88.8% 90.0% 91.5%
Pneumococcal Vaccine (PCV) 3rd Dose Coverage 90.0% 90.0% 91.5% 90.0% 86.4% 90.0% 88.7% 90.0% 89.2%
Rotavirus (RV) 2nd Dose Coverage 95.0% 95.0% 96.7% 95.0% 100.5% 95.0% 97.3% 95.0% 85.2%
Cervical cancer screening coverage 56.0% 56.0% 36.5% 56.0% 40.2% 56.0% 40.2% 56.0% 45.5%
HPV Vaccine Coverage amongst Grade 4 girls 80.0% 80.0% 81.6% 0% 0% 80.0% 88.4% 0% 0%
Antenatal 1st visits before 20 weeks rate 70.0% 70.0% 56.3% 70.0% 59.7% 70.0% 58.0% 70.0% 57.9%
Infant given NVP within 72 hours after birth uptake rate 100.0% 100.0% 97.9% 100.0% 99.1% 100.0% 97.4% 100.0% 96.4%
Infant 1st PCR Test positive around 6 weeks rate <2% <2% 1.2% <2% 0.9% <2% 1.5% <2% 1.9%
Couple year protection rate 40.0% 40.0% 39.9% 40.0% 40.0% 40.0% 50.1% 40.0% 38.1%
Disease Prevention and Control
Hypertension incidence 15.7/1000 15.7/1000 13.67 15.70 15.01 15.70 11.53 15.70 10.18
Diabetes incidence 1.00 1.00 4.03 1.00 4.12 1.00 3.49 1.00 3.92
Cataract surgery rate (Uninsured Population) 1 491/1 000 000 1 491/1 000 000 686.5 1 491/1 000 000 832.0 1 491/1 000 000 1 562.9 1 491/1 000 000 761.0
Programme 3: Emergency Medical Services
EMS operational ambulance coverage 0.58/10 000 0.58/10 000 0.55 0.58/10 000 - 0.58/10 000 0.64 0.58/10 000 0.64
EMS P1 urban response under 15 minutes rate 53.2% 53.2% 28.6% 53.2% 33.8% 53.2% 30.8% 53.2% 32.4%
EMS P1 rural response under 40 minutes rate 67.5% 67.5% 72.0% 67.5% 86.3% 67.5% 80.4% 67.5% 71.9%
EMS P1 call response under 60 minutes rate 82.9% 82.9% 29.0% 82.9% 26.6% 82.9% 60.7% 82.9% 37.5%
Programme 4: Provincial Hospital Services
General (regional) hospitals
Average Length of Stay 5.5 days 5.5 days 5.1 days 5.5 days 5.1 days 5.5 days 5.1 days 5.5 days 5.4 days
Inpatient Bed Utilisation Rate 70.0% 70.0% 63.3% 70.0% 68.8% 70.0% 63.4% 70.0% 62.0%
Expenditure per patient day equivalent (PDE) R 2 600 R 2 600 R 2 657 R 2 600 R 2 453 R 2 600 R 2 563 R 2 600 R 2 337
Complaint Resolution within 25 working days rate 75.0% 75.0% 52.0% 75.0% 51.1% 75.0% 94.2% 75.0% 99.3%
Mental health admission rate 1.0% 1.0% 0.9% 1.0% 0.9% 1.0% 1.0% 1.0% 1.0%
Percentage of Hospitals that have conducted gap assessments for compliance against the National Core 100.0% 25.0% 25.0% 25.0% 0% 25.0% 25.0% 25.0% 0%
Proportion of hospitals assessed as compliant with the Extreme Measures of National Core Standards 50.0% 0% 0% 0% 0% 0% 0% 50.0% 0%
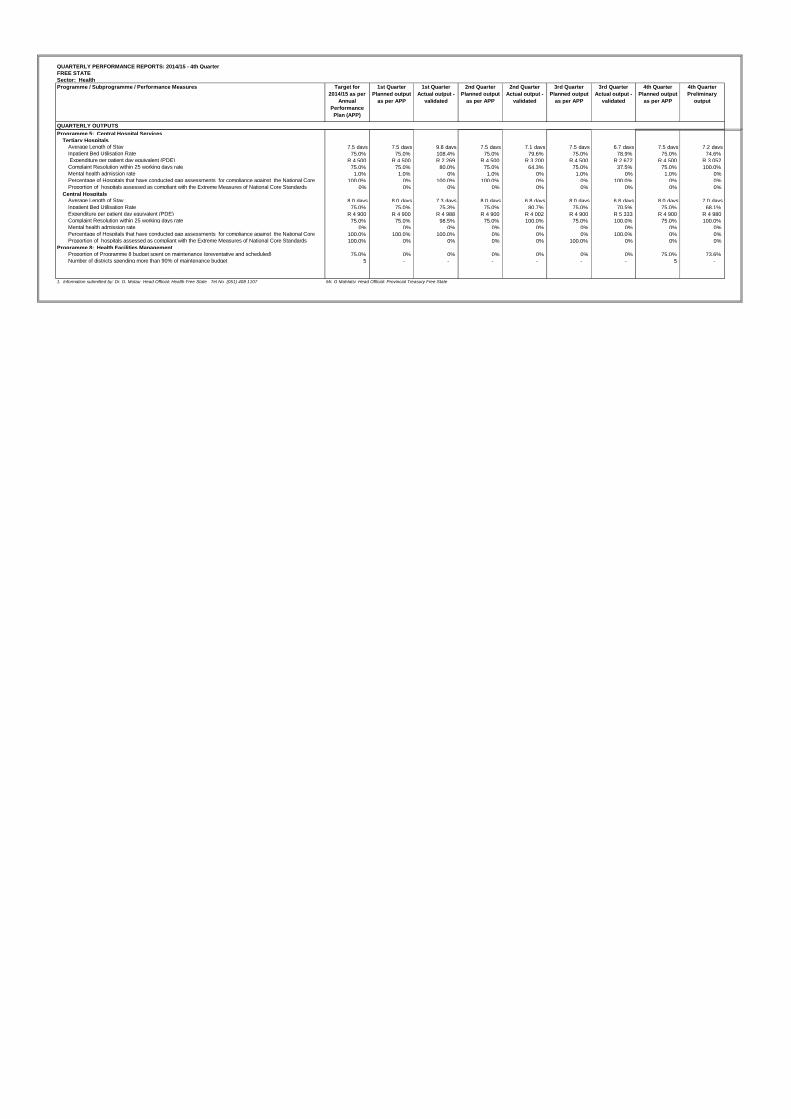
QUARTERLY PERFORMANCE REPORTS: 2014/15 - 4th Quarter
FREE STATE
Sector: Health
Programme / Subprogramme / Performance Measures Target for
2014/15 as per
Annual
Performance
Plan (APP)
1st Quarter
Planned output
as per APP
1st Quarter
Actual output -
validated
2nd Quarter
Planned output
as per APP
2nd Quarter
Actual output -
validated
3rd Quarter
Planned output
as per APP
3rd Quarter
Actual output -
validated
4th Quarter
Planned output
as per APP
4th Quarter
Preliminary
output
QUARTERLY OUTPUTS
Programme 5: Central Hospital Services
Tertiary Hospitals
Average Length of Stay 7.5 days 7.5 days 9.8 days 7.5 days 7.1 days 7.5 days 6.7 days 7.5 days 7.2 days
Inpatient Bed Utilisation Rate 75.0% 75.0% 108.4% 75.0% 79.6% 75.0% 78.9% 75.0% 74.6%
Expenditure per patient day equivalent (PDE) R 4 500 R 4 500 R 2 269 R 4 500 R 3 200 R 4 500 R 2 672 R 4 500 R 3 052
Complaint Resolution within 25 working days rate 75.0% 75.0% 80.0% 75.0% 64.3% 75.0% 37.5% 75.0% 100.0%
Mental health admission rate 1.0% 1.0% 0% 1.0% 0% 1.0% 0% 1.0% 0%
Percentage of Hospitals that have conducted gap assessments for compliance against the National Core 100.0% 0% 100.0% 100.0% 0% 0% 100.0% 0% 0%
Proportion of hospitals assessed as compliant with the Extreme Measures of National Core Standards 0% 0% 0% 0% 0% 0% 0% 0% 0%
Central Hospitals
Average Length of Stay 8.0 days 8.0 days 7.3 days 8.0 days 6.8 days 8.0 days 6.8 days 8.0 days 7.0 days
Inpatient Bed Utilisation Rate 75.0% 75.0% 75.3% 75.0% 80.7% 75.0% 70.5% 75.0% 68.1%
Expenditure per patient day equivalent (PDE) R 4 900 R 4 900 R 4 988 R 4 900 R 4 002 R 4 900 R 5 333 R 4 900 R 4 980
Complaint Resolution within 25 working days rate 75.0% 75.0% 98.5% 75.0% 100.0% 75.0% 100.0% 75.0% 100.0%
Mental health admission rate 0% 0% 0% 0% 0% 0% 0% 0% 0%
Percentage of Hospitals that have conducted gap assessments for compliance against the National Core 100.0% 100.0% 100.0% 0% 0% 0% 100.0% 0% 0%
Proportion of hospitals assessed as compliant with the Extreme Measures of National Core Standards 100.0% 0% 0% 0% 0% 100.0% 0% 0% 0%
Programme 8: Health Facilities Management
Proportion of Programme 8 budget spent on maintenance (preventative and scheduled) 75.0% 0% 0% 0% 0% 0% 0% 75.0% 73.6%
Number of districts spending more than 90% of maintenance budget 5 - - - - - - 5 -
1. Information submitted by: Dr. D. Motau Head Official: Health Free State Tel No (051) 408 1107 Mr. G Mahlatsi Head Official: Provincial Treasury Free State

QUARTERLY PERFORMANCE REPORTS: 2014/15 - 4th Quarter
GAUTENG
Sector: Health
Programme / Subprogramme / Performance Measures Target for
2014/15 as per
Annual
Performance
Plan (APP)
1st Quarter
Planned output
as per APP
1st Quarter
Actual output -
validated
2nd Quarter
Planned output
as per APP
2nd Quarter
Actual output -
validated
3rd Quarter
Planned output
as per APP
3rd Quarter
Actual output -
validated
4th Quarter
Planned output
as per APP
4th Quarter
Preliminary
output
QUARTERLY OUTPUTS
Programme 1: Administration
Proportion of health facilities connected to the internet 44.0% 39.0% 44.1% 41.0% 44.1% 42.5% 44.1% 44.0% 44.1%
Programme 2: District Health Services
PHC Utilisation rate 2.3 2.3 1.8 2.3 1.9 2.3 1.8 2.3 1.8
OHH registration visit coverage 5.0% 4.8% 107.0% 4.8% 209.3% 5.0% 59.3% 5.0% 7.7%
PHC supervisor visit rate (fixed clinic/CHC/CDC) 100.0% 100.0% 83.5% 100.0% 84.8% 100.0% 83.3% 100.0% 83.2%
Complaint resolution within 25 working days rate 75.0% 75.0% 93.4% 75.0% 96.5% 75.0% 93.4% 75.0% 94.6%
Number of fully fledged District Clinical specialist Teams appointed 5 5 5 5 5 5 5 5 5
Number of fully-fledged Ward Based Outreach Teams appointed 140 128 144 134 195 138 192 140 199
School ISHP coverage 50.0% 50.0% 43.1% 50.0% 45.5% 50.0% 23.7% 50.0% 14.6%
School Grade 1 screening coverage 40.0% 10.0% 53.3% 12.0% 50.0% 40.0% 24.9% 40.0% 8.6%
School Grade 4 screening coverage 20.0% 20.0% 52.0% 20.0% 49.4% 20.0% 13.5% 20.0% 9.1%
School Grade 8 screening coverage 20.0% 20.0% 13.7% 20.0% 25.4% 20.0% 2.2% 20.0% 10.1%
Percentage of fixed facilities that have conducted gap assessments for compliance against the National Core 50.0% 50.0% 27.4% 50.0% 20.8% 50.0% 14.8% 50.0% 25.3%
Compliance Rate of PHC Facilities (of National Core Standards) 5.0% 5.0% 0% 5.0% 1.2% 5.0% 1.4% 5.0% 1.0%
District Hospitals
Average Length of Stay 3.5 days 3.5 days 4.5 days 3.5 days 4.5 days 3.5 days 4.2 days 3.5 days 4.1 days
Inpatient Bed Utilisation Rate 75.0% 68.0% 60.9% 70.0% 62.4% 75.0% 58.2% 75.0% 58.5%
Expenditure per patient day equivalent (PDE) R 1 600 R 1 600 R 2 479 R 1 600 R 2 310 R 1 600 R 2 390 R 1 600 R 2 295
Complaint Resolution within 25 working days rate 75.0% 75.0% 98.5% 75.0% 97.3% 75.0% 99.5% 75.0% 93.2%
Mental health admission rate 1.0% 1.0% 0.3% 1.0% 0.4% 1.0% 0.6% 1.0% 0.4%
Percentage of Hospitals that have conducted gap assessments for compliance against the National Core 100.0% 0% 27.3% 0% 18.2% 0% 18.2% 0% 100.0%
Proportion of hospitals assessed as compliant with the Extreme Measures of National Core Standards 3.0% 0% 0% 0% 0% 0% 0% 3.0% 27.3%
HIV and AIDS, TB and STI control
Total clients remaining on ART (TROA) at end of the month 650 000 612 500 640 300 625 000 659 065 637 500 660 191 650 000 693 223
Number of Medical Male Circumcisions conducted 208 261 100 000 48 251 150 304 59 222 184 544 12 991 208 261 7 171
TB (new pulmonary) defaulter rate 5.0% 5.0% 4.6% 5.0% 4.6% <5% 5.4% <5% 5.4%
TB AFB sputum result turn-around time under 48 hours rate 80.0% 80.0% 65.5% 80.0% 65.1% 80.0% 71.0% 80.0% 71.0%
TB new client treatment success rate 85.0% 85.0% 85.9% 85.0% 85.9% 85.0% 86.0% 85.0% 86.0%
HIV testing coverage (15-49 Years - Annualised) 39.0% 39.0% 14.2% 39.0% 16.6% 39.0% 15.7% 39.0% 19.1%
TB (new pulmonary) cure rate 84.0% 84.0% 85.1% 84.0% 85.1% 84.0% 82.5% 84.0% 82.5%
TB MDR confirmed treatment initiation rate 65.0% 45.0% 50.2% 45.0% 50.2% 55.0% 60.5% 65.0% 60.5%
Maternal, child and women health
Immunisation coverage under 1 year 90.0% 90.0% 104.6% 90.0% 105.9% 90.0% 107.5% 90.0% 107.0%
Vitamin A coverage 12-59 months 55.0% 55.0% 58.7% 55.0% 56.7% 55.0% 57.1% 55.0% 52.5%
Deworming 12-59 months coverage 55.0% 55.0% 46.7% 55.0% 41.0% 55.0% 31.9% 55.0% 27.2%
Child under 2 years underweight for age incidence <2% 0.02 9.11 0.02 9.63 <2% 9.16 <2% 11.73
Measles 1st dose under 1 year coverage 90.0% 90.0% 106.3% 90.0% 109.6% 90.0% 111.4% 90.0% 108.4%
Pneumococcal Vaccine (PCV) 3rd Dose Coverage 90.0% 90.0% 103.0% 90.0% 106.7% 90.0% 108.7% 90.0% 107.4%
Rotavirus (RV) 2nd Dose Coverage 90.0% 90.0% 107.2% 90.0% 113.8% 90.0% 110.0% 90.0% 100.2%
Cervical cancer screening coverage 68.0% 68.0% 43.4% 68.0% 45.6% 68.0% 40.0% 68.0% 44.0%
HPV Vaccine Coverage amongst Grade 4 girls 80.0% 80.0% 0% 80.0% 0% 80.0% 87.2% 80.0% 0%
Antenatal 1st visits before 20 weeks rate 45.0% 45.0% 46.5% 45.0% 49.2% 45.0% 49.0% 45.0% 48.3%
Infant given NVP within 72 hours after birth uptake rate 95.0% 95.0% 98.0% 95.0% 91.6% 95.0% 95.9% 95.0% 90.7%
Infant 1st PCR Test positive around 6 weeks rate <2% 2.0% 1.4% 2.0% 1.2% <2% 1.3% <2% 1.3%
Couple year protection rate 50.0% 50.0% 25.3% 50.0% 29.2% 50.0% 32.6% 50.0% 33.7%
Disease Prevention and Control
Hypertension incidence 0.30 0.00 14.86 0.00 15.18 0.03 13.00 0.30 11.34
Diabetes incidence 0.30 0.00 2.23 0.00 3.43 0.30 2.60 0.30 3.94
Cataract surgery rate (Uninsured Population) 1300/mil 1300/mil 1 033.5 1300/mil 1 145.7 1300/mil 1 262.3 1300/mil 991.0
Programme 3: Emergency Medical Services
EMS operational ambulance coverage 0.06 0.06 0.59 0.06 0.53 0.06 0.52 0.06 0.25
EMS P1 urban response under 15 minutes rate 65.0% 65.0% 78.9% 65.0% 80.7% 65.0% 78.1% 65.0% 79.0%
EMS P1 rural response under 40 minutes rate 100.0% 100.0% 76.2% 100.0% 76.9% 100.0% 83.1% 100.0% 88.2%
EMS P1 call response under 60 minutes rate 85.0% 85.0% 96.4% 85.0% 97.1% 85.0% 95.6% 85.0% 98.0%
Programme 4: Provincial Hospital Services
General (regional) hospitals
Average Length of Stay 4.7 days 4.7 days 4.9 days 4.7 days 5.1 days 4.7 days 5.2 days 4.7 days 4.7 days
Inpatient Bed Utilisation Rate 78.0% 78.0% 86.0% 78.0% 78.6% 78.0% 82.7% 78.0% 74.5%
Expenditure per patient day equivalent (PDE) R 2 250 R 2 250 R 2 270 R 2 250 R 2 295 R 2 250 R 2 214 R 2 250 R 2 535
Complaint Resolution within 25 working days rate 95.0% 95.0% 100.0% 95.0% 99.4% 95.0% 100.0% 95.0% 99.6%
Mental health admission rate 2.0% 2.0% 0.2% 2.0% 0.2% 2.0% 0.2% 2.0% 0.3%
Percentage of Hospitals that have conducted gap assessments for compliance against the National Core 100.0% 0% 33.3% 0% 22.2% 0% 33.3% 100.0% 100.0%
Proportion of hospitals assessed as compliant with the Extreme Measures of National Core Standards 15.0% 0% 0% 0% 0% 7.0% 0% 15.0% 100.0%

QUARTERLY PERFORMANCE REPORTS: 2014/15 - 4th Quarter
GAUTENG
Sector: Health
Programme / Subprogramme / Performance Measures Target for
2014/15 as per
Annual
Performance
Plan (APP)
1st Quarter
Planned output
as per APP
1st Quarter
Actual output -
validated
2nd Quarter
Planned output
as per APP
2nd Quarter
Actual output -
validated
3rd Quarter
Planned output
as per APP
3rd Quarter
Actual output -
validated
4th Quarter
Planned output
as per APP
4th Quarter
Preliminary
output
QUARTERLY OUTPUTS
Programme 5: Central Hospital Services
Tertiary Hospitals
Average Length of Stay 5.5 days 5.5 days 6.0 days 5.5 days 5.9 days 5.5 days 5.6 days 5.5 days 6.1 days
Inpatient Bed Utilisation Rate 78.0% 78.0% 83.2% 78.0% 85.0% 78.0% 80.4% 78.0% 101.8%
Expenditure per patient day equivalent (PDE) R 3 800 R 3 800 R 2 560 R 3 800 R 2 363 R 3 800 R 2 391 R 3 800 R 2 983
Complaint Resolution within 25 working days rate 80.0% 80.0% 76.6% 80.0% 100.0% 80.0% 105.9% 80.0% 96.6%
Mental health admission rate 1.0% 1.0% 0.6% 1.0% 0.6% 1.0% 0.5% 1.0% 0.7%
Percentage of Hospitals that have conducted gap assessments for compliance against the National Core 100.0% 0% 33.3% 0% 66.7% 0% 33.3% 100.0% 100.0%
Proportion of hospitals assessed as compliant with the Extreme Measures of National Core Standards 0% 0% 0% 0% 0% 0% 0% 0% 0%
Central Hospitals
Average Length of Stay 6.3 days 6.2 days 7.9 days 6.2 days 8.1 days 6.3 days 7.8 days 6.3 days 8.0 days
Inpatient Bed Utilisation Rate 78.0% 78.0% 80.2% 78.0% 81.5% 78.0% 78.3% 78.0% 76.1%
Expenditure per patient day equivalent (PDE) R 3 800 R 3 800 R 3 971 R 3 800 R 3 439 R 3 800 R 3 462 R 3 800 R 3 507
Complaint Resolution within 25 working days rate 75.0% 0% 93.1% 0% 96.9% 0% 93.4% 75.0% 97.3%
Mental health admission rate 2.0% 2.0% 0% 2.0% 0% 2.0% 0% 2.0% 0%
Percentage of Hospitals that have conducted gap assessments for compliance against the National Core 100.0% 0% 25.0% 0% 50.0% 80.0% 25.0% 100.0% 100.0%
Proportion of hospitals assessed as compliant with the Extreme Measures of National Core Standards 25.0% 0% 0% 0% 0% 0% 0% 25.0% 100.0%
Programme 8: Health Facilities Management
Proportion of Programme 8 budget spent on maintenance (preventative and scheduled) 100.0% 25.0% 9.7% 50.0% 53.9% 75.0% 62.0% 100.0% 100.0%
Number of districts spending more than 90% of maintenance budget 5 5 - 5 - 5 5 5 5
1. Information submitted by:Dr T.E. Selabano Acting Head Official: Health Gauteng Tel No (011) 355 3857 Ms. N. Tshabalala Head Official: Provincial Treasury Gauteng

QUARTERLY PERFORMANCE REPORTS: 2014/15 - 4th Quarter
KWAZULU-NATAL
Sector: Health
Programme / Subprogramme / Performance Measures Target for
2014/15 as per
Annual
Performance
Plan (APP)
1st Quarter
Planned output
as per APP
1st Quarter
Actual output -
validated
2nd Quarter
Planned output
as per APP
2nd Quarter
Actual output -
validated
3rd Quarter
Planned output
as per APP
3rd Quarter
Actual output -
validated
4th Quarter
Planned output
as per APP
4th Quarter
Preliminary
output
QUARTERLY OUTPUTS
Programme 1: Administration
Proportion of health facilities connected to the internet 25.0% 8.0% 36.1% 15.0% 38.7% 20.0% 38.5% 25.0% 38.9%
Programme 2: District Health Services
PHC Utilisation rate 3.0 3.0 2.9 3.0 2.8 3.0 2.8 3.0 2.8
OHH registration visit coverage 0% 0% 0% 0% 0% 0% 0% 0% 0%
PHC supervisor visit rate (fixed clinic/CHC/CDC) 66.4% 64.0% 64.0% 65.0% 62.8% 66.0% 59.7% 66.4% 59.6%
Complaint resolution within 25 working days rate 70.0% 61.0% 93.7% 65.0% 92.5% 68.0% 85.7% 70.0% 89.5%
Number of fully fledged District Clinical specialist Teams appointed 4 1 4 1 - 1 - 1 -
Number of fully-fledged Ward Based Outreach Teams appointed 57 39 77 45 73 51 67 57 54
School ISHP coverage 70.0% 65.0% 39.6% 68.0% 32.0% 69.0% 9.6% 70.0% 11.9%
School Grade 1 screening coverage establish
baseline
establish
baseline
37.9% establish
baseline
25.7% establish
baseline
8.5% baseline
established
8.4%
School Grade 4 screening coverage establish
baseline
establish
baseline
35.1% establish
baseline
24.0% establish
baseline
8.5% baseline
established
9.0%
School Grade 8 screening coverage establish
baseline
establish
baseline
18.6% establish
baseline
14.7% establish
baseline
1.4% baseline
established
6.6%
Percentage of fixed facilities that have conducted gap assessments for compliance against the National Core 90.0% 85.0% 6.6% 87.0% 12.2% 89.0% 1.5% 90.0% 0.3%
Compliance Rate of PHC Facilities (of National Core Standards) 25.0% 0% 1.6% 15.0% 0.8% 20.0% 6.8% 25.0% 42.0%
District Hospitals
Average Length of Stay 5.6 days 5.7 days 5.9 days 5.7 days 5.9 days 5.6 days 5.9 days 5.6 days 5.8 days
Inpatient Bed Utilisation Rate 63.8% 69.0% 62.4% 67.0% 65.5% 65.0% 61.0% 63.8% 62.3%
Expenditure per patient day equivalent (PDE) R 2 038 R 1 985 R 2 004 R 1 990 R 1 940 R 2 000 R 2 064 R 2 038 R 2 086
Complaint Resolution within 25 working days rate 70.0% 65.0% 92.8% 67.0% 94.1% 69.0% 87.4% 70.0% 95.4%
Mental health admission rate 1.1% 1.0% 1.0% 1.0% 0.9% 1.0% 0.9% 1.0% 0.7%
Percentage of Hospitals that have conducted gap assessments for compliance against the National Core 100.0% 0% 7.5% 0% 15.0% 0% 2.5% 100.0% 2.5%
Proportion of hospitals assessed as compliant with the Extreme Measures of National Core Standards 10.0% 0% 0% 0% 0% 0% 0% 0% 0%
HIV and AIDS, TB and STI control
Total clients remaining on ART (TROA) at end of the month 1 038 556 837 145 866 790 904 281 883 577 971 417 910 227 1 038 556 929 313
Number of Medical Male Circumcisions conducted 291 377 72 844 35 346 82 000 47 295 70 000 28 954 65 533 2 644
TB (new pulmonary) defaulter rate 4.5% 4.8% 3.8% 4.7% 3.5% 4.6% 3.8% 4.5% 4.1%
TB AFB sputum result turn-around time under 48 hours rate 80.0% 76.0% 82.5% 77.0% 85.0% 79.0% 82.4% 80.0% 80.0%
TB new client treatment success rate 85.0% 83.0% 86.3% 84.0% 81.6% 85.0% 86.6% 85.0% 86.3%
HIV testing coverage (15-49 Years - Annualised) 58.2% 39.0% 33.4% 43.0% 38.3% 50.0% 0% 58.2% 30.3%
TB (new pulmonary) cure rate 85.0% 81.0% 82.8% 83.0% 83.0% 84.0% 83.8% 85.0% 83.2%
TB MDR confirmed treatment initiation rate 57.8% 53.5% 0% 55.0% 0% 56.5% 0% 57.8% 0%
Maternal, child and women health
Immunisation coverage under 1 year 96.0% 95.8% 86.3% 95.8% 92.8% 95.9% 85.2% 96.0% 85.1%
Vitamin A coverage 12-59 months 55.0% 54.0% 49.3% 54.0% 63.8% 55.0% 47.6% 55.0% 48.9%
Deworming 12-59 months coverage determine
baseline
determine
baseline
45.3% determine base 57.1% determine
baseline
41.3% Baseline
determined
35.0%
Child under 2 years underweight for age incidence 20.00 23.00 0.03 22.00 0.03 21.00 0.04 20.00 0.04
Measles 1st dose under 1 year coverage 94.6% 93.5% 88.4% 94.0% 93.8% 94.2% 87.5% 94.6% 87.9%
Pneumococcal Vaccine (PCV) 3rd Dose Coverage 96.2% 95.1% 88.6% 95.7% 93.3% 96.0% 87.7% 96.2% 87.6%
Rote Virus (RV) 2nd Dose Coverage 104.4% 103.7% 90.5% 104.0% 100.1% 104.1% 93.6% 104.4% 81.0%
Cervical cancer screening coverage 79.7% 79.2% 68.0% 79.4% 79.2% 79.6% 66.9% 79.7% 57.5%
HPV Vaccine Coverage amongst Grade 4 girls determine
baseline
determine
baseline
0% determine base 82.9% determine
baseline
0% Baseline
determined
101.5%
Antenatal 1st visits before 20 weeks rate 60.0% 55.0% 52.8% 57.0% 59.2% 59.0% 58.4% 60.0% 57.1%
Infant given NVP within 72 hours after birth uptake rate 98.0% 98.0% 99.4% 98.0% 100.8% 98.0% 97.6% 98.0% 98.0%
Infant 1st PCR Test positive around 6 weeks rate 1.2% 1.7% 1.3% 1.4% 1.2% 1.2% 1.4% 1.2% 1.4%
Couple year protection rate 45.0% 40.0% 52.3% 43.0% 54.1% 44.0% 0% 45.0% 36.4%
Disease Prevention and Control
Hypertension incidence 22.80 23.00 0.02 23.00 0.02 22.90 - 22.80 0.01
Diabetes incidence 2.10 2.10 0.01 2.10 0.01 2.10 - 2.10 0.00
Cataract surgery rate (Uninsured Population) 749.0 678.0 910.9 688.0 977.0 701.0 - 749.0 845.2
Programme 3: Emergency Medical Services
EMS operational ambulance coverage 0.26 0.26 0.17 0.26 0.19 0.26 0.19 0.26 0.18
EMS P1 urban response under 15 minutes rate 15.0% 10.0% 4.9% 10.0% 5.2% 15.0% 5.3% 15.0% 4.9%
EMS P1 rural response under 40 minutes rate 40.0% 30.0% 31.5% 35.0% 30.3% 40.0% 32.1% 40.0% 32.2%
EMS P1 call response under 60 minutes rate 65.0% 50.0% 42.8% 55.0% 40.5% 65.0% 41.6% 65.0% 40.1%
Programme 4: Provincial Hospital Services
General (regional) hospitals
Average Length of Stay 5.3 days 5.9 days 6.1 days 5.7 days 6.0 days 5.5 days 6.1 days 5.3 days 6.0 days
Inpatient Bed Utilisation Rate 76.5% 75.0% 73.3% 75.5% 76.5% 76.0% 71.8% 76.5% 71.7%
Expenditure per patient day equivalent (PDE) R 2 241 R 2 195 R 2 487 R 2 150 R 2 311 R 2 200 R 2 463 R 2 241 R 2 399
Complaint Resolution within 25 working days rate 70.0% 63.0% 94.5% 66.0% 98.8% 68.0% 98.8% 70.0% 90.5%
Mental health admission rate 1.4% 1.2% 1.1% 1.2% 1.1% 1.3% 1.0% 1.4% 1.1%
Percentage of Hospitals that have conducted gap assessments for compliance against the National Core 100.0% 50.0% 15.4% 75.0% 7.7% 90.0% 7.7% 100.0% 0%
Proportion of hospitals assessed as compliant with the Extreme Measures of National Core Standards 23.0% 0% 0% 0% 0% 0% 0% 23.0% 0%

QUARTERLY PERFORMANCE REPORTS: 2014/15 - 4th Quarter
KWAZULU-NATAL
Sector: Health
Programme / Subprogramme / Performance Measures Target for
2014/15 as per
Annual
Performance
Plan (APP)
1st Quarter
Planned output
as per APP
1st Quarter
Actual output -
validated
2nd Quarter
Planned output
as per APP
2nd Quarter
Actual output -
validated
3rd Quarter
Planned output
as per APP
3rd Quarter
Actual output -
validated
4th Quarter
Planned output
as per APP
4th Quarter
Preliminary
output
QUARTERLY OUTPUTS
Programme 5: Central Hospital Services
Tertiary Hospitals
Average Length of Stay 9.3 days 10.0 days 9.9 days 9.7 days 9.7 days 9.5 days 9.2 days 9.3 days 10.3 days
Inpatient Bed Utilisation Rate 75.0% 60.0% 83.4% 65.0% 86.5% 70.0% 78.9% 75.0% 82.8%
Expenditure per patient day equivalent (PDE) R 4 841 R 4 790 R 5 147 R 4 795 R 7 265 R 4 800 R 8 468 R 4 841 R 6 933
Complaint Resolution within 25 working days rate 90.0% 90.0% 0% 90.0% 0% 90.0% 0% 90.0% 0%
Mental health admission rate 1.6% 1.5% 0% 1.5% 0% 1.5% 0% 1.6% 0%
Percentage of Hospitals that have conducted gap assessments for compliance against the National Core 100.0% 100.0% 0% 100.0% 0% 100.0% 0% 100.0% 0%
Proportion of hospitals assessed as compliant with the Extreme Measures of National Core Standards 0% 0% 0% 0% 0% 0% 0% 0% 0%
Central Hospitals
Average Length of Stay 7.8 days 8.4 days - 8.1 days - 7.9 days - 7.8 days -
Inpatient Bed Utilisation Rate 71.9% 71.8% 0% 71.8% 0% 71.9% 0% 71.9% 0%
Expenditure per patient day equivalent (PDE) R 3 083 R 3 003 R 0 R 3 033 R 0 R 3 073 R 0 R 3 083 R 0
Complaint Resolution within 25 working days rate 85.0% 85.0% 0% 85.0% 0% 85.0% 0% 85.0% 0%
Mental health admission rate 0% 0% 0% 0% 0% 0% 0% 0% 0%
Percentage of Hospitals that have conducted gap assessments for compliance against the National Core 100.0% 100.0% 0% 100.0% 0% 100.0% 0% 100.0% 0%
Proportion of hospitals assessed as compliant with the Extreme Measures of National Core Standards 100.0% 0% 0% 0% 0% 0% 0% 100.0% 0%
Programme 8: Health Facilities Management
Proportion of Programme 8 budget spent on maintenance (preventative and scheduled) 11.0% 0% 0% 0% 0% 0% 0% 11.0% 0%
Number of districts spending more than 90% of maintenance budget 11 - - - - - - 11 -
1. Information submitted by: Dr. MLB Simelane Head Official: Health KwaZulu-Natal Tel No (033) 395 2799 Mr. S. Magagula Head Official: Provincial Treasury KwaZulu-Natal

QUARTERLY PERFORMANCE REPORTS: 2014/15 - 4th Quarter
LIMPOPO
Sector: Health
Programme / Subprogramme / Performance Measures Target for
2014/15 as per
Annual
Performance
Plan (APP)
1st Quarter
Planned output
as per APP
1st Quarter
Actual output -
validated
2nd Quarter
Planned output
as per APP
2nd Quarter
Actual output -
validated
3rd Quarter
Planned output
as per APP
3rd Quarter
Actual output -
validated
4th Quarter
Planned output
as per APP
4th Quarter
Preliminary
output
QUARTERLY OUTPUTS
Programme 1: Administration
Proportion of health facilities connected to the internet 0% 0% 8.1% 0% 8.1% 0% 0% 0% 0%
Programme 2: District Health Services
PHC Utilisation rate 2.7 2.7 2.6 2.7 2.6 2.7 2.5 2.7 3.9
OHH registration visit coverage 12.0% 12.0% 87.3% 12.0% 64.1% 12.0% 0% 12.0% 0%
PHC supervisor visit rate (fixed clinic/CHC/CDC) 90.0% 90.0% 87.7% 90.0% 86.8% 90.0% 77.2% 90.0% 122.9%
Complaint resolution within 25 working days rate 68.0% 68.0% 84.7% 68.0% 92.4% 68.0% 93.3% 68.0% 89.4%
Number of fully fledged District Clinical specialist Teams appointed 1 1 - 1 - 1 - 1 -
Number of fully-fledged Ward Based Outreach Teams appointed 75 75 91 75 91 75 - 75 -
School ISHP coverage 10.0% 0% 9 929.2% 0% 14 180.1% 0% 0% 10.0% 0%
School Grade 1 screening coverage 10.0% 0% 29.9% 0% 38.0% 0% 0% 10.0% 0%
School Grade 4 screening coverage 20.0% 0% 15.4% 0% 27.9% 0% 0% 20.0% 0%
School Grade 8 screening coverage 20.0% 0% 6.7% 0% 11.6% 0% 0% 20.0% 0%
Percentage of fixed facilities that have conducted gap assessments for compliance against the National Core 36.0% 0% 5.8% 0% 16.6% 0% 0% 36.0% 0%
Compliance Rate of PHC Facilities (of National Core Standards) 0% 0% 55.9% 0% 104.3% 0% 0% 0% 0%
District Hospitals
Average Length of Stay 4.4 days 4.4 days 4.4 days 4.4 days 4.3 days 4.4 days - 4.4 days 4.2 days
Inpatient Bed Utilisation Rate 70.0% 70.0% 67.7% 70.0% 71.2% 70.0% 68.8% 70.0% 101.8%
Expenditure per patient day equivalent (PDE) R 2 100 R 2 100 R 2 615 R 2 100 R 2 442 R 2 100 R 4 704 R 2 100 R 1 716
Complaint Resolution within 25 working days rate 80.0% 80.0% 95.9% 80.0% 99.6% 80.0% 100.8% 80.0% 129.9%
Mental health admission rate 0% 0% 1.9% 0% 1.9% 0% 36.0% 0% 1.7%
Percentage of Hospitals that have conducted gap assessments for compliance against the National Core 100.0% 20.0% 16.7% 50.0% 50.0% 75.0% 70.0% 100.0% 100.0%
Proportion of hospitals assessed as compliant with the Extreme Measures of National Core Standards 0% 0% 0% 0% 0% 0% 100.0% 0% 100.0%
HIV and AIDS, TB and STI control
Total clients remaining on ART (TROA) at end of the month 190 000 188 000 194 118 189 000 200 478 190 000 213 957 190 000 231 997
Number of Medical Male Circumcisions conducted 62 000 3 000 9 796 62 000 19 582 3 000 4 227 3 000 3 212
TB (new pulmonary) defaulter rate <5% <5% 4.2% <5% 5.1% <5% 5.5% <5% 0.5%
TB AFB sputum result turn-around time under 48 hours rate 32.0% 32.0% 50.8% 32.0% 64.5% 32.0% 62.0% 32.0% 71.6%
TB new client treatment success rate 60.0% 60.0% 76.2% 60.0% 75.8% 60.0% 74.6% 60.0% 79.2%
HIV testing coverage (15-49 Years - Annualised) 99.0% 99.0% 37.5% 99.0% 41.3% 99.0% 36.4% 99.0% 5.8%
TB (new pulmonary) cure rate 75.0% 75.0% 72.4% 75.0% 70.1% 75.0% 70.2% 75.0% 73.2%
TB MDR confirmed treatment initiation rate 47.0% 47.0% 100.0% 47.0% 94.0% 47.0% 98.7% 47.0% 96.1%
Maternal, child and women health
Immunisation coverage under 1 year 90.0% 90.0% 77.1% 90.0% 79.7% 90.0% 83.8% 90.0% 0%
Vitamin A coverage 12-59 months 40.0% 40.0% 36.4% 40.0% 44.1% 40.0% 39.2% 40.0% 0%
Deworming 12-59 months coverage 90.0% 90.0% 28.7% 90.0% 19.6% 90.0% 7.7% 90.0% 0%
Child under 2 years underweight for age incidence 0.44 0.44 24.48 0.44 25.60 0.44 26.40 0.44 -
Measles 1st dose under 1 year coverage 90.0% 90.0% 89.4% 90.0% 88.8% 90.0% 91.7% 90.0% 0%
Pneumococcal Vaccine (PCV) 3rd Dose Coverage 90.0% 90.0% 86.8% 90.0% 90.3% 90.0% 90.0% 90.0% 0%
Rotavirus (RV) 2nd Dose Coverage 90.0% 90.0% 90.2% 90.0% 100.1% 90.0% 94.2% 90.0% 0%
Cervical cancer screening coverage 55.0% 55.0% 46.7% 55.0% 56.0% 55.0% 41.2% 55.0% 0%
HPV Vaccine Coverage amongst Grade 4 girls 60.0% 0% 50.5% 0% 86.9% 60.0% 0% 0% 0%
Antenatal 1st visits before 20 weeks rate 45.0% 45.0% 45.4% 45.0% 53.1% 45.0% 57.8% 45.0% 52.6%
Infant given NVP within 72 hours after birth uptake rate 50.0% 50.0% 98.9% 50.0% 98.8% 50.0% 98.3% 50.0% 97.9%
Infant 1st PCR Test positive around 6 weeks rate < 2 < 2 2.1% < 2 2.4% < 2 2.5% < 2 1.9%
Couple year protection rate 45.0% 45.0% 33.9% 45.0% 40.6% 45.0% 3 712.0% 45.0% 0%
Disease Prevention and Control
Hypertension incidence 0.16 - 15.76 - 13.38 - 13.86 0.16 -
Diabetes incidence 0.02 - 10.82 - 10.94 - 10.80 0.02 -
Cataract surgery rate (Uninsured Population) 1 000.0 1 000.0 537.5 1 000.0 777.6 1 000.0 1 020.7 1 000.0 -
Programme 3: Emergency Medical Services
EMS operational ambulance coverage 0.30 0.30 0.16 0.30 1.15 0.30 0.59 0.00 0.39
EMS P1 urban response under 15 minutes rate 50.0% 50.0% 56.7% 50.0% 46.4% 50.0% 37.6% 50.0% 28.6%
EMS P1 rural response under 40 minutes rate 53.0% 53.0% 80.1% 53.0% 164.8% 53.0% 261.1% 53.0% 3 160.1%
EMS P1 call response under 60 minutes rate 55.0% 55.0% 62.6% 55.0% 259.1% 55.0% 70.0% 55.0% 281.7%
Programme 4: Provincial Hospital Services
General (regional) hospitals
Average Length of Stay 5.0 days 5.0 days 5.6 days 5.0 days 5.4 days 5.0 days 5.0 days 5.0 days 5.0 days
Inpatient Bed Utilisation Rate 65.0% 65.0% 71.5% 65.0% 72.7% 65.0% 67.9% 65.0% 90.0%
Expenditure per patient day equivalent (PDE) R 2 544 R 2 544 R 2 470 R 2 544 R 2 249 R 2 544 R 2 597 R 2 544 R 1 880
Complaint Resolution within 25 working days rate 80.0% 80.0% 100.0% 80.0% 100.0% 80.0% 100.0% 80.0% 137.5%
Mental health admission rate 0% 0% 2.1% 0% 2.4% 0% 1.9% 0% 2.3%
Percentage of Hospitals that have conducted gap assessments for compliance against the National Core 100.0% 100.0% 20.0% 100.0% 60.0% 100.0% 80.0% 100.0% 100.0%
Proportion of hospitals assessed as compliant with the Extreme Measures of National Core Standards 0% 0% 0% 0% 0% 0% 100.0% 0% 100.0%

QUARTERLY PERFORMANCE REPORTS: 2014/15 - 4th Quarter
LIMPOPO
Sector: Health
Programme / Subprogramme / Performance Measures Target for
2014/15 as per
Annual
Performance
Plan (APP)
1st Quarter
Planned output
as per APP
1st Quarter
Actual output -
validated
2nd Quarter
Planned output
as per APP
2nd Quarter
Actual output -
validated
3rd Quarter
Planned output
as per APP
3rd Quarter
Actual output -
validated
4th Quarter
Planned output
as per APP
4th Quarter
Preliminary
output
QUARTERLY OUTPUTS
Programme 5: Central Hospital Services
Tertiary Hospitals
Average Length of Stay 7.0 days 7.0 days 7.3 days 7.0 days 7.1 days 7.0 days 6.7 days 7.0 days 6.8 days
Inpatient Bed Utilisation Rate 75.0% 75.0% 74.0% 75.0% 77.3% 75.0% 74.9% 75.0% 110.4%
Expenditure per patient day equivalent (PDE) R 3 500 R 3 500 R 3 466 R 3 500 R 3 438 R 3 500 R 3 772 R 3 500 R 4 380
Complaint Resolution within 25 working days rate 90.0% 90.0% 100.0% 90.0% 100.0% 90.0% 100.0% 90.0% 100.0%
Mental health admission rate 0% 0% 0.7% 0% 0.8% 0% 1.1% 0% 1.1%
Percentage of Hospitals that have conducted gap assessments for compliance against the National Core 100.0% 100.0% 0% 100.0% 0% 100.0% 50.0% 100.0% 100.0%
Proportion of hospitals assessed as compliant with the Extreme Measures of National Core Standards 0% 0% 0% 0% 0% 0% 100.0% 0% 100.0%
Central Hospitals
Average Length of Stay
Inpatient Bed Utilisation Rate
Expenditure per patient day equivalent (PDE)
Complaint Resolution within 25 working days rate
Mental health admission rate
Percentage of Hospitals that have conducted gap assessments for compliance against the National Core
Proportion of hospitals assessed as compliant with the Extreme Measures of National Core Standards
Programme 8: Health Facilities Management
Proportion of Programme 8 budget spent on maintenance (preventative and scheduled) 3.7% 3.7% 20.8% 3.7% 13.6% 3.7% 0% 3.7% 0%
Number of districts spending more than 90% of maintenance budget 5 5 5 5 5 5 - 5 -
1. Information submitted by: Dr S Kabane Head Official: Health Limpopo Tel No (015) 294 6011 Mr. G. Pratt Head Official: Provincial Treasury Limpopo
* This province does not have Central Hospitals

QUARTERLY PERFORMANCE REPORTS: 2014/15 - 4th Quarter
MPUMALANGA
Sector: Health
Programme / Subprogramme / Performance Measures Target for
2014/15 as per
Annual
Performance
Plan (APP)
1st Quarter
Planned output
as per APP
1st Quarter
Actual output -
validated
2nd Quarter
Planned output
as per APP
2nd Quarter
Actual output -
validated
3rd Quarter
Planned output
as per APP
3rd Quarter
Actual output -
validated
4th Quarter
Planned output
as per APP
4th Quarter
Preliminary
output
QUARTERLY OUTPUTS
Programme 1: Administration
Proportion of health facilities connected to the internet 50.0% 0% 25.0% 0% 25.0% 0% 25.0% 50.0% 25.0%
Programme 2: District Health Services
PHC Utilisation rate 3.0 3.0 2.3 3.0 2.3 3.0 2.1 3.0 2.2
OHH registration visit coverage 0% 0% 16.9% 0% 32.3% 0% 7.1% 0% 9.1%
PHC supervisor visit rate (fixed clinic/CHC/CDC) 90.0% 90.0% 83.2% 90.0% 86.1% 90.0% 83.2% 90.0% 78.0%
Complaint resolution within 25 working days rate 78.0% 78.0% 76.8% 78.0% 96.4% 78.0% 94.3% 78.0% 202.2%
Number of fully fledged District Clinical specialist Teams appointed 2 - 1 1 - 1 - - -
Number of fully-fledged Ward Based Outreach Teams appointed 10 - 44 - 52 - 52 10 61
School ISHP coverage 25.0% 25.0% 25.8% 25.0% 35.0% 25.0% 10.1% 25.0% 13.8%
School Grade 1 screening coverage 20.0% 20.0% 7.0% 20.0% 13.9% 20.0% 3.3% 20.0% 3.5%
School Grade 4 screening coverage 15.0% 15.0% 7.3% 15.0% 9.1% 15.0% 6.3% 15.0% 1.8%
School Grade 8 screening coverage 5.0% 5.0% 2.6% 5.0% 6.6% 5.0% 0% 5.0% 0.4%
Percentage of fixed facilities that have conducted gap assessments for compliance against the National Core 100.0% 100.0% 0% 100.0% 51.6% 100.0% 84.9% 100.0% 84.9%
Compliance Rate of PHC Facilities (of National Core Standards) 80.0% 80.0% 0% 80.0% 0% 80.0% 0% 80.0% 0%
District Hospitals
Average Length of Stay 4.0 days 40.0 days 4.3 days 40.0 days 4.3 days 40.0 days 4.4 days 40.0 days 4.3 days
Inpatient Bed Utilisation Rate 75.0% 75.0% 70.2% 75.0% 72.7% 75.0% 71.4% 75.0% 70.2%
Expenditure per patient day equivalent (PDE) R 1 500 R 1 500 R 2 172 R 1 500 R 1 797 R 1 500 R 1 917 R 1 500 R 1 885
Complaint Resolution within 25 working days rate 70.0% 70.0% 99.3% 70.0% 96.9% 70.0% 98.3% 70.0% 97.4%
Mental health admission rate 75.0% 75.0% 0.8% 75.0% 1.0% 75.0% 1.0% 75.0% 0.9%
Percentage of Hospitals that have conducted gap assessments for compliance against the National Core 100.0% 0% 0% 0% 52.2% 0% 95.7% 100.0% 100.0%
Proportion of hospitals assessed as compliant with the Extreme Measures of National Core Standards 100.0% 100.0% 0% 100.0% 0% 100.0% 0% 0% 0%
HIV and AIDS, TB and STI control
Total clients remaining on ART (TROA) at end of the month 309 071 253 199 248 121 271 823 260 676 290 447 265 685 309 071 277 376
Number of Medical Male Circumcisions conducted 60 000 5 000 16 386 30 000 18 074 15 000 5 295 15 000 3 304
TB (new pulmonary) defaulter rate <6% 0% 0% 0% 5.0% 0% 3.8% <6% 4.7%
TB AFB sputum result turn-around time under 48 hours rate 95.0% 95.0% 62.8% 95.0% 62.2% 95.0% 62.2% 95.0% 58.4%
TB new client treatment success rate 100.0% 0% 76.0% 0% 69.4% 0% 71.2% 100.0% 746.2%
HIV testing coverage (15-49 Years - Annualised) 30.0% 30.0% 25.1% 30.0% 26.7% 30.0% 25.3% 30.0% 28.6%
TB (new pulmonary) cure rate 80.0% 0% 71.2% 0% 63.9% 0% 66.5% 80.0% 69.3%
TB MDR confirmed treatment initiation rate 90.0% 90.0% 99.7% 90.0% 99.7% 90.0% 99.7% 90.0% 98.9%
Maternal, child and women health
Immunisation coverage under 1 year 90.0% 90.0% 74.1% 90.0% 77.2% 90.0% 78.7% 90.0% 82.1%
Vitamin A coverage 12-59 months 50.0% 45.0% 30.7% 47.0% 36.2% 48.0% 35.3% 50.0% 39.9%
Deworming 12-59 months coverage 30.0% 22.0% 15.4% 25.0% 17.5% 28.0% 12.6% 30.0% 16.1%
Child under 2 years underweight for age incidence 0.16 0.17 6.27 0.17 6.07 0.16 4.42 0.16 8.38
Measles 1st dose under 1 year coverage 90.0% 90.0% 80.1% 90.0% 80.5% 90.0% 82.8% 90.0% 85.8%
Pneumococcal Vaccine (PCV) 3rd Dose Coverage 90.0% 90.0% 79.4% 90.0% 80.5% 90.0% 80.3% 90.0% 83.3%
Rotavirus (RV) 2nd Dose Coverage 90.0% 90.0% 85.4% 90.0% 96.0% 90.0% 89.7% 90.0% 131.4%
Cervical cancer screening coverage 70.0% 70.0% 59.2% 70.0% 68.7% 70.0% 55.4% 70.0% 61.6%
HPV Vaccine Coverage amongst Grade 4 girls 80.0% 80.0% 0% 80.0% 0% 80.0% 0% 80.0% 0%
Antenatal 1st visits before 20 weeks rate 43.0% 43.0% 53.8% 43.0% 57.6% 43.0% 57.4% 43.0% 39.8%
Infant given NVP within 72 hours after birth uptake rate 100.0% 100.0% 100.4% 100.0% 100.0% 100.0% 98.6% 100.0% 98.9%
Infant 1st PCR Test positive around 6 weeks rate <2% <2% 2.0% <2% 1.7% <2% 1.6% <2% 1.5%
Couple year protection rate 41.0% 0% 35.2% 0% 40.1% 0% 65.2% 41.0% 61.6%
Disease Prevention and Control
Hypertension incidence 0.15 0.15 14.42 0.15 14.55 0.15 11.57 0.15 10.69
Diabetes incidence 0.15 0.15 5.44 0.15 5.63 0.15 5.49 0.15 0.08
Cataract surgery rate (Uninsured Population) 1 000.0 167.0 723.4 333.0 695.9 333.0 805.9 167.0 1 092.3
Programme 3: Emergency Medical Services
EMS operational ambulance coverage 0.00 0.00 0.23 0.00 0.23 0.03 0.23 0.00 0.23
EMS P1 urban response under 15 minutes rate 85.0% 85.0% 67.4% 85.0% 70.5% 85.0% 74.9% 85.0% 73.7%
EMS P1 rural response under 40 minutes rate 75.0% 75.0% 64.8% 75.0% 63.6% 75.0% 69.7% 75.0% 67.9%
EMS P1 call response under 60 minutes rate 75.0% 75.0% 72.0% 75.0% 69.0% 75.0% 64.5% 75.0% 63.0%
Programme 4: Provincial Hospital Services
General (regional) hospitals
Average Length of Stay 4.7 days 4.7 days 5.2 days 4.7 days 4.8 days 4.7 days 4.4 days 4.7 days 4.2 days
Inpatient Bed Utilisation Rate 75.0% 75.0% 79.5% 75.0% 80.5% 75.0% 75.8% 75.0% 74.7%
Expenditure per patient day equivalent (PDE) R 2 332 R 2 000 R 2 895 R 2 664 R 2 148 R 2 664 R 2 516 R 2 000 R 2 708
Complaint Resolution within 25 working days rate 80.0% 80.0% 77.4% 80.0% 95.0% 80.0% 89.5% 80.0% 93.6%
Mental health admission rate 80.0% 0% 0.9% 0% 0.9% 0% 1.1% 80.0% 0.9%
Percentage of Hospitals that have conducted gap assessments for compliance against the National Core 100.0% 100.0% 66.7% 100.0% 66.7% 100.0% 66.7% 100.0% 100.0%
Proportion of hospitals assessed as compliant with the Extreme Measures of National Core Standards 100.0% 100.0% 0% 100.0% 0% 0% 0% 0% 0%

QUARTERLY PERFORMANCE REPORTS: 2014/15 - 4th Quarter
MPUMALANGA
Sector: Health
Programme / Subprogramme / Performance Measures Target for
2014/15 as per
Annual
Performance
Plan (APP)
1st Quarter
Planned output
as per APP
1st Quarter
Actual output -
validated
2nd Quarter
Planned output
as per APP
2nd Quarter
Actual output -
validated
3rd Quarter
Planned output
as per APP
3rd Quarter
Actual output -
validated
4th Quarter
Planned output
as per APP
4th Quarter
Preliminary
output
QUARTERLY OUTPUTS
Programme 5: Central Hospital Services
Tertiary Hospitals
Average Length of Stay 5.3 days 5.3 days 6.7 days 5.3 days 6.8 days 5.3 days 6.8 days 5.3 days 7.3 days
Inpatient Bed Utilisation Rate 75.0% 75.0% 81.1% 75.0% 85.8% 75.0% 79.6% 0% 85.1%
Expenditure per patient day equivalent (PDE) R 2 867 R 2 367 R 4 963 R 3 367 R 3 645 R 3 367 R 0 R 2 367 R 0
Complaint Resolution within 25 working days rate 80.0% 90.0% 0% 90.0% 0% 90.0% 0% 90.0% 0%
Mental health admission rate 80.0% 0% 0% 0% 0% 0% 0% 80.0% 0%
Percentage of Hospitals that have conducted gap assessments for compliance against the National Core 100.0% 100.0% 0% 100.0% 0% 100.0% 0% 100.0% 0%
Proportion of hospitals assessed as compliant with the Extreme Measures of National Core Standards 100.0% 100.0% 0% 100.0% 0% 100.0% 0% 100.0% 0%
Central Hospitals
Average Length of Stay
Inpatient Bed Utilisation Rate
Expenditure per patient day equivalent (PDE)
Complaint Resolution within 25 working days rate
Mental health admission rate
Percentage of Hospitals that have conducted gap assessments for compliance against the National Core
Proportion of hospitals assessed as compliant with the Extreme Measures of National Core Standards
Programme 8: Health Facilities Management
Proportion of Programme 8 budget spent on maintenance (preventative and scheduled) 25.0% 25.0% 0% 25.0% 0% 25.0% 0% 25.0% 0%
Number of districts spending more than 90% of maintenance budget 3 3 - 3 - 3 - 3 -
1. Information submitted by: Dr A M Morake Head Official: Health Mpumalanga Tel No (013) 766 3298 Ms. N.Z. Nkamba Head Official: Provincial Treasury Mpumalanga
* This province does not have Central Hospitals

QUARTERLY PERFORMANCE REPORTS: 2014/15 - 4th Quarter
NORTHERN CAPE
Sector: Health
Programme / Subprogramme / Performance Measures Target for
2014/15 as per
Annual
Performance
Plan (APP)
1st Quarter
Planned output
as per APP
1st Quarter
Actual output -
validated
2nd Quarter
Planned output
as per APP
2nd Quarter
Actual output -
validated
3rd Quarter
Planned output
as per APP
3rd Quarter
Actual output -
validated
4th Quarter
Planned output
as per APP
4th Quarter
Preliminary
output
QUARTERLY OUTPUTS
Programme 1: Administration
Proportion of health facilities connected to the internet 100.0% 100.0% 9.0% 100.0% 9.0% 100.0% 9.0% 100.0% 9.0%
Programme 2: District Health Services
PHC Utilisation rate 3.5 3.5 2.8 3.5 2.9 3.5 2.7 3.5 2.8
OHH registration visit coverage 60.0% 60.0% 1.0% 60.0% 0.7% 60.0% 1.3% 60.0% 0.6%
PHC supervisor visit rate (fixed clinic/CHC/CDC) 80.0% 80.0% 49.6% 80.0% 68.9% 80.0% 67.5% 80.0% 61.6%
Complaint resolution within 25 working days rate 60.0% 60.0% 103.1% 60.0% 100.0% 60.0% 105.0% 60.0% 128.6%
Number of fully fledged District Clinical specialist Teams appointed 1 1 15 1 - 1 5 1 5
Number of fully-fledged Ward Based Outreach Teams appointed 30 30 35 30 - 30 35 30 35
School ISHP coverage 30.0% 10.0% 88.2% 15.0% 24.4% 20.0% 27.9% 30.0% 60.5%
School Grade 1 screening coverage 25.0% 7.0% 44.2% 10.0% 20.7% 15.0% 11.8% 25.0% 22.6%
School Grade 4 screening coverage 20.0% 5.0% 21.4% 10.0% 36.0% 15.0% 12.1% 20.0% 24.4%
School Grade 8 screening coverage 20.0% 5.0% 12.3% 10.0% 47.8% 15.0% 1.8% 20.0% 6.6%
Percentage of fixed facilities that have conducted gap assessments for compliance against the National Core 100.0% 100.0% 79.3% 100.0% 80.0% 100.0% 100.0% 100.0% 0%
Compliance Rate of PHC Facilities (of National Core Standards) 21.0% 9.0% 0.4% 11.0% 0.5% 14.0% 0.4% 21.0% 0%
District Hospitals
Average Length of Stay 3.5 days 3.5 days 3.4 days 3.5 days 3.5 days 3.5 days 3.5 days 3.5 days 3.7 days
Inpatient Bed Utilisation Rate 70.0% 70.0% 57.6% 70.0% 61.7% 70.0% 61.1% 70.0% 62.1%
Expenditure per patient day equivalent (PDE) R 1 631 R 1 631 R 2 494 R 1 631 R 2 240 R 1 631 R 2 376 R 1 631 R 1 957
Complaint Resolution within 25 working days rate 60.0% 60.0% 89.5% 60.0% 92.3% 60.0% 100.0% 60.0% 95.7%
Mental health admission rate 0.5% 0.5% 0.2% 0.5% 0.8% 0.5% 0.8% 0.5% 0.7%
Percentage of Hospitals that have conducted gap assessments for compliance against the National Core 100.0% 100.0% 72.7% 100.0% 72.7% 100.0% 100.0% 100.0% 100.0%
Proportion of hospitals assessed as compliant with the Extreme Measures of National Core Standards 9.0% 9.0% 0% 9.0% 0% 9.0% 0% 9.0% 0%
HIV and AIDS, TB and STI control
Total clients remaining on ART (TROA) at end of the month 44 959 40 826 37 520 42 203 39 617 43 580 40 981 44 959 39 815
Number of Medical Male Circumcisions conducted 32 615 8 154 1 516 8 154 2 005 8 154 1 347 8 153 1 135
TB (new pulmonary) defaulter rate 5.0% 5.0% 7.5% 5.0% 5.0% 5.0% 7.6% 5.0% 6.9%
TB AFB sputum result turn-around time under 48 hours rate 68.0% 62.0% 63.0% 64.0% 51.9% 66.0% 52.9% 68.0% 50.8%
TB new client treatment success rate 90.0% 84.0% 77.0% 86.0% 38.4% 88.0% 73.1% 90.0% 66.5%
HIV testing coverage (15-49 Years - Annualised) 49.5% 32.0% 18.2% 38.0% 23.3% 43.0% 26.5% 49.5% 36.1%
TB (new pulmonary) cure rate 80.0% 80.0% 67.6% 80.0% 34.6% 80.0% 61.1% 80.0% 58.9%
TB MDR confirmed treatment initiation rate 100.0% 100.0% 183.9% 100.0% 103.0% 100.0% 99.1% 100.0% 86.5%
Maternal, child and women health
Immunisation coverage under 1 year 98.0% 98.0% 83.9% 98.0% 77.8% 98.0% 87.3% 98.0% 88.5%
Vitamin A coverage 12-59 months 40.0% 37.0% 31.2% 38.0% 36.7% 39.0% 39.6% 40.0% 35.1%
Deworming 12-59 months coverage 30.0% 30.0% 26.8% 30.0% 32.7% 30.0% 32.4% 30.0% 30.3%
Child under 2 years underweight for age incidence 0.10 0.10 46.14 0.10 48.08 0.10 48.50 0.10 59.00
Measles 1st dose under 1 year coverage 98.0% 98.0% 84.4% 98.0% 78.5% 98.0% 89.3% 98.0% 89.1%
Pneumococcal Vaccine (PCV) 3rd Dose Coverage 95.0% 95.0% 85.1% 95.0% 82.3% 95.0% 88.7% 95.0% 89.6%
Rotavirus (RV) 2nd Dose Coverage 95.0% 95.0% 89.0% 95.0% 94.7% 95.0% 91.4% 95.0% 84.4%
Cervical cancer screening coverage 50.0% 50.0% 30.0% 50.0% 33.2% 50.0% 25.3% 50.0% 30.6%
HPV Vaccine Coverage amongst Grade 4 girls 80.0% 80.0% 85.8% 80.0% 127.8% 80.0% 79.4% 80.0% 79.4%
Antenatal 1st visits before 20 weeks rate 60.0% 60.0% 36.2% 60.0% 58.2% 60.0% 59.3% 60.0% 47.6%
Infant given NVP within 72 hours after birth uptake rate 95.0% 92.0% 99.7% 93.0% 101.2% 94.0% 99.0% 95.0% 99.8%
Infant 1st PCR Test positive around 6 weeks rate 2.5% 2.5% 2.3% 2.5% 1.4% 2.5% 2.0% 2.5% 1.9%
Couple year protection rate 40.0% 40.0% 32.2% 40.0% 37.5% 40.0% 37.4% 40.0% 35.1%
Disease Prevention and Control
Hypertension incidence 17 / 1000 17/ 1000 18.24 17 / 1000 20.21 17 / 1000 15.80 17 / 1000 14.88
Diabetes incidence 2.9 / 1000 2.9 / 1000 12.51 2.9 / 1000 15.69 2.9 / 1000 16.58 2.9 / 1000 9.04
Cataract surgery rate (Uninsured Population) 1200/1000000 1200/1000000 552.8 1200/1000000 1 050.8 1200/1000000 1 121.4 1200/1000000 1 041.0
Programme 3: Emergency Medical Services
EMS operational ambulance coverage 0.50 0.50 0.97 0.50 0.81 0.50 0.92 0.50 0.89
EMS P1 urban response under 15 minutes rate 60.0% 60.0% 59.0% 60.0% 59.4% 60.0% 54.6% 60.0% 57.0%
EMS P1 rural response under 40 minutes rate 40.0% 40.0% 54.9% 40.0% 53.1% 40.0% 59.4% 40.0% 49.6%
EMS P1 call response under 60 minutes rate 60.0% 60.0% 48.8% 60.0% 36.1% 60.0% 62.3% 60.0% 68.9%
Programme 4: Provincial Hospital Services
General (regional) hospitals
Average Length of Stay 4.8 days 4.8 days 4.1 days 4.8 days 4.0 days 4.8 days 4.1 days 4.8 days 4.5 days
Inpatient Bed Utilisation Rate 72.0% 72.0% 95.7% 72.0% 101.6% 72.0% 86.2% 72.0% 96.5%
Expenditure per patient day equivalent (PDE) R 1 986 R 1 986 R 2 748 R 1 986 R 2 630 R 1 986 R 2 752 R 1 986 R 2 066
Complaint Resolution within 25 working days rate 60.0% 60.0% 0% 60.0% 100.0% 60.0% 100.0% 60.0% 31.3%
Mental health admission rate 1.0% 1.0% 0.9% 1.0% 0.7% 1.0% 1.5% 1.0% 1.7%
Percentage of Hospitals that have conducted gap assessments for compliance against the National Core 100.0% 100.0% 100.0% 100.0% 100.0% 100.0% 100.0% 100.0% 100.0%
Proportion of hospitals assessed as compliant with the Extreme Measures of National Core Standards 100.0% 100.0% 0% 100.0% 0% 100.0% 0% 100.0% 0%

QUARTERLY PERFORMANCE REPORTS: 2014/15 - 4th Quarter
NORTHERN CAPE
Sector: Health
Programme / Subprogramme / Performance Measures Target for
2014/15 as per
Annual
Performance
Plan (APP)
1st Quarter
Planned output
as per APP
1st Quarter
Actual output -
validated
2nd Quarter
Planned output
as per APP
2nd Quarter
Actual output -
validated
3rd Quarter
Planned output
as per APP
3rd Quarter
Actual output -
validated
4th Quarter
Planned output
as per APP
4th Quarter
Preliminary
output
QUARTERLY OUTPUTS
Programme 5: Central Hospital Services
Tertiary Hospitals
Average Length of Stay 5.5 days 5.5 days 6.5 days 5.5 days 6.7 days 5.5 days 7.0 days 5.5 days 7.4 days
Inpatient Bed Utilisation Rate 74.0% 74.0% 70.9% 74.0% 73.6% 74.0% 73.1% 74.0% 72.9%
Expenditure per patient day equivalent (PDE) R 3 663 R 3 663 R 4 051 R 3 663 R 3 585 R 3 663 R 3 203 R 3 663 R 3 316
Complaint Resolution within 25 working days rate 60.0% 60.0% 100.0% 60.0% 83.8% 60.0% 82.4% 60.0% 80.0%
Mental health admission rate 2.3% 2.3% 0.6% 2.3% 2.2% 2.3% 2.4% 2.3% 1.3%
Percentage of Hospitals that have conducted gap assessments for compliance against the National Core 100.0% 100.0% 0% 100.0% 100.0% 100.0% 100.0% 100.0% 100.0%
Proportion of hospitals assessed as compliant with the Extreme Measures of National Core Standards 100.0% 100.0% 0% 100.0% 0% 100.0% 0% 100.0% 0%
Central Hospitals
Average Length of Stay
Inpatient Bed Utilisation Rate
Expenditure per patient day equivalent (PDE)
Complaint Resolution within 25 working days rate
Mental health admission rate
Percentage of Hospitals that have conducted gap assessments for compliance against the National Core
Proportion of hospitals assessed as compliant with the Extreme Measures of National Core Standards
Programme 8: Health Facilities Management
Proportion of Programme 8 budget spent on maintenance (preventative and scheduled) 18.0% 2.0% 36.3% 5.0% 75.6% 10.0% 41.5% 18.0% 14.2%
Number of districts spending more than 90% of maintenance budget 5 1 - 2 - 3 - 5 -
1. Information submitted by: Ms. G Matlaopane Head Official: Health Northern Cape Tel No (040) 608 1111 Mr.H.V. Gumbo Acting Head Official: Provincial Treasury Northern Cape
* This province does not have Central Hospitals
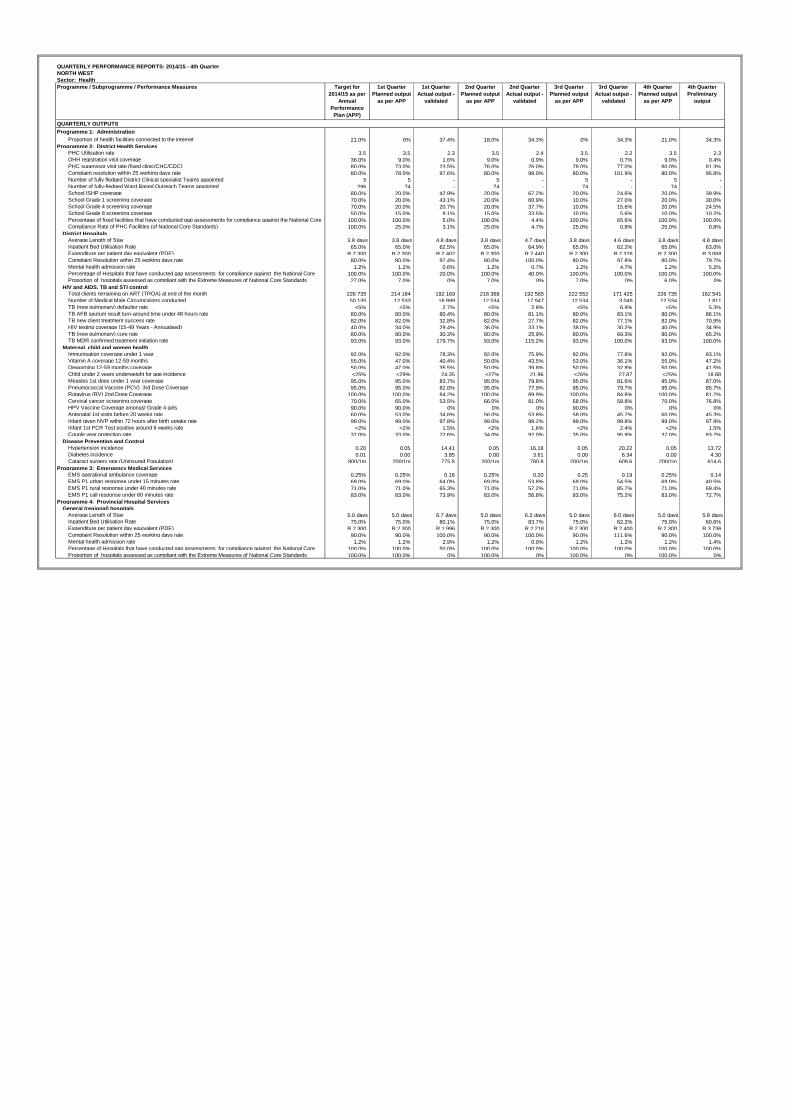
QUARTERLY PERFORMANCE REPORTS: 2014/15 - 4th Quarter
NORTH WEST
Sector: Health
Programme / Subprogramme / Performance Measures Target for
2014/15 as per
Annual
Performance
Plan (APP)
1st Quarter
Planned output
as per APP
1st Quarter
Actual output -
validated
2nd Quarter
Planned output
as per APP
2nd Quarter
Actual output -
validated
3rd Quarter
Planned output
as per APP
3rd Quarter
Actual output -
validated
4th Quarter
Planned output
as per APP
4th Quarter
Preliminary
output
QUARTERLY OUTPUTS
Programme 1: Administration
Proportion of health facilities connected to the internet 21.0% 0% 37.4% 18.0% 34.3% 0% 34.3% 21.0% 34.3%
Programme 2: District Health Services
PHC Utilisation rate 3.5 3.5 2.3 3.5 2.4 3.5 2.2 3.5 2.3
OHH registration visit coverage 36.0% 9.0% 1.6% 9.0% 0.9% 9.0% 0.7% 9.0% 0.4%
PHC supervisor visit rate (fixed clinic/CHC/CDC) 80.0% 73.0% 23.5% 76.0% 26.0% 78.0% 77.0% 80.0% 81.3%
Complaint resolution within 25 working days rate 80.0% 78.0% 97.6% 80.0% 98.0% 80.0% 101.9% 80.0% 95.8%
Number of fully fledged District Clinical specialist Teams appointed 5 5 - 5 - 5 - 5 -
Number of fully-fledged Ward Based Outreach Teams appointed 296 74 - 74 - 74 - 74 -
School ISHP coverage 80.0% 20.0% 42.9% 20.0% 67.2% 20.0% 24.6% 20.0% 39.9%
School Grade 1 screening coverage 70.0% 20.0% 43.1% 20.0% 60.9% 10.0% 27.0% 20.0% 30.0%
School Grade 4 screening coverage 70.0% 20.0% 20.7% 20.0% 37.7% 10.0% 15.6% 20.0% 24.5%
School Grade 8 screening coverage 50.0% 15.0% 9.1% 15.0% 33.5% 10.0% 5.6% 10.0% 10.2%
Percentage of fixed facilities that have conducted gap assessments for compliance against the National Core 100.0% 100.0% 5.0% 100.0% 4.4% 100.0% 65.6% 100.0% 100.0%
Compliance Rate of PHC Facilities (of National Core Standards) 100.0% 25.0% 3.1% 25.0% 4.7% 25.0% 0.8% 25.0% 0.8%
District Hospitals
Average Length of Stay 3.8 days 3.8 days 4.8 days 3.8 days 4.7 days 3.8 days 4.6 days 3.8 days 4.8 days
Inpatient Bed Utilisation Rate 65.0% 65.0% 62.5% 65.0% 64.9% 65.0% 62.2% 65.0% 63.0%
Expenditure per patient day equivalent (PDE) R 2 300 R 2 300 R 2 402 R 2 300 R 2 440 R 2 300 R 2 376 R 2 300 R 3 068
Complaint Resolution within 25 working days rate 80.0% 80.0% 97.4% 80.0% 100.0% 80.0% 97.8% 80.0% 79.7%
Mental health admission rate 1.2% 1.2% 0.6% 1.2% 0.7% 1.2% 4.7% 1.2% 5.2%
Percentage of Hospitals that have conducted gap assessments for compliance against the National Core 100.0% 100.0% 20.0% 100.0% 40.0% 100.0% 100.0% 100.0% 100.0%
Proportion of hospitals assessed as compliant with the Extreme Measures of National Core Standards 27.0% 7.0% 0% 7.0% 0% 7.0% 0% 6.0% 0%
HIV and AIDS, TB and STI control
Total clients remaining on ART (TROA) at end of the month 226 735 214 184 192 169 218 368 192 565 222 552 171 425 226 735 162 541
Number of Medical Male Circumcisions conducted 50 135 12 533 16 899 12 534 17 947 12 534 3 049 12 534 1 811
TB (new pulmonary) defaulter rate <5% <5% 2.7% <5% 2.8% <5% 6.9% <5% 5.3%
TB AFB sputum result turn-around time under 48 hours rate 80.0% 80.0% 80.4% 80.0% 81.1% 80.0% 83.1% 80.0% 86.1%
TB new client treatment success rate 82.0% 82.0% 32.8% 82.0% 27.7% 82.0% 77.1% 82.0% 70.9%
HIV testing coverage (15-49 Years - Annualised) 40.0% 34.0% 29.4% 36.0% 33.1% 38.0% 30.2% 40.0% 34.9%
TB (new pulmonary) cure rate 80.0% 80.0% 30.3% 80.0% 25.9% 80.0% 69.3% 80.0% 65.2%
TB MDR confirmed treatment initiation rate 93.0% 93.0% 179.7% 93.0% 115.2% 93.0% 100.0% 93.0% 100.0%
Maternal, child and women health
Immunisation coverage under 1 year 92.0% 92.0% 78.3% 92.0% 75.9% 92.0% 77.8% 92.0% 83.1%
Vitamin A coverage 12-59 months 55.0% 47.0% 40.4% 50.0% 43.5% 53.0% 36.1% 55.0% 47.2%
Deworming 12-59 months coverage 50.0% 47.0% 35.5% 50.0% 39.8% 50.0% 32.8% 50.0% 41.5%
Child under 2 years underweight for age incidence <25% <29% 24.35 <27% 21.96 <26% 27.87 <25% 18.88
Measles 1st dose under 1 year coverage 95.0% 95.0% 83.7% 95.0% 79.8% 95.0% 81.6% 95.0% 87.0%
Pneumococcal Vaccine (PCV) 3rd Dose Coverage 95.0% 95.0% 82.0% 95.0% 77.9% 95.0% 79.7% 95.0% 85.7%
Rotavirus (RV) 2nd Dose Coverage 100.0% 100.0% 84.2% 100.0% 89.9% 100.0% 84.8% 100.0% 81.2%
Cervical cancer screening coverage 70.0% 65.0% 53.5% 66.0% 81.0% 68.0% 58.8% 70.0% 76.8%
HPV Vaccine Coverage amongst Grade 4 girls 90.0% 90.0% 0% 0% 0% 90.0% 0% 0% 0%
Antenatal 1st visits before 20 weeks rate 60.0% 53.0% 34.6% 56.0% 53.8% 58.0% 45.7% 60.0% 45.3%
Infant given NVP within 72 hours after birth uptake rate 99.0% 99.0% 97.8% 99.0% 98.2% 99.0% 99.8% 99.0% 97.9%
Infant 1st PCR Test positive around 6 weeks rate <2% <2% 1.5% <2% 1.6% <2% 2.4% <2% 1.5%
Couple year protection rate 37.0% 33.0% 72.6% 34.0% 92.0% 35.0% 95.9% 37.0% 83.7%
Disease Prevention and Control
Hypertension incidence 0.20 0.05 14.41 0.05 16.18 0.05 20.22 0.05 13.72
Diabetes incidence 0.01 0.00 3.85 0.00 3.61 0.00 6.34 0.00 4.30
Cataract surgery rate (Uninsured Population) 800/1m 200/1m 775.8 200/1m 780.8 200/1m 609.6 200/1m 614.6
Programme 3: Emergency Medical Services
EMS operational ambulance coverage 0,25% 0,25% 0.16 0,25% 0.20 0,25 0.19 0,25% 0.14
EMS P1 urban response under 15 minutes rate 69.0% 69.0% 64.0% 69.0% 53.8% 69.0% 54.5% 69.0% 40.5%
EMS P1 rural response under 40 minutes rate 71.0% 71.0% 65.3% 71.0% 57.2% 71.0% 85.7% 71.0% 69.4%
EMS P1 call response under 60 minutes rate 83.0% 83.0% 73.9% 83.0% 56.8% 83.0% 75.2% 83.0% 72.7%
Programme 4: Provincial Hospital Services
General (regional) hospitals
Average Length of Stay 5.0 days 5.0 days 6.7 days 5.0 days 6.3 days 5.0 days 6.0 days 5.0 days 5.8 days
Inpatient Bed Utilisation Rate 75.0% 75.0% 80.1% 75.0% 83.7% 75.0% 62.2% 75.0% 60.6%
Expenditure per patient day equivalent (PDE) R 2 300 R 2 300 R 1 996 R 2 300 R 2 218 R 2 300 R 2 400 R 2 300 R 3 736
Complaint Resolution within 25 working days rate 90.0% 90.0% 100.0% 90.0% 100.0% 90.0% 111.6% 90.0% 100.0%
Mental health admission rate 1.2% 1.2% 2.9% 1.2% 0.9% 1.2% 1.2% 1.2% 1.4%
Percentage of Hospitals that have conducted gap assessments for compliance against the National Core 100.0% 100.0% 50.0% 100.0% 100.0% 100.0% 100.0% 100.0% 100.0%
Proportion of hospitals assessed as compliant with the Extreme Measures of National Core Standards 100.0% 100.0% 0% 100.0% 0% 100.0% 0% 100.0% 0%
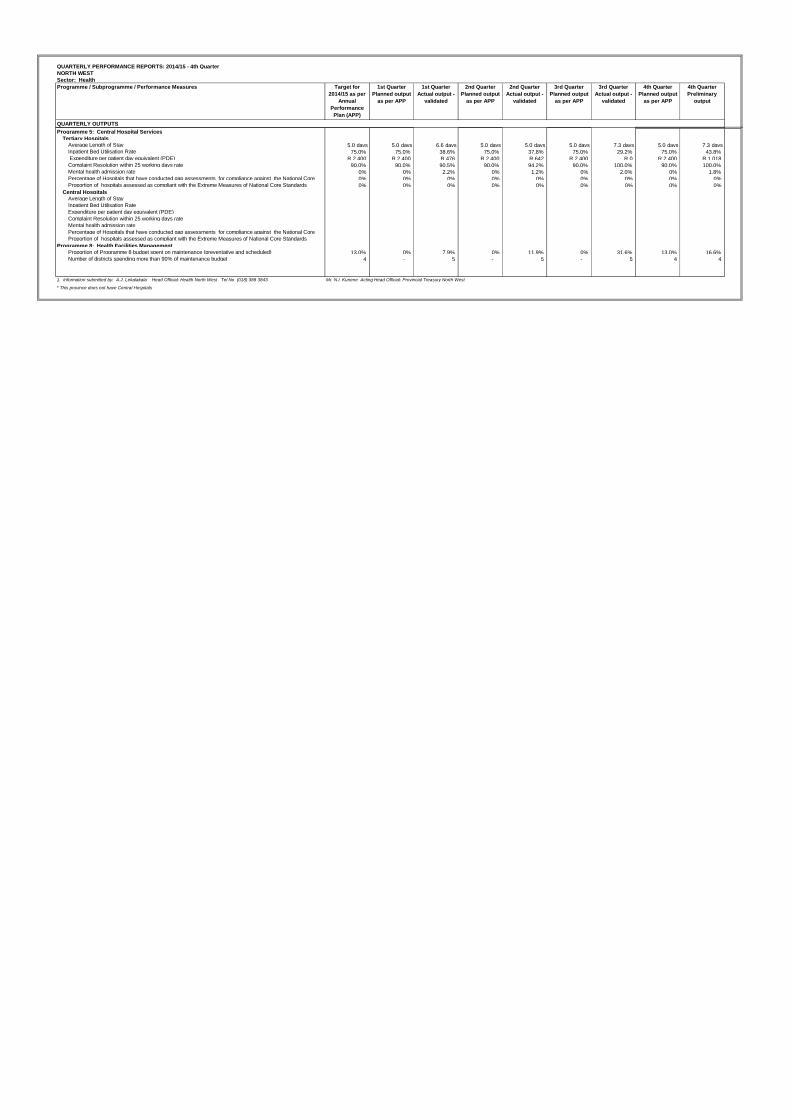
QUARTERLY PERFORMANCE REPORTS: 2014/15 - 4th Quarter
NORTH WEST
Sector: Health
Programme / Subprogramme / Performance Measures Target for
2014/15 as per
Annual
Performance
Plan (APP)
1st Quarter
Planned output
as per APP
1st Quarter
Actual output -
validated
2nd Quarter
Planned output
as per APP
2nd Quarter
Actual output -
validated
3rd Quarter
Planned output
as per APP
3rd Quarter
Actual output -
validated
4th Quarter
Planned output
as per APP
4th Quarter
Preliminary
output
QUARTERLY OUTPUTS
Programme 5: Central Hospital Services
Tertiary Hospitals
Average Length of Stay 5.0 days 5.0 days 6.6 days 5.0 days 5.0 days 5.0 days 7.3 days 5.0 days 7.3 days
Inpatient Bed Utilisation Rate 75.0% 75.0% 38.6% 75.0% 37.8% 75.0% 29.2% 75.0% 43.8%
Expenditure per patient day equivalent (PDE) R 2 400 R 2 400 R 476 R 2 400 R 642 R 2 400 R 0 R 2 400 R 1 018
Complaint Resolution within 25 working days rate 90.0% 90.0% 90.5% 90.0% 94.2% 90.0% 100.0% 90.0% 100.0%
Mental health admission rate 0% 0% 2.2% 0% 1.2% 0% 2.0% 0% 1.8%
Percentage of Hospitals that have conducted gap assessments for compliance against the National Core 0% 0% 0% 0% 0% 0% 0% 0% 0%
Proportion of hospitals assessed as compliant with the Extreme Measures of National Core Standards 0% 0% 0% 0% 0% 0% 0% 0% 0%
Central Hospitals
Average Length of Stay
Inpatient Bed Utilisation Rate
Expenditure per patient day equivalent (PDE)
Complaint Resolution within 25 working days rate
Mental health admission rate
Percentage of Hospitals that have conducted gap assessments for compliance against the National Core
Proportion of hospitals assessed as compliant with the Extreme Measures of National Core Standards
Programme 8: Health Facilities Management
Proportion of Programme 8 budget spent on maintenance (preventative and scheduled) 13.0% 0% 7.9% 0% 11.9% 0% 31.6% 13.0% 16.6%
Number of districts spending more than 90% of maintenance budget 4 - 5 - 5 - 5 4 4
1. Information submitted by: A.J. Lekalakala Head Official: Health North West Tel No (018) 388 3843 Mr. N.I. Kunene Acting Head Official: Provincial Treasury North West
* This province does not have Central Hospitals

QUARTERLY PERFORMANCE REPORTS: 2014/15 - 4th Quarter
WESTERN CAPE
Sector: Health
Programme / Subprogramme / Performance Measures Target for
2014/15 as per
Annual
Performance
Plan (APP)
1st Quarter
Planned output
as per APP
1st Quarter
Actual output -
validated
2nd Quarter
Planned output
as per APP
2nd Quarter
Actual output -
validated
3rd Quarter
Planned output
as per APP
3rd Quarter
Actual output -
validated
4th Quarter
Planned output
as per APP
4th Quarter
Preliminary
output
QUARTERLY OUTPUTS
Programme 1: Administration
Proportion of health facilities connected to the internet No target set No target set 90.1% No target set 90.1% No target set 90.1% No target set 90.1%
Programme 2: District Health Services
PHC Utilisation rate 2.4 2.4 2.3 2.4 2.4 2.4 2.2 2.4 2.2
OHH registration visit coverage Not applicable in
W Cape
Not applicable in
W Cape
0% Not applicable in
W Cape
0% Not applicable in
W Cape
0% Not applicable in
W Cape
0%
PHC supervisor visit rate (fixed clinic/CHC/CDC) 94.2% 94.2% 82.9% 94.2% 81.7% 94.2% 81.5% 94.2% 80.1%
Complaint resolution within 25 working days rate 88.6% 88.7% 96.3% 88.7% 94.1% 88.7% 98.3% 88.3% 97.3%
Number of fully fledged District Clinical specialist Teams appointed Not applicable in
W Cape
Not applicable in
W Cape
- Not applicable in
W Cape
- Not applicable in
W Cape
- Not applicable in
W Cape
-
Number of fully-fledged Ward Based Outreach Teams appointed Not applicable in
W Cape
Not applicable in
W Cape
- Not applicable in
W Cape
- Not applicable in
W Cape
- Not applicable in
W Cape
-
School ISHP coverage 61.6% 61.6% 33.8% 61.6% 44.2% 61.6% 48.9% 61.4% 33.4%
School Grade 1 screening coverage 29.1% 29.1% 22.6% 29.1% 37.4% 29.1% 35.9% 29.1% 27.2%
School Grade 4 screening coverage No target set No target set 0.2% No target set 0.1% No target set 0.1% No target set 0.8%
School Grade 8 screening coverage No target set No target set 0.1% No target set 0% No target set 0% No target set 0.1%
Percentage of fixed facilities that have conducted gap assessments for compliance against the National Core 29.0% 7.2% 0% 7.2% 0.7% 7.2% 27.8% 7.2% 1.4%
Compliance Rate of PHC Facilities (of National Core Standards) No target set No target set 0% No target set 0% No target set 0% No target set 0%
District Hospitals
Average Length of Stay 3.2 days 3.2 days 3.2 days 3.2 days 3.0 days 3.2 days 3.2 days 3.2 days 3.2 days
Inpatient Bed Utilisation Rate 83.4% 83.4% 89.4% 83.4% 89.8% 83.4% 91.1% 83.4% 84.6%
Expenditure per patient day equivalent (PDE) R 1 865 R 1 865 R 1 710 R 1 865 R 1 844 R 1 865 R 1 805 R 1 865 R 1 880
Complaint Resolution within 25 working days rate 78.4% 78.4% 88.6% 78.4% 90.0% 78.4% 89.8% 78.5% 88.5%
Mental health admission rate Not applicable Not applicable 0.8% Not applicable 1.4% Not applicable 1.8% Not applicable 2.4%
Percentage of Hospitals that have conducted gap assessments for compliance against the National Core 76.5% 20.6% 0% 20.6% 5.9% 20.6% 35.3% 14.7% 8.8%
Proportion of hospitals assessed as compliant with the Extreme Measures of National Core Standards No target set No target set 0% No target set 0% No target set 0% No target set 0%
HIV and AIDS, TB and STI control
Total clients remaining on ART (TROA) at end of the month 174 868 149 265 161 283 157 205 166 429 165 145 169 752 173 085 175 159
Number of Medical Male Circumcisions conducted 21 502 5 376 4 264 5 376 4 354 5 376 3 293 5 374 3 570
TB (new pulmonary) defaulter rate 7.1% 7.1% 13.9% 7.1% 7.6% 7.1% 9.2% 7.0% 8.8%
TB AFB sputum result turn-around time under 48 hours rate 69.9% 69.9% 71.4% 69.9% 71.2% 69.9% 71.3% 69.9% 72.1%
TB new client treatment success rate 85.5% 85.5% 79.6% 85.5% 70.6% 85.5% 81.3% 85.5% 83.0%
HIV testing coverage (15-49 Years - Annualised) 30.7% 30.7% 29.2% 30.7% 35.5% 30.7% 37.5% 30.7% 30.4%
TB (new pulmonary) cure rate 82.5% 82.5% 82.0% 82.5% 81.8% 82.5% 77.3% 82.6% 79.3%
TB MDR confirmed treatment initiation rate No target set No target set 0% No target set 187.0% No target set 0% No target set 0%
Maternal, child and women health
Immunisation coverage under 1 year 91.9% 91.9% 87.5% 91.9% 87.6% 91.9% 88.7% 91.9% 93.8%
Vitamin A coverage 12-59 months 44.8% 44.8% 48.4% 44.8% 47.1% 44.8% 44.4% 44.8% 48.5%
Deworming 12-59 months coverage 30.2% 30.2% 41.8% 30.2% 40.8% 30.2% 41.9% 30.2% 41.5%
Child under 2 years underweight for age incidence 18.00 18.00 17.01 18.00 14.44 18.00 12.97 18.00 17.41
Measles 1st dose under 1 year coverage 92.0% 92.0% 91.1% 92.0% 90.2% 92.0% 92.4% 92.0% 96.6%
Pneumococcal Vaccine (PCV) 3rd Dose Coverage 92.1% 92.1% 88.7% 92.1% 90.7% 92.1% 92.6% 92.1% 96.2%
Rote Virus (RV) 2nd Dose Coverage 91.5% 91.5% 92.1% 91.5% 99.2% 91.5% 92.9% 91.5% 87.9%
Cervical cancer screening coverage 57.0% 57.0% 55.1% 57.0% 66.1% 57.0% 54.1% 57.0% 57.3%
HPV Vaccine Coverage amongst Grade 4 girls No target set No target set 83.5% No target set 0% No target set 0% No target set 0%
Antenatal 1st visits before 20 weeks rate 64.0% 64.0% 62.0% 64.0% 66.1% 64.0% 67.1% 64.0% 64.1%
Infant given NVP within 72 hours after birth uptake rate 98.6% 98.6% 99.3% 98.6% 99.2% 98.6% 99.1% 98.5% 97.5%
Infant 1st PCR Test positive around 6 weeks rate 1.7% 1.7% 1.4% 1.7% 1.4% 1.7% 1.3% 1.7% 1.6%
Couple year protection rate 61.3% 61.3% 58.6% 61.3% 63.2% 61.3% 57.3% 61.3% 58.2%
Disease Prevention and Control
Hypertension incidence 10.92 4.00 7.66 2.00 9.26 3.00 6.71 7.00 6.03
Diabetes incidence 1.51 1.00 3.42 1.00 3.68 1.00 2.94 2.00 2.71
Cataract surgery rate (Uninsured Population) 1 724.0 1 909.0 1 755.9 838.0 1 861.4 1 459.0 1 673.9 2 817.0 1 475.9
Programme 3: Emergency Medical Services
EMS operational ambulance coverage 0.00 0.00 0.40 0.00 0.39 0.41 0.40 0.00 0.40
EMS P1 urban response under 15 minutes rate 75.0% 75.0% 56.2% 75.0% 60.0% 75.0% 62.4% 75.0% 68.4%
EMS P1 rural response under 40 minutes rate 90.0% 90.0% 81.0% 90.0% 84.0% 90.0% 83.0% 90.0% 84.6%
EMS P1 call response under 60 minutes rate 80.0% 80.0% 94.6% 80.0% 94.9% 80.0% 94.9% 80.0% 95.9%
Programme 4: Provincial Hospital Services
General (regional) hospitals
Average Length of Stay 3.8 days 3.8 days 3.8 days 3.8 days 3.7 days 3.8 days 3.8 days 3.8 days 3.6 days
Inpatient Bed Utilisation Rate 85.6% 85.8% 86.3% 85.2% 83.7% 84.5% 84.2% 86.6% 79.1%
Expenditure per patient day equivalent (PDE) R 2 618 R 2 646 R 2 421 R 2 561 R 2 625 R 2 616 R 2 606 R 2 652 R 2 866
Complaint Resolution within 25 working days rate 92.7% 92.2% 94.8% 92.2% 98.9% 92.2% 85.7% 94.1% 84.2%
Mental health admission rate 1.7% 1.6% 1.5% 1.6% 1.6% 1.8% 1.7% 1.7% 1.7%
Percentage of Hospitals that have conducted gap assessments for compliance against the National Core 100.0% 0% 0% 0% 0% 0% 0% 100.0% 20.0%
Proportion of hospitals assessed as compliant with the Extreme Measures of National Core Standards No target set No target set 0% No target set 0% No target set 0% No target set 0%

QUARTERLY PERFORMANCE REPORTS: 2014/15 - 4th Quarter
WESTERN CAPE
Sector: Health
Programme / Subprogramme / Performance Measures Target for
2014/15 as per
Annual
Performance
Plan (APP)
1st Quarter
Planned output
as per APP
1st Quarter
Actual output -
validated
2nd Quarter
Planned output
as per APP
2nd Quarter
Actual output -
validated
3rd Quarter
Planned output
as per APP
3rd Quarter
Actual output -
validated
4th Quarter
Planned output
as per APP
4th Quarter
Preliminary
output
QUARTERLY OUTPUTS
Programme 5: Central Hospital Services
Tertiary Hospitals
Average Length of Stay 3.7 days 3.7 days 3.9 days 3.7 days 3.9 days 3.7 days 3.9 days 3.7 days 4.0 days
Inpatient Bed Utilisation Rate 85.0% 85.0% 86.4% 85.0% 84.2% 85.0% 78.6% 85.0% 73.2%
Expenditure per patient day equivalent (PDE) R 4 534 R 4 534 R 4 208 R 4 534 R 4 820 R 4 534 R 5 348 R 4 534 R 5 142
Complaint Resolution within 25 working days rate 90.0% 90.6% 67.6% 90.6% 63.6% 90.6% 79.3% 88.1% 80.0%
Mental health admission rate N/A N/A 0% N/A 0% N/A 0% N/A 0%
Percentage of Hospitals that have conducted gap assessments for compliance against the National Core 100.0% 0% 0% 0% 0% 0% 0% 100.0% 0%
Proportion of hospitals assessed as compliant with the Extreme Measures of National Core Standards No target set No target set 0% No target set 0% No target set 0% No target set 0%
Central Hospitals
Average Length of Stay 6.1 days 6.1 days 6.3 days 6.1 days 6.2 days 6.1 days 6.1 days 6.1 days 6.2 days
Inpatient Bed Utilisation Rate 85.6% 85.6% 85.6% 85.6% 88.2% 85.6% 85.1% 85.6% 81.9%
Expenditure per patient day equivalent (PDE) R 4 236 R 4 236 R 4 274 R 4 236 R 4 212 R 4 236 R 4 221 R 4 236 R 4 221
Complaint Resolution within 25 working days rate 82.5% 82.2% 86.4% 82.2% 88.0% 82.2% 85.8% 83.2% 79.5%
Mental health admission rate 1.4% 1.4% 1.3% 1.4% 1.3% 1.4% 1.3% 1.4% 1.2%
Percentage of Hospitals that have conducted gap assessments for compliance against the National Core 100.0% 0% 0% 0% 0% 0% 0% 100.0% 50.0%
Proportion of hospitals assessed as compliant with the Extreme Measures of National Core Standards No target set No target set 0% 0% 0% 0% 0% 0% 0%
Programme 8: Health Facilities Management
Proportion of Programme 8 budget spent on maintenance (preventative and scheduled) 100.0% 100.0% 107.8% 100.0% 71.4% 100.0% 63.5% 100.0% 55.3%
Number of districts spending more than 90% of maintenance budget No target set No target set - No target set - No target set - No target set -
1. Information submitted by: Dr B Engelbrecht Head Official: Health Western Cape Tel No (021) 483 3647 Z Hoosan Head Official: Provincial Treasury Western Cape