quarterly report - astro · incidents with possible medical impact. the second theme delves into...
TRANSCRIPT

CLARITY PSO, a Division of Clarity Group, Inc.
8725 West Higgins Road • Suite 810 • Chicago, IL 60631
T: 773.864.8280 • F: 773.864.8281
www.claritypso.com
CLARITY PSO © 2017 ALL RIGHTS RESERVED
QUARTERLY REPORTPATIENT SAFETY WORK PRODUCT
Q 1 2 0 1 7J A N UA R Y 1 , 2 0 1 7 – M A R C H 3 1 , 2 0 1 7

CLARITY PSO © 2017 ALL RIGHTS RESERVED. | I I
TABLE OF CONTENTSAggregate Report Card 1
Analysis and Commentary 2-10
Introduction 2
Summary of Incidents with Possible Medical Impact 2
Featured Themes 2-10
I. Errors at the Time of Treatment 3-5
a. Case 1: Wrong Immobilization Device Used for Treatment
b. Case 2: Wrong Treatment Site
c. Case 3: Wrong HDR Cylinder Used
d. Actions and Recommendations
II. Contributing Factors 5-10
a. Institutional Culture
b. Communication and Teamwork
c. Human Factors Engineering
d. Time Pressures
III. References 11
Aggregate Analysis Graphs 12

CLARITY PSO © 2017 ALL RIGHTS RESERVED. | 1
AGGREGATE REPORT CARD –
Q1 2017 January 1, 2017 – March 31, 2017
METRIC AGGREGATECURRENT QUARTER AGGREGATE HISTORICAL SUM
Reported Events
Therapeutic Radiation IncidentsOther Safety Incidents
Near MissUnsafe Conditions
Operational/Process Improvement
348
52398051
126
3175
832217949810367
Most Commonly Identified Workflow Step Where
Event Occurred
Treatment Planning:34% (117/348)
Treatment Planning:28% (891/3175)
Most Commonly Identified Workflow Step Where Event was Discovered
Treatment Delivery Including Imaging:
32% (110/348)
Treatment Delivery Including Imaging:
27% (846/3175)
Most Commonly Identified Treatment Technique
3-D:28% (99/348)
3-D:22% (711/3175)
Most Commonly Identified Dose Deviation for Therapeutic Radiation
Incidents/Other Safety Incidents that Did Not Effect Multiple Patients
≤5% Maximum Dose Deviation to Target:
58% (48/83)
≤5% Maximum Dose Deviation to Target:
66% (418/629)

CLARITY PSO © 2017 ALL RIGHTS RESERVED. | 2
ANALYSIS & COMMENTARYINTRODUCTION
This quarterly report contains case studies derived from events submitted to RO-ILS: Radiation Oncology Incident Learning System®. The first theme focuses on errors at the time of treatment and includes three incidents with possible medical impact. The second theme delves into contributing factors frequently involved in errors, including institutional culture, communication and teamwork, human factors engineering and time pressure. Each of these sections contain interconnected focus topics that highlight an overall theme of learning and improvement of patient safety and quality within radiation oncology through the use of RO-ILS.
SUMMARY OF INCIDENTS WITH POSSIBLE MEDICAL IMPACT
In this quarter (Q1 2017), two incidents out of 348 (0.6 percent) events submitted to the PSO met the Radiation Oncology Healthcare Advisory Council’s (RO-HAC) threshold criteria for possible medical impact. This criteria included therapeutic radiation incidents that had a dose deviation greater than 5 percent and/or OAR(s) that received more than intended and exceeded tolerance levels. In each case the error was a misalignment of the patient at the time of treatment. These errors were caused, in part, by the complexity of the techniques; the first case involved a CT on rails with ambiguous alignment marks, and the second case had a multiple site/field treatment with matching. In both cases one fraction of ten was delivered incorrectly. In the first case the radiation therapist discovered the error just after treatment. In the second case the physician discovered the error during off-line review after the treatment was complete. Policies, procedures, oversight, communication, and rushing were identified as contributing factors.
FEATURED THEME I: ERRORS AT THE TIME OF TREATMENTAlthough it is well appreciated that numerous errors occur at the time of treatment planning, the RO-ILS data indicates that the point of treatment itself is also prone to error. Errors that occur at the time of treatment may also be less likely to be identified before the patient is impacted since there are fewer “eyes” on the problem. We note that many of the errors caught at the time of treatment were identified by alert therapists and other staff before they impacted the patient.
CASE 1: WRONG IMMOBILIZATION DEVICE USED FOR TREATMENTA wrong vaclock bag was used for a patient undergoing breast cancer treatment. When the patient arrived for verification simulation, an unlabeled vaclock bag was located in the CT simulator that was assumed to be the patient’s. Setup photos had not been taken, which may have helped identify the correct device. During verification simulation the setup was found to be inadequate (the tangent field flashed the contralateral breast) and a modification was made. Later the error was identified when a second patient arrived for verification simulation and it was found that their vaclock bag was being used to treat the first patient. Figure 1. Vaclock bags in storage.
CLARITY PSO © 2017 ALL RIGHTS RESERVED. | 3
ANALYSIS & COMMENTARY | continued
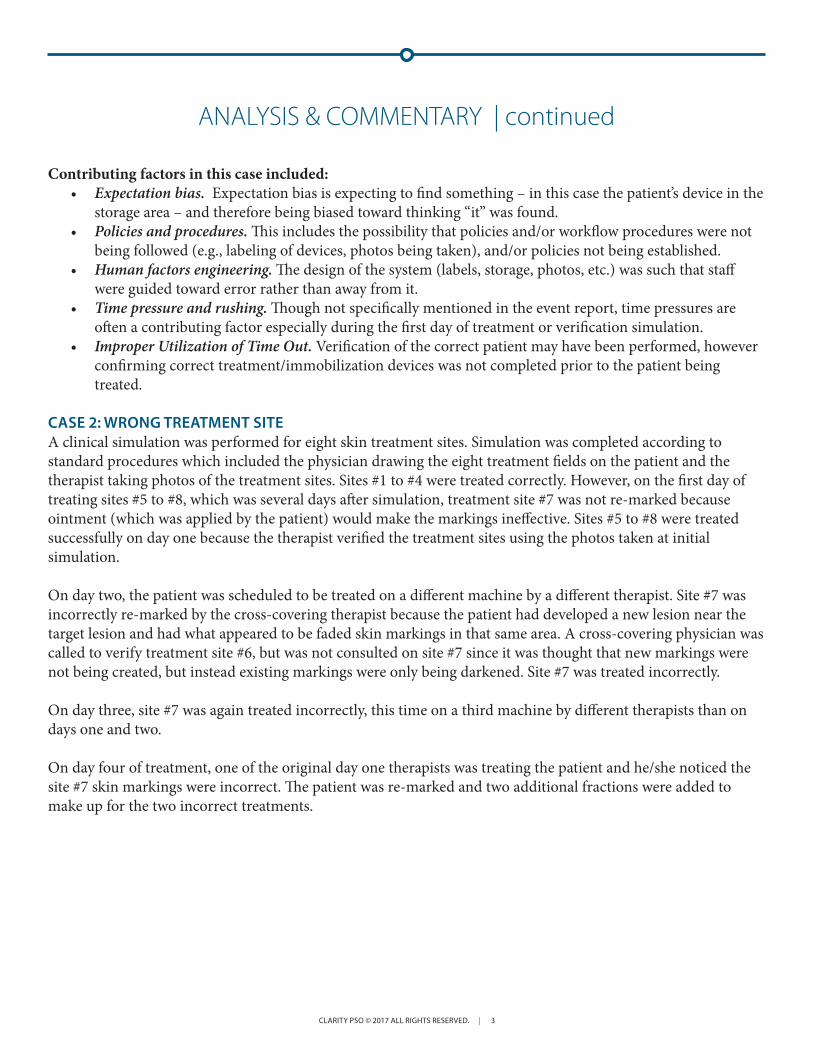
Contributing factors in this case included:• Expectation bias. Expectation bias is expecting to find something – in this case the patient’s device in the
storage area – and therefore being biased toward thinking “it” was found.• Policies and procedures. This includes the possibility that policies and/or workflow procedures were not
being followed (e.g., labeling of devices, photos being taken), and/or policies not being established.• Human factors engineering. The design of the system (labels, storage, photos, etc.) was such that staff
were guided toward error rather than away from it.• Time pressure and rushing. Though not specifically mentioned in the event report, time pressures are
often a contributing factor especially during the first day of treatment or verification simulation.• Improper Utilization of Time Out. Verification of the correct patient may have been performed, however
confirming correct treatment/immobilization devices was not completed prior to the patient being treated.
CASE 2: WRONG TREATMENT SITE A clinical simulation was performed for eight skin treatment sites. Simulation was completed according to standard procedures which included the physician drawing the eight treatment fields on the patient and the therapist taking photos of the treatment sites. Sites #1 to #4 were treated correctly. However, on the first day of treating sites #5 to #8, which was several days after simulation, treatment site #7 was not re-marked because ointment (which was applied by the patient) would make the markings ineffective. Sites #5 to #8 were treated successfully on day one because the therapist verified the treatment sites using the photos taken at initial simulation.
On day two, the patient was scheduled to be treated on a different machine by a different therapist. Site #7 was incorrectly re-marked by the cross-covering therapist because the patient had developed a new lesion near the target lesion and had what appeared to be faded skin markings in that same area. A cross-covering physician was called to verify treatment site #6, but was not consulted on site #7 since it was thought that new markings were not being created, but instead existing markings were only being darkened. Site #7 was treated incorrectly.
On day three, site #7 was again treated incorrectly, this time on a third machine by different therapists than on days one and two.
On day four of treatment, one of the original day one therapists was treating the patient and he/she noticed the site #7 skin markings were incorrect. The patient was re-marked and two additional fractions were added to make up for the two incorrect treatments.
CLARITY PSO © 2017 ALL RIGHTS RESERVED. | 4
ANALYSIS & COMMENTARY | continued
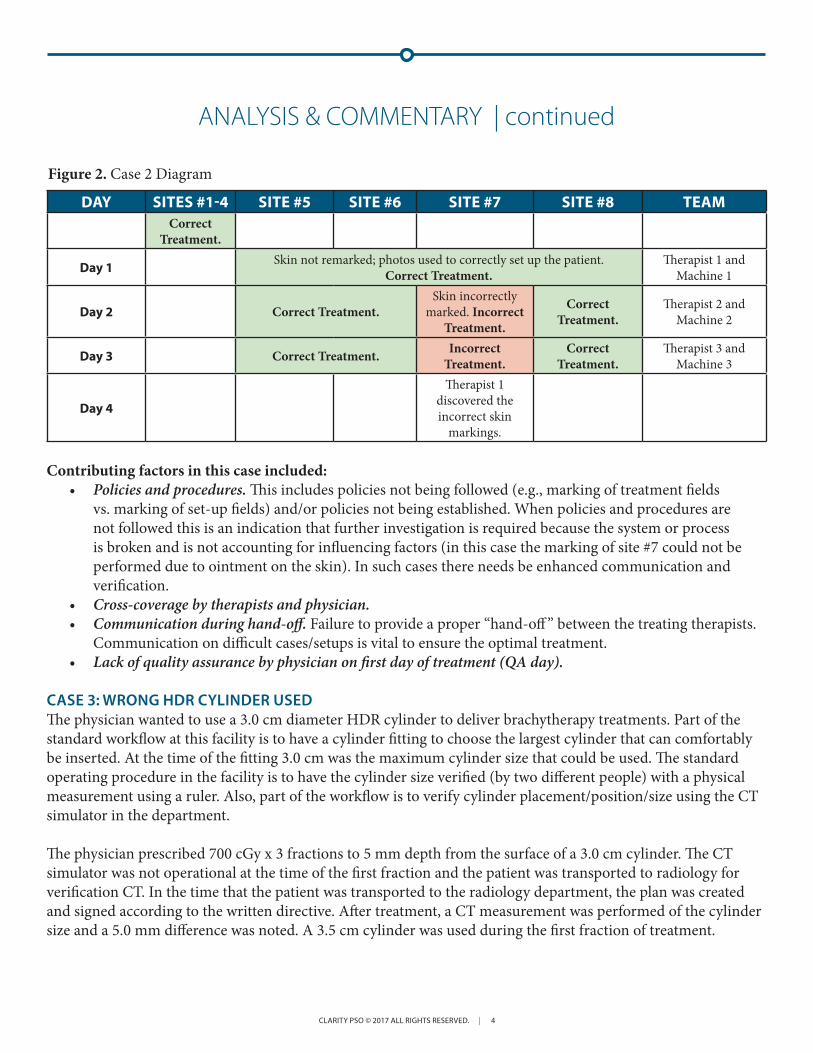
DAY SITES #1-4 SITE #5 SITE #6 SITE #7 SITE #8 TEAMCorrect
Treatment.
Day 1 Skin not remarked; photos used to correctly set up the patient. Correct Treatment.
Therapist 1 and Machine 1
Day 2 Correct Treatment.Skin incorrectly
marked. Incorrect Treatment.
Correct Treatment.
Therapist 2 and Machine 2
Day 3 Correct Treatment. Incorrect Treatment.
Correct Treatment.
Therapist 3 and Machine 3
Day 4
Therapist 1 discovered the incorrect skin
markings.
Contributing factors in this case included:• Policies and procedures. This includes policies not being followed (e.g., marking of treatment fields
vs. marking of set-up fields) and/or policies not being established. When policies and procedures are not followed this is an indication that further investigation is required because the system or process is broken and is not accounting for influencing factors (in this case the marking of site #7 could not be performed due to ointment on the skin). In such cases there needs be enhanced communication and verification.
• Cross-coverage by therapists and physician.• Communication during hand-off. Failure to provide a proper “hand-off ” between the treating therapists.
Communication on difficult cases/setups is vital to ensure the optimal treatment.• Lack of quality assurance by physician on first day of treatment (QA day).
CASE 3: WRONG HDR CYLINDER USEDThe physician wanted to use a 3.0 cm diameter HDR cylinder to deliver brachytherapy treatments. Part of the standard workflow at this facility is to have a cylinder fitting to choose the largest cylinder that can comfortably be inserted. At the time of the fitting 3.0 cm was the maximum cylinder size that could be used. The standard operating procedure in the facility is to have the cylinder size verified (by two different people) with a physical measurement using a ruler. Also, part of the workflow is to verify cylinder placement/position/size using the CT simulator in the department.
The physician prescribed 700 cGy x 3 fractions to 5 mm depth from the surface of a 3.0 cm cylinder. The CT simulator was not operational at the time of the first fraction and the patient was transported to radiology for verification CT. In the time that the patient was transported to the radiology department, the plan was created and signed according to the written directive. After treatment, a CT measurement was performed of the cylinder size and a 5.0 mm difference was noted. A 3.5 cm cylinder was used during the first fraction of treatment.
Figure 2. Case 2 Diagram

CLARITY PSO © 2017 ALL RIGHTS RESERVED. | 5
ANALYSIS & COMMENTARY | continued
Contributing factors in this case included:• Policies and procedures. This includes the possibility that policies were not followed (e.g. verification of
devices by more than one person) and/or policies not being established.• Deviating from standard operating procedures. The untimely inoperability of the CT simulator led to an
alternative workflow that may have contributed to this error.
ACTIONS AND RECOMMENDATIONS FOR ERRORS AT THE TIME OF TREATMENT:• Establish clear policies and procedures for each clinical workflow and determine the desired hand-off
procedure for each of those workflows. When a particular policy or procedure cannot be followed, there should be a verification mechanism (e.g., supervisory sign-off and/or checklist for communication).
• Ensure that policies and procedures are followed. This may take the form of an audit or observing the system. Staff will need to be trained on the policies, competence determined, and be accountable for following the policies in their daily work.
• When policies are not functioning as intended, first ask ‘why’ not ‘who’. Often the failure of a policy highlights a broken system or process. Take the time to examine underlying factors and root causes influencing this outcome.
• Perform formal time-outs. This was also highlighted in the Q3 2015 RO-ILS Report. For additional information, please refer to this previous quarterly report.
• Create a non-punitive safety culture where staff are encouraged to raise questions when something seems out of the norm. This open dialogue between various professionals will enhance further communication and discussion among the treatment team as well as expose areas where additional education may be needed.
FEATURED THEME II: CONTRIBUTING FACTORS TO ERRORSThere are several common contributing factors to errors that are seen in many events reported to RO-ILS, as well as in the case studies outlined above. These include gaps in policies and procedures and failures in human performance. At an even deeper level, these factors are themselves profoundly influenced by other underlying causal factors. In “Human error: Models and management”, James Reason points out that the systems approach to errors is about investigating these environmental factors that impact human performance (Reason 2000). Similarly, Lean Six Sigma methodology emphasizes that people are not the deep, underlying reasons for system failure. Instead, it is almost always the person who is simply trying to make the system work, and errors are the byproducts of system failure. The Swiss Cheese Model of System Accidents provides a key visual for these concepts (Reason 2000). Preventing errors requires system defenses and these defenses can be technology, people, procedures, etc. The defenses are similar to slices of Swiss cheese and the holes are the system’s active failures and latent conditions (Reason 2000). In order to prevent errors, Reason puts it best, we must create “systems that are better able to tolerate the occurrence of errors and contain their damaging effects” (Reason 2000). This means the focus of error evaluation has to change from the person approach to the systems approach.
In order to begin this shift, this Featured Theme II section will discuss vital components of the overarching philosophy of safety culture. These components are some of the foundational elements of the system. These components need to constantly be evaluated within the context of the institution because they are the beginning and perpetuating force of an error, but they are also a vital defense against errors. Here we highlight a few of these foundational common causal factors, namely: safety culture, communication and teamwork, human factors engineering, and time pressures.

CLARITY PSO © 2017 ALL RIGHTS RESERVED. | 6
ANALYSIS & COMMENTARY | continued
INSTITUTIONAL CULTURETypically, culture is not the first casual factor that comes to mind when examining the progression of an event. Yet, it is one of the most important drivers of error. Culture underlies, influences, and ultimately determines how we practice, both individually and as a team, to provide safe, high quality care to our patients. One of the most basic dictionary definitions of culture is “the set of shared attitudes, values, goals, and practices that characterizes an institution or organization” (Merriam-Webster n.d.).
The Agency for Healthcare Research and Quality (AHRQ) has done a great deal of work around institutional culture and its impact on patient safety. Below is AHRQ’s list of key features of a culture of safety:
• “Acknowledgment of the high-risk nature of an organization’s activities and the determination to achieve consistently safe operations
• A blame-free environment where individuals are able to report errors or near misses without fear of reprimand or punishment
• Encouragement of collaboration across ranks and disciplines to seek solutions to patient safety problems
• Organizational commitment of resources to address safety concerns” (AHRQ 2016).
Safety culture is a journey, it is not a destination. It requires persistence and determination. It is vital to develop and continuously cultivate:
• A culture of safety, where it is acceptable and encouraged to talk about mistakes and errors,• A culture of learning, where those mistakes and errors are distilled into learnings to prevent future
incidents and the question ‘who did it’ is replaced by ‘what happened’ and ‘how do we prevent it’,• And a culture of justice, where everyone within the organization holds each other to maintaining and
fostering this culture as well as being accountable for building fail-safe processes to protect patients (Dekker 2012, 2014).
Within this definition of culture, how would leadership characterize the culture of your organization and your department? How would frontline staff characterize the culture? How well does your organization understand and practice these key safety culture features at all levels within the organization?
Recommendations: Culture of SafetyThe following are several recommendations to begin moving your team along the safety culture journey.
1. Formulate a statement from the department leadership defining safety culture and highlighting its importance. This might come in the form of a written statement or as a discussion at one (or more) meetings.
2. Assess your organization and/or departments’ cultures through the implementation of a culture of safety survey. While there are various culture of safety surveys available, consider the AHRQ Culture of Safety Survey and AAPM’s Safety Profile Assessment, (see below).

CLARITY PSO © 2017 ALL RIGHTS RESERVED. | 7
ANALYSIS & COMMENTARY | continued
3. Make the results clear and easily accessible to every employee throughout the organization.4. Discuss and show your plans of action for improvements of the culture.5. Engaging in incident learning is, itself, a way to improve culture as shown in several recent studies. A
key component of this is providing feedback and a structured learning environment in which cases are reviewed and issues are addressed. This might take the form of departmental safety meetings.
Resources• Joint Commission 11 Tenet’s of a Safety Culture• AHRQ Culture of Safety Survey• AAPM Safety Profile Assessment• Patient Safety and the “Just Culture”• Institute for Healthcare Improvement’s (IHI) Develop a Culture of Safety• IHI Conduct Patient Safety Leadership WalkRounds• IHI Conduct Safety Briefings • IHI Create an Adverse Response Team• Joint Commission Patient Safety Initiative
COMMUNICATION AND TEAMWORKIn 2015, the Joint Commission released Sentinel Event statistics related to patient safety. In that report they disclosed the most frequently identified root causes for Sentinel Events. The top three root causes were human factors, leadership, and communication, respectively (Joint Commission 2015). The delivery of treatment for patients requires a complex web of interactions between care providers. This requires a tremendous amount of communication and teamwork skills. Often, clinicians and staff, are not aware of how critical the format of a message is to securing good communication. There are a multitude of communication tools and formats available to assist in ensuring a message results in the correct intentions. Yet the knowledge of when to implement which tool is equally important towards securing good communication. Several different communication formats include:
• Briefing. The intent of briefing is to provide an overview of what is to come or the future plan to clinician(s) or staff member(s). This provides the team with expectations and allows them to plan accordingly.
• Handoff. This communication method provides a snapshot as to what is currently going on with the patient. This provides a structure when care of a patient is “handed” over to another provider or staff member.
• Debriefing. The intent of debriefing is to allow the team to discuss what happened after any type of occurrence, whether positive or negative. Debriefing allows for learning and safety improvement.
• Closed Loop Communication. This communication method assists in assuring that the message has been transferred, the intended recipients have heard the message, and that they understand the message. This is a vital form of communication in emergency situations where confusion, distractions, and large amounts of stimuli are overwhelming and yet precise action must be taken.
• Situation-Background-Assessment-Recommendations (SBAR). This communication format provides an outline to assist team members in organizing the necessary information into a clear picture so that the message is accurately passed on to the recipient.

CLARITY PSO © 2017 ALL RIGHTS RESERVED. | 8
ANALYSIS & COMMENTARY | continued
The original intention of SBAR was to facilitate a quick explanation between a nurse and physician (or anyone) of what was happening to a patient in a particular moment and to then immediately implement appropriate interventions (Institute for Healthcare Improvement [IHI] 2016). It is meant as a way to frame routine or sometimes critical conversations and ensure that both the receiver and giver of information are clear on the patient’s current status and the interventions needed.
How and when does your organization perform briefings, handoffs, debriefs, closed loop communication and SBAR? How is it ensured that the correct information is communicated and received by the correct person within your organization?
Has anyone in your department received formal training on communication? AHRQ’s “TeamSTEPPS® program is an evidence-based set of teamwork tools, aimed at optimizing patient outcomes by improving communication and teamwork skills among health care professionals” (ARHQ 2017).
Recommendations:1. Identify champions within the department to become certified in AHRQ’s TeamSTEPPS®. Then have
these champions educate the department on TeamSTEPPS® principles. 2. Analyze your organization’s incident reports that identify communication and/or teamwork as causal
factors. Bring that data and analysis to staff and have a discussion about the communication barriers and challenges experienced.
3. Perform Failure Mode and Effects Analysis (FMEA) on various workflows and focus on effects of inadequate communication. How does the process breakdown and what are the consequences of that failure?
Resources:• Joint Commission Patient Safety Sentinel Event statistics• AHRQ’s Comprehensive Unit-based Safety Program (CUSP) toolkit• AHRQ on Teamwork Training• AHRQ’s TeamSTEPPS® • AHRQ’s TeamSTEPPS® Readiness Assessment • IHI: SBAR Technique for Communication-A Situational Briefing Model: a short explanation on SBAR
with SBAR guidelines and a worksheet.

CLARITY PSO © 2017 ALL RIGHTS RESERVED. | 9
HUMAN FACTORS ENGINEERINGIHI’s definition of human factors is “the study of all the factors that make it easier to do the work in the right way” (IHI n.d.). Human factors is vital to the successful delivery of patient care. The National Academies of Science, Engineering, and Medicine (previously Institute of Medicine) 1999 report tells us just how important is within the first four words of its title: To Err is Human! As humans we are fallible, we cannot expect perfection because we simply cannot attain perfection. Competing priorities as well as internal and external pressures make that even more impossible. The integration of human factors design principles needs to occur within every single step of every single process and task we perform. Consider the following human factors design principles by IHI:
• “Simplify. Simplifying involves taking steps out of a process.• Standardize. Standardizing removes variation and confusion, and promotes predictability and
consistency. • Use forcing functions and constraints. Forcing functions make it impossible to do a task incorrectly. They
create a hard stop that you cannot pass unless you change your actions. A constraint is the state of being checked, restricted, or compelled to avoid or perform some action.
• Use redundancies. A typical example is double-checking someone’s work. • Avoid reliance on memory. Checklists are a valuable tool to reduce this reliance. • Take advantage of habits and patterns. Habits are those actions we perform in consistent circumstances
and are triggered by our surroundings. A pattern is a recognizable regularity in events. • Promote effective team functioning. Teamwork and communication are promoted in many industries. • Automate carefully. Technology can sometimes – but not always – be helpful. (IHI n.d.)”
Recommendations:1. Educate staff and providers on human factors and its integral role in understanding errors.2. Identify champions and/or leaders within your organization, and within each department, to lead the
effort of integrating human factors principles into your organization’s practice. Train these individuals on AHRQ’s TeamSTEPPS®.
3. Use your identified champions to create, initiate, and sustain teamwork principles and a culture of safety throughout your organization.
Resources:• IHI Human Factors Exercise• AHRQ Human Factors Engineering• IHI Human Factors Summary
ANALYSIS & COMMENTARY | continued

CLARITY PSO © 2017 ALL RIGHTS RESERVED. | 10
TIME PRESSURESA common causal factor in errors reported to the RO-ILS system is time pressure, which can interact and amplify all the other contributing factors to errors. For example, communications which are otherwise effective may start to break down when staff are under increased time pressure to complete work.
Recommendations:1. Collect data on the number of near misses reported as a result of staff rushing to complete a treatment or
treatment plan. Use this data to show what “could have” happened if a good catch had not occurred.2. As stated in the “No Fly Safety Culture” presentation, there is a need to create a culture shift from ‘just in
time’ to ‘cancel if not ready’ within your organization (Kapur 2012).3. Leadership support is necessary to enforce a stopping point if a treatment plan is rushed through the
system in an unsafe manner.
Resources:• No Fly Safety Culture
ANALYSIS & COMMENTARY | continued

CLARITY PSO © 2017 ALL RIGHTS RESERVED. | 11
ANALYSIS & COMMENTARY | continued
REFERENCE LIST
1. Reason J. Human error: Models and management. BMJ. 2000;320, 768-770. https://www.ncbi.nlm.nih.gov/pmc/articles/PMC1117770/pdf/768.pdf
2. Culture. Merriam-Webster.com. n.d. https://www.merriam-webster.com/dictionary/culture.
3. Agency for Healthcare Research and Quality. Safety culture. 2016. https://psnet.ahrq.gov/primers/primer/5/safety-culture.
4. Dekker S. Just Culture: Balancing Safety and Accountability. Burlington, VT: Ashgate; 2012.
5. Dekker S. The Field Guide to Understanding Human Error. Burlington, VT: Ashgate; 2014.
6. Joint Commission. Patient safety. 2015. http://www.jointcommission.org/assets/1/23/jconline_April_29_15.pdf
7. Institute for Healthcare Improvement. SBAR technique for communication: A situational briefing model. 2016. http://www.ihi.org/resources/Pages/Tools/SBARTechniqueforCommunicationASituationalBriefingModel.aspx
8. Agency for Healthcare Research and Quality. About TeamSTEPPS®. Content last reviewed April 2017. Agency for Healthcare Research and Quality, Rockville, MD. http://www.ahrq.gov/teamstepps/about-teamstepps/index.html
9. Institute for Healthcare Improvement. Patient safety 102: Human factors and safety summary sheet. n.d. http://www.ihi.org/education/ihiopenschool/Courses/Documents/SummaryDocuments/PS%20102%20SummaryFINAL.pdf.
10. Kapur A. No fly safety culture: Implementation, challenges and outcomes. 2012. http://chapter.aapm.org/delvalley/Kapur_Ajay_No_Fly.04.20.2012.pdf

CLARITY PSO © 2017 ALL RIGHTS RESERVED. | 12
AGGREGATE ANALYSIS GRAPHS

CLARITY PSO © 2017 ALL RIGHTS RESERVED. | 13
AGGREGATE ANALYSIS GRAPHS | continued

CLARITY PSO © 2017 ALL RIGHTS RESERVED. | 14
AGGREGATE ANALYSIS GRAPHS | continued
CLARITY PSO © 2017 ALL RIGHTS RESERVED. | 15
AGGREGATE ANALYSIS GRAPHS | continued

CLARITY PSO © 2017 ALL RIGHTS RESERVED. | 16
AGGREGATE ANALYSIS GRAPHS | continued

CLARITY PSO © 2017 ALL RIGHTS RESERVED. | 17
AGGREGATE ANALYSIS GRAPHS | continued

CLARITY PSO © 2017 ALL RIGHTS RESERVED. | 18
AGGREGATE ANALYSIS GRAPHS | continued

CLARITY PSO © 2017 ALL RIGHTS RESERVED. | 19
AGGREGATE ANALYSIS GRAPHS | continued

CLARITY PSO © 2017 ALL RIGHTS RESERVED. | 20
AGGREGATE ANALYSIS GRAPHS | continued