quarterly report fiscal year 2011-2012 1st quarter 1st... · quarterly report fiscal year 2011-2012...
TRANSCRIPT

City of Chandler
Economic Development Division
Quarterly Report Fiscal Year 2011-2012 1st Quarter

INDEX
Table of Contents
INTRODUCTION .............................................................................................. 3
ECONOMIC DEVELOPMENT OUTLOOK .................................................... 5
ECONOMIC TRENDS ..................................................................................... 7
RETAIL ............................................................................................................. 9
INDUSTRIAL/OFFICE DEVELOPMENT ....................................................... 12
TOURISM ........................................................................................................ 16
DOWNTOWN ................................................................................................. 19
Economic Development Division July 1, 2012 2

INTRODUCTION
Economic development activity continued on a positive trend during the first quarter. For the quarter ending September 30, 2011, Economic Development staff combined efforts identified 2,109 leads and 18 prospects, representing an estimated 423 jobs, occupying approximately 151,045 square feet of space and $2.8 million in capital investments.
1st Quarter Combined Efforts
Retail Industrial/Office Tourism Total Leads 14 41 2,054 2,109 Prospects 9 9
18
Jobs 200 223
423 Square Footage 99,866 51,179
151,045
Capital Investment
$2,816,000
$2,816,000
Retail: During the first quarter, Economic Development Retail staff continues to work with developers, brokers, and shopping center owners on major retail developments while tracking all existing retail centers and tenants, including those projects under construction or planned. Staff continues to work with clients by keeping track of when the construction permits are reviewed and issued.
For Q1, Retail staff participated in the following activities:
Activity Location Date ICSC Western Division Conference Sales Mission
San Diego, CA September 7-9, 2011
Industrial/Office: During the first quarter, Industrial and Office staff attended several sales missions and prospecting trips to market Chandler’s message to a broader audience and provide insight into existing development opportunities in the City of Chandler. Sales missions, trade shows, and prospecting trips provide staff with the chance to discern the type of data and resources the brokerage and development community needs, thereby facilitating the attraction of quality stores, restaurants, companies, and recreational opportunities to Chandler.
For Q1, Industrial/Office staff participated in the following activities:
Activity Location Date GPEC Sales Mission Irvine, CA August 27, 2011
Economic Development Division July 1, 2012 3

INTRODUCTION
Tourism: Tourism staff conducted the following trade and media activities for Q1:
Activity Location Date Governor’s Conference on Tourism Scottsdale, AZ July 13-15, 2011 ASU Welcome Zone Tempe, AZ August 13-15, 2011 Vancouver Media Marketplace Vancouver, BC August 16-17, 2011 Annual City Hotelier Tour Chandler, AZ August 24, 2011 Travel Media Showcase Oklahoma City, OK September 20-23, 2011
In addition to trade and media activities and travel, staff operates the City of Chandler Local Bites; a unique list of restaurants that supports Chandler’s one-of-a-kind dining experiences whether they are independently owned or extraordinarily unique in the market.
Downtown: Economic Development Downtown Redevelopment staff continues to work with the merchants to collaborate in advertising and promoting business in Downtown Chandler. Staff coordinated efforts with the Downtown Chandler Community Partnership (DCCP), Arts Commission, Façade Grants, Site 8 Parking, Urban Gardening and various Special Events.
Disclaimer: Content is intended to provide general information to the public and every effort has been taken to ensure that the information is accurate. Data is submitted subject to the possibility of errors, omissions and changes, but is obtained from sources and/or formulas deemed reliable.
Economic Development Division July 1, 2012 4

ECONOMIC DEVELOPMENT OUTLOOK
Economic Development focus is essential to the City of Chandler’s estimated population of 238,041 citizens and approximated 95,172 housing units located in the City’s borders as of September 1, 2011. Locating and expanding quality industrial, commercial, retail, and small business opportunities throughout the City of Chandler and Downtown Chandler are of great importance to Chandler’s future economic impact. Economic Development personnel continually update economic data, and demographic and development trends to maintain current information to better assist clients with their search for potential development opportunities. The information also aids Economic Development staff in identifying areas of opportunity and specific gaps, in targeting retail markets and linkages to key census information, which assists in presenting available sites.
Economic Development Division July 1, 2012 5
200
223
180
195
210
225
Q1
Jobs Created FY 11-12
Retail Jobs
Industrial/Office Jobs
99,866
51,179
0
20,000
40,000
60,000
80,000
100,000
120,000
Q1
Square Footage FY 11-12
Retail S.F.
Industrial/Office S.F.
ECONOMIC DEVELOPMENT OUTLOOK
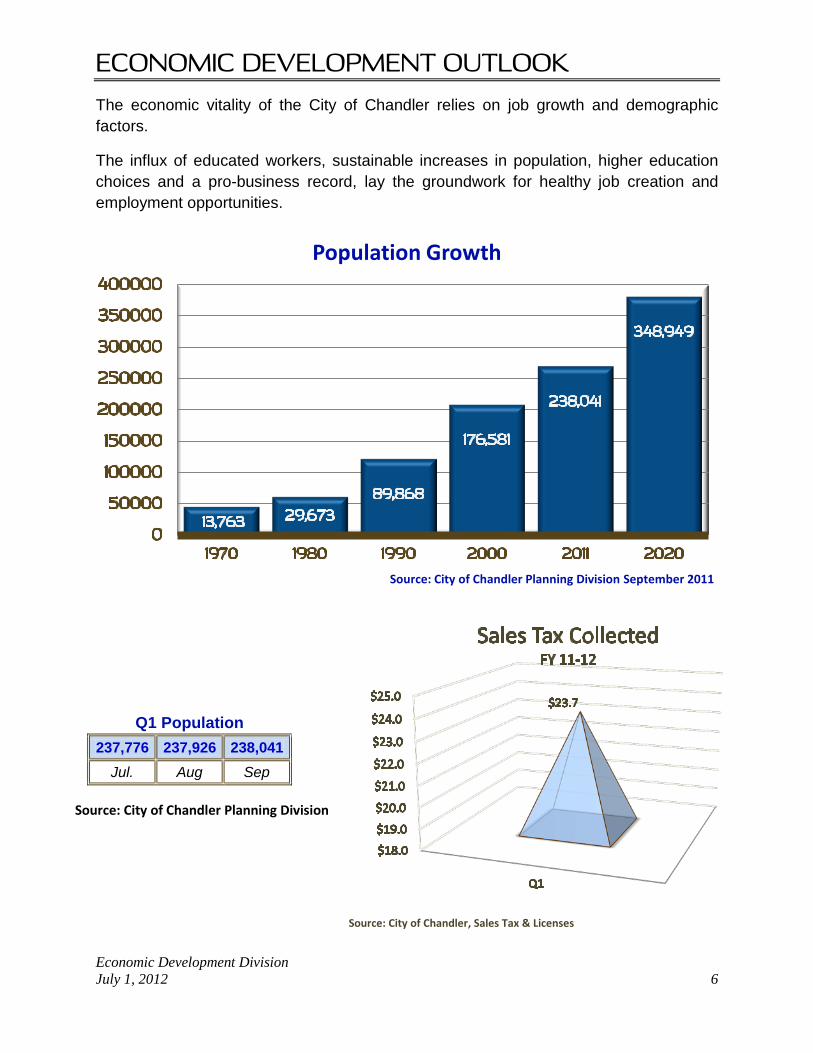
The economic vitality of the City of Chandler relies on job growth and demographic factors.
The influx of educated workers, sustainable increases in population, higher education choices and a pro-business record, lay the groundwork for healthy job creation and employment opportunities.
Q1 Population 237,776 237,926 238,041
Jul. Aug Sep
Source: City of Chandler Planning Division
Economic Development Division July 1, 2012 6
Source: City of Chandler Planning Division September 2011
Population Growth
Source: City of Chandler, Sales Tax & Licenses

ECONOMIC TRENDS
According to the Arizona Department of Commerce, by the end of Q1, the City of Chandler’s average unemployment rate is 7.2%, while the City of Phoenix has a 9.1% unemployment rate and the state of Arizona has a 9.8% unemployment rate.
July Aug Sep
Q1
1st Quarter Unemployment Rate FY 11-12
Arizona
Phoenix
Chandler
Source: Arizona Department of Commerce
FY 11-12
Source: Arizona Department of Commerce
Employment by Occupation Data identifies and analyzes total employee counts per establishment within various industries.
Economic Development Division July 1, 2012 7
Employment By Occupation FY 11-12
Service Occupation
Farming, Forestry and Fishing
Managerial and Professional Service
Production, Transport, Material Moving
Technical Sales-Administrative Support
Construction, Extraction, Maintenance
Source: Claritas

ECONOMIC TRENDS
During the first quarter, the number of employed citizens reflects a slight decrease for the City of Chandler. Acoording to the Arizona Department of Commerce, in this quarter, the City of Chandler lossed an average 735 jobs to its 122,047 total from the previous quarter; a 0.60% decrease.
Source: Arizona Department of Commerce
Source: Arizona Department of Commerce
121,512
121,817
122,812
2,720,808
2,728,413
2,749,336
5,000 50,000 500,000 5,000,000
Jul
Aug
Sep
Q1
Employment Comparison: Chandler vs. Arizona
FY 11-12
Arizona
Economic Development Division July 1, 2012 8

RETAIL
Economic Development Retail staff located nine new companies that included a restaurant, grocery/food concept, gas station, and specialty retail to the City of Chandler.
Specific Q1 Retail Activities:
1. Culver’s In 1984 Craig and Lea Culver, along with Craig’s parents George and Ruth, opened the very first Culver’s in the family’s beloved hometown of Sauk City, Wisconsin. The restaurant is a combination of Craig’s love for his mom’s homemade hamburgers and his favorite childhood vacation treat of fresh frozen custard. As a result, creating Culver’s signature combination of Culver’s Butter Burgers and Fresh Frozen Custard became reality.
2. Arco AM/PM Arco AM/PM heritage and history is now a part of the American traveler’s landscape. Since the early 1970s, Arco found ways to operate efficiently with a firm focus on low-price objective and a commitment to offer good quality gasoline. Arco has more than 1,300 ARCO-branded sites currently operating in five western states: California, Nevada, Oregon, Washington and Arizona.
3. Wendy’s From day one, when Dave Thomas opened the first Wendy's restaurant in 1969, he opened the door to a new gold standard in quality food and fresh ingredients offered at every Wendy’s.
4. MVP Zone MVP Zone is owned by married couple Amber and Ron Eccleston. It offers more than 8,500 square feet, 100% climate controlled space for indoor
Q 1
Retail Leads & Prospects FY 11-12
Prospects
Leads
Economic Development Division July 1, 2012 9

RETAIL
recreation. It includes: six baseball/softball tunnels, two different types of pitching machines, jugs sting-free balls or leather balls, 70’ pitching/catching tunnels with mounds and screens, soft toss/drill stations, retractable nets and conference rooms for teams, league boards and trainers.
5. The Sushi Room The Sushi Room is a posh new eatery with a crescent-shape sushi bar in the center and garage doors leading to the patio. The Sushi Room menu carries traditional sashimi and rolls, but with a European influence. For people whose palate might not include sushi or those with dietary restrictions, the Sushi Room offers a variety of non-sushi items such as steak and salmon, vegetarian options and a kid's menu. The restaurant also features a full bar that includes beer, wine and spirits.
6. Uno Stop Laundromat Uno Stop Laundromat, is a laundromat that offers friendly staff to help you, along with a wide selection of washer and dryer machines, with deep basin sinks for hand-washing items, vending machines with all the laundry supplies you could need, vending machines for refreshments, and movies playing all around the place.
7. Hobby Lobby Hobby Lobby began operations August 3, 1972, with 300 square feet of retail space in North Oklahoma City. Over the years, this modest beginning has grown into 514 stores operating in 41 states. Hobby Lobby has departments ranging from crafts, hobbies, picture framing, jewelry making, fashion fabrics, floral, cards & party, baskets, wearable art, home accents, and holiday supplies.
8. Freddy’s Frozen Custard Freddy’s Frozen Custard all started with a main course back in the 1950’s in Wichita, Kansas, home to WWII Veteran Freddy Simon. Two of Freddy’s sons, Randy and Bill, and accomplished restaurateur, Scott Redler, worked tirelessly to recreate the recipe that lived up to the timeless standards of their father's generation. Today, Freddy’s Frozen Custard sandwiches and sundaes are made after the order is placed.
9. Jimmy John’s Jimmy John’s began in 1983 in Charleston, IL by a 19-year-old with two first names Jimmy John Liautaud. The menu began with four sandwiches, which were tested on friends and family. The first Jimmy John’s began with $200 a month rent and used equipment consisting of a refrigerator, a chest freezer, an oven, and a meat slicer. Jimmy John's has grown up over the last few
Economic Development Division July 1, 2012 10

RETAIL
decades; currently there are over 1,200 stores open. All sub sandwiches are 8 inches of homemade french bread, fresh veggies, cheese and meats.
Staff efforts in this quarter produced 200 new jobs and occupied 95,866 square feet of retail in the City of Chandler.
Reta
il
NAME LOCATION JOBS S.F. 1st Quarter Locates
Culver's Loop 101 & Ray Road 20 3,000 Arco AM/PM Arizona Ave & Chandler Blvd 5 3,000 Wendy's Arizona Ave & Ocotillo Rd 10 4,000 MVP Zone Gilbert Rd & Germann Rd 2 15,000 The Sushi Room Dobson Rd & Queen Creek Rd 10 2,231 Uno Stop Laundromat Arizona Ave & Galveston Rd 2 6,400 Hobby Lobby Loop 101 & Chandler Blvd 120 55,175 Freddy's Frozen Custard Loop 101 & Frye Rd 7 4,098 Jimmy Johns Loop 101 & Chandler Blvd 20 2,200
200
Q1
Retail Total Jobs Created FY 11-12
Economic Development Division July 1, 2012 11
99,866
Q1
Retail Total Square Feet FY 11-12
INDUSTRIAL & OFFICE
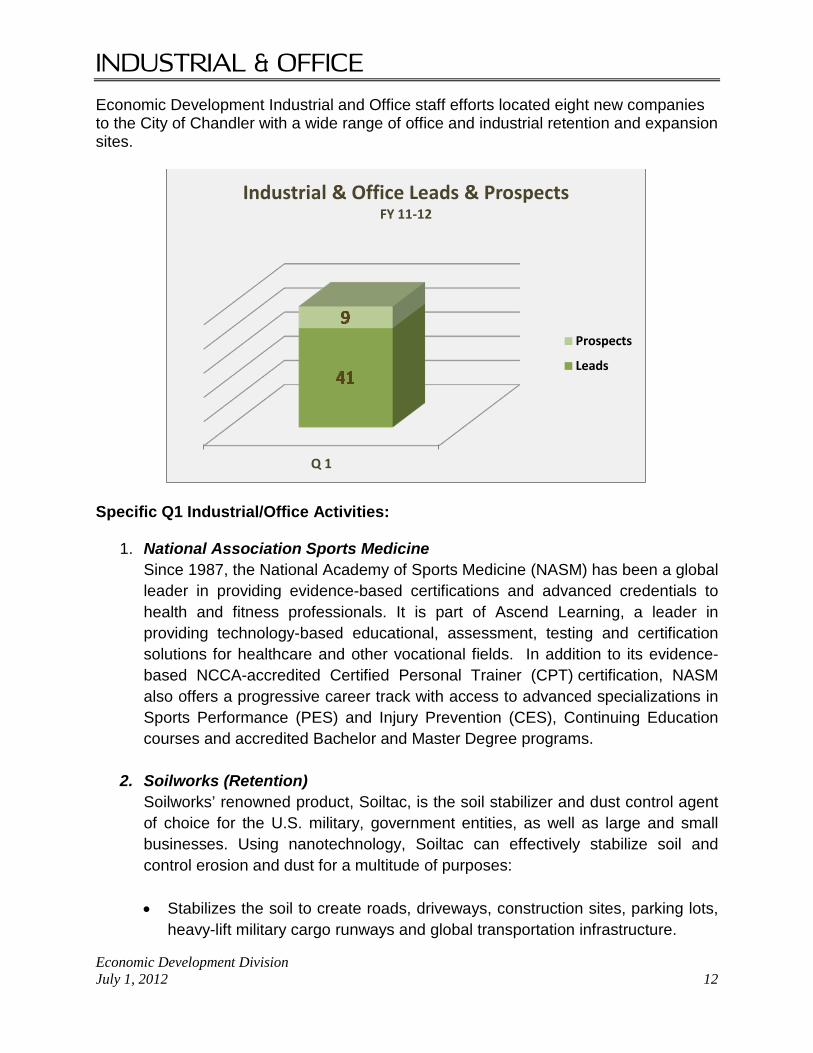
Economic Development Industrial and Office staff efforts located eight new companies to the City of Chandler with a wide range of office and industrial retention and expansion sites.
Specific Q1 Industrial/Office Activities:
1. National Association Sports Medicine Since 1987, the National Academy of Sports Medicine (NASM) has been a global leader in providing evidence-based certifications and advanced credentials to health and fitness professionals. It is part of Ascend Learning, a leader in providing technology-based educational, assessment, testing and certification solutions for healthcare and other vocational fields. In addition to its evidence-based NCCA-accredited Certified Personal Trainer (CPT) certification, NASM also offers a progressive career track with access to advanced specializations in Sports Performance (PES) and Injury Prevention (CES), Continuing Education courses and accredited Bachelor and Master Degree programs.
2. Soilworks (Retention) Soilworks’ renowned product, Soiltac, is the soil stabilizer and dust control agent of choice for the U.S. military, government entities, as well as large and small businesses. Using nanotechnology, Soiltac can effectively stabilize soil and control erosion and dust for a multitude of purposes: • Stabilizes the soil to create roads, driveways, construction sites, parking lots,
heavy-lift military cargo runways and global transportation infrastructure.
Q 1
Industrial & Office Leads & Prospects FY 11-12
Prospects
Leads
Economic Development Division July 1, 2012 12

INDUSTRIAL & OFFICE
• Control dust for storage & stockpile sites, power plants, existing roads and surfaces, racetracks, horse arenas, outdoor entertainment events and other facilities.
• Control soil erosion for existing roads and road shoulders, trails and recreation paths, golf course bunkers, land development, hydroseeding, landfill slopes and more.
3. Levementum
Levementum aggressively leverages open source technology to implement world-class demand chain strategies. Through a proven and committed ecosystem of alliance partners, Levementum is empowered to deliver world-class results for their clients. This strategic ecosystem provides an unbeatable array of technologies that are well matched to complement the tools Levementum has developed and mastered over the years. SugarCRM, Magento, OpenERP, Mindtouch, along with other select world-class solutions comprise the technology tools at Levementum’s disposal.
4. Dunkin Donuts
Dunkin Donuts is one of America’s favorite every day, all day stops for coffee, baked goods and much more.
5. Serious Integrated
Serious Integrated is a privately held corporation specializing in enabling Original Equipment Manufacturers (OEMs), Electronics Design Firms and hobbyists to add graphic/touch front panels to their products. Products include off-the-shelf front panel modules as well as a complete software and tools environment for developing and deploying user interfaces in mere hours.
6. Amkor
Amkor is one of the world’s largest providers of contract semiconductor assembly and test services. Founded in 1968, Amkor pioneered the outsourcing of IC assembly and testing and is now a strategic manufacturing partner for more than 200 of the world’s leading semiconductor companies and electronics OEMs. Amkor’s operational base production facilities, product development centers and sales & support offices are located in key electronics manufacturing regions in Asia, Europe and the United States. As part of Innovations Science and Technology Incubator, Amkor’s early stage discovery team provides an anchor opportunity for the facility.
Economic Development Division July 1, 2012 13

INDUSTRIAL & OFFICE
7. BCR Diagnostics BCR Diagnostics has constructed bacterial spores with engineered self-reporting functionality―termed F-spores™. The F-spores™ can be used for high sensitivity diagnostic tests and for rapid sterility testing at healthcare facilities. The company has been awarded four U.S. patents and corresponding worldwide patents covering broad-based detection technology and kits using microorganisms as nanosensors. Additional U.S. and foreign patent applications have been filed for further protection of the company’s novel intellectual property.
8. NavitasMax
NavitasMax is an Arizona-based renewable energy business that has created a new frontier in grid-scale energy storage. This proprietary technology will revolutionize the way we harness, store and utilize energy from the wind and the sun. The NAVITASMAX, LLC technology vision was inspired by observations in art, nature and science. The environmentally friendly technology will provide smart grid and renewable systems the essential scalable cost-effective storage flexibility that is not available from batteries or other current devices. Their novel solution will address the substantial market and technology gaps for energy storage in excess of 10 MW and discharge times of greater than one hour. This represents a new, grossly underserved total available domestic market of approximately $4 billion/year. The development team includes world-renowned renewable energy experts from diverse scientific fields.
9. Toyko Electron (Retention)
Toyko Electron is a leading global supplier of semiconductor production equipment. Tokyo Electron Limited (TEL) engages in development, manufacturing, and sales in a wide range of product fields. The company also leverages specialized technologies developed for the semiconductor production equipment market to engage in the area of flat panel display (FPD) production equipment. All of TEL's semiconductor and FPD production equipment product lines maintain high market shares in their respective global segments.
Staff efforts in this quarter produced 223 new jobs and occupied 51,179 square feet of industrial and office space, in addition to a projected capital investment of $2,816,000.
Economic Development Division July 1, 2012 14

INDUSTRIAL & OFFICE
Indu
stria
l/O
ffice
NAME LOCATION JOBS S.F. CAPITAL
INVESTMENT 1st Quarter Locates
National Association (Sports Medicine) Cooper Rd. & 202 Freeway 40 14,300 $715,000
Soilworks (Retention) Cooper Rd. & 202 Freeway 53 10,708 $525,000 Levementum (Expansion) Arizona Ave. & Chandler Blvd. 40 10,500 $375,500 Dunkin Donuts (Commercial) McClintock Dr. & Chandler Blvd. 30 500 $900,500 Serious Integrated McClintock Dr. & Chandler Blvd. 4 500 $0 Amkor McClintock Dr. & Chandler Blvd. 15 2,500 $0 BCR Diagnostics McClintock Dr. & Chandler Blvd. 5 1,014 $0 NativasMax McClintock Dr. & Chandler Blvd. 1 125 $0 Toyko Electron (Retention) Chandler Blvd & Galveston St. 35 11,032 $300,000
Q1
$2,516,000
Capital Investment FY 11-12
51,179
Q10
10,000
20,000
30,000
40,000
50,000
60,000
Industrial/Office Total Sqare Feet
FY 11-12
Economic Development Division July 1, 2012 15
223
Q10
50
100
150
200
250
Industrial/Office Total Jobs Created
FY 11-12

TOURISM
In the first quarter, Chandler experienced a significant gain in hotel occupancy, 24.9% higher than the same quarter in 2010 as compared to the state’s average increase of 4.4% year over year. Chandler’s Average Daily Rate (ADR) increased 1.9% as compared to the state of Arizona’s average ADR increase of 4.4%. However, Chandler’s revenue per available room greatly improved to $45.06, representing a 27.3% increase as compared to the state average of 9.0%.
The hotel industry in Metro-Phoenix Valley continues to struggle with ADR growth as many operators continue to offer price-conscious travelers low room rates as an incentive for booking, thereby trading occupancy at the expense of room rate. While year-to-date continued growth in the Valley’s hospitality industry is apparent, the Valley continues to lag behind the rest of the nation for ADR growth.
In Chandler, much of the substantial growth in hotel occupancy is attributed to the increased business travel prompted by the expansion of Intel - currently the world’s second largest private development.
Smith Travel Research, Inc. (STR) has developed the specific Q1 Chandler and metro Phoenix hotel industry occupancy, average daily rate (ADR), and revenue per available room (RevPar) as a custom set for the Chandler market that are represented in the charts below:
10.0%
30.0%
50.0%
70.0%
Q1 Q2
Chandler Hotel Occupancy Rate FY 11-12
Economic Development Division July 1, 2012 16

TOURISM
Metro Phoenix Comparison (FY 11-12)
Q1 Occupancy 58.4% Occupancy 48.3% Average Daily Rate $77.16 Chandler Average Daily Rate $81.79 Metro Phoenix Revenue per available room $45.06 Revenue per available room $39.49
10%
30%
50%
70%
90%
110%
Q1 Q2
$77.16 $88.61
Chandler Hotel ADR FY 11-12
10%
30%
50%
70%
90%
110%
Q1 Q2
$45.06 $55.90
Chandler Hotel RevPar FY 11-12
Economic Development Division July 1, 2012 17

TOURISM
Tourism staff also maintains the tourism website, www.visitchandler.com that is featured in each advertisement, brochure, and press release and utilized at trade shows. Staff works with the Chandler Local Bites website, which is a guide to unique and local Chandler eateries & drinks for residents looking for great places to eat or take visitors. Additional information can be obtained on the website, www.Chandlerlocalbites.com or at select locations, local restaurants, hotels, City facilities, and visitor’s bureaus.
Q1
Economic Development Division July 1, 2012 18
DOWNTOWN
The role of Downtown Redevelopment staff was significant, in the various projects, activities and events outlined below throughout the first quarter.
Specific Q1 Downtown Activities:
Awards and Presentations:
The City of Chandler Downtown Redevelopment efforts received the Arizona Planning Association Making Arizona Competive in the 21st Century (MAC21) award for the Arizona Avenue Area Plan and Improvements. Downtown Redevelopment staff, in conjunction with Transportation and Development Planning staff, were presenters at the Arizona Planning Association, providing insight on how to create and implement an Area Plan.
Façade Grants
Downtown Redevelopment staff reviewed three façade grant applications. Staff provided modifications and identified policy issues. City Management received a copy of the modifications and policy issues for further review and decision making.
Tenant Activities
Downtown Redevelopment staff spoke with eight potential tenants seeking retail, restaurant, or office space in the downtown area. In Q1, Downtown Redevelopment staff located one new tenant who opened for business.
• Simply Klassic Interiors is a complete home and decor retail store, offering items such as small gifts, jewelry, lighting, accessories, rugs, and large furniture pieces.
Downtown Updates
In Q1 Downtown Redevelopment staff managed the following downtown projects and provided the following updates:
• Trash - Trash pilot service continues. • EMSD - DCCP contract was executed and all documents provided to the
County Assessor. • Signage –
o Worked with DCCP on various proposals for the AZ Ave signage package.
o DCCP Executive Committee is finalizing their counterproposal. • ARTyard - RFP response reviewed and discussions opened with applicant.
Economic Development Division July 1, 2012 19
DOWNTOWN
• Maintenance Activities – o Completed all beam and joist repairs. o The Colonnade received a new reroof.
• Reuse of Blue Peacock - The construction to bring the building up to code brought about several options that were presented to City management for further review and direction.
• San Marcos Golf Resort - Continued working with firms doing due diligence related to the San Marcos Resort bankruptcy filing.
• NW Quadrant Analysis - Selected by Urban Land Institute to provide an expert advisory panel that will offer analysis to be used in developing a more detailed plan for the area outlined for future growth.
• Oregon Colonnade - Work on the Oregon Colonnade (SE corner of Boston and Oregon) began. The estimated completion time frame is scheduled for mid-to-late November, 2011.
• Website Revision - Staff continues to work on re-vamping Economic Development Downtown web pages.
Economic Development Division July 1, 2012 20