quarterly report of the dino polska s.a. group for q3...
TRANSCRIPT
Q3 2018 Report
Quarterly Report of the
Dino Polska S.A. Group
for Q3 2018

Q3 2018 Report
Page | 2 of 28
Dino Polska Spółka Akcyjna (“Dino”, “Company”, “parent company”) Joint stock company with its registered office in Krotoszyn at ul. Ostrowska 122, 63-700 Krotoszyn, entered in the register of businesses of the National Court Register under file number 0000408273. NIP no. 6211766191, REGON no. 300820828. The Company’s share capital as at 30 September 2018 was PLN 9,804,000.00 and consisted of 98,040,000 shares with a nominal value of PLN 0.10 each.
This document (“Q3 2018 Report”, “Report”) comprises the condensed quarterly consolidated financial statements (unaudited) of the Dino Polska S.A. Group (“Group”, “Dino Group”) for the third quarter of 2018 (“Financial Statements”), the Company’s condensed financial information and additional information required by the pertinent legal regulations. Unless specified otherwise, the data in this Report comes from the Dino Group. This document was prepared on 8 November 2018 (“Report Date”). Unofficial translation. Only the original Polish text is binding.
Q3 2018 Report
Page | 3 of 28
TABLE OF CONTENTS 1. Dino Group’s financial highlights .................................................................................................. 4
2. Management Board Activity Report ............................................................................................. 5
2.1. Operations of the Dino Group .................................................................................................. 5
2.1.1. Business profile ...................................................................................................................... 5
2.1.2. Recap of the Dino Group’s operations in Q3 2018 ................................................................ 6
2.1.3. Factors impacting Dino’s operations and results ................................................................. 11
2.2. Shareholders of the Company and shares held by management board and supervisory board
members ................................................................................................................................. 11
2.3. Operating Segments ............................................................................................................... 12
3. Condensed consolidated statements of the Dino Polska S.A. Group ......................................... 13
3.1. Condensed consolidated profit and loss account .................................................................. 13
3.2. Condensed consolidated statement of comprehensive income ............................................ 13
3.3. Condensed consolidated statement of financial position ...................................................... 14
3.4. Condensed consolidated statement of cash flows ................................................................. 15
3.5. Condensed consolidated statement of changes in equity ..................................................... 16
4. Condensed standalone financial statements of Dino Polska S.A. ............................................... 17
4.1. Selected standalone financial data ......................................................................................... 17
4.2. Condensed standalone statement of profit or loss ................................................................ 18
4.3. Condensed standalone balance sheet .................................................................................... 19
4.4. Condensed standalone statement of cash flows.................................................................... 20
4.5. Condensed standalone statement of changes in equity ........................................................ 21
5. Notes to the financial statements ............................................................................................... 22
5.1. General rules adopted for the preparation of the interim quarterly statements .................. 22
5.2. Group Overview ...................................................................................................................... 22
5.3. Seasonality and business cycles ............................................................................................. 23
5.4. Other information .................................................................................................................. 24
6. Other information ....................................................................................................................... 27
Q3 2018 Report
Page | 4 of 28
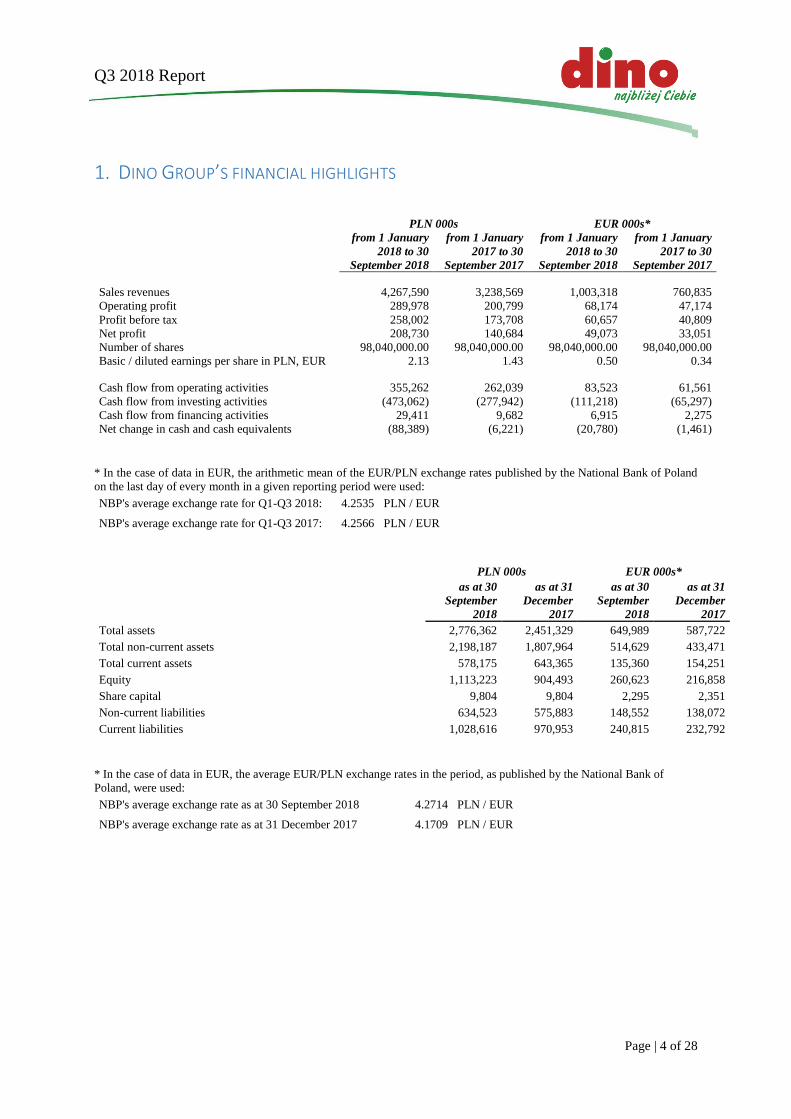
1. DINO GROUP’S FINANCIAL HIGHLIGHTS
PLN 000s EUR 000s*
from 1 January
2018 to 30
September 2018
from 1 January
2017 to 30
September 2017
from 1 January
2018 to 30
September 2018
from 1 January
2017 to 30
September 2017
Sales revenues 4,267,590 3,238,569 1,003,318 760,835
Operating profit 289,978 200,799 68,174 47,174
Profit before tax 258,002 173,708 60,657 40,809
Net profit 208,730 140,684 49,073 33,051
Number of shares 98,040,000.00 98,040,000.00 98,040,000.00 98,040,000.00
Basic / diluted earnings per share in PLN, EUR 2.13 1.43 0.50 0.34
Cash flow from operating activities 355,262 262,039 83,523 61,561
Cash flow from investing activities (473,062) (277,942) (111,218) (65,297)
Cash flow from financing activities 29,411 9,682 6,915 2,275
Net change in cash and cash equivalents (88,389) (6,221) (20,780) (1,461)
* In the case of data in EUR, the arithmetic mean of the EUR/PLN exchange rates published by the National Bank of Poland
on the last day of every month in a given reporting period were used:
NBP's average exchange rate for Q1-Q3 2018: 4.2535 PLN / EUR
NBP's average exchange rate for Q1-Q3 2017: 4.2566 PLN / EUR
PLN 000s EUR 000s*
as at 30
September
2018
as at 31
December
2017
as at 30
September
2018
as at 31
December
2017
Total assets 2,776,362 2,451,329 649,989 587,722
Total non-current assets 2,198,187 1,807,964 514,629 433,471
Total current assets 578,175 643,365 135,360 154,251
Equity 1,113,223 904,493 260,623 216,858
Share capital 9,804 9,804 2,295 2,351
Non-current liabilities 634,523 575,883 148,552 138,072
Current liabilities 1,028,616 970,953 240,815 232,792
* In the case of data in EUR, the average EUR/PLN exchange rates in the period, as published by the National Bank of
Poland, were used:
NBP's average exchange rate as at 30 September 2018 4.2714 PLN / EUR
NBP's average exchange rate as at 31 December 2017 4.1709 PLN / EUR
Q3 2018 Report
Page | 5 of 28
2. MANAGEMENT BOARD ACTIVITY REPORT
2.1. Operations of the Dino Group
2.1.1. Business profile
Dino is a Polish chain of medium-sized grocery supermarkets and one of the fastest growing networks on the
overall retail grocery market in Poland.
Dino’s business model combines the advantages of the format provided to customers by medium-sized stores
situated in convenient locations, in most cases close to their places of residence or featuring much more traffic,
with the ability to open new stores quickly and an attractive product range, comprising primarily branded and fresh
products at competitive prices.
As at 30 September 2018, the Dino network consisted of 895 stores with a total selling area of 343,281 square
meters. The Dino Group has many years of experience and a proven capacity to open new stores, enabling it to
grow its number of stores by 426 in the period of three years until 30 September 2018. Its network expansion has
been accompanied by significant like for like (LFL) revenue growth in its existing store network, which in the
January-September 2018 period stood at 12.4% compared to the corresponding period of last year. The Dino Group
continues to develop its network, consistently looking for new sites for its stores.
Dino stores have a uniform format. Most stores have a selling area of roughly 400 square meters and are located
chiefly in small communities, small and medium cities and in the peripheries of large cities. Dino’s operating
strategy is based on a standard store design, equipped with parking places for its customers and supplied with fresh
products every day of the week (except for Sundays).
Each store offers its customers approx. 5,000 stock keeping units (SKUs), mostly well-known branded products
with emphasis placed on its fresh product offering. Every store has a staffed meat counter. The Dino Group offers
products at competitive prices.
Dino Group’s business model is scalable to a large extent. It comprises centralized management supported by
suitable IT systems, a logistics network based on three distribution centers and the transportation network managed
by Dino. Dino sources most products directly from producers or their main representatives. The large and
constantly growing volumes of orders we place with suppliers accrue benefits in the form of economies of scale.
They enable Dino to make purchases on favorable terms that should improve steadily as the sales network
continues to expand. These drivers consistently enhance the Dino Group’s profitability.
The Dino Group strategy assumes further growth through focus on three key areas:
continuation of rapid organic growth in the number of stores – Dino plans to exceed the number of 1,200
stores in operation by the end of 2020. The Dino Group intends to take advantage of opportunities to
grow the network organically in its existing form through: (i) increasing store penetration in existing
areas, and (ii) gradual expansion in the northern and eastern parts of Poland.
continuing to grow LFL sales revenues in the existing store network – to continue growing LFL sales
revenues in the existing store network the Dino Group will take actions to augment customer traffic in
Dino stores and the basket value per customer.
consistent improvement of profitability – in 2014-2017 the Dino Group generated sustainable growth of
the gross margin on sales and EBITDA margin. The aim is to continue to improve profitability thanks to
increasing scale of operations, favorable business model and strategic initiatives undertaken by the Dino
Group.

Q3 2018 Report
Page | 6 of 28
2.1.2. Recap of the Dino Group’s operations in Q3 2018
In Q3 2018 the Dino Group’s revenues were PLN 1,558.5 million, meaning they were up by PLN 338.3 million,
i.e. 27.7% higher than in Q3 2017. At the same time, the cost of sales increased 26.0% to PLN 1,181.8 million.
EBITDA rose 29.9% year on year to PLN 141.5 million. The EBITDA margin was 9.1%, up from 8.9% last year.
YTD, after 9 months of 2018 the Dino Group’s revenues were PLN 4,267.6 million, meaning they were up by
PLN 1,029.0 million, i.e. 31.8% higher than in the corresponding period of 2017. At the same time, the cost of
sales increased 30.5% to PLN 3,260.1 million. EBITDA1 rose 34.6% year on year to PLN 370.5 million. The
EBITDA margin was 8.7%, 0.2 percentage points higher than in the January-September 2017 period.
The following table presents selected consolidated statement of profit or loss line items
(PLN 000s) Q3 2018 Q3 2017 change Q1-Q3
2018
Q1-Q3
20172 change
Sales revenues 1,558,518 1,220,171 27.7% 4,267,590 3,238,569 31.8%
Cost of sales (1,181,789) (937,556) 26.0% (3,260,085) (2,497,615) 30.5%
Gross profit on sales 376,729 282,615 33.3% 1,007,505 740,954 36.0%
Other operating income 255 625 -59.2% 3,338 1,837 81.7%
Sales and marketing expenses (248,438) (183,121) 35.7% (677,533) (493,592) 37.3%
General administration expenses (14,600) (13,344) 9.4% (41,501) (47,664) -12.9%
Other operating expenses (925) (348) 165.8% (1,831) (736) 148.8%
Operating profit 113,021 86,427 30.8% 289,978 200,799 44.4%
Financial income 154 1 -% 301 141 113.5%
Financial expenses (11,632) (9,379) 24.0% (32,277) (27,232) 18.5%
Profit before tax 101,543 77,049 31.8% 258,002 173,708 48.5%
Income tax (19,268) (13,507) 42.7% (49,272) (33,024) 49.2%
Net profit 82,275 63,542 29.5% 208,730 140,684 48.4%
Sales revenues
Significant top line improvement is the outcome of Dino’s store network roll-out to open new stores and growing
revenues in the existing store network (like for like, LfL)3. LfL sales growth in Q3 2018 was 8.6%, compared to
the corresponding period of 2017. In January-September 2018 LfL sales growth was 12.4%.
The following table presents a comparison of the inflation trends in Poland and top line LFL growth in Dino’s
existing store network.
% 2018 Q1-Q3
2017
2016
2015 Q3 Q2 Q1 2018 2017 2016
Inflation (deflation) 2.0 1.7 1.5 1.7 1.9 -0.9 2.0 -0.6 -0.9
Food price inflation 2.2 3.2 3.9 3.1 3.8 0.7 4.2 0.8 -1.7
Dino’s LFL 8.6 10.0 20.3 12.4 15.2 10.5 16.2 11.3 5.1
Fresh products, including meat, cold cuts and poultry, accounted for 36.6% of the Group’s sales in Q3 2018 and
for 37.5% in the January-September 2018 period, i.e. up by 0.3 percentage points and 0.8 percentage points in
relation to the corresponding period of 2017.
1 EBITDA adjusted for non-recurring costs associated with the IPO of PLN 12,272 thousand in H1 2017. 2 The data have not been adjusted for one-offs related to the public offering in H1 2017 3 stores are included in the calculation of LfL revenues starting from the 13th full month of their existence

Q3 2018 Report
Page | 7 of 28
The table below shows the structure of sales revenues by product in individual periods.
% Q3 2018 Q3 2017 Q1-Q3
2018
Q1-Q3
2017
Fresh food products 36.6 36.3 37.5 36.7
Dry grocery products, beverages, alcohol and cigarettes 51.6 51.7 50.2 50.9
Non-grocery products 11.8 12.0 12.3 12.4
Development of Dino’s store network
In Q3 2018, 46 new Dino stores were launched, 5 more than last year. YTD from the beginning of 2018, the Dino
network grew by 120 stores in relation to 90 in the corresponding period of last year. As at 30 September 2018,
the Dino network consisted of 895 stores, 177 more than last year.
The following table presents information on the Dino Group’s number of stores as at specified dates.
As at 30 September As at 31 December
2018 2017 2017 2016 2015
Number of new store openings (YTD) 120 90 147 123 101
Total number of stores 895 718 775 628 511
Total selling area (m2) 343,281 273,038 295,226 238,416 191,579
Growth of selling area y/y 25.7% 23.1% 23.8% 24.4% 26.4%
Cost of sales
The cost of sales was 75.8% and 76.8% of revenue, respectively in Q3 2018 and Q3 2017. The cost of sales rose
PLN 244.2 million, i.e. by 26.0% to PLN 1,181.8 million in Q3 2018 compared to PLN 937.6 million in Q3 2017,
with a corresponding 27.7% increase of sales revenues. This growth was caused mainly by the Dino Group’s
growing business size in connection with the expansion of the Dino Group’s store network and rising sales in the
existing store network (LfL).
Sales and marketing expenses
Sales and marketing expenses grew by PLN 65.3 million, i.e. 35.7% to PLN 248.4 million in Q3 2018 compared
to PLN 183.1 million in Q3 2017. This growth was mainly driven by the Dino Group’s growing business size and
the related expansion of its store network and rising LfL sales in its existing store network, thereby necessitating
higher costs associated with store upkeep, storage of merchandise and marketing.
General administration expenses
General administration expenses rose PLN 1.3 million, or 9.4%, to PLN 14.6 million in Q3 2018 compared to PLN
13.3 million in Q3 2017. This was caused mainly by the expansion of the Dino Group’s store network (some
administrative functions expanded in line with the network rollout).

Q3 2018 Report
Page | 8 of 28
Costs by nature
The following table presents costs by nature.
(PLN 000s) Q3 2018 Q3 2017 change Q1-Q3
2018
Q1-Q3
20174 change
Depreciation and amortization 28,442 22,498 26.4% 80,472 62,092 29.6%
Consumption of materials and energy 138,318 121,624 13.7% 369,755 320,547 15.4%
External services 67,878 46,255 46.7% 177,542 122,171 45.3%
Taxes and fees 7,371 6,094 21.0% 22,674 18,005 25.9%
Employee benefits 170,555 122,894 38.8% 470,688 334,701 40.6%
Other costs by nature 5,625 5,789 -2.8% 13,500 12,697 6.3%
Cost of goods and materials sold 1,025,727 806,899 27.1% 2,845,816 2,158,399 31.8%
Total costs by nature, including: 1,443,916 1,132,053 27.5% 3,980,447 3,028,612 31.4%
Items captured in cost of sales 1,181,789 937,556 26.0% 3,260,085 2,497,615 30.5%
Items captured in sales and marketing expenses 248,438 183,121 35.7% 677,533 493,592 37.3%
Items captured in general administration expenses 14,600 13,344 9.4% 41,501 35,392 17.3%
Movement in products (911) (1,968) -53.7% 1,328 2,013 -34.0%
Total costs by nature rose PLN 311.9 million, or 27.5%, to PLN 1,443.9 million in Q3 2018, compared to PLN
1,132.1 million in Q3 2017, mainly as a result of higher: (i) costs of goods and materials sold (up PLN 218.8
million), (ii) costs of employee benefits (up PLN 47.7 million), (iii) external services (up PLN 21.6 million) and
(iv) consumption of materials and energy (up PLN 16.7 million). This growth was caused mainly by the expansion
of the Dino Group’s store network and rising sales in the existing store network (LfL).
The costs of employee benefits rose PLN 47.7 million, i.e. 38.8% to PLN 170.6 million in Q3 2018 compared to
PLN 122.9 million in Q3 2017). This growth resulted primarily from the higher number of Dino Group employees
from 12,003 as at 30 September 2017 to 15,652 as at 30 September 2018 in connection with the Dino Group’s
expanding business size and the related expansion of the Dino Group’s store network and rising LfL sales in the
existing network and, to a smaller extent, from the higher average salary in the Dino Group.
External services, which comprised in particular transportation services, lease and tenancy services, and
maintenance services, increased by PLN 21.6 million, or 46.7%, to PLN 67.9 million in Q3 2018 compared to
PLN 46.3 million in Q3 2017. This growth was caused by the Dino Group’s growing business size and the related
expansion of the Dino Group’s store network and rising LfL sales in the existing store network, and the uptick in
transport expenses ensuing from high fuel prices.
Consumption of materials and energy increased by PLN 16.7 million, or 13.7%, to PLN 138.3 million in Q3 2018
compared to PLN 121.6 million in Q3 2017. This growth was caused by an increase in unit electricity price and
by higher consumption of materials and raw materials in connection with the Dino Group’s expanding business
size and the expansion of the Dino Group’s store network and rising LFL sales in the existing store network.
Financial expenses
Dino Group’s financial expenses rose PLN 2.3 million, or 24.0%, to PLN 11.6 million in Q3 2018 compared to
PLN 9.4 million in Q3 2017. This growth was caused mainly by the higher amount of interest on loans, borrowings
and issued bonds as a result of the Group’s growing business and the related expansion of the Dino Group’s store
network and rising LfL sales in the existing store network.
4 The data have been adjusted for one-offs related to the public offering totaling PLN 12,272 thousand in H1 2017 (PLN 1,493 thousand
included in third party services, PLN 10,334 thousand posted to costs of employee benefits and PLN 445 thousand captured in other costs by nature)
Q3 2018 Report
Page | 9 of 28
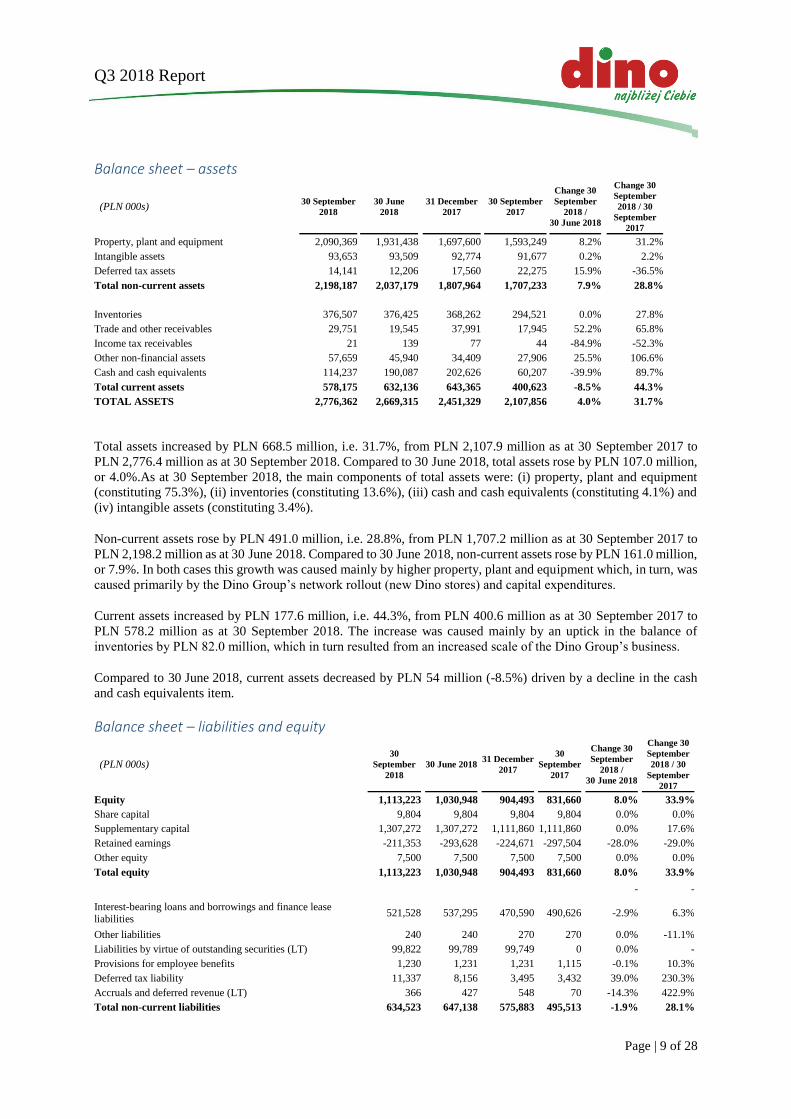
Balance sheet – assets
(PLN 000s) 30 September
2018
30 June
2018 31 December
2017 30 September
2017
Change 30
September
2018 /
30 June 2018
Change 30
September
2018 / 30
September
2017
Property, plant and equipment 2,090,369 1,931,438 1,697,600 1,593,249 8.2% 31.2%
Intangible assets 93,653 93,509 92,774 91,677 0.2% 2.2%
Deferred tax assets 14,141 12,206 17,560 22,275 15.9% -36.5%
Total non-current assets 2,198,187 2,037,179 1,807,964 1,707,233 7.9% 28.8%
Inventories 376,507 376,425 368,262 294,521 0.0% 27.8%
Trade and other receivables 29,751 19,545 37,991 17,945 52.2% 65.8%
Income tax receivables 21 139 77 44 -84.9% -52.3%
Other non-financial assets 57,659 45,940 34,409 27,906 25.5% 106.6%
Cash and cash equivalents 114,237 190,087 202,626 60,207 -39.9% 89.7%
Total current assets 578,175 632,136 643,365 400,623 -8.5% 44.3%
TOTAL ASSETS 2,776,362 2,669,315 2,451,329 2,107,856 4.0% 31.7%
Total assets increased by PLN 668.5 million, i.e. 31.7%, from PLN 2,107.9 million as at 30 September 2017 to
PLN 2,776.4 million as at 30 September 2018. Compared to 30 June 2018, total assets rose by PLN 107.0 million,
or 4.0%.As at 30 September 2018, the main components of total assets were: (i) property, plant and equipment
(constituting 75.3%), (ii) inventories (constituting 13.6%), (iii) cash and cash equivalents (constituting 4.1%) and
(iv) intangible assets (constituting 3.4%).
Non-current assets rose by PLN 491.0 million, i.e. 28.8%, from PLN 1,707.2 million as at 30 September 2017 to
PLN 2,198.2 million as at 30 June 2018. Compared to 30 June 2018, non-current assets rose by PLN 161.0 million,
or 7.9%. In both cases this growth was caused mainly by higher property, plant and equipment which, in turn, was
caused primarily by the Dino Group’s network rollout (new Dino stores) and capital expenditures.
Current assets increased by PLN 177.6 million, i.e. 44.3%, from PLN 400.6 million as at 30 September 2017 to
PLN 578.2 million as at 30 September 2018. The increase was caused mainly by an uptick in the balance of
inventories by PLN 82.0 million, which in turn resulted from an increased scale of the Dino Group’s business.
Compared to 30 June 2018, current assets decreased by PLN 54 million (-8.5%) driven by a decline in the cash
and cash equivalents item.
Balance sheet – liabilities and equity
(PLN 000s) 30
September
2018
30 June 2018 31 December
2017 30
September
2017
Change 30
September
2018 /
30 June 2018
Change 30
September
2018 / 30
September
2017
Equity 1,113,223 1,030,948 904,493 831,660 8.0% 33.9%
Share capital 9,804 9,804 9,804 9,804 0.0% 0.0%
Supplementary capital 1,307,272 1,307,272 1,111,860 1,111,860 0.0% 17.6%
Retained earnings -211,353 -293,628 -224,671 -297,504 -28.0% -29.0%
Other equity 7,500 7,500 7,500 7,500 0.0% 0.0%
Total equity 1,113,223 1,030,948 904,493 831,660 8.0% 33.9%
- -
Interest-bearing loans and borrowings and finance lease liabilities
521,528 537,295 470,590 490,626 -2.9% 6.3%
Other liabilities 240 240 270 270 0.0% -11.1%
Liabilities by virtue of outstanding securities (LT) 99,822 99,789 99,749 0 0.0% -
Provisions for employee benefits 1,230 1,231 1,231 1,115 -0.1% 10.3%
Deferred tax liability 11,337 8,156 3,495 3,432 39.0% 230.3%
Accruals and deferred revenue (LT) 366 427 548 70 -14.3% 422.9%
Total non-current liabilities 634,523 647,138 575,883 495,513 -1.9% 28.1%
Q3 2018 Report
Page | 10 of 28
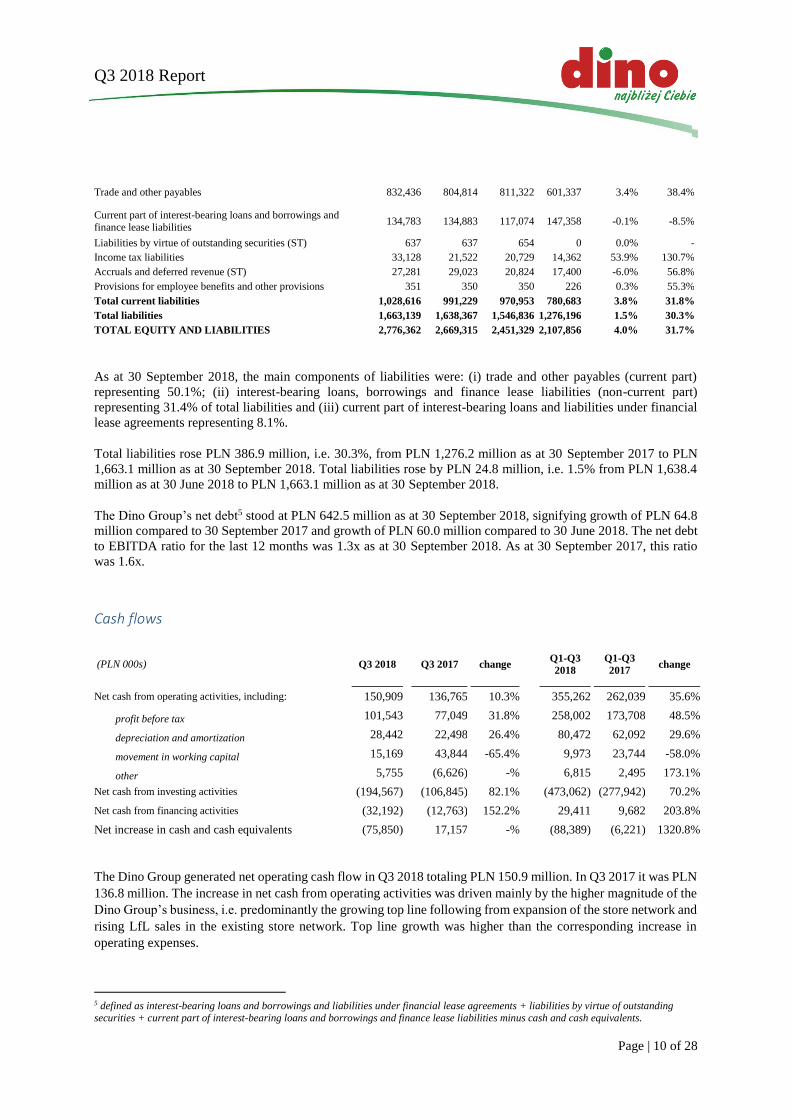
Trade and other payables 832,436 804,814 811,322 601,337 3.4% 38.4%
Current part of interest-bearing loans and borrowings and
finance lease liabilities 134,783 134,883 117,074 147,358 -0.1% -8.5%
Liabilities by virtue of outstanding securities (ST) 637 637 654 0 0.0% -
Income tax liabilities 33,128 21,522 20,729 14,362 53.9% 130.7%
Accruals and deferred revenue (ST) 27,281 29,023 20,824 17,400 -6.0% 56.8%
Provisions for employee benefits and other provisions 351 350 350 226 0.3% 55.3%
Total current liabilities 1,028,616 991,229 970,953 780,683 3.8% 31.8%
Total liabilities 1,663,139 1,638,367 1,546,836 1,276,196 1.5% 30.3%
TOTAL EQUITY AND LIABILITIES 2,776,362 2,669,315 2,451,329 2,107,856 4.0% 31.7%
As at 30 September 2018, the main components of liabilities were: (i) trade and other payables (current part)
representing 50.1%; (ii) interest-bearing loans, borrowings and finance lease liabilities (non-current part)
representing 31.4% of total liabilities and (iii) current part of interest-bearing loans and liabilities under financial
lease agreements representing 8.1%.
Total liabilities rose PLN 386.9 million, i.e. 30.3%, from PLN 1,276.2 million as at 30 September 2017 to PLN
1,663.1 million as at 30 September 2018. Total liabilities rose by PLN 24.8 million, i.e. 1.5% from PLN 1,638.4
million as at 30 June 2018 to PLN 1,663.1 million as at 30 September 2018.
The Dino Group’s net debt5 stood at PLN 642.5 million as at 30 September 2018, signifying growth of PLN 64.8
million compared to 30 September 2017 and growth of PLN 60.0 million compared to 30 June 2018. The net debt
to EBITDA ratio for the last 12 months was 1.3x as at 30 September 2018. As at 30 September 2017, this ratio
was 1.6x.
Cash flows
(PLN 000s) Q3 2018 Q3 2017 change Q1-Q3
2018
Q1-Q3
2017 change
Net cash from operating activities, including: 150,909 136,765 10.3% 355,262 262,039 35.6%
profit before tax 101,543 77,049 31.8% 258,002 173,708 48.5%
depreciation and amortization 28,442 22,498 26.4% 80,472 62,092 29.6%
movement in working capital 15,169 43,844 -65.4% 9,973 23,744 -58.0%
other 5,755 (6,626) -% 6,815 2,495 173.1%
Net cash from investing activities (194,567) (106,845) 82.1% (473,062) (277,942) 70.2%
Net cash from financing activities (32,192) (12,763) 152.2% 29,411 9,682 203.8%
Net increase in cash and cash equivalents (75,850) 17,157 -% (88,389) (6,221) 1320.8%
The Dino Group generated net operating cash flow in Q3 2018 totaling PLN 150.9 million. In Q3 2017 it was PLN
136.8 million. The increase in net cash from operating activities was driven mainly by the higher magnitude of the
Dino Group’s business, i.e. predominantly the growing top line following from expansion of the store network and
rising LfL sales in the existing store network. Top line growth was higher than the corresponding increase in
operating expenses.
5 defined as interest-bearing loans and borrowings and liabilities under financial lease agreements + liabilities by virtue of outstanding securities + current part of interest-bearing loans and borrowings and finance lease liabilities minus cash and cash equivalents.
Q3 2018 Report
Page | 11 of 28
Net cash flow from investing activities totaled PLN -194.6 million in Q3 2018 and was up PLN 87.7 million, or
by 82.1% compared to investing cash flow in Q3 2017. This was mostly caused by the upswing in the number of
new Dino store openings in Q3 2018 and the ongoing progress in the construction of Dino’s new distribution center
in Rzeszotary, which is slated to be opened in 2018.
2.1.3. Factors impacting Dino’s operations and results
In the opinion of the Dino Management Board, the following factors will affect the Dino Group’s business in the
upcoming quarters:
pace of new store openings by the Dino Group and the related capital expenditures,
favorable economic situation in Poland resulting in increasing disposable income and consumption
expenditures of customers;
growth rate of the prices of consumer goods and services, in particular food and soft drinks,
regulatory environment: government programs translating into incremental consumer disposable income
and the gradual deployment of the Sunday trading ban;
improved efficiency of the Company’s operations, benefits resulting from economies of scale and
optimization of operating expenses; improved efficiency of logistics services provided to all stores,
decreasing unemployment and unstable and uncertain situation in the labor market in individual regions.
Due to uncertainty about the future state of the economy, the Management Board’s expectations and projections
are subject to a high dose of uncertainty.
2.2. Shareholders of the Company and shares held by management board and
supervisory board members
As at the Report Date, the Company’s share capital is PLN 9,804,000 and is divided into 98,040,000 series A
ordinary bearer shares with a par value of PLN 0.10 each. There are no shares in the Company with special control
powers attached. Nor are there any restrictions on the exercise of voting rights or transferability of legal title to
Dino shares.
Shareholding structure of Dino Polska S.A. as at the Report Date
Number of shares and number of
votes at the Shareholder Meeting
Share in the share capital and in
votes at the Shareholder Meeting
Tomasz Biernacki with a subsidiary6 ................................... 50,103,000 51.1%
Other shareholders ............................................................... 47,937,000 48.9%
As at the Report Date, to the Company’s best knowledge, the only holder of Dino Shares representing, directly or
indirectly, at least 5% of the total number of votes at the Shareholder Meeting, is Tomasz Biernacki, Chairman of
the Dino Supervisory Board. According to the Company’s best knowledge, there have not been any changes in the
structure of significant equity stakes in Dino in the period from the date of transmitting the periodic report for H1
2018.
At the Report Date, Szymon Piduch, President of the Management Board, held 141,000 shares. Michał Krauze, a
Management Board Member, held 30,000 Company shares as at the Report Date. No changes occurred in the
number of Dino Polska shares held by members of the Company’s Management Board since the delivery date of
the H1 2018 periodic report.
Among the Supervisory Board members, as at the Report Date the following held Dino shares: Tomasz Biernacki
(Supervisory Board Chairman) – according to the data set forth in the table above, Eryk Bajer (Supervisory Board
6 BT Kapitał Sp. z o.o., a subsidiary of Tomasz Biernacki, holds 103 thousand Company shares

Q3 2018 Report
Page | 12 of 28
Member) – 18,681 shares (in connection with purchase transactions executed on the Warsaw Stock Exchange from
the delivery date of the periodic report for H1 2018 Eryk Bajer increased the number of shares he held by 1,050)
and Sławomir Jakszuk (Supervisory Board Member) – 1,600 shares.
On 20 March 2017, in connection with the public offering of shares, Tomasz Biernacki incurred an obligation not
to sell the 51% of Dino Polska shares held by him before the public offering until the expiry of the 720-day period
after the first listing of shares on the Warsaw Stock Exchange, which happened on 19 April 2017. Moreover, in
accordance with the provisions of the incentive programs, the Members of the Company’s Management Board
who acquired shares in the performance of their obligation to acquire the shares specified in these programs, are
required to refrain from selling those shares for a period of two years after their acquisition. The detailed provisions
of the said obligations are described in the Company’s prospectus, as approved by KNF on 17 March 2017.
2.3. Operating Segments
The Dino Polska S.A. Group runs its operations in one business sector and has one operating and reporting segment
in the form of sales in a retail store network.
Its revenues may be broken down by type of product or merchandise or product group. However, the Management
Board does not measure detailed operating results generated by any of such categories, which means that it would
be problematic to ascertain the unambiguous impact of the allocation of resources on each category. As such,
information on revenues generated in each category is of a limited decision-making value. Because the smallest
area of business for which the Management Board reviews profitability ratios is the level of the Dino Polska S.A.
Group as a whole, only one operating segment has been isolated.
(PLN 000s) Q1-Q3 2018 Q1-Q3 2017
Revenue on sales of products and services 522,148 405,526
Revenue on sales of goods and materials 3,745,442 2,833,043
Total 4,267,590 3,238,569

Q3 2018 Report
3. CONDENSED CONSOLIDATED STATEMENTS OF THE DINO POLSKA S.A. GROUP
3.1. Condensed consolidated profit and loss account
for the period from 1 January 2018 to 30 September 2018 (PLN 000s)
1 January
2018 - 30
September
2018
1 January
2017 - 30
September
2017
1 July
2018 - 30
September
2018
1 July
2017 - 30
September
2017
Continuing operations
Sales revenues 4,267,590 3,238,569 1,558,518 1,220,171
Cost of sales (3,260,085) (2,497,615) (1,181,789) (937,556)
Gross profit on sales 1,007,505 740,954 376,729 282,615
Other operating income 3,338 1,837 255 625
Sales and marketing expenses (677,533) (493,592) (248,438) (183,121)
General administration expenses (41,501) (47,664) (14,600) (13,344)
Other operating expenses (1,831) (736) (925) (348)
Operating profit 289,978 200,799 113,021 86,427
Financial income 301 141 154 1
Financial expenses (32,277) (27,232) (11,632) (9,379)
Profit before tax 258,002 173,708 101,543 77,049
Income tax (49,272) (33,024) (19,268) (13,507)
Net profit from continuing operations 208,730 140,684 82,275 63,542
Net profit for the reporting period 208,730 140,684 82,275 63,542
3.2. Condensed consolidated statement of comprehensive income
for the period from 1 January 2018 to 30 September 2018 (PLN 000s)
1 January
2018 - 30
September
2018
1 January
2017 - 30
September
2017
1 July
2018 - 30
September
2018
1 July
2017 - 30
September
2017 Net profit for the reporting period 208,730 140,684 82,275 63,542
Actuarial gains/(losses) on defined benefit plans
-
-
-
-
Income tax on other comprehensive income
-
-
-
-
Net other comprehensive income not subject to reclassification to
profit/(loss) in subsequent reporting periods - -
- -
Net other comprehensive income - - - -
Comprehensive income in the reporting period 208,730 140,684 82,275 63,542

Q3 2018 Report
Page | 14 of 28
3.3. Condensed consolidated statement of financial position
as at 30 September 2018 (PLN 000s)
30
September
2018
30 June 2018
31
December
2017
30
September
2017
ASSETS
Property, plant and equipment 2,090,369 1,931,438 1,697,600 1,593,249
Intangible assets 93,653 93,509 92,774 91,677
Other non-financial assets (non-current) 24 26 30 32
Deferred tax assets 14,141 12,206 17,560 22,275
Total non-current assets 2,198,187 2,037,179 1,807,964 1,707,233
Inventories 376,507 376,425 368,262 294,521
Trade and other receivables 29,751 19,545 37,991 17,945
Income tax receivables 21 139 77 44
Other non-financial assets 57,659 45,940 34,409 27,906
Cash and cash equivalents 114,237 190,087 202,626 60,207
Total current assets 578,175 632,136 643,365 400,623
TOTAL ASSETS 2,776,362 2,669,315 2,451,329 2,107,856
EQUITY AND LIABILITIES
Equity (attributable to owners of the parent) 1,113,223 1,030,948 904,493 831,660
Share capital 9,804 9,804 9,804 9,804
Supplementary capital 1,307,272 1,307,272 1,111,860 1,111,860
Retained earnings (211,353) (293,628) (224,671) (297,504)
Other equity 7,500 7,500 7,500 7,500
Non-controlling interests - - - -
Total equity 1,113,223 1,030,948 904,493 831,660
Interest-bearing loans and borrowings and finance lease liabilities 521,528 537,295 470,590 490,626
Liabilities by virtue of outstanding securities 99,822 99,789 99,749 -
Other liabilities 240 240 270 270
Provisions for employee benefits 1,230 1,231 1,231 1,115
Deferred tax liability 11,337 8,156 3,495 3,432
Accruals and deferred revenue 366 427 548 70
Total non-current liabilities 634,523 647,138 575,883 495,513
Trade and other payables 832,436 804,814 811,322 601,337
Current part of interest-bearing loans and borrowings and finance lease
liabilities 134,783 134,883 117,074 147,358
Liabilities by virtue of outstanding securities 637 637 654 -
Income tax liabilities 33,128 21,522 20,729 14,362
Accruals and deferred revenue 27,281 29,023 20,824 17,400
Provisions for employee benefits 351 350 350 226
Total current liabilities 1,028,616 991,229 970,953 780,683
Total liabilities 1,663,139 1,638,367 1,546,836 1,276,196
TOTAL EQUITY AND LIABILITIES 2,776,362 2,669,315 2,451,329 2,107,856
Q3 2018 Report
Page | 15 of 28
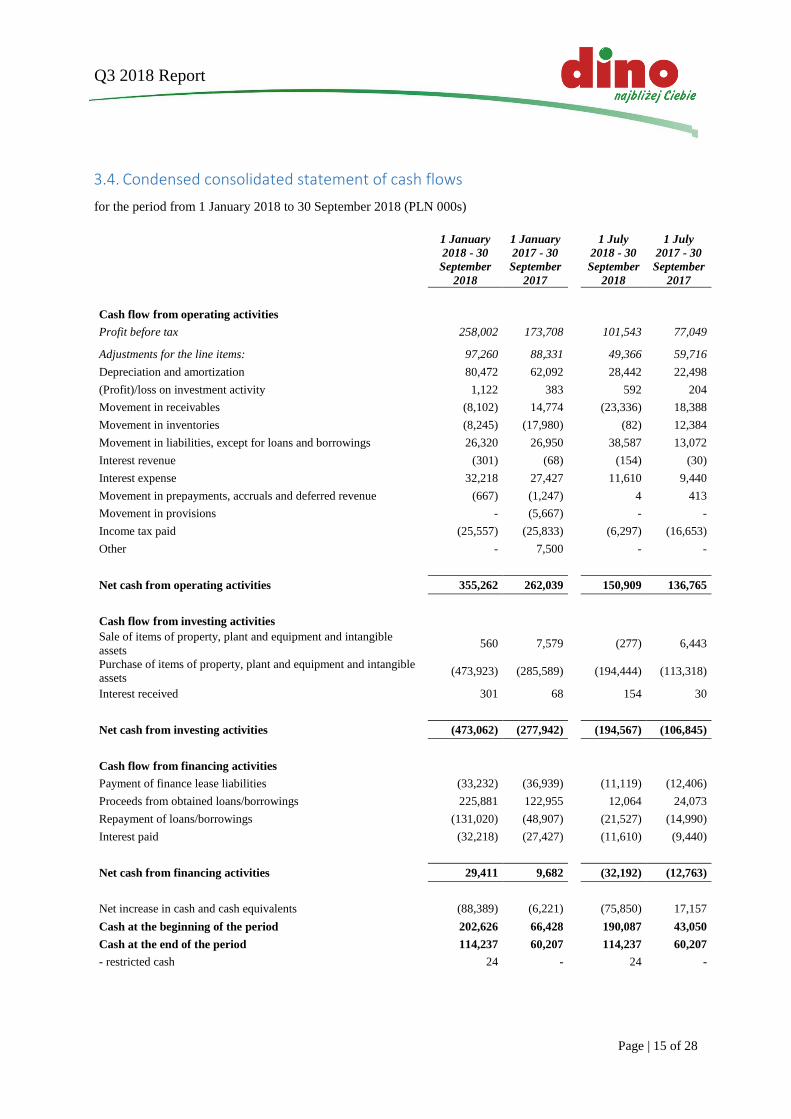
3.4. Condensed consolidated statement of cash flows
for the period from 1 January 2018 to 30 September 2018 (PLN 000s)
1 January
2018 - 30
September
2018
1 January
2017 - 30
September
2017
1 July
2018 - 30
September
2018
1 July
2017 - 30
September
2017
Cash flow from operating activities
Profit before tax 258,002 173,708 101,543 77,049
Adjustments for the line items: 97,260 88,331 49,366 59,716
Depreciation and amortization 80,472 62,092 28,442 22,498
(Profit)/loss on investment activity 1,122 383 592 204
Movement in receivables (8,102) 14,774 (23,336) 18,388
Movement in inventories (8,245) (17,980) (82) 12,384
Movement in liabilities, except for loans and borrowings 26,320 26,950 38,587 13,072
Interest revenue (301) (68) (154) (30)
Interest expense 32,218 27,427 11,610 9,440
Movement in prepayments, accruals and deferred revenue (667) (1,247) 4 413
Movement in provisions - (5,667) - -
Income tax paid (25,557) (25,833) (6,297) (16,653)
Other - 7,500 - -
Net cash from operating activities 355,262 262,039 150,909 136,765
Cash flow from investing activities
Sale of items of property, plant and equipment and intangible
assets 560 7,579 (277) 6,443
Purchase of items of property, plant and equipment and intangible
assets (473,923) (285,589) (194,444) (113,318)
Interest received 301 68 154 30
Net cash from investing activities (473,062) (277,942) (194,567) (106,845)
Cash flow from financing activities
Payment of finance lease liabilities (33,232) (36,939) (11,119) (12,406)
Proceeds from obtained loans/borrowings 225,881 122,955 12,064 24,073
Repayment of loans/borrowings (131,020) (48,907) (21,527) (14,990)
Interest paid (32,218) (27,427) (11,610) (9,440)
Net cash from financing activities 29,411 9,682 (32,192) (12,763)
Net increase in cash and cash equivalents (88,389) (6,221) (75,850) 17,157
Cash at the beginning of the period 202,626 66,428 190,087 43,050
Cash at the end of the period 114,237 60,207 114,237 60,207
- restricted cash 24 - 24 -

Q3 2018 Report
Page | 16 of 28
3.5. Condensed consolidated statement of changes in equity
for the period from 1 January 2018 to 30 September 2018 (PLN 000s)
Attributable to owners of the parent
Share capital Supplementary
capital Retained earnings Other equity Total
As at 1 January 2018 9,804 1,111,860 (224,671) 7,500 904,493
Net profit for 2018 - - 208,730 - 208,730
Comprehensive income for the year - - 208,730 - 208,730
Distribution of the financial result for 2017 - 195,412 (195,412) - -
As at 30 September 2018 9,804 1,307,272 (211,353) 7,500 1,113,223
As at 1 January 2017 9,804 510,720 162,952 - 683,476
Net profit for 2017 - - 213,604 - 213,604
Net other comprehensive income for 2017 - - (87) - (87)
Comprehensive income for the year - - 213,517 - 213,517
Costs of share-based incentive system - - - 7,500 7,500
Distribution of the financial result for 2016 - 601,140 (601,140) - -
As at 31 December 2017 9,804 1,111,860 (224,671) 7,500 904,493
As at 1 January 2017 9,804 510,720 162,952 - 683,476
Net profit for 2017 - - 140,684 - 140,684
Net other comprehensive income for 2017 - - - - -
Comprehensive income for the year - - 140,684 - 140,684
Costs of share-based incentive system - - - 7,500 7,500
Distribution of the financial result for 2016 - 601,140 (601,140) - -
As at 30 September 2017 9,804 1,111,860 (297,504) 7,500 831,660
Q3 2018 Report
Page | 17 of 28
4. CONDENSED STANDALONE FINANCIAL STATEMENTS OF DINO POLSKA S.A.
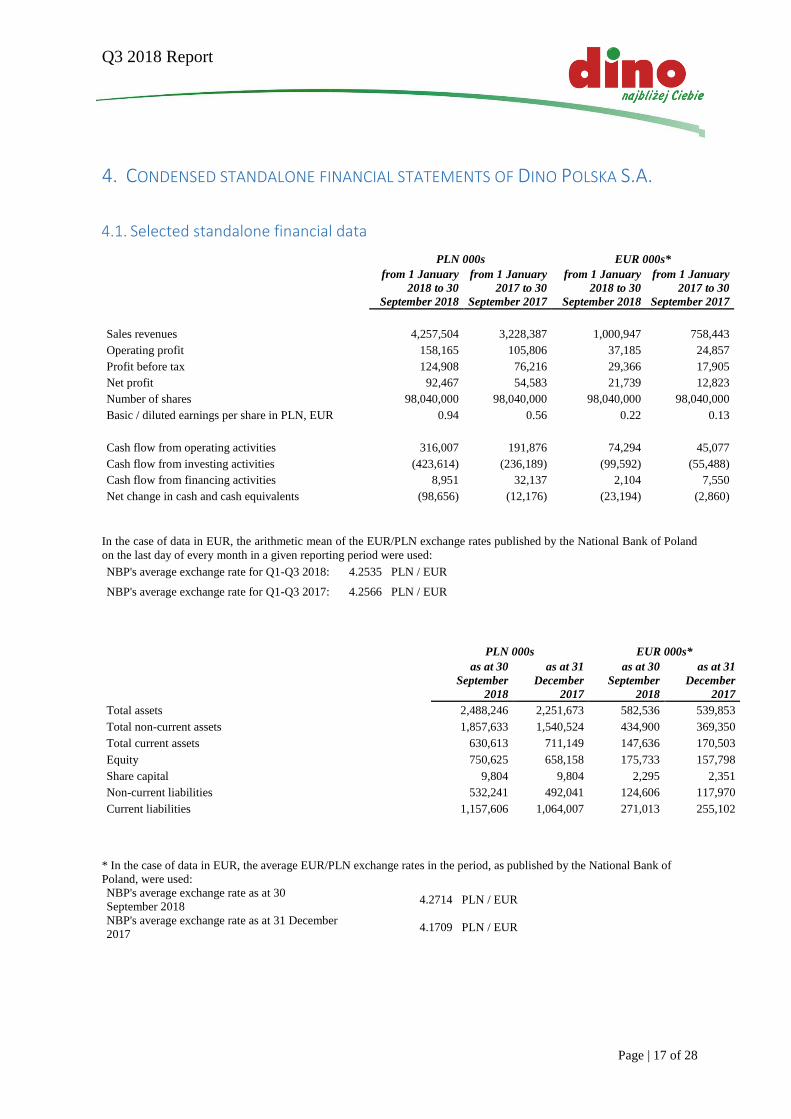
4.1. Selected standalone financial data
PLN 000s EUR 000s*
from 1 January
2018 to 30
September 2018
from 1 January
2017 to 30
September 2017
from 1 January
2018 to 30
September 2018
from 1 January
2017 to 30
September 2017
Sales revenues 4,257,504 3,228,387 1,000,947 758,443
Operating profit 158,165 105,806 37,185 24,857
Profit before tax 124,908 76,216 29,366 17,905
Net profit 92,467 54,583 21,739 12,823
Number of shares 98,040,000 98,040,000 98,040,000 98,040,000
Basic / diluted earnings per share in PLN, EUR 0.94 0.56 0.22 0.13
Cash flow from operating activities 316,007 191,876 74,294 45,077
Cash flow from investing activities (423,614) (236,189) (99,592) (55,488)
Cash flow from financing activities 8,951 32,137 2,104 7,550
Net change in cash and cash equivalents (98,656) (12,176) (23,194) (2,860)
In the case of data in EUR, the arithmetic mean of the EUR/PLN exchange rates published by the National Bank of Poland
on the last day of every month in a given reporting period were used:
NBP's average exchange rate for Q1-Q3 2018: 4.2535 PLN / EUR
NBP's average exchange rate for Q1-Q3 2017: 4.2566 PLN / EUR
PLN 000s EUR 000s*
as at 30
September
2018
as at 31
December
2017
as at 30
September
2018
as at 31
December
2017
Total assets 2,488,246 2,251,673 582,536 539,853
Total non-current assets 1,857,633 1,540,524 434,900 369,350
Total current assets 630,613 711,149 147,636 170,503
Equity 750,625 658,158 175,733 157,798
Share capital 9,804 9,804 2,295 2,351
Non-current liabilities 532,241 492,041 124,606 117,970
Current liabilities 1,157,606 1,064,007 271,013 255,102
* In the case of data in EUR, the average EUR/PLN exchange rates in the period, as published by the National Bank of
Poland, were used:
NBP's average exchange rate as at 30
September 2018 4.2714 PLN / EUR
NBP's average exchange rate as at 31 December
2017 4.1709 PLN / EUR

Q3 2018 Report
Page | 18 of 28
4.2. Condensed standalone statement of profit or loss
for the period from 1 January 2018 to 30 September 2018 (PLN 000s)
1 January
2018 - 30
September
2018
1 January
2017 - 30
September
2017
1 July 2018
- 30
September
2018
1 July 2017
- 30
September
2017
A. Net revenues on sales and equivalents 4,257,504 3,228,387 1,555,279 1,217,234
I. Net revenue on sales of products 10,431 6,104 5,472 2,456
IV. Net revenue on sales of goods and materials 4,247,073 3,222,283 1,549,807 1,214,778
B. Operating expenses 4,100,352 3,123,182 1,486,988 1,165,781
I. Depreciation and amortization 60,529 43,721 21,701 16,219
II. Consumption of materials and energy 61,015 46,796 25,660 17,025
III. External services 275,064 218,736 101,985 80,527
IV. Taxes and fees 16,013 11,796 5,298 4,173
V. Salaries 351,640 260,895 127,165 92,332
VI. Social security and other benefits 76,705 54,310 28,230 20,058
VII. Other costs by nature 17,848 12,541 7,203 5,688
VIII. Cost of goods and materials sold 3,241,538 2,474,387 1,169,746 929,759
C. Sales profit (loss) (A – B) 157,152 105,205 68,291 51,453
D. Other operating income 2,794 1,183 94 458
E. Other operating expenses 1,781 582 862 278
F. Operating profit (loss) (C+D-E) 158,165 105,806 67,523 51,633
G. Financial income 2,930 1,398 1,022 465
H. Financial expenses 36,187 30,988 13,075 10,443
I. Profit / (loss) before tax (F + G - H) 124,908 76,216 55,470 41,655
J. Income tax 32,441 21,633 14,215 10,102
L. Net profit (loss) (I – J) 92,467 54,583 41,255 31,553

Q3 2018 Report
Page | 19 of 28
4.3. Condensed standalone balance sheet
as at 30 September 2018 (PLN 000s)
30
September
2018
30 June 2018
31
December
2017
30
September
2017
Assets
A. Non-current assets 1,857,633 1,737,322 1,540,524 1,455,770
I. Intangible assets 11,203 11,017 10,284 9,167
II. Property, plant and equipment 1,085,985 967,590 773,768 683,515
III. Non-current receivables - - - -
IV. Non-current investments 738,759 738,809 738,809 739,692
V. Non-current prepayments and accruals 21,686 19,906 17,663 23,396
B. Current assets 630,613 691,581 711,149 475,809
I. Inventories 359,103 363,864 358,573 285,720
II. Current receivables 54,920 43,695 62,821 34,513
III. Current investments 210,045 267,248 257,052 109,148
IV. Current prepayments and accruals 6,545 16,774 32,703 46,428
C. Contributions due to share capital - - - -
D. Treasury stock - - - -
Total assets 2,488,246 2,428,903 2,251,673 1,931,579
30
September
2018
30 June 2018
31
December
2017
30
September
2017
Equity and liabilities
A. Equity 750,625 709,370 658,158 620,237
I. Share capital 9,804 9,804 9,804 9,804
II. Supplementary capital 640,854 640,854 548,350 548,350
III. Revaluation reserve (fund) - - - -
IV. Other reserve capital - - - -
V. Profit (loss) brought forward - - - -
VI. Net profit (loss) 92,467 51,212 92,504 54,583
VII. Other items of equity 7,500 7,500 7,500 7,500
B. Liabilities and provisions for liabilities 1,737,621 1,719,533 1,593,515 1,311,342
I. Provisions for liabilities 28,745 25,683 18,219 23,192
II. Non-current liabilities 532,241 551,581 492,041 408,781
III. Current liabilities 1,157,606 1,119,740 1,064,007 863,871
IV. Accruals and deferred revenue 19,029 22,529 19,248 15,498
Total liabilities and equity 2,488,246 2,428,903 2,251,673 1,931,579
Q3 2018 Report
Page | 20 of 28
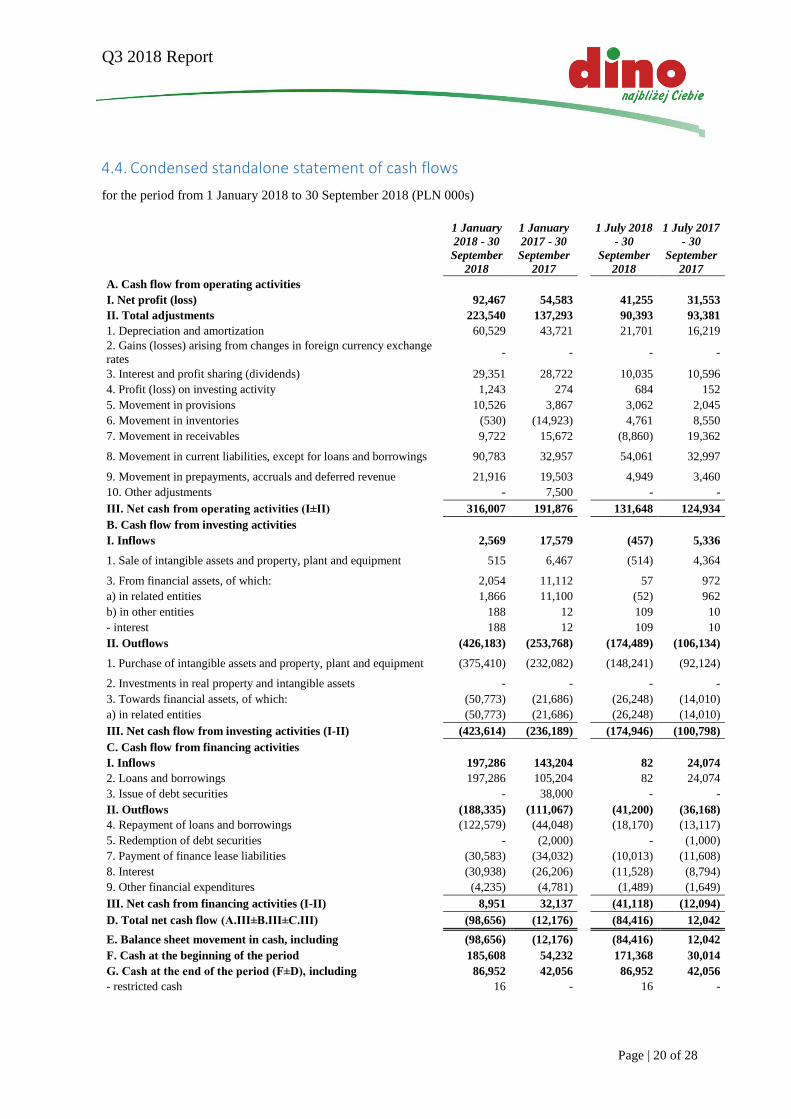
4.4. Condensed standalone statement of cash flows
for the period from 1 January 2018 to 30 September 2018 (PLN 000s)
1 January
2018 - 30
September
2018
1 January
2017 - 30
September
2017
1 July 2018
- 30
September
2018
1 July 2017
- 30
September
2017
A. Cash flow from operating activities
I. Net profit (loss) 92,467 54,583 41,255 31,553
II. Total adjustments 223,540 137,293 90,393 93,381
1. Depreciation and amortization 60,529 43,721 21,701 16,219
2. Gains (losses) arising from changes in foreign currency exchange
rates - -
- -
3. Interest and profit sharing (dividends) 29,351 28,722 10,035 10,596
4. Profit (loss) on investing activity 1,243 274 684 152
5. Movement in provisions 10,526 3,867 3,062 2,045
6. Movement in inventories (530) (14,923) 4,761 8,550
7. Movement in receivables 9,722 15,672 (8,860) 19,362
8. Movement in current liabilities, except for loans and borrowings 90,783 32,957
54,061 32,997
9. Movement in prepayments, accruals and deferred revenue 21,916 19,503 4,949 3,460
10. Other adjustments - 7,500 - -
III. Net cash from operating activities (I±II) 316,007 191,876 131,648 124,934
B. Cash flow from investing activities
I. Inflows 2,569 17,579 (457) 5,336
1. Sale of intangible assets and property, plant and equipment 515 6,467
(514) 4,364
3. From financial assets, of which: 2,054 11,112 57 972
a) in related entities 1,866 11,100 (52) 962
b) in other entities 188 12 109 10
- interest 188 12 109 10
II. Outflows (426,183) (253,768) (174,489) (106,134)
1. Purchase of intangible assets and property, plant and equipment (375,410) (232,082)
(148,241) (92,124)
2. Investments in real property and intangible assets - - - -
3. Towards financial assets, of which: (50,773) (21,686) (26,248) (14,010)
a) in related entities (50,773) (21,686) (26,248) (14,010)
III. Net cash flow from investing activities (I-II) (423,614) (236,189) (174,946) (100,798)
C. Cash flow from financing activities
I. Inflows 197,286 143,204 82 24,074
2. Loans and borrowings 197,286 105,204 82 24,074
3. Issue of debt securities - 38,000 - -
II. Outflows (188,335) (111,067) (41,200) (36,168)
4. Repayment of loans and borrowings (122,579) (44,048) (18,170) (13,117)
5. Redemption of debt securities - (2,000) - (1,000)
7. Payment of finance lease liabilities (30,583) (34,032) (10,013) (11,608)
8. Interest (30,938) (26,206) (11,528) (8,794)
9. Other financial expenditures (4,235) (4,781) (1,489) (1,649)
III. Net cash from financing activities (I-II) 8,951 32,137 (41,118) (12,094)
D. Total net cash flow (A.III±B.III±C.III) (98,656) (12,176) (84,416) 12,042
E. Balance sheet movement in cash, including (98,656) (12,176) (84,416) 12,042
F. Cash at the beginning of the period 185,608 54,232 171,368 30,014
G. Cash at the end of the period (F±D), including 86,952 42,056 86,952 42,056
- restricted cash 16 - 16 -

Q3 2018 Report
Page | 21 of 28
4.5. Condensed standalone statement of changes in equity
for the period from 1 January 2018 to 30 September 2018 (PLN 000s)
1 January
2018 - 30
September
2018
1 January
2017 - 31
December
2017
1 January
2017 - 30
September
2017
I. Equity at the beginning of the period (OB) 658,158 558,154 558,154
I.a. Equity at the beginning of the period (OB), adjusted 658,158 558,154 558,154
1. Share capital at the beginning of the period 9,804 9,804 9,804
1.1. Movement in share capital - -
-
1.2. Share capital at the end of the period 9,804 9,804 9,804
2. Supplementary capital at the beginning of the period 548,350 268,902 268,902
2.1. Changes to supplementary capital 92,504 279,448 279,448
(i) increase 92,504 279,448 279,448
- profit distribution 92,504 279,448 279,448
2.2. Balance of supplementary capital at the end of the period 640,854 548,350 548,350
3. Revaluation reserve at the beginning of the period - -
-
3.1. Changes in the revaluation reserve - - -
3.2. Revaluation reserve at the end of the period - -
-
4. Other reserve capital at the beginning of the period - - -
4.1. Change in other reserve capital - - -
4.2. Other reserve capital at the end of the period - - -
5. Profit (loss) brought forward at the beginning of the period 92,504 279,448 279,448
5.1. Profit brought forward at the beginning of the period 92,504 279,448 279,448
5.2. Profit brought forward at the beginning of the period, adjusted 92,504 279,448 279,448
(i) increase - -
-
b) decrease (92,504) (279,448) (279,448)
- distribution of profits brought forward (92,504) (279,448) (279,448)
5.3. Profit brought forward at the end of the period - - -
5.4. Loss brought forward at the beginning of the period - -
-
5.5. Loss brought forward at the beginning of the period, adjusted - - -
5.6. Losses brought forward at the end of the period - - -
5.7. Profit (loss) brought forward at the end of the period - -
-
6. Net result 92,467 92,504 54,583
a) net profit 92,467 92,504 54,583
b) net loss - - -
c) charges to profit - - -
7. Other items of equity 7,500 7,500 7,500
II. Equity at the end of the period (CB) 750,625 658,158 620,237
III. Equity after considering the proposed distribution of profits (coverage of
losses) 750,625 658,158 620,237

Q3 2018 Report
Page | 22 of 28
5. NOTES TO THE FINANCIAL STATEMENTS
5.1. General rules adopted for the preparation of the interim quarterly statements
Consolidated statements The presented interim (quarterly) condensed consolidated financial statements were prepared in accordance with:
International Accounting Standard 34 – Interim Financial Reporting and International Financial Reporting
Standards (hereinafter “IFRS”) published in the Commission Regulation (EC) no. 1725/2003 of 29
September 2003, as amended,
to the extent not regulated by the above standards – according to the requirements of the Accounting Act of
29 September 1994 (Journal of Laws of 2016, Item 1047 as amended) and executive regulations issued on
its basis,
pursuant to the requirements set forth in the Finance Minister’s Regulation of 19 February 2009 on the
current and periodic information transmitted by securities issuers (Journal of Laws of 2009, No. 33 Item
259).
The accounting policies are the same as those used to prepare the consolidated financial statements for the year
2017.
These interim (quarterly) condensed consolidated financial statements have been prepared based on the
assumption that the Group companies will continue as a going concern in the foreseeable future, except for
Centrum Wynajmu Nieruchomości sp. z o.o. Marketing 2 SKA (in liquidation) and Viterna Holdings Ltd., which
are currently being liquidated.
The interim (condensed) consolidated financial statements for the period from 1 January 2018 to 30 September
2018 were prepared in Polish zloty, rounded to one thousand zloty (unless otherwise stated).
Standalone financial statements The presented interim (quarterly) condensed standalone financial statements were prepared according to the
following:
provisions of the Accounting Act of 29 September 1994 (Journal of Laws of 2016, Item 1047 as amended)
and executive regulations issued on its basis,
pursuant to the requirements set forth in the Finance Minister’s Regulation of 19 February 2009 on the
current and periodic information transmitted by securities issuers (Journal of Laws of 2009, No. 33 Item
259).
The accounting policies are the same as those used to prepare the standalone financial statements for the year
2017.
These interim (quarterly) standalone financial statements have been prepared with the assumption that the
Company will continue its business as a going concern in the foreseeable future.
The interim (condensed) standalone financial statements for the period from 1 January 2018 to 30 September
2018 were prepared in Polish zloty, rounded to one thousand zloty (unless otherwise stated).
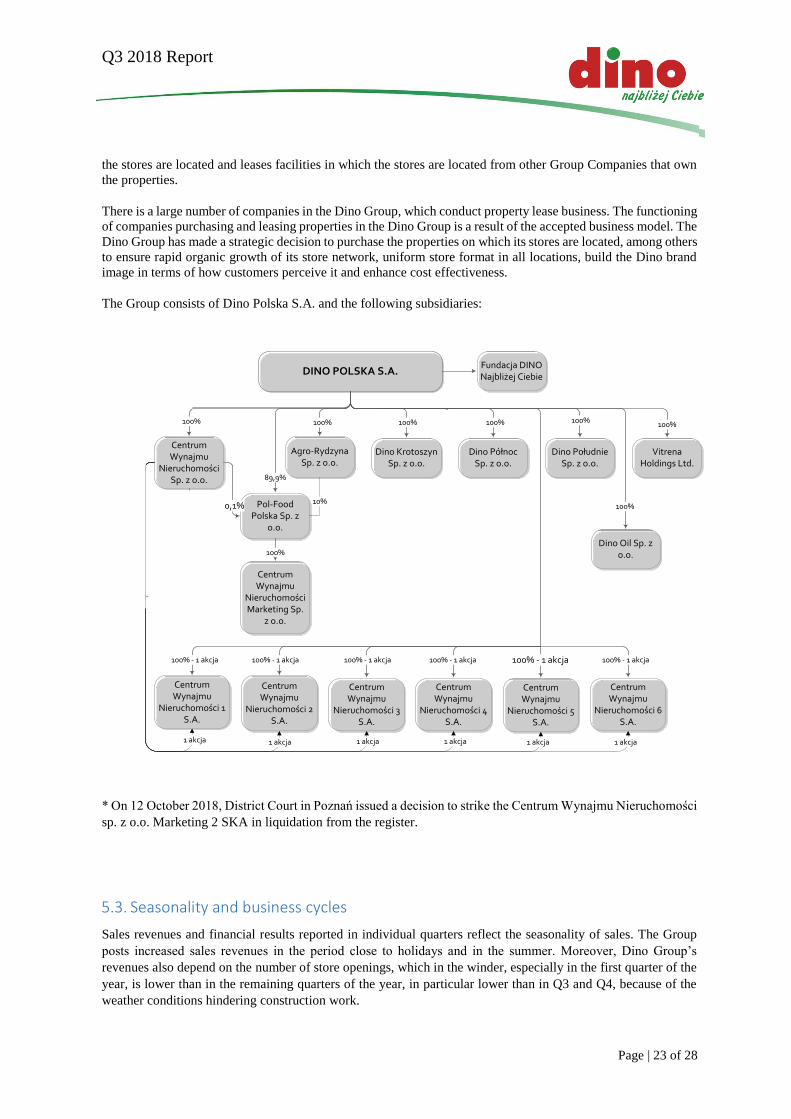
5.2. Group Overview
The Company is the parent company of the Dino Group. The Company conducts the operating activity including
the management of Dino store network. The Company manages, among others, the logistics of supply of products
to the stores, sales, product range offered in the stores and supports other Group Companies in the execution of
investment processes related to the selection and purchase of land on which new stores will be built and also
manages the new store construction process itself. The Company also owns some of the real properties on which
Q3 2018 Report
Page | 23 of 28
the stores are located and leases facilities in which the stores are located from other Group Companies that own
the properties.
There is a large number of companies in the Dino Group, which conduct property lease business. The functioning
of companies purchasing and leasing properties in the Dino Group is a result of the accepted business model. The
Dino Group has made a strategic decision to purchase the properties on which its stores are located, among others
to ensure rapid organic growth of its store network, uniform store format in all locations, build the Dino brand
image in terms of how customers perceive it and enhance cost effectiveness.
The Group consists of Dino Polska S.A. and the following subsidiaries:
* On 12 October 2018, District Court in Poznań issued a decision to strike the Centrum Wynajmu Nieruchomości
sp. z o.o. Marketing 2 SKA in liquidation from the register.
5.3. Seasonality and business cycles
Sales revenues and financial results reported in individual quarters reflect the seasonality of sales. The Group
posts increased sales revenues in the period close to holidays and in the summer. Moreover, Dino Group’s
revenues also depend on the number of store openings, which in the winder, especially in the first quarter of the
year, is lower than in the remaining quarters of the year, in particular lower than in Q3 and Q4, because of the
weather conditions hindering construction work.
DINO POLSKA S.A.
Centrum Wynajmu
Nieruchomości Sp. z o.o.
Agro-RydzynaSp. z o.o.
Dino Północ Sp. z o.o.
Dino PołudnieSp. z o.o.
Dino KrotoszynSp. z o.o.
FIZ Sezam XIw likwidacji*
Dino Oil Sp. z o.o.
100%100%100%
100% certyfikatw
100%100%
100%
komplementariusz
Vitrena Holdings Ltd.
100%
Centrum Wynajmu
Nieruchomości Sp. z o.o.
Marketing 2 SKA
Fundacja DINO Najbliżej Ciebie
Pol-Food Polska Sp. z
o.o.
89,9%
0,1%
Centrum Wynajmu
Nieruchomości Marketing Sp.
z o.o.
100%
100% - 1 akcja
Centrum Wynajmu
Nieruchomości 5 S.A.
Centrum Wynajmu
Nieruchomości 4 S.A.
Centrum Wynajmu
Nieruchomości 3 S.A.
Centrum Wynajmu
Nieruchomości 2 S.A.
Centrum Wynajmu
Nieruchomości 1 S.A.
Centrum Wynajmu
Nieruchomości 6 S.A.
100% akcji
100% - 1 akcja 100% - 1 akcja 100% - 1 akcja 100% - 1 akcja 100% - 1 akcja
10%
1 akcja 1 akcja 1 akcja 1 akcja 1 akcja 1 akcja

Q3 2018 Report
Page | 24 of 28
5.4. Other information
Non-recurring amounts and events
No non-recurring events transpired in the Dino Group’s business in the period from 1 January 2018 to 30
September 2018.
Impairment losses In the period covered by this report, the Group did not recognize any impairment losses for inventories.
Consolidated financial data
for the period from 1 January 2018 to 30 September 2018
(PLN 000s)
30 September
2018 Change
31 December
2017
Impairment losses on receivables 327 (124) 451
Unconsolidated financial data
for the period from 1 January 2018 to 30 September 2018
(PLN 000s)
30 September
2018 change
31 December
2017
Impairment losses on receivables 283 (124) 407
Information on the recognition, increase, use and reversal of provisions Consolidated financial data
for the period from 1 January 2018 to 30 September 2018
(PLN 000s)
30 September
2018 change
31 December
2017
Deferred tax liability 11,337 7,842 3,495
Provision for pension and similar benefits 1,581 - 1,581
12,918 7,842 5,076
Unconsolidated financial data
for the period from 1 January 2018 to 30 September 2018
(PLN 000s)
30 September
2018 change
31 December
2017
Deferred tax liability 27,375 10,526 16,849
Provision for pension and similar benefits 1,370 - 1,370
28,745 10,526 18,219
Q3 2018 Report
Page | 25 of 28
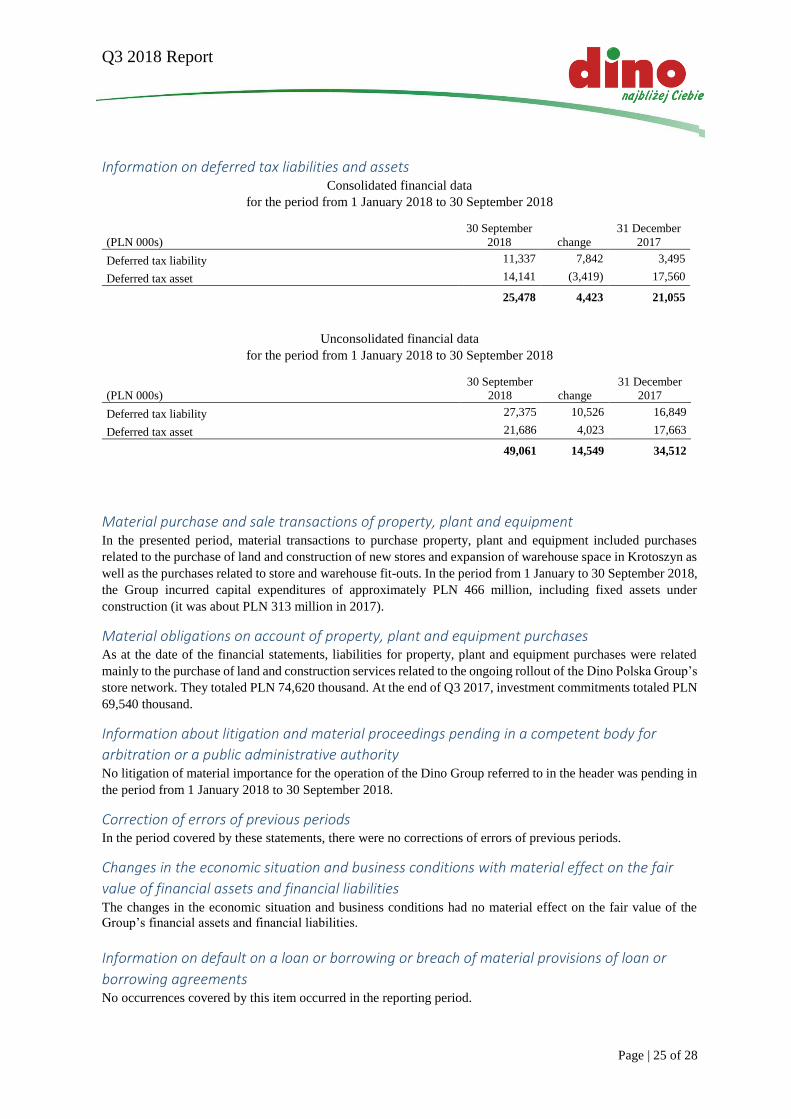
Information on deferred tax liabilities and assets Consolidated financial data
for the period from 1 January 2018 to 30 September 2018
(PLN 000s)
30 September
2018 change
31 December
2017
Deferred tax liability 11,337 7,842 3,495
Deferred tax asset 14,141 (3,419) 17,560
25,478 4,423 21,055
Unconsolidated financial data
for the period from 1 January 2018 to 30 September 2018
(PLN 000s)
30 September
2018 change
31 December
2017
Deferred tax liability 27,375 10,526 16,849
Deferred tax asset 21,686 4,023 17,663
49,061 14,549 34,512
Material purchase and sale transactions of property, plant and equipment In the presented period, material transactions to purchase property, plant and equipment included purchases
related to the purchase of land and construction of new stores and expansion of warehouse space in Krotoszyn as
well as the purchases related to store and warehouse fit-outs. In the period from 1 January to 30 September 2018,
the Group incurred capital expenditures of approximately PLN 466 million, including fixed assets under
construction (it was about PLN 313 million in 2017).
Material obligations on account of property, plant and equipment purchases As at the date of the financial statements, liabilities for property, plant and equipment purchases were related
mainly to the purchase of land and construction services related to the ongoing rollout of the Dino Polska Group’s
store network. They totaled PLN 74,620 thousand. At the end of Q3 2017, investment commitments totaled PLN
69,540 thousand.
Information about litigation and material proceedings pending in a competent body for
arbitration or a public administrative authority No litigation of material importance for the operation of the Dino Group referred to in the header was pending in
the period from 1 January 2018 to 30 September 2018.
Correction of errors of previous periods In the period covered by these statements, there were no corrections of errors of previous periods.
Changes in the economic situation and business conditions with material effect on the fair
value of financial assets and financial liabilities The changes in the economic situation and business conditions had no material effect on the fair value of the
Group’s financial assets and financial liabilities.
Information on default on a loan or borrowing or breach of material provisions of loan or
borrowing agreements No occurrences covered by this item occurred in the reporting period.

Q3 2018 Report
Page | 26 of 28
Information on related party transactions Related party transactions were routine in nature and concluded on the arm’s length basis, at prices no different
from the prices used in transactions between unrelated parties. Intra-Group transactions were eliminated in the
consolidation process.
Information on changes in the fair value measurement methodology for financial instruments
measured at fair value and changes in the classification of financial instruments In this reporting period, no changes were made to the fair value measurement methodology and no changes were
made to the classification of financial assets resulting from the change of purpose or use of such assets.
Information on the issue, redemption and repayment of non-equity and equity securities No events covered by this item occurred in the reporting period.
Information on dividend paid (or declared), in total and per share, for common and
preference shares During the reporting period, Dino Polska did not pay out a dividend.
Events taking place after the date of the quarterly condensed financial statements, which
were not included in the statements but may materially affect the issuer’s future financial
results By the date of these financial statements, no events occurred that may materially affect the Group’s future
financial results.
Information on changes in contingent liabilities or contingent assets that have taken place
since the end of the previous financial year No change in contingent assets was recorded in the reporting period. At the end of the reporting period, the Group
had contingent liabilities in the amount of PLN 324,574 thousand.
Other information that can materially affect the assessment of the issuer’s assets, financial
position and financial result No events occurred in the reporting period that could materially affect the assessment of the Group’s assets,
financial position and financial result.

Q3 2018 Report
Page | 27 of 28
6. OTHER INFORMATION Description of changes in the organization of the issuer’s group On 12 October 2018, District Court in Poznań issued a decision to strike the Centrum Wynajmu Nieruchomości
sp. z o.o. Marketing 2 SKA in liquidation from the register.
On 26 October 2018 r. Dino bought from its subsidiaries: Agro-Rydzyna Sp. z o.o. and Centrum Wynajmu
Nieruchomości Sp. z o.o. the shares they held in Pol-Food Polska Sp. z o.o., 0.1% and 10% of the shares,
respectively, thereby becoming the sole shareholder of Pol-Food Polska Sp. z o.o.
On 26 October the Management Board of Dino Polska made a decision regarding its intent of merging Dino Polska
with Pol-Food Polska Sp. z o.o., a subsidiary of Dino in which Dino holds a 100% equity stake in its share capital.
Dino Polska’s shareholders will make the merger decision at the Extraordinary Shareholder Meeting convened to
take place on 28 November 2018.
Position of the Management Board on possibility of achieving the previously published
financial performance forecasts The Company’s Management Board did not publish any forecasts for 2018.
Sureties, loans, borrowings or guarantees extended by the issuer or its subsidiary No events covered by this item occurred in the reporting period.
Other information During the reporting period and up to the report’s date of publication, no other material events occurred that would
require disclosure.
Q3 2018 Report
Page | 28 of 28
SIGNATURES OF THE MANAGEMENT BOARD MEMBERS
Szymon Piduch – President of the Management Board …………………………….…………
Michał Krauze – Management Board Member ………………………………………
Krotoszyn, 8 November 2018