quarterly reports for the period ending 30 june 2018
TRANSCRIPT

Chairperson: Dr C Mini Acting Chief Executive & Registrar: Dr S Kabane Block A, Eco Glades 2 Office Park, 420 Witch-Hazel Avenue, Eco Park, Centurion, 0157
Tel: 012 431 0500 Fax: 086 206 8260 Customer Care: 0861 123 267 [email protected] www.medicalschemes.com
Quarterly Reports for the Period ending 30 June 2018

Page 2
Table of Contents
INTRODUCTION ................................................................................................................................................................................. 3
REGULATION 29: MINIMUM ACCUMULATED FUNDS ................................................................................................................... 6
SOLVENCY RATIO GRAPH .............................................................................................................................................................. 7
PRESCRIBED SOLVENCY LEVELS AND NUMBER OF BENEFICIARIES GRAPH ....................................................................... 8
NET ASSETS PER REGULATION 29 GRAPH .................................................................................................................................. 9
STATEMENT OF COMPREHENSIVE INCOME ............................................................................................................................... 10
STATEMENT OF FINANCIAL POSITION ........................................................................................................................................ 11
NUMBER OF BENEFICIARIES GRAPH .......................................................................................................................................... 13
DETAILED FINANCIAL INFORMATION: ACTUAL V BUDGET ..................................................................................................... 14
TOTAL NON-HEALTHCARE EXPENDITURE GRAPH ................................................................................................................... 16
NET RELEVANT HEALTHCARE EXPENDITURE RATIO: RISK BENEFITS GRAPH ................................................................... 17
NET RELEVANT HEALTHCARE EXPENDITURE RATIO: SEASONALITY ................................................................................... 18

Page 3
INTRODUCTION This report represents the results of the analysis of the quarterly statutory returns for the period ended 30 June 2018. Budget information for the second quarter of 2018 is also provided for comparative purposes. This report reflects consolidated industry data only, as data on an individual scheme level has not been audited and can therefore not be made available to the public. The Council for Medical Schemes (CMS) provides no assurance on the reliability of budget figures contained in this report. It should also be noted that information for Community Medical Aid Scheme (COMMED) has been excluded from any comparison data from 2017.
Page 4
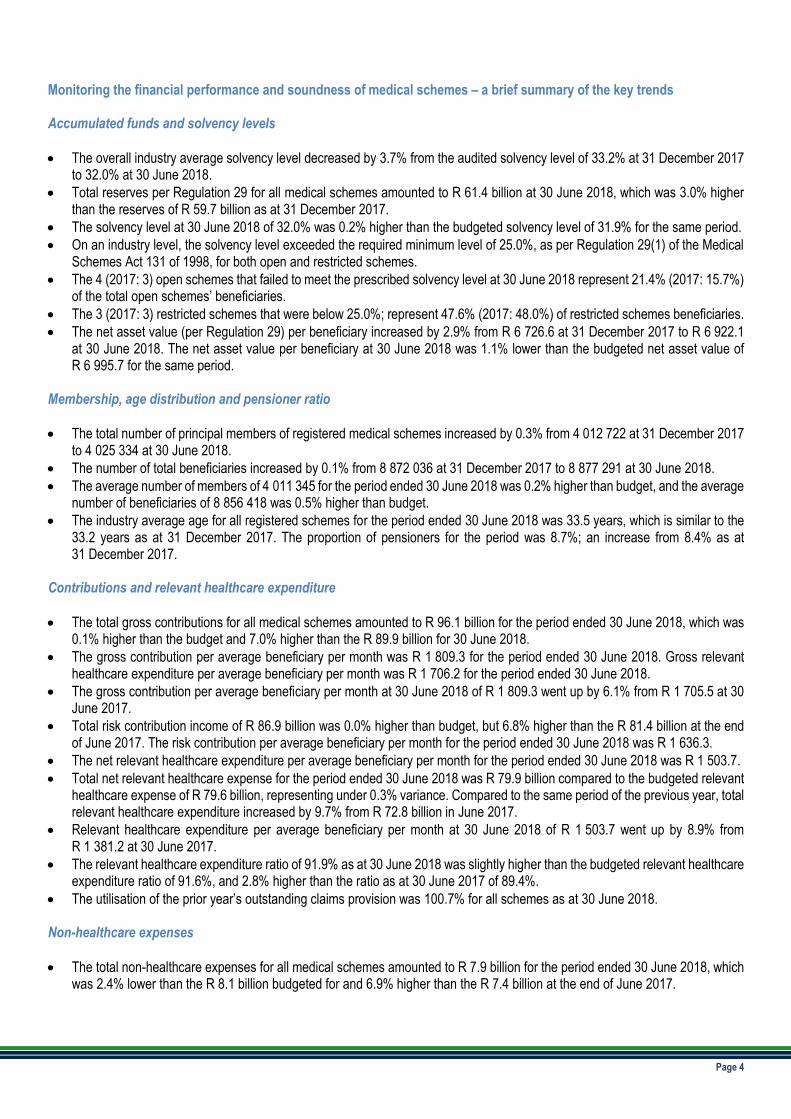
Monitoring the financial performance and soundness of medical schemes – a brief summary of the key trends Accumulated funds and solvency levels
• The overall industry average solvency level decreased by 3.7% from the audited solvency level of 33.2% at 31 December 2017 to 32.0% at 30 June 2018.
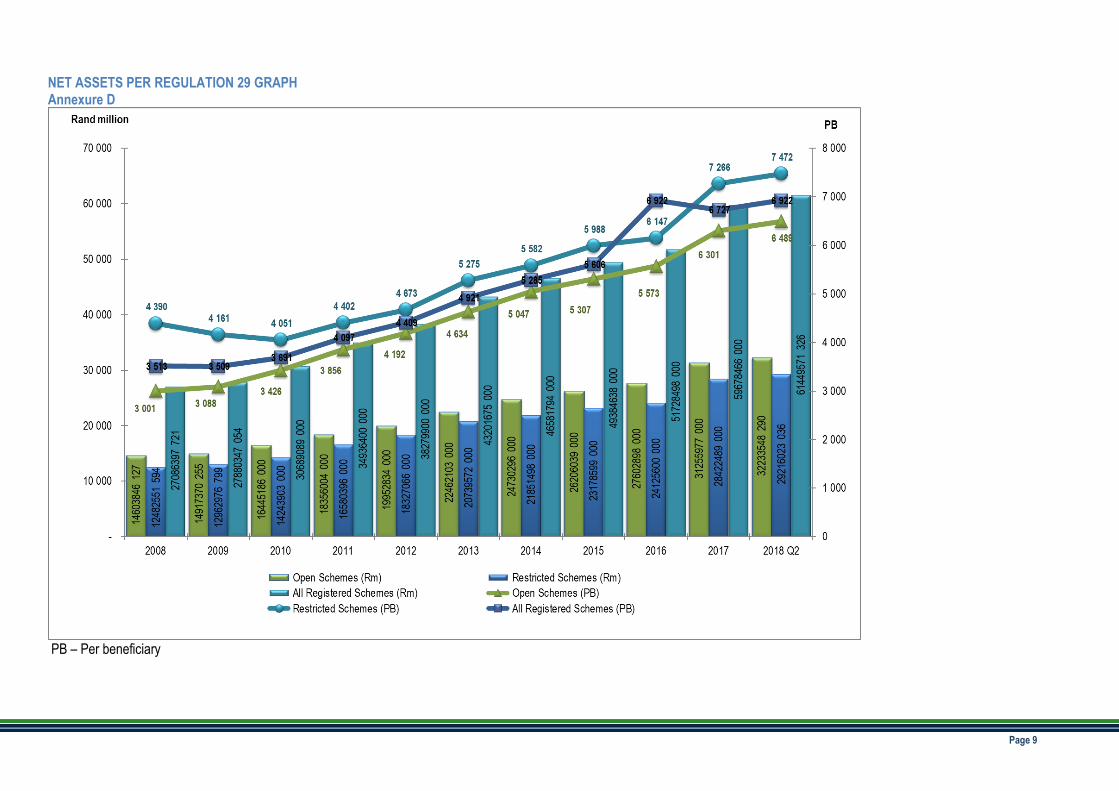
• Total reserves per Regulation 29 for all medical schemes amounted to R 61.4 billion at 30 June 2018, which was 3.0% higher than the reserves of R 59.7 billion as at 31 December 2017.
• The solvency level at 30 June 2018 of 32.0% was 0.2% higher than the budgeted solvency level of 31.9% for the same period.
• On an industry level, the solvency level exceeded the required minimum level of 25.0%, as per Regulation 29(1) of the Medical Schemes Act 131 of 1998, for both open and restricted schemes.
• The 4 (2017: 3) open schemes that failed to meet the prescribed solvency level at 30 June 2018 represent 21.4% (2017: 15.7%) of the total open schemes’ beneficiaries.
• The 3 (2017: 3) restricted schemes that were below 25.0%; represent 47.6% (2017: 48.0%) of restricted schemes beneficiaries.
• The net asset value (per Regulation 29) per beneficiary increased by 2.9% from R 6 726.6 at 31 December 2017 to R 6 922.1 at 30 June 2018. The net asset value per beneficiary at 30 June 2018 was 1.1% lower than the budgeted net asset value of R 6 995.7 for the same period.
Membership, age distribution and pensioner ratio
• The total number of principal members of registered medical schemes increased by 0.3% from 4 012 722 at 31 December 2017 to 4 025 334 at 30 June 2018.
• The number of total beneficiaries increased by 0.1% from 8 872 036 at 31 December 2017 to 8 877 291 at 30 June 2018.
• The average number of members of 4 011 345 for the period ended 30 June 2018 was 0.2% higher than budget, and the average number of beneficiaries of 8 856 418 was 0.5% higher than budget.
• The industry average age for all registered schemes for the period ended 30 June 2018 was 33.5 years, which is similar to the 33.2 years as at 31 December 2017. The proportion of pensioners for the period was 8.7%; an increase from 8.4% as at 31 December 2017.
Contributions and relevant healthcare expenditure
• The total gross contributions for all medical schemes amounted to R 96.1 billion for the period ended 30 June 2018, which was 0.1% higher than the budget and 7.0% higher than the R 89.9 billion for 30 June 2018.
• The gross contribution per average beneficiary per month was R 1 809.3 for the period ended 30 June 2018. Gross relevant healthcare expenditure per average beneficiary per month was R 1 706.2 for the period ended 30 June 2018.
• The gross contribution per average beneficiary per month at 30 June 2018 of R 1 809.3 went up by 6.1% from R 1 705.5 at 30 June 2017.
• Total risk contribution income of R 86.9 billion was 0.0% higher than budget, but 6.8% higher than the R 81.4 billion at the end of June 2017. The risk contribution per average beneficiary per month for the period ended 30 June 2018 was R 1 636.3.
• The net relevant healthcare expenditure per average beneficiary per month for the period ended 30 June 2018 was R 1 503.7.
• Total net relevant healthcare expense for the period ended 30 June 2018 was R 79.9 billion compared to the budgeted relevant healthcare expense of R 79.6 billion, representing under 0.3% variance. Compared to the same period of the previous year, total relevant healthcare expenditure increased by 9.7% from R 72.8 billion in June 2017.
• Relevant healthcare expenditure per average beneficiary per month at 30 June 2018 of R 1 503.7 went up by 8.9% from R 1 381.2 at 30 June 2017.
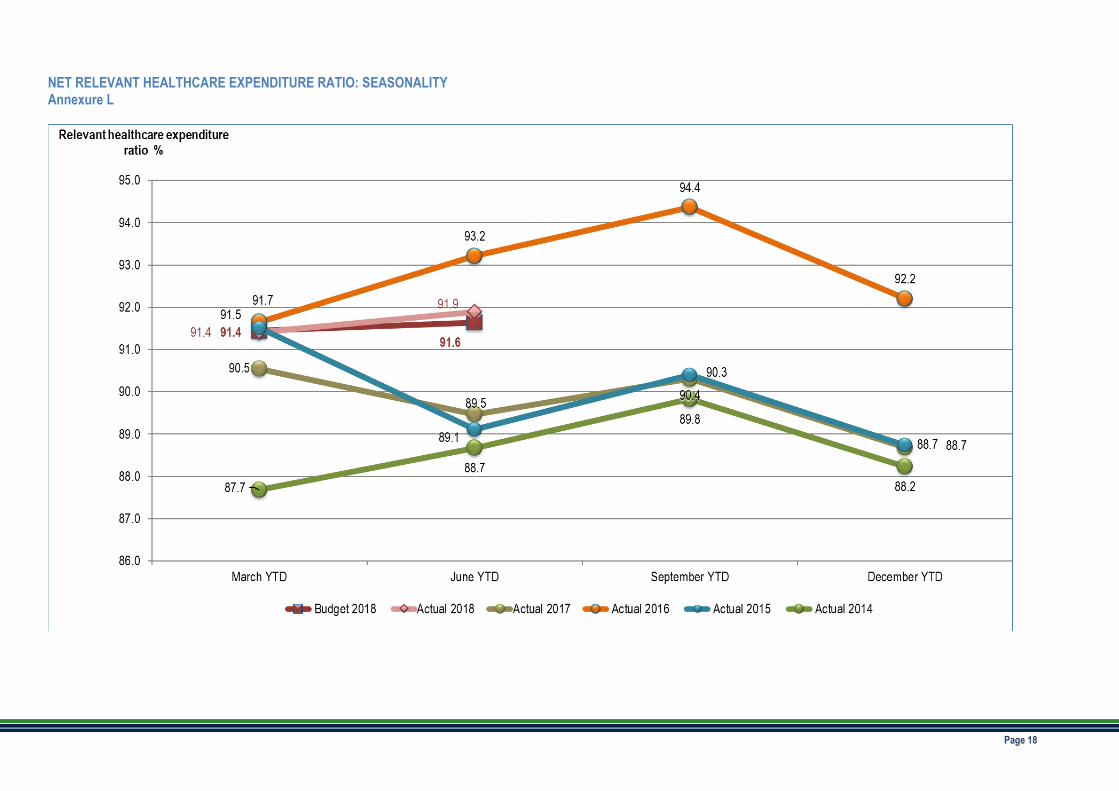
• The relevant healthcare expenditure ratio of 91.9% as at 30 June 2018 was slightly higher than the budgeted relevant healthcare expenditure ratio of 91.6%, and 2.8% higher than the ratio as at 30 June 2017 of 89.4%.
• The utilisation of the prior year’s outstanding claims provision was 100.7% for all schemes as at 30 June 2018. Non-healthcare expenses
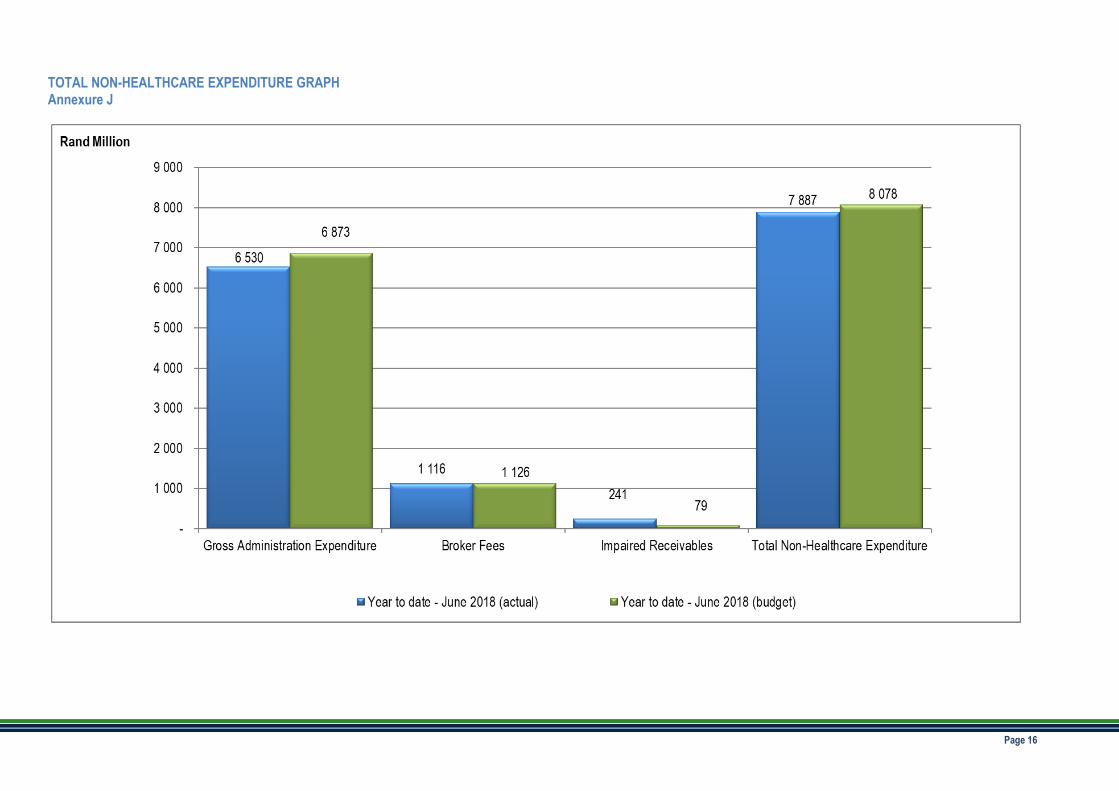
• The total non-healthcare expenses for all medical schemes amounted to R 7.9 billion for the period ended 30 June 2018, which was 2.4% lower than the R 8.1 billion budgeted for and 6.9% higher than the R 7.4 billion at the end of June 2017.

Page 5
• The non-healthcare expense per average beneficiary per month for the period ended 30 June 2018 of R 148.4 was 6.1% higher than the industry average of R 139.9 at 30 June 2017, and 4.9% higher than the industry average of R 141.5 of as 31 December 2017.
• Non-healthcare expenses, when expressed as a percentage of risk contribution income, decreased from 9.2% at 31 December 2017 to 9.1% at 30 June 2018.
• At 30 June 2018, the industry averages of the various components of non-healthcare expenses expressed as a percentage of total non-healthcare expenses were as follows:
June ‘18 Dec ‘17
- Administration expenses 82.8% 83.7%
- Broker service fees (including distribution costs and broker fees) 14.1% 14.5%
- Net impairment losses: trade and other receivables 3.1% 1.8%
Operating results
• Registered medical schemes incurred a net healthcare deficit (before taking investment and other income into account) of R 841.4 million compared to a budgeted deficit of 812.6 million at 30 June 2018. The total net healthcare results vary by 3.6% compared to budget.
• Open schemes incurred a net healthcare deficit (before taking investment and other income into account) of R 522.1 million compared to a budgeted surplus of R 208.6 million, whereas restricted schemes incurred a net healthcare deficit of R 319.4 million compared to a budgeted deficit of R 1 021.1 million.
• The inclusion of investment and other income resulted in all registered schemes making a surplus of R 1 309.1 million at 30 June 2018 compared to a budgeted surplus of R 1 424.3 million, which represents an actual to budget variance of 8.1%.
• In the 2017 annual results all schemes incurred a net healthcare surplus of R 3.4 billion and an overall net surplus of R 8.9 billion.
Investments
• The current assets to current liabilities ratio for open schemes at quarter end of 30 June 2018 is 2.4 (2016: 2.4), whereas for restricted schemes it is 2.4 (2017: 2.1).
• The total assets to total liabilities ratio for open and restricted schemes is 3.2 (2016: 3.1) and 4.0 (2016: 3.8) respectively.

Page 6
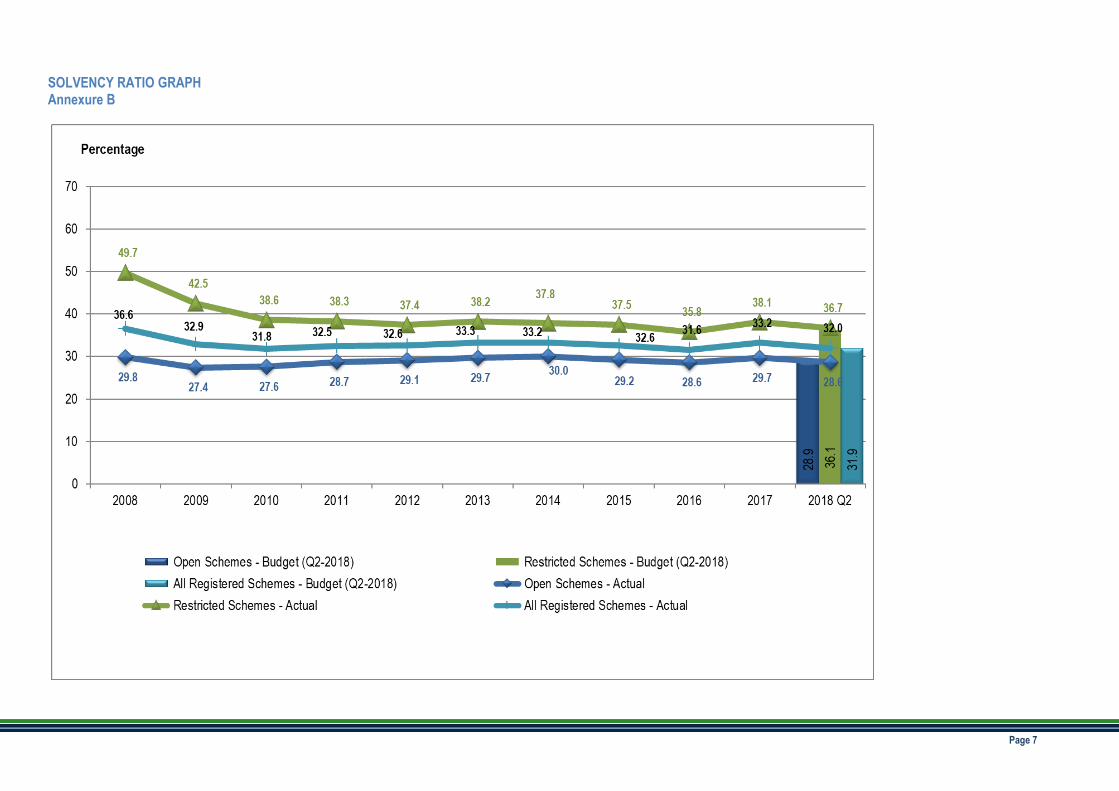
REGULATION 29: MINIMUM ACCUMULATED FUNDS Annexure A (SOLVENCY RATIO) INDUSTRY AVERAGE:
2008 2009 2010 2011 2012 2013 2014 2015 2016 2017 %
Change 2017
2017 Quarter 2 Actual
2018 Quarter 2 Actual
2018 Quarter 2 Budget
% Variance
Actual 2018 vs Budget
2018
Open schemes 29.8% 27.4% 27.6% 28.7% 29.1% 29.7% 30.0% 29.2% 28.6% 29.7% 3.8% 28.6% 28.6% 28.9% -1.1%
Restricted schemes 49.7% 42.5% 38.6% 38.3% 37.4% 38.2% 37.8% 37.5% 35.8% 38.1% 6.4% 33.7% 36.7% 36.1% 1.5%
All registered schemes 36.6% 32.9% 31.8% 32.5% 32.6% 33.3% 33.2% 32.6% 31.6% 33.2% 5.1% 29.4% 32.0% 31.9% 0.2%
Page 7
SOLVENCY RATIO GRAPH Annexure B

Page 8
PRESCRIBED SOLVENCY LEVELS AND NUMBER OF BENEFICIARIES GRAPH Annexure C
Page 9
NET ASSETS PER REGULATION 29 GRAPH Annexure D
PB – Per beneficiary

Page 10
STATEMENT OF COMPREHENSIVE INCOME for the period ended 30 June 2018 Annexure E
Income statement OPEN SCHEMES RESTRICTED SCHEMES
TOTAL REGISTERED SCHEMES
Average members 2 368 840 1 642 505 4 011 345
Average beneficiaries 4 952 854 3 903 564 8 856 418
Average age Years 35.2 31.4 32.0
Pensioner ratio (65+ years) % 10.3% 6.7% 8.7%
No. of dependants per member 1.1 1.4 1.2
Gross contributions (risk + PMSA) R'000 56 375 114 39 769 457 96 144 571
Gross relevant healthcare (gross +PMSA)(Note a) 53 483 466 37 182 246 90 665 712
Gross Administration Expenses (risk + PMSA) 4 392 914 2 136 831 6 529 745
Broker service fees (including distributions costs) 1 060 899 54 994 1 115 893
Net impairment losses: trade and other receivables
R'000 177 471 63 879 241 350
Net healthcare results (522 139) (319 354) (841 493)
Surplus/ (deficit) 710 090 599 026 1 309 116
NOTES: a) Including accredited managed care: healthcare benefits as well as the results of risk transfer arrangements. * PMSA = Personal Medical Savings Account
Page 11
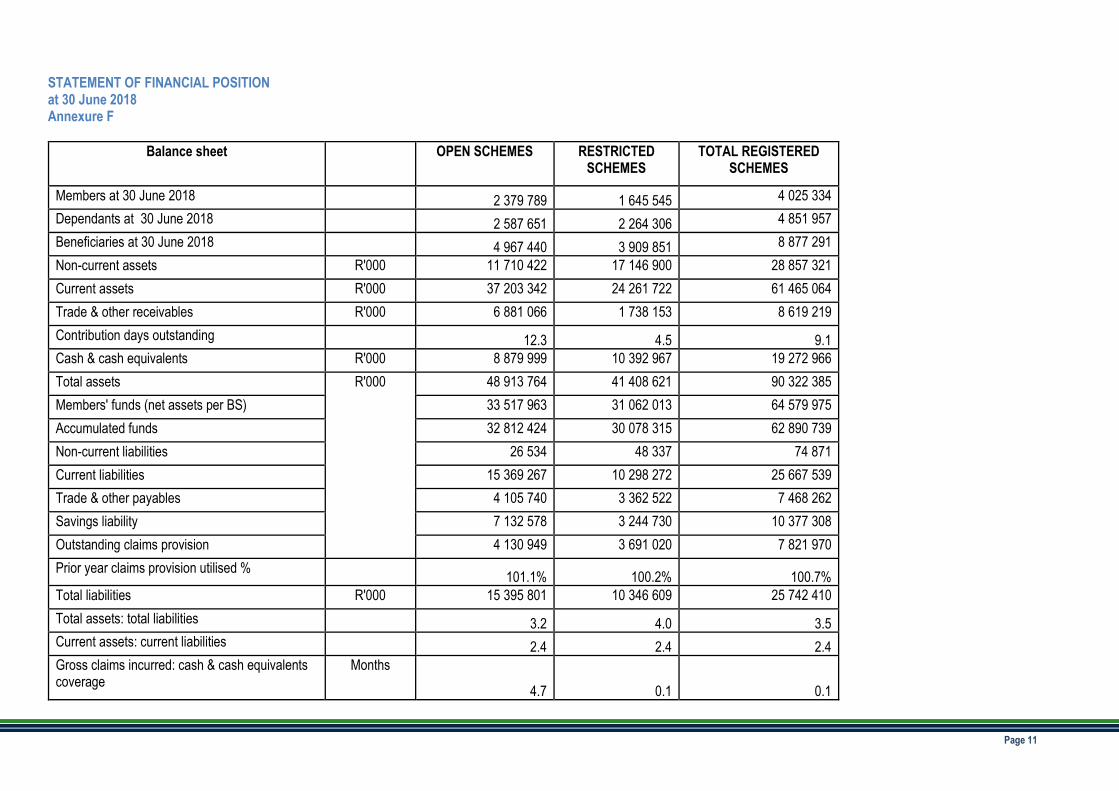
STATEMENT OF FINANCIAL POSITION at 30 June 2018 Annexure F
Balance sheet OPEN SCHEMES RESTRICTED SCHEMES
TOTAL REGISTERED SCHEMES
Members at 30 June 2018 2 379 789 1 645 545 4 025 334
Dependants at 30 June 2018 2 587 651 2 264 306 4 851 957
Beneficiaries at 30 June 2018 4 967 440 3 909 851 8 877 291
Non-current assets R'000 11 710 422 17 146 900 28 857 321
Current assets R'000 37 203 342 24 261 722 61 465 064
Trade & other receivables R'000 6 881 066 1 738 153 8 619 219
Contribution days outstanding 12.3 4.5 9.1
Cash & cash equivalents R'000 8 879 999 10 392 967 19 272 966
Total assets R'000 48 913 764 41 408 621 90 322 385
Members' funds (net assets per BS) 33 517 963 31 062 013 64 579 975
Accumulated funds 32 812 424 30 078 315 62 890 739
Non-current liabilities 26 534 48 337 74 871
Current liabilities 15 369 267 10 298 272 25 667 539
Trade & other payables 4 105 740 3 362 522 7 468 262
Savings liability 7 132 578 3 244 730 10 377 308
Outstanding claims provision 4 130 949 3 691 020 7 821 970
Prior year claims provision utilised % 101.1% 100.2% 100.7%
Total liabilities R'000 15 395 801 10 346 609 25 742 410
Total assets: total liabilities
3.2 4.0 3.5
Current assets: current liabilities
2.4 2.4 2.4
Gross claims incurred: cash & cash equivalents coverage
Months
4.7 0.1 0.1

Page 12
Net assets per Regulation 29 R'000 32 233 548 29 216 023 61 449 571
Solvency ratio % 28.6 36.7 32.0
NOTES: * In respect of trade and other receivable outstanding days, the denominator used is annualised gross contributions. * In respect of prior year claims provision utilised = prior year payments / provision at the beginning of the year. * We do not express an opinion on the accuracy of the split between current and non-current assets, and current and non-current liabilities.

Page 13
NUMBER OF BENEFICIARIES GRAPH Annexure G

Page 14
DETAILED FINANCIAL INFORMATION: ACTUAL V BUDGET for the period ended 30 June 2018 Annexure H
Actual vs Budget OPEN SCHEMES RESTRICTED SCHEMES TOTAL REGISTERED SCHEMES
Actual Budget % variance
Actual Budget % variance
Actual Budget % variance
Average members 2 368 840 2 373 308 -0.2 1 642 505 1 631 702 0.7 4 011 345 4 005 010 0.2
Average beneficiaries 4 952 854 4 973 251 -0.4 3 903 564 3 839 796 1.7 8 856 418 8 813 047 0.5
Gross Contribution Income (GCI)
R’000 56 375 114 56 610 555 -0.4 39 769 457 39 467 704 0.8 96 144 571 96 078 258 0.1
Risk Contribution Income (RCI) 48 965 381 49 226 472 -0.5 37 984 182 37 702 847 0.7 86 949 563 86 929 318 0.0
Gross relevant healthcare (incl. PMSA & managed care claims) (Note a) 53 483 466 NA 0.0 37 182 246 NA 0.0 90 665 712 NA 0.0
Relevant healthcare incurred (incl. managed care claims) (Note a) 43 856 237 43 351 451 1.2 36 047 832 36 312 662 -0.7 79 904 069 79 664 113 0.3
Gross (incl. PMSA)/net non-health expenses
5 631 283 5 666 492 -0.6 2 255 704 2 411 297 -6.5 7 886 988 8 077 788 -2.4
Net healthcare results (522 139) 208 529 -350.4 (319 354) (1 021 112) -68.7 (841 493) (812 584) 3.6
Surplus/(deficit) R’000 710 090 1 386 283 -48.8 599 026 38 052 1474.2 1 309 116 1 424 335 -8.1
Quarter end reserve position (per Regulation 29) (Note c)
32 233 548 32 774 690 -1.7 29 216 023 28 621 399 2.1 61 449 571 61 396 089 0.1
NOTES: a) Including accredited managed care: healthcare benefits as well as the results for risk transfer arrangements. b) Net non-healthcare expenses = administration expenses, broker costs (including broker fees and distribution fees) and net impairment losses. c) The budgeted amount was calculated by using the budgeted accumulated funds per Statement of financial position as basis, and adjusting it for the following actual amounts as at 30 June 2018: cumulative net gains on disposal of investments and property plant and equipment included in the Statement of comprehensive income, specific assets encumbered for third-party liabilities and sub-ordinated loans as approved by the Council. * PMSA = Personal Medical Savings Account * GCI = Gross Contribution Income * RCI = Risk Contribution Income * N/A = information not available

Page 15
DETAILED FINANCIAL INFORMATION: ACTUAL vs PRIOR YEAR for the period ended 30 June 2018 Annexure I
Actual vs prior year OPEN SCHEMES RESTRICTED SCHEMES TOTAL REGISTERED SCHEMES
2018 2017 % variance
2018 2017 % variance
2018 2017 % variance
Average members 2 368 840 2 336 352 1.4 1 642 505 1 648 753 -0.4 4 011 345 3 985 105 0.7
Average beneficiaries 4 952 854 4 872 400 1.7 3 903 564 3 912 314 -0.2 8 856 418 8 784 714 0.8
Gross Contribution Income (GCI) R’000 56 375 114 52 646 264 7.1
39 769 457 37 248 402 6.8 96 144 571 89 894 666 7.0
Risk Contribution Income (RCI) 48 965 381 45 733 580 7.1
37 984 182 35 664 082 6.5 86 949 563 81 397 662 6.8
Gross relevant healthcare (incl. PMSA & managed care claims) (Note a) 53 483 466 48 395 132 10.5
37 182 246 35 159 651 5.8 90 665 712 83 554 783 8.5
Relevant healthcare incurred (incl. managed care claims) (Note a)
43 856 237 39 357 179 11.4 36 047
832 33 448 808 7.8 79 904 069 72 805 987 9.7
Gross (incl. PMSA)/net non-health expenses
5 631 283 5 217 904 7.9 2 255 704 2 156 959 4.6 7 886 988 7 374 864 6.9
Net healthcare results (522 139) 1 158 496 -145.1 (319 354) 58 315 -647.6 (841 493) 1 216 811 -169.2
Surplus/(deficit) R’000 710 090 2 305 648 -69.2 599 026 1 044 473 -42.6 1 309 116 3 350 121 -60.9
Quarter end reserve position (per Regulation 29)
32 233 548 29 840 794 8.0 29 216
023 24 908 765 17.3 61 449 571 54 749 559 12.2
NOTES: a) Including results of risk transfer arrangements. b) Gross non-healthcare expenses = administration expenses, broker costs (including broker fees and distribution fees) and net impairment losses. * PMSA = Personal Medical Savings Account * GCI = Gross Contribution Income * RCI = Risk Contribution Income
Page 16
TOTAL NON-HEALTHCARE EXPENDITURE GRAPH Annexure J

Page 17
NET RELEVANT HEALTHCARE EXPENDITURE RATIO: RISK BENEFITS GRAPH Annexure K
PABPM = per average beneficiary per month
Page 18
NET RELEVANT HEALTHCARE EXPENDITURE RATIO: SEASONALITY Annexure L