quarterly sector statistics report - … sector statistics report 2014-15.pdf3.3 international...
TRANSCRIPT

1
QUARTERLY SECTOR STATISTICS REPORT
THIRD QUARTER OF THE FINANCIAL YEAR 2014/15
(JAN-MAR 2015)
Direct any queries on this report to:
Director/Competition, Tariffs and Market Analysis
Tel: + 254-703 042000, +254 - 731 172000
Email: [email protected]
Website: www.ca.go.ke
Disclaimer:
Although every effort has been made to ensure accuracy of the data contained in this report, the
Authority is not liable for inaccuracies in any of the information contained in this report, which
is contingent upon the operators/service providers’ compliance returns.

2
TABLE OF CONTENTS
LIST OF ABBREVIATIONS ............................................................................................. 5
I. PRELIMINARY NOTES ............................................................................................ 6
II. IN SUMMARY ............................................................................................................ 6
1 CELLULAR MOBILE SERVICES ............................................................................ 8
1.1 Mobile Subscriptions ...................................................................................... 8
1.2 Mobile Money Transfer ................................................................................ 10
1.3 Mobile Number Portability .......................................................................... 11
1.4 Mobile Traffic and Usage Pattern ............................................................... 11 1.4.1 Voice Traffic ................................................................................................... 11
1.4.2 Voice Traffic by Operator ............................................................................... 13
1.4.3 Minutes of Use ................................................................................................ 14
1.4.4 Short Messaging Service ................................................................................. 15
1.4.5 Multimedia Messaging Service ....................................................................... 16
1.4.6 Roaming Traffic .............................................................................................. 17
1.4.7 International Mobile Traffic ............................................................................ 18
1.5 Mobile Revenue and Investments ................................................................ 18
2 FIXED TELEPHONE SERVICE ............................................................................ 19
2.1 Subscriptions ................................................................................................. 19
2.2 Fixed Network Traffic .................................................................................. 20
3 DATA/INTERNET SERVICES ............................................................................... 22
3.1 Data/Internet Service .................................................................................... 22
3.2 Broadband Services ...................................................................................... 25 3.2.1 Data / internet broadband subscriptions .......................................................... 25
3.2.2 Broadband subscriptions by Speed ................................................................. 25
3.3 International Bandwidth .............................................................................. 26
3.4 Revenue and Investment in the Data/Internet Market ............................. 27
4 ELECTRONIC TRANSACTIONS ........................................................................... 28
5 POSTAL AND COURIER SERVICES .................................................................... 28
5.1 Postal and Courier Traffic ........................................................................... 28
5.2 Number of Postal and Courier Outlets ....................................................... 29
5.3 Postal and Courier Revenue and Investments ........................................... 30
6 CONCLUSION .......................................................................................................... 30
3
LIST OF TABLES
Table 1: Mobile Subscription per operator ............................................................. 10
Table 2: Mobile Money Transfer Service .............................................................. 11
Table 3: Mobile Number Portability ...................................................................... 11
Table 4: Local Mobile Voice Traffic in Minutes ................................................... 12
Table 5: Local Mobile Voice Traffic by Operator ................................................. 14
Table 6: Short Messaging Service per Operator..................................................... 16
Table 7: Multimedia Messaging Service ................................................................ 17
Table 8: Roaming Traffic ....................................................................................... 17
Table 10: Mobile Revenue and Investment ............................................................ 19
Table 11: Local Fixed Network Traffic in Minutes ............................................... 21
Table 12: International Fixed Voice Traffic ........................................................... 21
Table 13: Internet Subscriptions and Internet Users .............................................. 22
Table 14: Mobile data/Internet Subscriptions ........................................................ 24
Table 15: Other Fixed/Wireless Internet Subscriptions by Operator ..................... 24
Table 16: International Internet Available Bandwidth (Mbps) .............................. 26
Table 17: International Internet Connectivity Bandwidth (Mbps) ......................... 27
Table 18: Data/Internet Revenue and Investment .................................................. 27
Table 19: Number of Domain names ..................................................................... 28
Table 20: Postal and Courier Traffic ...................................................................... 29
Table 21: Postal and Courier Revenue and Investments ........................................ 30

4
LIST OF FIGURES
FIGURE 1: MOBILE SUBSCRIPTIONS ..................................................................................... 8
FIGURE 2: NET ADDITIONS IN MOBILE SUBSCRIPTIONS ....................................................... 9
FIGURE 3: MARKET SHARE FOR MOBILE SUBSCRIPTIONS PER OPERATOR .......................... 9
FIGURE 4: PROPORTION OF ON-NET AND OFF-NET VOICE TRAFFIC .................................. 13
FIGURE 5: MINUTES OF USE ............................................................................................... 15
FIGURE 6: FIXED NETWORK SUBSCRIPTIONS ..................................................................... 20
FIGURE 7: ESTIMATED NUMBER OF INTERNET USERS AND INTERNET PENETRATION ....... 23
FIGURE 8: BROADBAND SUBSCRIPTIONS ........................................................................... 25
FIGURE 9: BROADBAND SUBSCRIPTIONS BY SPEED ........................................................... 26
FIGURE 10: NUMBER OF POSTAL OUTLETS ........................................................................ 29

5
LIST OF ABBREVIATIONS
ICTs Information Communication Technologies
EASSy Eastern Africa Submarine Cable Systems
EVDO Evolution-Data Optimized
LION2 Lower Indian Ocean Network
GSM Global Systems for Mobile Communications
Mbps Megabits per second
MMS Multimedia Service
MoU Minutes of Use
MVNO Mobile Virtual Network Operator
SEACOM Sea Sub-Marine Communications Limited
SIM Subscriber Identification Module SMS Short Messaging Service TEAMS The East African Marine System
VSAT Very Small Aperture Terminal
FY Financial Year

6
I. PRELIMINARY NOTES
This report is based on data provided by service providers.
The information provided in this quarterly report is subject to alteration in case of any
revisions or updates from the service providers.
II. IN SUMMARY
The ICT Sector Statistics Report for the period January to March 2015 (Q3 FY 2014/15) provides an
analysis of the sector performance and trends on the following service categories:
Mobile telephony
Fixed telephony
Internet/Data
Electronic Transactions
Postal and Courier
In the quarter under review, (Q3 FY 2014/15), the mobile telephony sub-sector continued to
expand with subscriptions registering growth of 3.6 percent to reach 34.8 million up from 33.6
million recorded during the last quarter. New subscriptions registered during the quarter stood at
1.1 million from 863,803 new subscriptions recorded during the last quarter representing growth
of 34.5 percent during the quarter.
Pre-paid subscriptions stood at 33.8 million up from 32.7 million recorded during the last quarter
representing growth of 3.3 percent during the quarter. Post-paid subscriptions were recorded at
937,043 up from 854,283 registered during the last quarter registering growth of 9.7 percent
during the quarter.
Mobile penetration expanded by 2.9 percentage points to reach 85.5 percent up from 82.6
percent attained during the preceding quarter.
The number of mobile money transfer subscriptions rose by 3.0 percent to reach 26.7 million
subscriptions up from 26.0 million recorded during the last quarter. On the other hand, the
number of agents stood at 126,622 up from 121,924 recorded during the previous quarter
representing growth of 3.9 percent during the quarter.
Mobile number portability registered a decline in the number of inports to stand at 618 down
from 781 inports recorded during the last quarter.
The local mobile voice traffic volume increased by 10.0 percent during the quarter to reach 8.7
billion minutes up from 7.9 billion minutes registered during the last quarter. On average, each
subscriber made 84.1 minutes calls per month during the quarter.
Short Messaging Service (SMS) traffic declined by 11.8 percent to record 6.5 billion messages
down from 7.4 billion messages sent during the last quarter. Thus each subscriber sent an
average of 63 messages per month during the quarter.

7
International incoming mobile voice traffic recorded an increase of 21.2 percent to stand at 180
million minutes during the quarter up from 148 million minutes observed during the previous
quarter. In the same way, international outgoing voice traffic was recorded at 133 million
minutes up from 108 million minutes registered during the last quarter representing growth of
22.8 percent during the quarter.
The number of fixed lines rose during the quarter under review to 202,905 lines up from 179,990
in the last quarter representing 12.7 percent growth during the period. This increase was mainly
driven by fixed terrestrial lines that grew by 90.5per cent to 91,373 up from 47,973 lines in the
last quarter.. This growth was mainly attributed to growth in Wananchi Group subscription
through the fibre network.
On the contrary, there was a 15.5 percent decline in the number of fixed wireless subscriptions
during the quarter under review to stand at 111,532 down from 132,017 subscriptions recorded
during the last quarter.
Fixed network traffic declined by 11.2 percent to register 22.3 million minutes down from 25.1
million minutes realised during the last quarter.
Data/internet subscriptions grew by 14.3 per cent during the quarter to 18.8 million from 16.3
million subscriptions in the last quarter. Consequently, the estimated number of Internet users
rose to 29.1 million up from 26.1 million users estimated during the previous quarter. 71.7
percent up of the population had access to the Internet up from 64.1 percent during the last
quarter.
During the period under review, the international Internet bandwidth available in the country
(Equipped/Lit) grew tremendously by 117.9 percent to reach 1.6Gbps up from 0.7Gbps recorded
during the last quarter. This growth, was mainly contributed by TEAMS that lit additional
capacity to meet growing demand of bandwidth. Used capacity also increased by 57.3 percent to
reach 783, 761 Mbps up from 498,121 Mbps recorded during the last quarter. The used capacity
represented 47.0 percent of the total available bandwidth in the country.
In the postal and courier sub-sector, the number of letters sent locally declined marginally by 0.3
percent to reach 16.73 million during the quarter, down from 16.78 million letters sent during the
preceding quarter. Similarly, courier items sent declined by 10.1 percent to stand at 344,222
during the quarter down from 382,925 items sent during the previous quarter.
The number of international incoming letters dipped to reach 2.43 million down from 2.46
million received during the last quarter registering a drop of 1.0 percent. On the contrary,
international outgoing letters increased marginally by 0.1 percent to stand at 2.293 million letters
up from 2.290 letters sent during the last quarter.

8
1 CELLULAR MOBILE SERVICES
1.1 Mobile Subscriptions
During the quarter under review, the number of mobile subscriptions grew by 3.6 per cent to
stand at 34.8 million up from 33.6 million subscriptions reported during the previous quarter
registering a growth of 1.6 per cent compared to the same period the previous year.
Similarly, the number of mobile subscriptions per 100 inhabitants increased by 2.9 percentage
points to stand at 85.5 per cent up from 82.6 per cent recorded during the previous quarter. In
comparison to the same period of the previous year, penetration had registered a 1.3 percentage
points increase.
Figure 1 illustrates the quarterly trends in mobile subscriptions and penetration.
Figure 1: Mobile Subscriptions
Source: CA, Operators’ Returns
As demonstrated in Figure 2, the total number of new mobile subscriptions (net additions)
registered by all mobile operators during the quarter grew considerably by 34.5 per cent to post
1,161,826 subscriptions up from 863,803 subscriptions posted in the last quarter. When
compared to the same period of the previous year, these new subscriptions had registered more
than 69-fold increase.
9
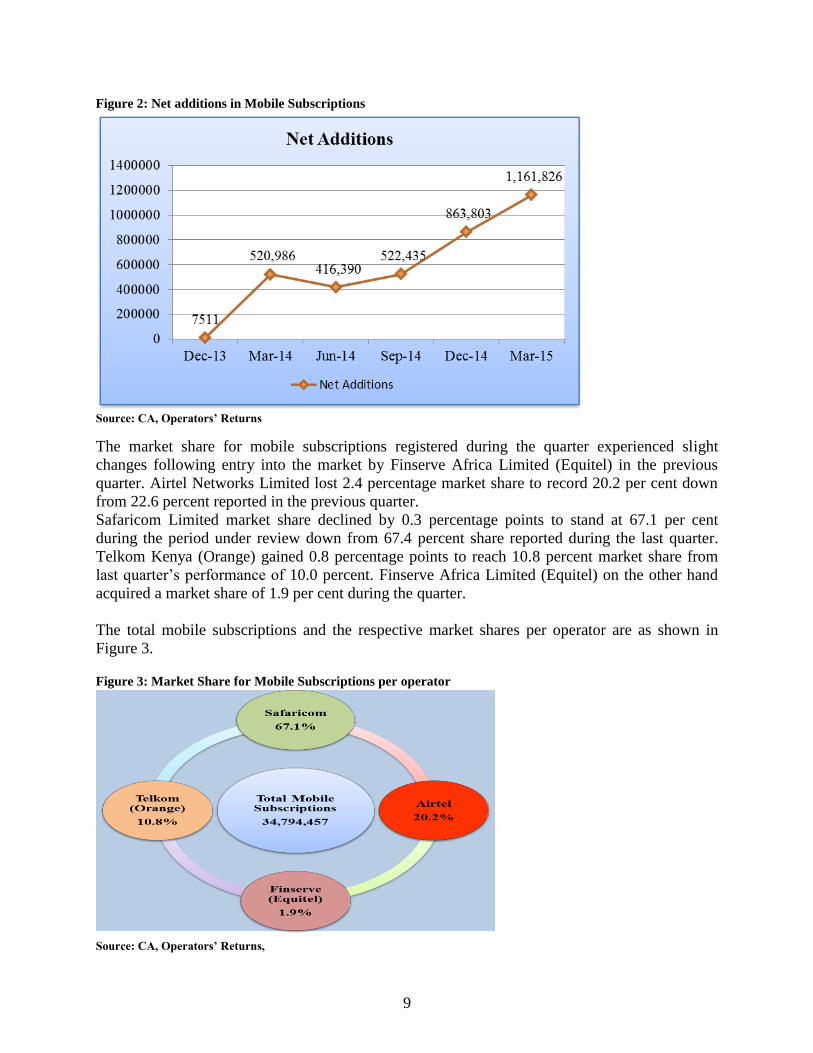
Figure 2: Net additions in Mobile Subscriptions
Source: CA, Operators’ Returns
The market share for mobile subscriptions registered during the quarter experienced slight
changes following entry into the market by Finserve Africa Limited (Equitel) in the previous
quarter. Airtel Networks Limited lost 2.4 percentage market share to record 20.2 per cent down
from 22.6 percent reported in the previous quarter.
Safaricom Limited market share declined by 0.3 percentage points to stand at 67.1 per cent
during the period under review down from 67.4 percent share reported during the last quarter.
Telkom Kenya (Orange) gained 0.8 percentage points to reach 10.8 percent market share from
last quarter’s performance of 10.0 percent. Finserve Africa Limited (Equitel) on the other hand
acquired a market share of 1.9 per cent during the quarter.
The total mobile subscriptions and the respective market shares per operator are as shown in
Figure 3.
Figure 3: Market Share for Mobile Subscriptions per operator
Source: CA, Operators’ Returns,

10
During the period under review, Safaricom Limited gained 2.7 percent and 11.4 percent pre-paid
and post-paid mobile subscriptions respectively. Its total number of subscriptions grew by 3.0
per cent to stand at 23.3 million up from 22.6 million subscriptions registered in the previous
quarter.
Airtel Network Limited experienced an increase in the number of post-paid subscriptions by 1.5
per cent to stand at 151,286 subscriptions up from 149,020 subscriptions posted in the last
quarter. However, pre-paid subscriptions declined to 6.8 million down from 7.4 million
subscriptions reported in the preceding quarter. Consequently, its total mobile subscriptions
declined by 7.8 per cent to stand at 7.0 million.
During the quarter, Telkom Kenya (Orange) experienced significant growth in the number of
pre-paid and post-paid mobile subscriptions which increased by 12.0 per cent and 3.2 per cent
respectively. The total subscriptions were registered at 3.7 million up from 3.3 million
subscriptions reported during the previous quarter.
The Mobile Virtual Network Operator Finserve Africa posted a total of 665,661 mobile
subscriptions all on pre-paid subscription.
Overall, the number of pre-paid and post-paid mobile subscriptions grew by 3.3 per cent and 9.7
per cent respectively.
The number of pre-paid and post-paid subscriptions by operator is indicated in Table 1.
Table 1: Mobile Subscription per operator
Name of operator Mar-15 Dec-14 Quarterly
variation
(%) Pre-paid Post-paid Total Pre-paid Post-paid Total
Safaricom Limited 22,564,598 782,593 23,347,191 21,956,374 702,198 22,658,572 3.0
Airtel Networks
Limited
Subscriptions 6,864,316 151,286 7,015,602 7,461,612 149,020 7,610,632 -7.8
Finserve Africa
(Equitel) 665,661 665,661 - - - -
Telkom
Kenya(Orange) 3,762,839 3,164 3,766,003 3,360,362 3,065 3,363,427 12.0
Total 33,857,414 937,043 34,794,457 32,778,348 854,283 33,632,631 3.5
Source: CA, Operators’ Returns
1.2 Mobile Money Transfer
During the quarter under review, the number of mobile money transfer subscriptions rose by 3.0
percent to reach 26.7 million up from 26.0 million subscriptions registered during the last
quarter.

11
In the same way, the number of active agents grew by 3.9percent to stand at 126,622 up from
121,924 agents recorded during the last quarter.
The number of agents and subscriptions per operator is indicated in Table 2.
Table 2: Mobile Money Transfer Service
Service
Provider
Mar-15 Oct-14 Quarterly Variation (%)
Agents Subscriptions Agents Subscriptions Agents Subscriptions
Safaricom 85,756 20,625,425 83,690 20,150,836 2.5 2.4
Airtel 10,179 3,122,519 10,990 3,236,016 -7.4 -3.5
Orange 15,419 191,658 13,767 190,129 12.0 0.8
Finserve - 665,661.00 - 394,606 0.0 68.7
Mobikash 13,672 1,685,046 11,881 1,547,502 15.1 8.9
Tangaza 1,596 503,556 1,596 503,556 0.0 0.0
Total 126,622 26,793,865 121,924 26,022,645 3.9 3.0
Source: CA, Operators’ Returns
1.3 Mobile Number Portability
As illustrated in Table 3, the number of mobile in-ports dropped by 20.9 percent to record 618
in-ports down from 781 in-ports reported last quarter. However, when related to the same period
of the previous year, growth of 31.2 percent was observed.
Table 3: Mobile Number Portability
Period Jan-Mar 15 Oct-Dec 14 Quarterly
Variation
Jan-Mar 14 Oct-Dec 13 Quarterly
Variation
(%)
Number of in-
ports
618
781 -20.9 362 276 31.2
Source: CA, Operators’ Returns
1.4 Mobile Traffic and Usage Pattern
1.4.1 Voice Traffic
During the period under review, the volume of originating mobile voice traffic grew by 10.0 per
cent to stand at 8.7 billion up from 7.9 billion minutes recorded during the previous quarter. This
trend was different from what was reported during the same period of the previous year, which
experienced a 2.7 per cent decline.
On net mobile voice traffic grew by 7.8 per cent to record 7.5 billion minutes up from 7.0 billion
minutes posted during the last quarter. On the contrary, when compared to the same period of the
previous year, a decline of 3.2 percent was recorded.
In the same way, traffic to other mobile networks increased by 26.5 per cent to post 1.1 billion
minutes up from 936 million minutes recorded in the previous quarter. This was contrary to the
trend exhibited during the same period of the previous year, which experienced a traffic decline
of 3.2 per cent.

12
Mobile to fixed traffic demonstrated a similar trend with the quarter under review recording 18.7
million minutes up from 16.1 million minutes posted in the previous quarter. This represented
growth of 16.1 percent during the quarter and a decline of 25.0 percent compared to the same
period of the previous year.
The trend in local mobile voice traffic is as shown in Table 4.
Table 4: Local Mobile Voice Traffic in Minutes
Mobile Traffic Jan-Mar 15 Oct-Dec 14
Quarterly
Variation
(%)
Jan-Mar 14 Oct-Dec 13
Quarterly
Variation
(%)
By Traffic originating (outgoing traffic)
Own Network –
Own Network 7,572,006,261 7,023,107,375* 7.8 6,692,455,072 6,871,942,391 -2.6
Own Network to
Other Mobile
Networks
1,185,331,522 936,937,933 26.5 971,237,869 1,003,147,611 -3.2
Mobile Network
to Fixed Network 18,759,354 16,160,611 16.1 8,726,525 11,637,430 -25.0
Total Traffic
Origination
(Outgoing)
8,776,097,137 7,976,205,919 10.0 7,672,419,466 7,886,727,432 -2.7
By Traffic terminating (incoming traffic)
Own Network –
Own Network 7,572,006,261 7,023,107,375 7.8 6,692,455,072 6,871,942,391 -2.6
Other Mobile
Networks to Own
Network
1,218,565,860 929,669,094 31.1 1,027,901,534 1,064,722,858 -3.5
Fixed Network to
Mobile Network 32,289,099 31,913,719 1.2 25,144,925 25,206,911 -0.2
Total traffic
termination(Inco
ming)
8,822,861,220 7,984,690,188 10.5 7,745,501,531 7,961,872,160 -2.7
Source: CA, Operators’ Returns, * Corrected data by Airtel Networks Limited
The total traffic terminated on local mobile networks increased by 10.5 per cent to stand at 8.8
billion minutes up from 7.9 billion minutes recorded during the last quarter. This was a
substantial growth compared to the same period of the previous year which experienced a 2.7 per
cent decrease in terminating traffic.
The proportion of on-net and off-net local mobile voice traffic experienced minor change during
the period under review. The proportion of on-net traffic to total mobile voice traffic stood at
86.3 per cent from 88.1percent recorded during the previous quarter marking a decline of 1.8
percentage points during the quarter. In the same way, the proportion of off-net traffic to total
traffic volume stood at 13.7 per cent up from 11.9 percent registered during the last quarter
marking an increase of a similar margin of 1.8 percentage points.

13
The proportion of on-net and off-net traffic to total mobile voice traffic is shown in Figure 4.
Figure 4: Proportion of On-net and Off-net Voice Traffic
Source: CA, Operators’ Returns
1.4.2 Voice Traffic by Operator
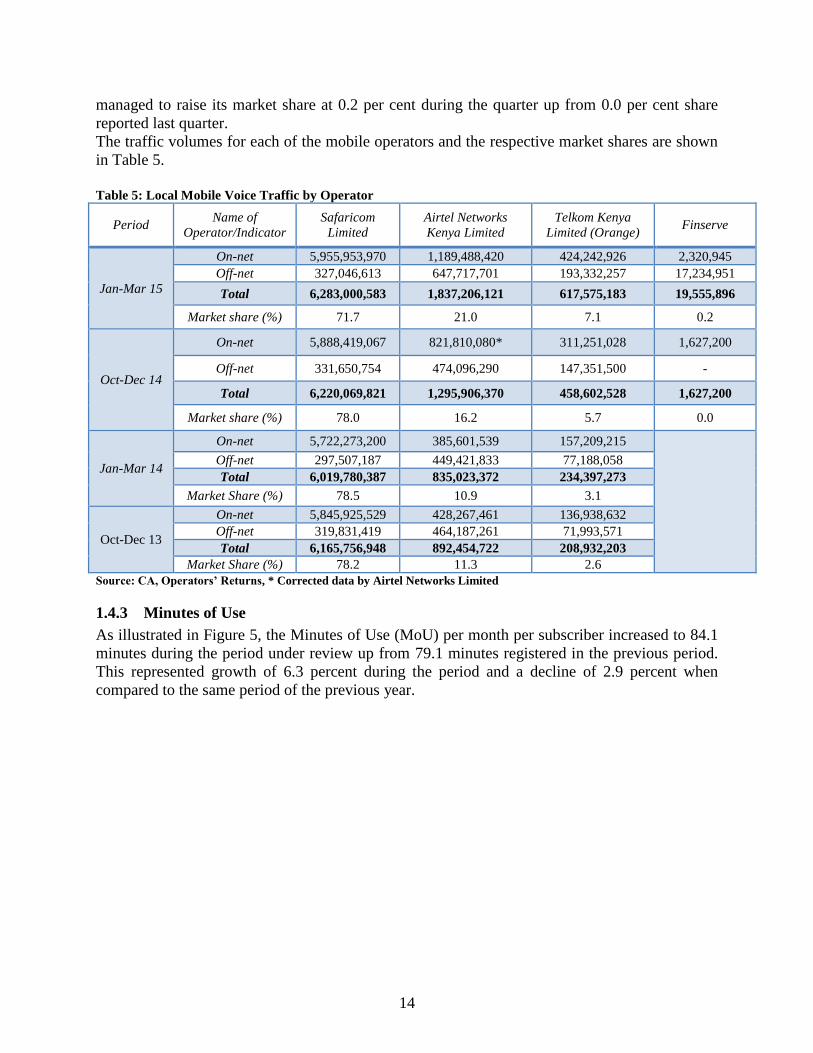
The quarter under review experienced mixed trends in terms of local mobile voice traffic per
operator. Notably, Safaricom Limited lost its market share by 6.3 percentage points to register
71.7 percent market share down from 78.0 percent share recorded during the last quarter.
However, its total traffic volume increased to 6.28 billion up from 6.22 billion minutes registered
during the previous quarter. On-net and off-net traffic stood at 5.9 billion and 327 million
minutes respectively during the quarter under review.
The local mobile voice traffic for Airtel Kenya Limited increased by a substantial margin during
the quarter under review to post a total of 1.8 billion minutes up from 1.2 billion minutes posted
during the last quarter. This traffic was mainly contributed by growth in on-net traffic that
recorded remarkable growth to stand at 1.1 billion minutes up from 821 million minutes.
Similarly, off-net traffic grew to 647 million during the quarter up from 474 million minutes
posted during the last quarter. Consequently, the operator’s market share grew by 4.8 percentage
points to stand at 21.0 per cent up from 16.2 percent share reported during the previous quarter.
Telkom Kenya Limited (Orange) gained in total mobile voice traffic to register 617 million
minutes during the period up from 458 million minutes registered in the last quarter. The on-net
and off-net traffic stood at 424 million and 193 million minutes respectively. The market share
grew from 5.7 per cent shares reported in the previous quarter to 7.1 per cent market shares
during the period under review.
Equitel (Finserve Limited), a Mobile Virtual Network Operator (MVNO), recorded on-net traffic
of 2.3 million minutes during the quarter up from 1.6 million minutes posted during the previous
period. The traffic to other mobile networks stood at 17.2 million during the quarter. Equitel
14
managed to raise its market share at 0.2 per cent during the quarter up from 0.0 per cent share
reported last quarter.
The traffic volumes for each of the mobile operators and the respective market shares are shown
in Table 5.
Table 5: Local Mobile Voice Traffic by Operator
Period Name of
Operator/Indicator
Safaricom
Limited
Airtel Networks
Kenya Limited
Telkom Kenya
Limited (Orange) Finserve
Jan-Mar 15
On-net 5,955,953,970 1,189,488,420 424,242,926 2,320,945
Off-net 327,046,613 647,717,701 193,332,257 17,234,951
Total 6,283,000,583 1,837,206,121 617,575,183 19,555,896
Market share (%) 71.7 21.0 7.1 0.2
Oct-Dec 14
On-net 5,888,419,067 821,810,080* 311,251,028 1,627,200
Off-net 331,650,754 474,096,290 147,351,500 -
Total 6,220,069,821 1,295,906,370 458,602,528 1,627,200
Market share (%) 78.0 16.2 5.7 0.0
Jan-Mar 14
On-net 5,722,273,200 385,601,539 157,209,215
Off-net 297,507,187 449,421,833 77,188,058
Total 6,019,780,387 835,023,372 234,397,273
Market Share (%) 78.5 10.9 3.1
Oct-Dec 13
On-net 5,845,925,529 428,267,461 136,938,632
Off-net 319,831,419 464,187,261 71,993,571
Total 6,165,756,948 892,454,722 208,932,203
Market Share (%) 78.2 11.3 2.6
Source: CA, Operators’ Returns, * Corrected data by Airtel Networks Limited
1.4.3 Minutes of Use
As illustrated in Figure 5, the Minutes of Use (MoU) per month per subscriber increased to 84.1
minutes during the period under review up from 79.1 minutes registered in the previous period.
This represented growth of 6.3 percent during the period and a decline of 2.9 percent when
compared to the same period of the previous year.

15
Figure 5: Minutes of Use
Source: CA, Operators’ Returns
1.4.4 Short Messaging Service
The number of Short Messaging Service (SMS) sent during the period under review dropped to
6.5 billion down from 7.4 billion messages reported in the previous quarter. This represented a
decline of 11.8 percent during the quarter. This decline in SMS traffic could have been attributed
to the end of the festive season and beginning of the school term hence reduced mobile services
activity by students. The reduction in the number of SMS traffic could also have been attributed
to the growing popularity of whatsapp messaging service which is an OTT (Over-The-Top)
services. A similar trend was observed during the same period of the previous year that
witnessed reduction in SMS traffic volume by 1.4 percent.
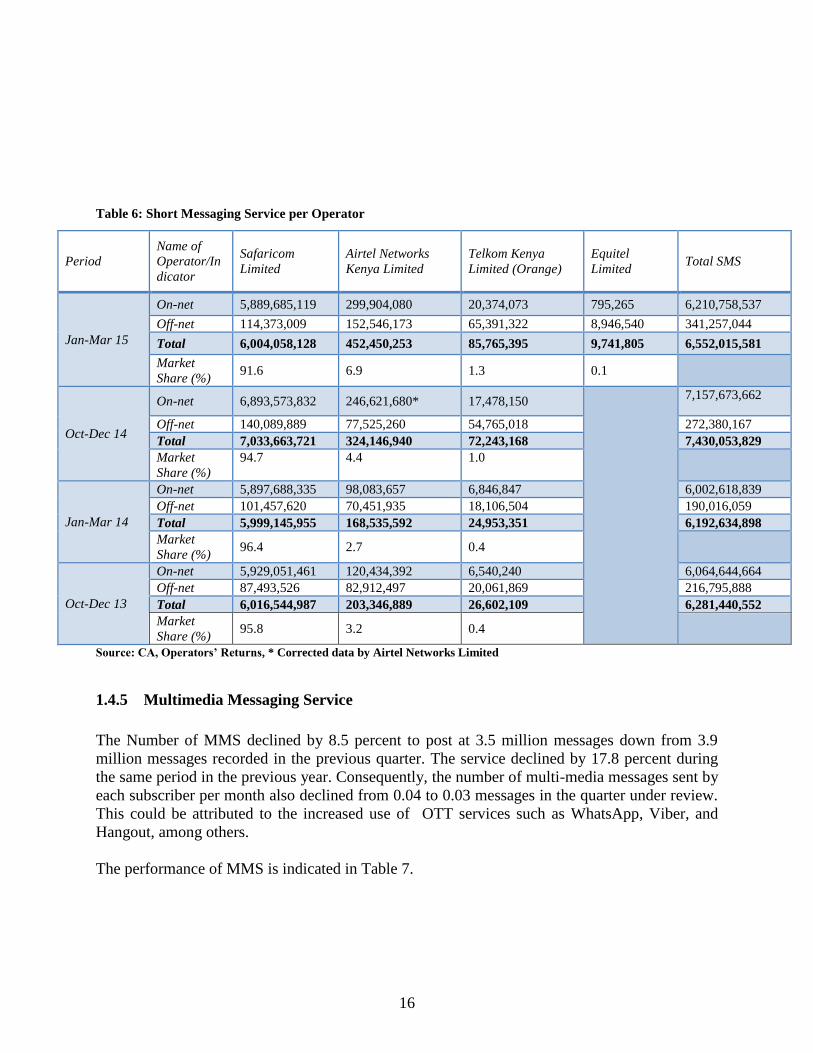
SMS traffic by Safaricom Limited decreased to 6.0 billion from 7.0 billion messages sent during
the last quarter. The respective market share reduced by 3.1 percentage points to stand at 91.6
percent down from 94.7 percent recorded during the last quarter.
Airtel’s SMS traffic volume gained 2.5 percentage points on market share to stand at 6.9 percent
share with 452 million SMS during the quarter up from 324 million messages registered during
the last quarter.
Telkom (Orange) experienced an increase in SMS traffic during the quarter to post 85 million
messages up from 72 million messages posted last quarter. The respective market share stood at
1.3 percent during the quarter up from 1.0 percent share recorded during the last quarter
representing 0.3 percentage point gained during the quarter.
Equitel Limited gathered 9.7 million messages equivalent of 0.1 percent market share during the
period under review.
The SMS traffic and the corresponding share per operator is as shown in Table 6.
16
Table 6: Short Messaging Service per Operator
Source: CA, Operators’ Returns, * Corrected data by Airtel Networks Limited
1.4.5 Multimedia Messaging Service
The Number of MMS declined by 8.5 percent to post at 3.5 million messages down from 3.9
million messages recorded in the previous quarter. The service declined by 17.8 percent during
the same period in the previous year. Consequently, the number of multi-media messages sent by
each subscriber per month also declined from 0.04 to 0.03 messages in the quarter under review.
This could be attributed to the increased use of OTT services such as WhatsApp, Viber, and
Hangout, among others.
The performance of MMS is indicated in Table 7.
Period
Name of
Operator/In
dicator
Safaricom
Limited
Airtel Networks
Kenya Limited
Telkom Kenya
Limited (Orange)
Equitel
Limited Total SMS
Jan-Mar 15
On-net 5,889,685,119 299,904,080 20,374,073 795,265 6,210,758,537
Off-net 114,373,009 152,546,173 65,391,322 8,946,540 341,257,044
Total 6,004,058,128 452,450,253 85,765,395 9,741,805 6,552,015,581
Market
Share (%) 91.6 6.9 1.3 0.1
Oct-Dec 14
On-net 6,893,573,832 246,621,680* 17,478,150
7,157,673,662
Off-net 140,089,889 77,525,260 54,765,018 272,380,167
Total 7,033,663,721 324,146,940 72,243,168 7,430,053,829
Market
Share (%)
94.7 4.4 1.0
Jan-Mar 14
On-net 5,897,688,335 98,083,657 6,846,847 6,002,618,839
Off-net 101,457,620 70,451,935 18,106,504 190,016,059
Total 5,999,145,955 168,535,592 24,953,351 6,192,634,898
Market
Share (%) 96.4 2.7 0.4
Oct-Dec 13
On-net 5,929,051,461 120,434,392 6,540,240 6,064,644,664
Off-net 87,493,526 82,912,497 20,061,869 216,795,888
Total 6,016,544,987 203,346,889 26,602,109 6,281,440,552
Market
Share (%) 95.8 3.2 0.4

17
Table 7: Multimedia Messaging Service
Period Jan-Mar 15 Oct-Dec 14 Quarterly
Variation (%)
Jan-Mar 14 Oct-Dec 13 Quarterly
Variation (%)
Number of
MMS
3,573,947 3,906,043 -8.5 2,497,654 3,039,392 -17.8
MMS per
subscriber per
month
0.03 0.04 -.0.25 0.03 0.03 0.00
Source: CA, Operators’ Returns
1.4.6 Roaming Traffic
During the period under review, Roaming-out1 voice traffic stood at 20.8 million minutes with
roaming to EAC countries contributing 17.5 million minutes while other non-EAC countries
contributed 3.2 million minutes. In the same way, the total number of roaming out messages was
registered at 32.0 million with EAC countries contributing majority to post 19.9 million
messages. The total roaming out data stood at 2.3 million MB during the quarter under review.
Roaming - in2 voice traffic registered a total of 22.6 million minutes during the period under
review with EAC countries contributing 15.6 million minutes and other non-EAC countries
contributing 7.0 million minutes. Similarly, the total number of roaming out messages was
registered at 13.8 million with EAC countries contributing 7.1 million messages. The roaming in
data traffic stood at 4.2 million MB.
The data on roaming traffic is indicated in Table 8.
Table 8: Roaming Traffic
Name of
Country
Jan-Mar 15
Roaming Out (Own Subscribers) Roaming In (Foreign Subscribers)
Voice SMS Data (MB) Voice SMS Data (MB)
Uganda 12,041,774 10,615,162 350,299 7,438,769 245,958 235,731
Tanzania 4,220,529 6,610,464 555,458 4,050,803 5,723,704 440,103
Rwanda 1,227,940 1,028,425 189,282 3,912,503 1,010,201 84,950
Burundi 38,671 164,612 - 13,638 37,171 4
S. Sudan 67,729 1,540,986 2,676 196,894 159,829 503
Su-totals 17,596,643 19,959,649 1,097,715.76 15,612,607 7,176,863 761,291
Others 3,287,931 12,088,799 1,275,056 7,023,792 6,719,269 3,453,811
Totals 20,884,574 32,048,448 2,372,772 22,636,399 13,896,132 4,215,102
Source: CA, Operators’ Returns.
1 Roaming out is traffic originated and terminated by subscribers of national networks as users of foreign networks
abroad. 2 Roaming in is traffic originated and terminated by foreign subscribers as users of local network.

18
1.4.7 International Mobile Traffic
During the quarter under review, there was a total of 180 million minutes of international
incoming voice traffic recorded up from 148 million minutes in the previous quarter, translating
to a growth of 21.2 percent. The number of International incoming voice minutes from East
Africa grew tremendously by 113.4 percent to record at 49.2 million minutes up from 20.7
million minutes recorded during the last quarter. At the same time International incoming calls
from other countries grew by 2.3 to stand at 130 million minutes up from 127 million minutes
realised during the last quarter.
The total international outgoing traffic grew by 22.8 percent during the quarter to register 133
million minutes up from 108 million minutes reported during the previous quarter.
With regard to traffic leaving the country to East African countries, there was substantial growth
recorded of 147.2 percent to stand at 44 million minutes from 17 million minutes registered
during the last quarter. There was however a decline in traffic to other countries of 1.6 percent to
record 89.1 million minutes during the quarter under review down from 90 million minutes
attained during the last quarter.
The number of international mobile messages received in the country during the quarter under
review declined by 9.9 percent to post at 39.8 million down from 44.1 million messages received
on the previous quarter. Similarly, the volume of international mobile messages sent declined by
0.9 percent to post at 11.1 million during the quarter under review down from 11.2 million
messages sent during the last quarter.
The number of international voice and SMS traffic is indicated in Table 9.
Table 9: International mobile traffic Traffic Region Jan-Mar 15 Oct-Dec 14 Quarterly Variation
(%)
International Incoming
Mobile Voice Minutes EAC 49,220,314 20,711,140.25 113.4
Others 130,937,714 127,975,458.75 2.3
Total 180,158,028 148,686,599 21.2
International Outgoing
Mobile Minutes
EAC 44,034,821 17,813,849.50 147.2
Others 89,298,384 90,783,946.50 -1.6
Total 133,333,205 108,597,796 22.8
International Incoming
Mobile SMS 39,806,773 44,190,839 -9.9
International Outgoing
Mobile SMS 11,148,301 11,247,845 -0.9
Source: CA, Operators’ Returns.
1.5 Mobile Revenue and Investments
The revenues and investments for the mobile sector will be updated upon the lapse of the
operators’ financial year.
19
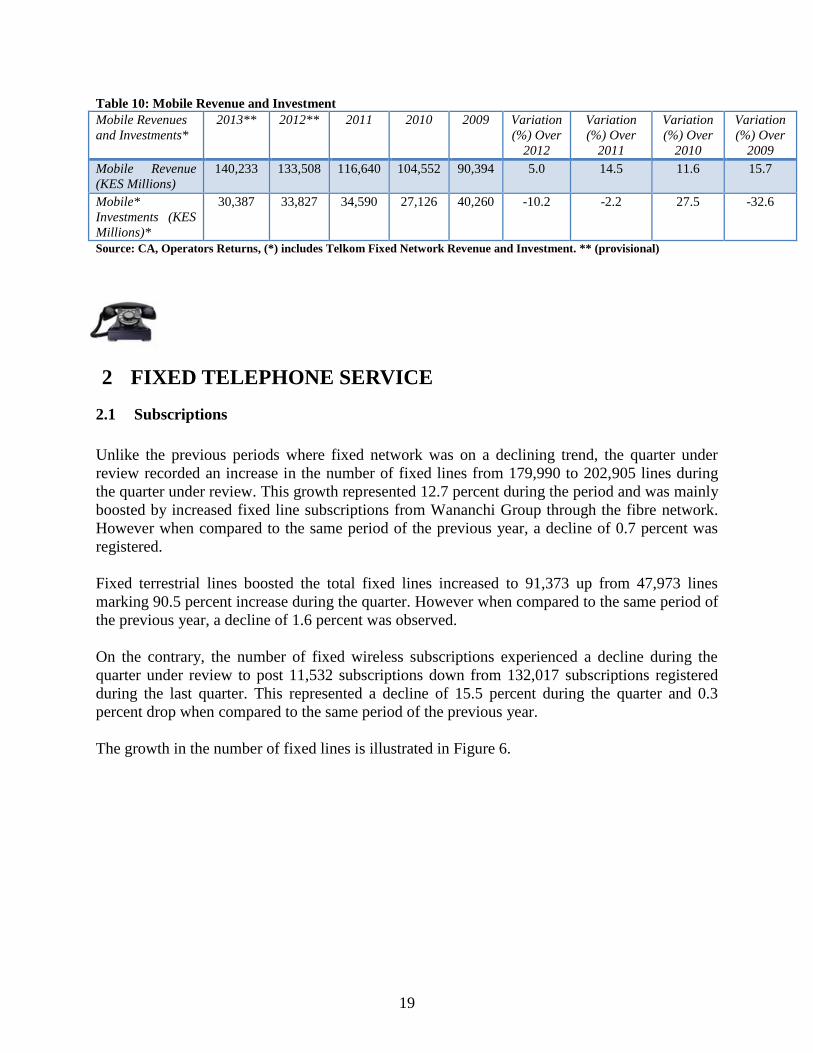
Table 10: Mobile Revenue and Investment
Mobile Revenues
and Investments*
2013** 2012** 2011 2010 2009 Variation
(%) Over
2012
Variation
(%) Over
2011
Variation
(%) Over
2010
Variation
(%) Over
2009
Mobile Revenue
(KES Millions)
140,233 133,508 116,640 104,552 90,394 5.0 14.5 11.6 15.7
Mobile*
Investments (KES
Millions)*
30,387 33,827 34,590 27,126 40,260 -10.2 -2.2 27.5 -32.6
Source: CA, Operators Returns, (*) includes Telkom Fixed Network Revenue and Investment. ** (provisional)
2 FIXED TELEPHONE SERVICE
2.1 Subscriptions
Unlike the previous periods where fixed network was on a declining trend, the quarter under
review recorded an increase in the number of fixed lines from 179,990 to 202,905 lines during
the quarter under review. This growth represented 12.7 percent during the period and was mainly
boosted by increased fixed line subscriptions from Wananchi Group through the fibre network.
However when compared to the same period of the previous year, a decline of 0.7 percent was
registered.
Fixed terrestrial lines boosted the total fixed lines increased to 91,373 up from 47,973 lines
marking 90.5 percent increase during the quarter. However when compared to the same period of
the previous year, a decline of 1.6 percent was observed.
On the contrary, the number of fixed wireless subscriptions experienced a decline during the
quarter under review to post 11,532 subscriptions down from 132,017 subscriptions registered
during the last quarter. This represented a decline of 15.5 percent during the quarter and 0.3
percent drop when compared to the same period of the previous year.
The growth in the number of fixed lines is illustrated in Figure 6.

20
Figure 6: Fixed Network Subscriptions
Source: CA, Operators Returns.
2.2 Fixed Network Traffic
The total local fixed network traffic continued on a declining path consistent to the trend
observed over the previous periods. In the quarter being reported the total volume of fixed line
traffic recorded 22.3 million minutes down from 25.1 million minutes posted during the last
quarter representing a drop of 11.2 percent during the quarter. Conversely when related to the
same period of the previous year, growth of 1.8 percent was realised.
Fixed to fixed network traffic received a major boost from increased subscriptions from
Wananchi Group through the fibre network and consequently growth in traffic from 351,838
minutes recorded during the previous quarter to 507,002 minutes registered during the quarter
under review. This represents a substantial growth of 44.1 percent during the period and 1.8
percent increase during the same period of the previous year.
Fixed wireless to fixed wireless traffic experienced a considerable drop of 38.4 percent to attain
2.7 million minutes during the quarter under review from 4.4 million minutes posted during the
last quarter. On the contrary when compared to the same period of the previous year, a decline of
2.5 percent was registered.
Likewise, fixed to other networks traffic showed a decline of 3.7 percent to reach 19.5 million
minutes during the quarter under review down from 20.2 million minutes realised during the
previous quarter. Contrariwise, in relation to the same period of the previous year, growth of 3.0
percent was registered.
Table 11 illustrates the trend in fixed network traffic.

21
Table 11: Local Fixed Network Traffic in Minutes
Local Fixed Network
traffic
Jan-Mar 15 Oct-Dec 14 Quarterly
Variation (%)
Jan-Mar 14 Oct-Dec 13 Quarterly
Variation (%)
Intra-network traffic
Fixed-fixed 507,002 351,838 44.1 495,290 486,637 1.8
Fixed Wireless-fixed
wireless 2,748,007 4,460,479 -38.4 6,004,504 6,158,803 -2.5
Inter-network traffic
Fixed to other
Networks(Network voice
providers)
19,555,349 20,299,589 -3.7 24,170,238 23,468,289 3.0
Total Local Fixed
network traffic 22,303,356 25,111,906 -11.2 30,670,032 30,113,729 1.8
Source: CA, Operators’ Returns
International incoming fixed line traffic experienced growth of 5.0 percent during the quarter to
register 2.6 million minutes up from 2.5 million minutes posted during the previous quarter. In
comparison with the same period of the previous year, a sizeable growth was achieved of 80.0
percent.
On the contrary, international outgoing fixed line traffic declined by 9.6 percent from 3.6 million
minutes recorded during the last quarter to 3.3 million minutes during the quarter under review.
However, when compared to the same period of the previous year, an increase of 4.3 percent was
registered.
The number of international outgoing VoIP minutes dropped by 11.2 percent to reach 1.5 million
minutes during the quarter under review down from 1.7 million minutes recorded during the last
quarter which was a growth of 21.3 percent compared to the same period in the previous year.
The trend in international fixed network traffic is illustrated in Table 12 below.
Table 12: International Fixed Voice Traffic
International Fixed
Network traffic
Jan-Mar 15 Oct-Dec 14 Quarterly
Variation
(%)
Jan-Mar 14 Oct-Dec 13 Quarterly
Variation
(%)
International
Incoming Fixed
Network Voice
traffic
2,641,973 2,516,815 5.0 3,222,199 1,790,587 80.0
International
Outgoing Fixed
Network Voice
traffic
3,303,747 3,653,701 -9.6 3,923,754 3,761,709 4.3
International
Outgoing Fixed
Network VoIP
traffic
1,586,490 1,787,010 -11.2 2,193,476 1,808,646 21.3
Source: CA, Operators Returns.

22
3 DATA/INTERNET SERVICES
3.1 Data/Internet Service
The data market has continued to expand over the period with increased growth in subscriptions
witnessed during the quarter under review. The number of subscriptions increased by 14.3
percent to stand at 18.8 million up from 16.3 million posted during the last quarter. In relation to
the same period of the previous year, growth of 1.3 percent was recorded.
Mobile data continued to dominate the data market with the number of subscriptions registered at
18.6 million up from 16.3 million subscriptions during the last quarter. This represented 14.3
percent growth and 1.3 percent increase compared to the same period of the previous year.
Terrestrial wireless data subscriptions declined by 7.9 percent during the quarter under review to
register 16,148 subscriptions down from 17,537 recorded during the last quarter. This could have
been attributed to substitution of connection to other access modes such as Fibre optic.
Compared to the same period of the previous year, a minimal growth of 0.7 percent was
recorded.
Satellite subscriptions registered increased growth of 17.4 percent to stand at 836 up from 712
registered during the last quarter. In relation to the same period of the previous year, an increase
of 2.6 percent was registered.
The growth in fibre optic subscriptions has remained steady over the period with the quarter
under review registering 87,838 subscriptions up from 81,243 subscriptions recorded during the
last quarter representing an increase of 8.1 percent during the period. In relation to the same
period of the previous year, growth of 2.8 percent was attained.
The growth in data/internet subscriptions is as indicated in Table 13.
Table 13: Internet Subscriptions and Internet Users
Internet/Data Subscriptions Mar-15 Dec14 Quarterly
Variation (%)
Mar 14 Dec 13 Quarterly
Variation (%)
Total Internet Subscriptions 18,802,428 16,453,019 14.3 13,356,415 13,186,968 1.3
Mobile Data Subscriptions 18,682,921 16,338,990 14.3 13,257,309 13,090,348 1.3
Terrestrial Wireless Data
Subscriptions 16,148 17,537 -7.9 16,540 16,429 0.7
Satellite Data Subscriptions 836 712 17.4 700 682 2.6
Fixed DSL Data Subscriptions 14,685 14,512 1.2 12,547 12,014 4.4
Fixed Fibre Optic Data
Subscriptions 87,838 81,243 8.1 69,377 67,470 2.8
23
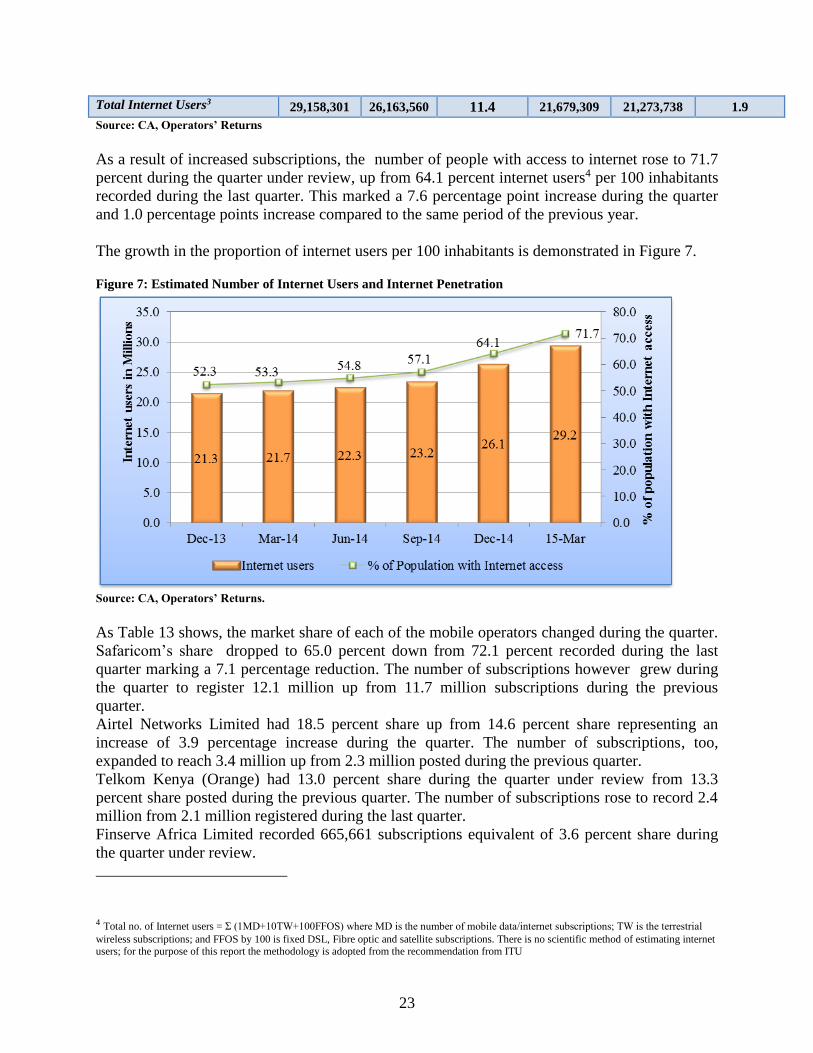
Total Internet Users3 29,158,301 26,163,560 11.4 21,679,309 21,273,738 1.9
Source: CA, Operators’ Returns
As a result of increased subscriptions, the number of people with access to internet rose to 71.7
percent during the quarter under review, up from 64.1 percent internet users4 per 100 inhabitants
recorded during the last quarter. This marked a 7.6 percentage point increase during the quarter
and 1.0 percentage points increase compared to the same period of the previous year.
The growth in the proportion of internet users per 100 inhabitants is demonstrated in Figure 7.
Figure 7: Estimated Number of Internet Users and Internet Penetration
Source: CA, Operators’ Returns.
As Table 13 shows, the market share of each of the mobile operators changed during the quarter.
Safaricom’s share dropped to 65.0 percent down from 72.1 percent recorded during the last
quarter marking a 7.1 percentage reduction. The number of subscriptions however grew during
the quarter to register 12.1 million up from 11.7 million subscriptions during the previous
quarter.
Airtel Networks Limited had 18.5 percent share up from 14.6 percent share representing an
increase of 3.9 percentage increase during the quarter. The number of subscriptions, too,
expanded to reach 3.4 million up from 2.3 million posted during the previous quarter.
Telkom Kenya (Orange) had 13.0 percent share during the quarter under review from 13.3
percent share posted during the previous quarter. The number of subscriptions rose to record 2.4
million from 2.1 million registered during the last quarter.
Finserve Africa Limited recorded 665,661 subscriptions equivalent of 3.6 percent share during
the quarter under review.
4 Total no. of Internet users = Ʃ (1MD+10TW+100FFOS) where MD is the number of mobile data/internet subscriptions; TW is the terrestrial
wireless subscriptions; and FFOS by 100 is fixed DSL, Fibre optic and satellite subscriptions. There is no scientific method of estimating internet users; for the purpose of this report the methodology is adopted from the recommendation from ITU

24
The market shares for mobile data/Internet market by operator are shown in Table 14.
Table 14: Mobile data/Internet Subscriptions
Name of Operator Mar-15 Market share
(%)
Dec 14 Market Share
(%)
Safaricom Limited 12,147,353 65.0 11,787,099 72.1
Airtel Networks Limited 3,448,107 18.5 2,377,732 14.6
Telkom Kenya(Orange) 2,421,800 13.0 2,174,154 13.3
Finserve Africa Limited 665,661 3.6
Total Subscriptions 18,682,921 16,338,985
Source: CA, Operators’ Returns
The market share for other fixed/wireless data/internet subscriptions for the top ten operators in
the market experienced mixed trends during the period under review with some operators
gaining in market share with others decreasing. Wananchi Telecom had the highest market share
during the quarter under review to record 46.8 percent down from 48.8 percent share registered
during the previous quarter representing a drop of 2 percentage points. Liquid Telecom followed
with 15.3 percent share down from 15.7 percent loosing 0.4 percentage points during the quarter
even though there was recorded growth in the number of subscriptions. Telkom Kenya too, lost
0.4 percentage points to reach 10.1 percent down from 10.5 percent share attained during the last
quarter though its subscriptions expanded from 12,002 during the last quarter to 12,083
subscriptions during the quarter under review.
Other operators’ share remained the same at 0.3 even though there was growth in the number of
subscriptions from 346 during the last quarter to 417 during the quarter under review.
Table 15 below shows the number of subscriptions and respective market share for the first ten
and other operators.
Table 15: Other Fixed/Wireless Internet Subscriptions by Operator
Name of Operator Mar-15 Market share
(%)
Dec 14 Market Share
(%)
Wananchi Telecom Limited 55,936 46.8 55,936 48.8
Liquid Telecom Limited 18,250 15.3 18,050 15.7
Telkom Kenya Limited 12,083 10.1 12,002 10.5
Access Kenya Limited*** 11,502 9.6 11,502 10.0
Safaricom Limited 8,192 6.9 8,244 7.2
Jamii Telecommunication Limited 7,536 6.3 2,574 2.2
Iway Africa* 3,271 2.7 3,271 2.9
Mobile Telephony Networks Limited 1,035 0.9 1,327 1.2
Internet solution** 742 0.6 742 0.6
Call Key Networks Limited 543 0.5 543 0.5
Others 417 0.3 346 0.3
Total Subscriptions 119,507 114,739
Source: CA, Operators’ Returns, * Data used for Oct-Dec 14, **Data used for Apr-Jun 14, ***Data used for Jan-Mar 14

25
3.2 Broadband Services
3.2.1 Data / internet broadband subscriptions
As Figure 8 illustrates, the number of mobile broadband subscriptions stood at 5.01 million up
from 4.07 million subscriptions during the last quarter representing growth of 23.1percent during
the quarter. When related to the same period of the previous year, growth of 2.6 percent was
registered.
Fixed/wireless broadband subscriptions on the other hand stood at 0.1 million up from 0.09
subscriptions recorded during the last quarter, representing an increase of 11.1 percent during the
quarter.
Figure 8: Broadband Subscriptions
Source: CA, Operators’ Returns
3.2.2 Broadband subscriptions by Speed
The number of fixed/wireless broadband subscriptions, as categorized by advertised speeds, was
recorded at 57,742 subscriptions with highest speeds of 2Mbps being recorded during the period
under review. Speeds of between 256 and 512 Kbps followed with 20,654 subscriptions. The
least number of subscriptions was in the category of 1024 and 2048 Kbps with 11,701
subscriptions during the quarter under review.
The number of advertised broadband speeds per category is illustrated in Figure 9.

26
Figure 9: Broadband Subscriptions speed
Source: CA, Operators’ Returns.
3.3 International Bandwidth
During the period under review, the amount of international Internet bandwidth available in the
country (Lit/equipped capacity) grew substantially to reach 1.6 million Mbps up from 847,523
Mbps recorded during the last quarter representing an increase of 96.9 percent during the quarter.
This growth was mainly contributed by TEAMS that recorded more than 6-fold increase as a
result of upgrade of their systems that lit more capacity to accommodate growing demand for
bandwidth.
Satellite capacity, on the other hand, declined by 2.7 percent to reach 265 Mbps from 273 Mbps
recorded during the last quarter. Similarly, when compared to the same quarter of the previous
year, a decline of 15.3 percent was observed.
The trend on international Internet available bandwidth is as shown in Table 16.
Table 16: International Internet Available Bandwidth (Mbps)
International Connectivity Bandwidth Mar-15 Dec 14 Quarterly
Variation
(%)
Mar 14 Dec 13 Quarterly
Variation (%)
SEACOM 770,000 565,440 36.2 583,680 578,400 0.9
TEAMS 820,000 119,970 583.5 119,970 119,970 0.0
Telkom Kenya Limited (EASSY) 39,060 39,060 0.0 39,060 39,060 0.0
Lion 2 39,220 40,960 -4.2 40,960 40,960 0.0
VSAT 265.6 273 -2.7 223.6 263.9 -15.3
Total International Internet
Bandwidth (Mbps) 1,668,546 765,703 117.9 783,894 778,653.9 0.7
Source: CA, Operators’ Returns
As a result of tremendous increase in the total available bandwidth in the country, used
bandwidth grew considerably by 57.3 percent to stand at 783,561.6 Mbps up from 498,121 Mbps

27
recorded used bandwidth in the last quarter. This growth could be attributed to the continuous
formulation of e-applications such as for e-commerce that have witnessed popularity in online
shopping thereby increasing demand for bandwidth. Thus the total used bandwidth represented
47.0 percent of the total available bandwidth in the country.
The undersea cable used bandwidth increased by 57.3 percent to reach 783,490Mbps up from
498,015Mbps recorded during the last quarter. Similarly, when compared to the same period of
the previous year, growth of 22.3 percent was realised.
On the other hand, satellite used bandwidth recorded a drop of 32.5 percent to register 71.6Mbps
during the quarter down from 106.1 Mbps posted during the last quarter. However when
compared to the same period of the previous year, growth of more than 2-fold increase was
observed.
The trend in international connectivity bandwidth is shown in Table 17.
Table 17: International Internet Connectivity Bandwidth (Mbps)
International Leased Bandwidth Mar-15 Dec 14 Quarterly
Variation
(%)
Mar 14 Dec 13 Quarterly
International Undersea Internet
Connectivity Bandwidth (Mbps) 783,490 498,015 57.3 446,865 365,330 22.3
International Satellite Internet
Connectivity Bandwidth 71.6 106.1 -32.5 195.63 83.43 134.5
Total International Internet
Connectivity Bandwidth (Mbps) 783,561.6 498,121 57.3 447,061 365,413 22.3
Source: CA, Operators’ Returns;
3.4 Revenue and Investment in the Data/Internet Market
The revenues and investments for the data/internet sector will be updated upon the lapse of the
operators’ financial year.
Table 18: Data/Internet Revenue and Investment
Data/Internet
Revenue
and
Investments*
2013 2012 2011 2010 2009 Variation
(%) Over
2012
Variation
(%) Over
2011
Variation
(%) Over
2010
Variation
(%) Over
2009
Data/Internet
Revenue
(KES
Millions)
21,941 25,627 13,710 8,659 7,937 -14.4 86.9 58.3 9.1
Data/Internet
Investments
(KES
Millions)
3,537 6,115 5,079 3,520 2,721 -42.2 20.4 44.3
Source: CA, Operators’ Returns. * Note that revenue in data market includes data revenues from mobile sector.

28
4 ELECTRONIC TRANSACTIONS
The number of domain names for .KE as at June 2014 was recorded at 32,508 as shown in Table
19.
Table 19: Number of Domain names
Subdomain Use No. of Domains Percentage
(%)
CO.KE Companies 29,374 90.36%
GO.KE Government Entities 301 0.93%
OR.KE Non Profit Making Organizations 1,193 3.67%
AC.KE Institutions of Higher Education 773 2.38%
SC.KE Lower and Middle Level Institutions 119 0.37%
NE.KE Personal Websites and E-mail 65 0.20%
ME.KE Personal Websites and E-mail 546 1.68%
MOBI.KE Mobile Content 43 0.13%
INFO.KE Information 94 0.29%
Total 32,508 100%
Source: KENIC - www.kenic.or.ke
Source: CA, Kenya Network Information Centre (KeNIC) *June 2014 Provisional
5 POSTAL AND COURIER SERVICES
5.1 Postal and Courier Traffic
The number of letters sent locally continued to go down with the quarter under review
registering a decline of 0.3 percent to record 16.73 million letters down from 16.78 letters
recorded during the last quarter. The same trend was observed compared to the same period of
the previous year that witnessed a decline of 2.8 percent.
Courier items sent also registered a decline of 10.1 percent during the quarter to reach 344,222
items down from 382,925 items recorded during the last quarter. In relation to the same period of
the previous year, a decline of 0.2 percent was experienced.
International incoming letters declined during the quarter under review to reach 2.43 million
letters down from 2.46 million letters recorded during the last quarter. This represents a decline
of 1.0 percent during the quarter and 2.4 percent drop when related to the same period of the
previous year.

29
As Table 20 indicates, the volume of international outgoing letters experienced minor growth of
0.1 percent to stand at 2.293 million letters up from 2.290 million letters registered during the
last quarter. However, compared to the same period of the previous year, a decline of 16.5
percent was observed.
Table 20: Postal and Courier Traffic
Post and Courier Traffic Jan-Mar 15 Oct-Dec 14
Quarterly
Variation
(%)
Jan-Mar 14 Oct-Dec 13
Quarterly
Variation
(%)
Number of Letters (Up to
350 gms) Posted Locally 16,738,268* 16,782,993 -0.3 16,846,228 17,324,016 -2.8
Total Courier Items Sent
Locally 344,222* 382,925 -10.1 477,526 478,434 -0.2
International Incoming
Letters (Up to 350 gms) 2,436,307* 2,461,845 -1.0 2,461,791 2,522,641 -2.4
International Outgoing
Letters (Up to 350 gms) 2,293,147* 2,290,871 0.1 812,923 978,525 -16.9
Source: CA, Operators’ Returns, *PCK returns for Oct-Dec 2014
5.2 Number of Postal and Courier Outlets
As illustrated in Figure 10, the number of postal and courier outlets did not change during the
quarter under review and remained at 622 and 788 respectively.
Thus the total number of postal and courier outlet by the end of the quarter under review
remained at 1,410.
Figure 10: Number of Postal Outlets
Source: CA, Operators’ Returns,*PCK data for Oct-Dec 2014

30
5.3 Postal and Courier Revenue and Investments
The revenues and investments for the postal and courier sector will be updated upon the lapse of
the operators’ financial year.
Table 21: Postal and Courier Revenue and Investments
Post/Courier
Revenue and
Investment
2013* 2012 2011 2010 Variation
(%) Over
2012
Variation
(%) Over
2011
Variation
(%) Over
2010
Revenue (KES
Millions)
7,086 7,467 11,793 10,694 -5.1 -36.7 11.0
Investments
(KES
Millions)
519 390 504 672 33.1 -22.6 -25.0
Source: CA, Operators’ Returns,
6 CONCLUSION
The telecommunication sector has continued on a positive growth path mainly boosted by the
mobile telephony subsector. As demonstrated in the quarter, the mobile telephony was robust as
witnessed by the growth in subscriptions and consequent increase in mobile penetration. The
entry of MVNO’s in the mobile telephony subsector has and will continue to stir competition and
growth in the sector. Local voice traffic as well as international voice traffic also recorded
growth during the quarter.
Data/Internet sub-sector has sustained steady growth over the period with increase in
subscriptions recorded during the quarter. This growth was mainly contributed by subscriptions
of mobile data/internet.
The growth in data/internet subscriptions pushed the demand for bandwidth further with the
quarter under review registering an increase in both international available capacity and the used
capacity in the country. The evolution of advanced services on e-platforms such as e-
government, e-commerce, e-learning and IPTV/Triple Play could be attributed to the demand
and thus the need for growth in bandwidth capacity.
In the postal and courier subsector, there was recorded decline in local mail traffic volume during
the quarter. International incoming letters experienced a drop during the quarter but international
outgoing mails recorded minor growth during the quarter.
Published: July 2015 Author: CA