quarterly service performance review third quarter, … 9a - qtr srvc... · 0 quarterly service...
TRANSCRIPT
0
Quarterly Service Performance ReviewThird Quarter, FY 2017January - March, 2017
Operations & Safety CommitteeMay 25, 2017


SUMMARY CHART 3rd QUARTER FY 2017 PERFORMANCE INDICATORS CURRENT QUARTER PRIOR QTR ACTUALS YEAR TO DATE
LAST THIS QTRACTUAL STANDARD STATUS QUARTER LAST YEAR ACTUAL STANDARD STATUS
Average Ridership - Weekday 415,844 443,614 NOT MET 425,944 433,585 424,648 445,191 NOT METCustomers on Time Peak 82.28% 95.00% NOT MET 87.53% 87.44% 86.61% 95.00% NOT MET Daily 86.99% 95.00% NOT MET 90.09% 90.45% 89.68% 95.00% NOT METTrains on Time Peak 74.34% N/A N/A 82.28% 82.07% 80.82% N/A N/A Daily 79.66% 92.00% NOT MET 84.66% 85.50% 84.19% 92.0% NOT METPeak Period Transbay Car Throughput AM Peak 96.37% 97.50% NOT MET 98.57% 95.89% 97.88% 97.50% MET PM Peak 97.10% 97.50% NOT MET 99.16% 97.16% 98.66% 97.50% METCar Availability at 4 AM (0400) 583 595 NOT MET 592 584 590 590 METMean Time Between Service Delays 5,036 4,000 MET 5,322 4,760 5,177 4,000 METElevators in Service Station 98.90% 98.00% MET 98.23% 98.67% 98.54% 98.00% MET Garage 92.43% 98.00% NOT MET 95.63% 90.17% 95.22% 98.00% NOT METEscalators in Service Street 79.00% 95.00% NOT MET 92.27% 84.70% 87.56% 95.00% NOT MET Platform 95.77% 96.00% NOT MET 96.83% 95.27% 96.42% 96.00% METAutomatic Fare Collection Gates 98.92% 99.00% NOT MET 99.07% 99.43% 99.03% 99.00% MET Vendors 95.63% 95.00% MET 95.68% 95.67% 95.75% 95.00% METWayside Train Control System 1.97 1.00 NOT MET 1.92 1.85 1.66 1.00 NOT METComputer Control System 0.02 0.08 MET 0.157 0.104 0.067 0.08 METTraction Power 0.22 0.20 NOT MET 0.46 0.97 0.26 0.20 NOT METTrack 0.08 0.30 MET 0.13 0.29 0.36 0.30 NOT METTransportation 0.41 0.50 MET 0.42 0.56 0.42 0.50 METEnvironment Outside Stations 2.73 2.80 NOT MET 2.75 2.75 2.73 2.80 NOT METEnvironment Inside Stations 2.62 3.00 NOT MET 2.63 2.70 2.64 3.00 NOT METStation Vandalism 2.93 3.19 NOT MET 2.98 3.00 2.96 3.19 NOT METStation Services 2.90 3.06 NOT MET 2.88 2.95 2.90 3.06 NOT METTrain P.A. Announcements 3.10 3.17 NOT MET 3.10 3.13 3.10 3.17 NOT METTrain Exterior Appearance 2.82 3.00 NOT MET 2.83 2.88 2.84 3.00 NOT METTrain Interior Appearance 2.86 3.00 NOT MET 2.89 2.95 2.90 3.00 NOT METTrain Temperature 3.13 3.12 MET 3.11 3.17 3.11 3.12 NOT METCustomer Complaints Complaints per 100,000 Passenger Trips 8.14 5.07 NOT MET 6.53 6.68 7.36 5.07 NOT MET
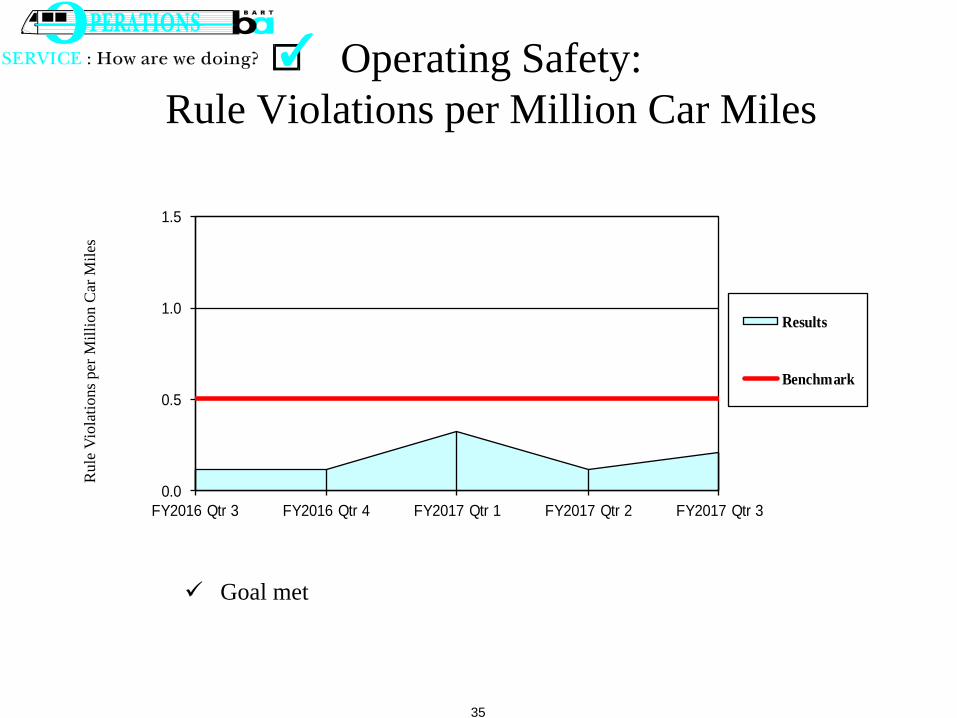
Safety Station Incidents/Million Patrons 1.93 5.50 MET 2.11 4.43 2.03 5.50 MET Vehicle Incidents/Million Patrons 0.30 1.30 MET 0.26 0.88 0.38 1.30 MET Lost Time Injuries/Illnesses/Per OSHA 6.97 7.50 MET 6.56 7.11 7.34 7.50 MET OSHA-Recordable Injuries/Illnesses/Per OSHA 9.43 13.30 MET 10.80 11.62 10.98 13.30 MET Unscheduled Door Openings/Million Car Miles 0.370 0.300 NOT MET 0.110 0.000 0.160 0.300 MET Rule Violations Summary/Million Car Miles 0.210 0.500 MET 0.110 0.110 0.217 0.500 MET
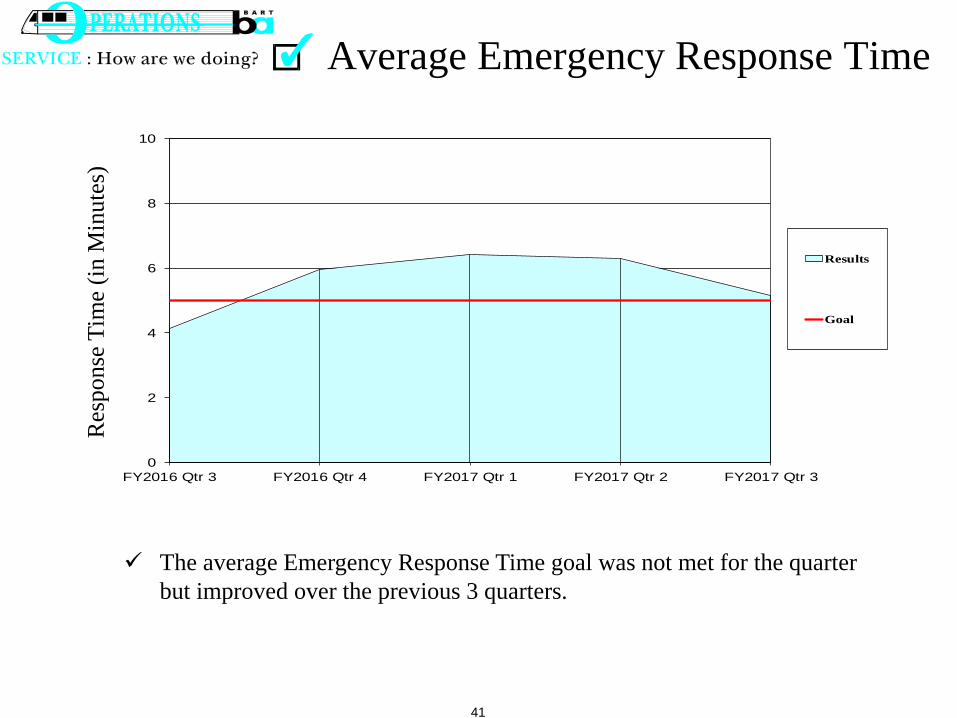
Police BART Police Presence 0.10 N/A N/A N/A N/A N/A N/A N/A Quality of Life per million riders 81.71 N/A N/A 60.08 10.77 56.96 N/A N/A Crimes Against Persons per million riders 3.19 2.00 NOT MET 2.24 2.10 2.54 2.00 NOT MET Auto Burglaries per 1,000 parking spaces 4.25 8.00 MET 4.33 3.45 4.07 8.00 MET Auto Thefts per 1,000 parking spaces 1.98 6.00 MET 2.56 2.56 2.21 6.00 MET Police Response Time per Emergency Incident (Minutes) 5.16 5.00 NOT MET 6.29 4.13 5.96 5.00 NOT MET Bike Thefts (Quarterly Total and YTD Quarterly Average) 73 150.00 MET 109 124 127 150.00 MET
LEGEND: Goal met Goal not met but w ithin 5% Goal not met by more than 5%


4
FY17 Third Quarter Overview
Ridership decline deepening, across the board Record rainfall impacted service reliability and equipment
performance Train service reliability down Equipment Reliability: Car, Track and Computer Control System met;
Traction Power and Train Control not met Equipment Availability: Station Elevators, Ticket Machines met;
Escalators (Platform and Street), Fare Gates, Garage Elevators and Cars not met
Passenger Environment: 1 of 4 Station indicators improved, none met goal; 2 of 4 Train indicators improved, 1 met goal
Complaints increased
5
Customer RidershipAv
erag
e W
eekd
ay T
rips
370,000
380,000
390,000
400,000
410,000
420,000
430,000
440,000
450,000
460,000
470,000
480,000
Jan Feb Mar April May June July Aug Sept Oct Nov Dec Jan Feb Mar
Results
Goal
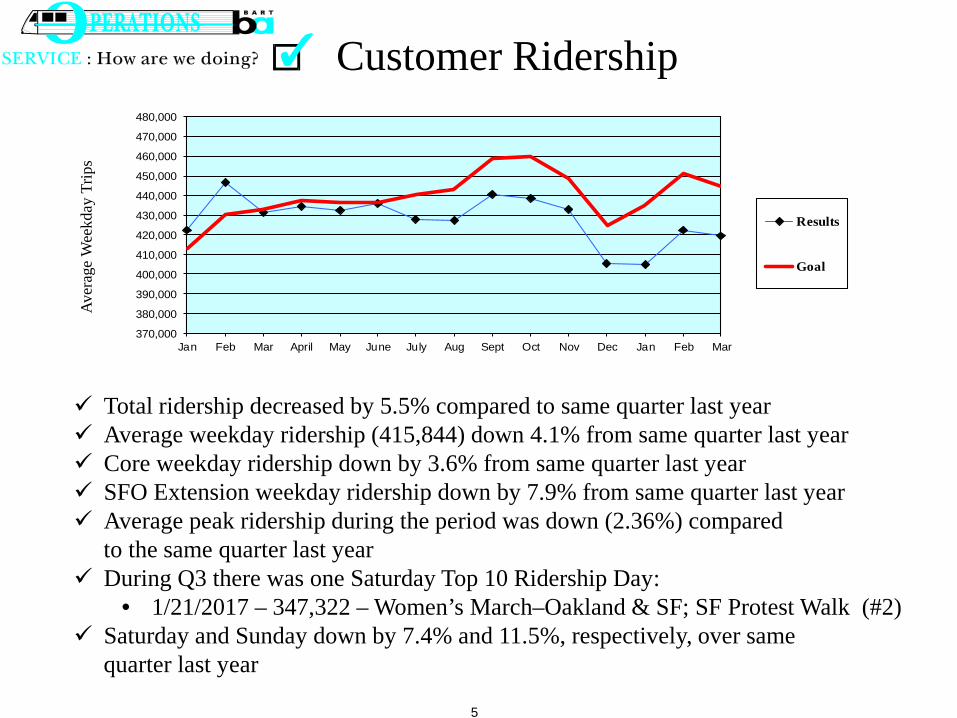
Total ridership decreased by 5.5% compared to same quarter last year Average weekday ridership (415,844) down 4.1% from same quarter last year Core weekday ridership down by 3.6% from same quarter last year SFO Extension weekday ridership down by 7.9% from same quarter last year Average peak ridership during the period was down (2.36%) compared
to the same quarter last year During Q3 there was one Saturday Top 10 Ridership Day:
• 1/21/2017 – 347,322 – Women’s March–Oakland & SF; SF Protest Walk (#2) Saturday and Sunday down by 7.4% and 11.5%, respectively, over same
quarter last year

6
On-Time Service - Customer
On-
Tim
e Se
rvic
e-C
usto
mer
60%
70%
80%
90%
100%
Jan Feb Mar April May June July Aug Sept Oct Nov Dec Jan Feb Mar
Results
Goal
86.99%, 95.00% goal not met, down 3.46 % 8/10 biggest delays due to “People” or “Weather” Delay events causing the most late trains:
1 06‐Feb‐17 Balboa Park Equip 204
2 13‐Jan‐17 19th St. I‐Lk Equip 169
3 10‐Jan‐17 Balboa Park Weather 1604 27‐Mar‐17 W. Oakland People 935 21‐Jan‐17 M‐Line People 92
6 06‐Feb‐17 Hayward People 80
7 21‐Jan‐17 K & A Lines People 758 23‐Feb‐17 Powell People 689 17‐Mar‐17 Civic Center People 68
10 07‐Feb‐17 E.C.D. Norte People 66Train Struck Person On Trackway (1750‐2154) BPD/SFPD Hold (Bomb Threat)(0927‐1253) (Station Evacuated/Service Truncated)BPD Hold (Weapon Suspect)(0719‐0957) (Multiple Holds at M30 & M20)Civil Protest Women's March(0930‐1500)(Trains metered A10 ‐ Crowding)
BPD Hold (Suspicious Package Under Track)(1642‐2037) (Bomb Squad on Scene/Station Closed/1642‐1946)
Civil Protest Women's March(1030‐1753)Auto Accident Adjacent To Trackway (0820‐1209) (Power Line Knocked Down)
Southbound Train Struck Tree on Trackway (Weather Conditions)
Maint. Vehicle Derailed (Single Tracking Required)(0407‐0915)
MUX (False Occupancy) (Single Tracking For Repairs) (Shorted Lightning Arrester Repaired)
7
On-Time Service - TrainO
n-Ti
me
Serv
ice
-Tra
in
60%
70%
80%
90%
100%
Jan Feb MarAprilMayJuneJuly AugSept Oct Nov Dec Jan Feb Mar
Results
Goal
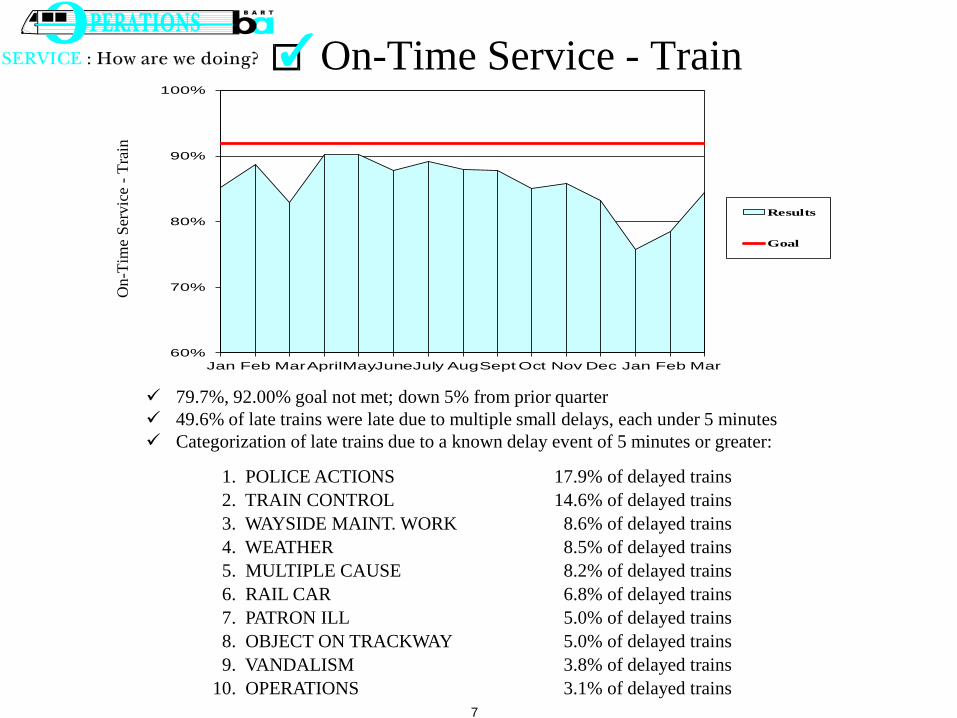
79.7%, 92.00% goal not met; down 5% from prior quarter 49.6% of late trains were late due to multiple small delays, each under 5 minutes Categorization of late trains due to a known delay event of 5 minutes or greater:
1. POLICE ACTIONS 17.9% of delayed trains2. TRAIN CONTROL 14.6% of delayed trains3. WAYSIDE MAINT. WORK 8.6% of delayed trains4. WEATHER 8.5% of delayed trains5. MULTIPLE CAUSE 8.2% of delayed trains6. RAIL CAR 6.8% of delayed trains7. PATRON ILL 5.0% of delayed trains8. OBJECT ON TRACKWAY 5.0% of delayed trains9. VANDALISM 3.8% of delayed trains
10. OPERATIONS 3.1% of delayed trains
8
0.0
0.5
1.0
1.5
2.0
2.5
3.0
3.5
4.0
4.5
5.0
Jan Feb Mar April May June July Aug Sept Oct Nov Dec Jan Feb Mar
Results
Goal
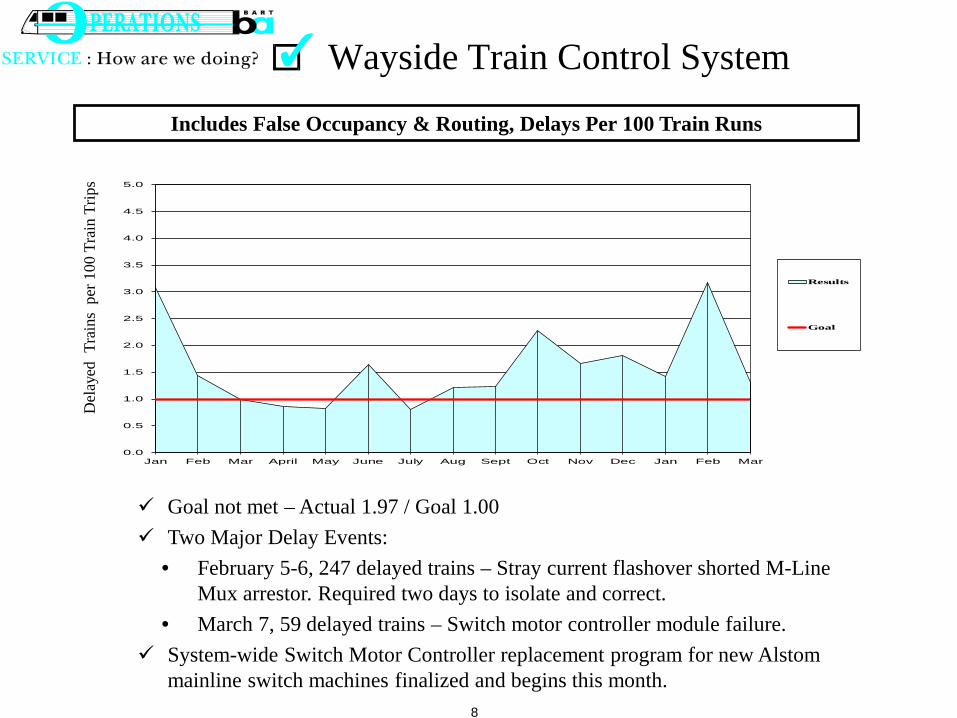
Wayside Train Control System
Goal not met – Actual 1.97 / Goal 1.00 Two Major Delay Events:
• February 5-6, 247 delayed trains – Stray current flashover shorted M-Line Mux arrestor. Required two days to isolate and correct.
• March 7, 59 delayed trains – Switch motor controller module failure. System-wide Switch Motor Controller replacement program for new Alstom
mainline switch machines finalized and begins this month.
Includes False Occupancy & Routing, Delays Per 100 Train Runs
Del
ayed
Tra
ins
per 1
00 T
rain
Trip
s

9
Computer Control System
0.00.10.20.30.40.50.60.70.80.91.0
Jan Feb Mar April May June July Aug Sept Oct Nov Dec Jan Feb Mar
Results
Goal
Includes ICS computer & SORS, Delays per 100 train runs
Del
ayed
Tra
ins
per 1
00 T
rain
Trip
s
Goal met
10
0.0
0.5
1.0
1.5
2.0
2.5
Jan Feb Mar April MayJune July Aug Sept Oct Nov Dec Jan Feb Mar
Results
Goal
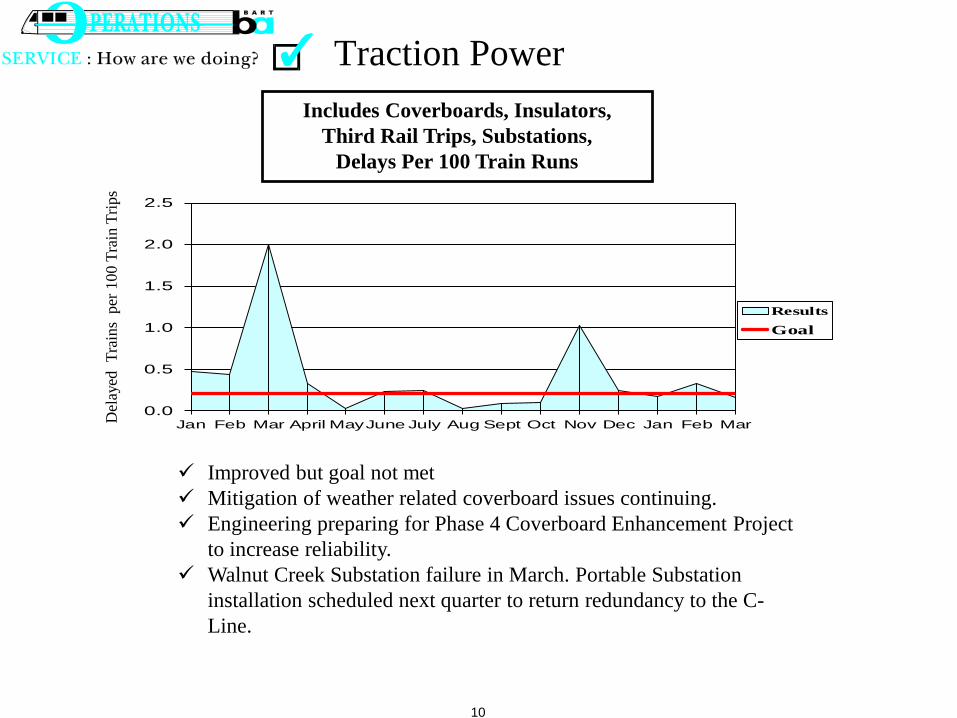
Traction Power Includes Coverboards, Insulators,
Third Rail Trips, Substations, Delays Per 100 Train Runs
Del
ayed
Tra
ins
per 1
00 T
rain
Trip
s
Improved but goal not met Mitigation of weather related coverboard issues continuing. Engineering preparing for Phase 4 Coverboard Enhancement Project
to increase reliability. Walnut Creek Substation failure in March. Portable Substation
installation scheduled next quarter to return redundancy to the C-Line.

11
0.0
0.5
1.0
1.5
Jan Feb Mar April May June July Aug Sept Oct Nov Dec Jan Feb Mar
Results
Goal
Transportation
Includes Late Dispatches, Controller-Train Operator-Tower Procedures and Other Operational Delays Per 100 Train Runs
Del
ayed
Tra
ins
per 1
00 T
rain
Trip
s
Goal met

12
Goal met
Track
Includes Rail, Track Tie, Misalignment, Switch,
Delays Per 100 Train Runs
Del
ayed
Tra
ins
per 1
00 T
rain
Trip
s
0.0
0.5
1.0
1.5
2.0
2.5
3.0
Jan Feb Mar Apr May Jun Jul Aug Sep Oct Nov Dec Jan Feb Mar
Results
Goal

13
Car Equipment - ReliabilityM
ean
Tim
e B
etw
een
Serv
ice
Del
ays (
Hou
rs)
2500
3000
3500
4000
4500
5000
5500
6000
6500
7000
7500
Jan Feb Mar April May June July Aug Sept Oct Nov Dec Jan Feb Mar
Results
Goal
Goal met – MTBSD 5,036 hours
14
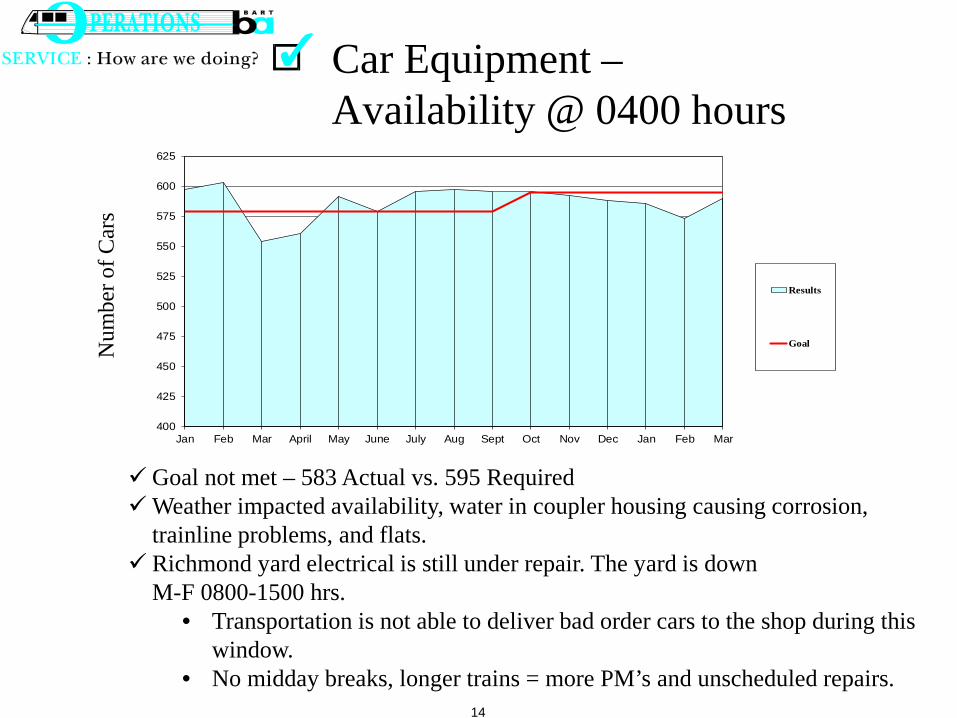
Car Equipment –Availability @ 0400 hours
Num
ber o
f Car
s
400
425
450
475
500
525
550
575
600
625
Jan Feb Mar April May June July Aug Sept Oct Nov Dec Jan Feb Mar
Results
Goal
Goal not met – 583 Actual vs. 595 RequiredWeather impacted availability, water in coupler housing causing corrosion,
trainline problems, and flats. Richmond yard electrical is still under repair. The yard is down
M-F 0800-1500 hrs. • Transportation is not able to deliver bad order cars to the shop during this
window. • No midday breaks, longer trains = more PM’s and unscheduled repairs.
15
80%
85%
90%
95%
100%
Jan Feb Mar April May June July Aug Sept Oct Nov Dec Jan Feb Mar
ActiveGoalAll
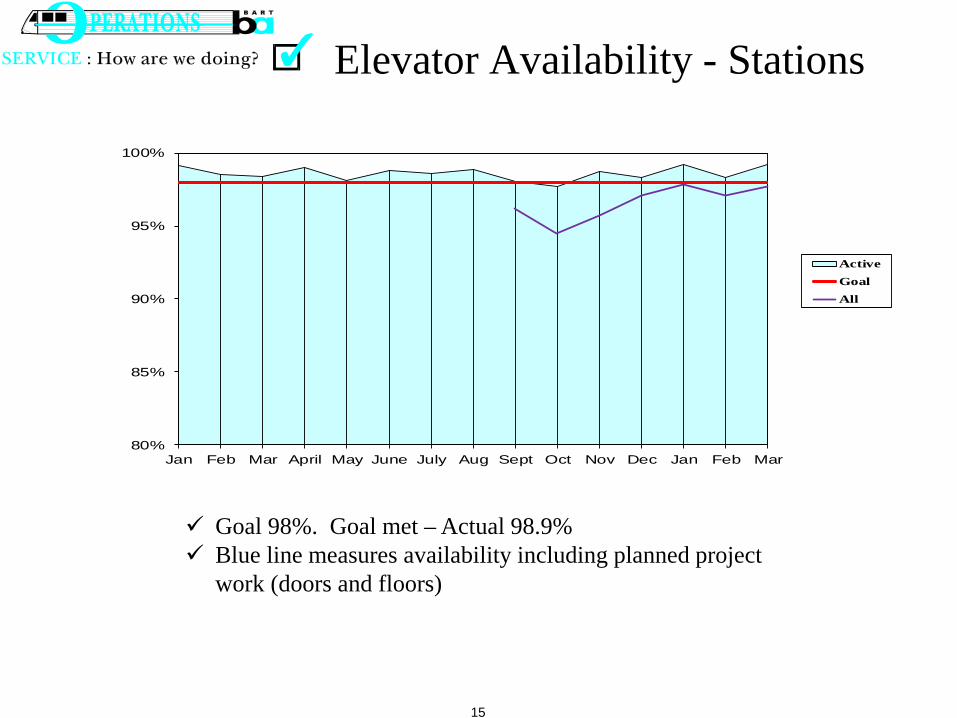
Elevator Availability - Stations
Goal 98%. Goal met – Actual 98.9% Blue line measures availability including planned project
work (doors and floors)
16
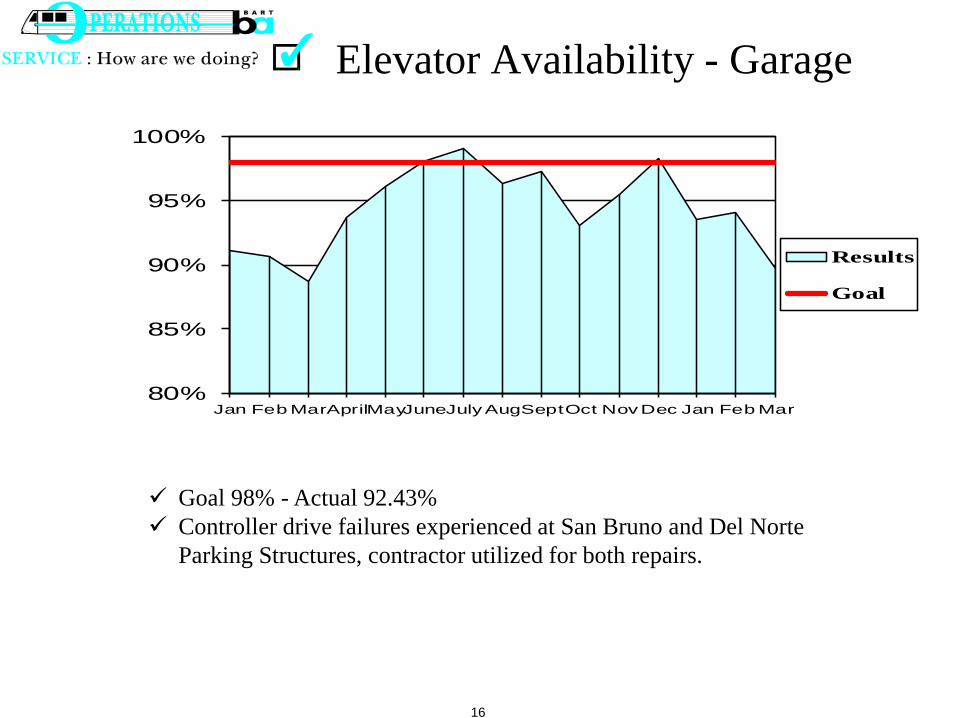
Elevator Availability - Garage
80%
85%
90%
95%
100%
Jan Feb MarAprilMayJuneJulyAugSeptOct NovDec Jan Feb Mar
Results
Goal
Goal 98% - Actual 92.43% Controller drive failures experienced at San Bruno and Del Norte
Parking Structures, contractor utilized for both repairs.

17
60%
70%
80%
90%
100%
Jan Feb Mar April May June July Aug Sept Oct Nov Dec Jan Feb Mar
Results
Goal
WeightedAvailability
Escalator Availability - Street
Goal 95% - Actual 79%• Record rain fall resulted in water intrusion electrical failures in
multiple units and impeded our ability to troubleshoot / repair during inclement weather.
• There were 12 significant street failures, 10 of which were O&K units.• O&K Controller Mod is underway at Montgomery and Embarcadero.

18
60%
70%
80%
90%
100%
Jan Feb Mar April May June July Aug Sept Oct Nov Dec Jan Feb Mar
Results
Goal
WeightedAvailability
Escalator Availability - Platform
Goal 96% - Actual 95.77%. • Three major Bullgear repairs Civic Center, 12th St., and 16th St.• 16th St. should be repaired in May • Montgomery recently identified as a major bullgear repair.• Currently looking for additional local machine shops to improve turn
around time.

19
AFC Gate Availability
60%
70%
80%
90%
100%
Jan Feb Mar April May June July Aug Sept Oct Nov Dec Jan Feb Mar
Results
Goal
Goal not met - 98.92% Working to resolve problem with Gate Aisle Sensor on Asset Refresh
• Testing Cubic provided software fix

20
60%
70%
80%
90%
100%
Jan Feb Mar April May June July Aug Sept Oct Nov Dec Jan Feb Mar
Results
Goal
AFC Vendor Availability
Goal met, 95.63% Add Fare Availability – 98.4% Parking Validation Machines Availability – 99.99%

21
2.75 2.73 2.71 2.75 2.73
1
2
3
4
FY2016 Qtr 3 FY2016 Qtr 4 FY2017 Qtr 1 FY2017 Qtr 2 FY2017 Qtr 3
Results
Goal
Environment - Outside Stations
Composite rating of:Walkways & Entry Plaza Cleanliness (50%) 2.64BART Parking Lot Cleanliness (25%) 2.92 ↓
Appearance of BART Landscaping (25%) 2.74
Goal not met (Landscaping sub-goal met) Cleanliness ratings of either Excellent or Good:
Walkways/Entry Plazas: 59.6% Parking Lots: 75.8%Landscaping Appearance: 66.1%
Ratings guide: 4 = Excellent3 = Good2.80 = Goal2 = Only Fair 1 = Poor
↓ indicates a statistically significant decrease from the prior quarter
22
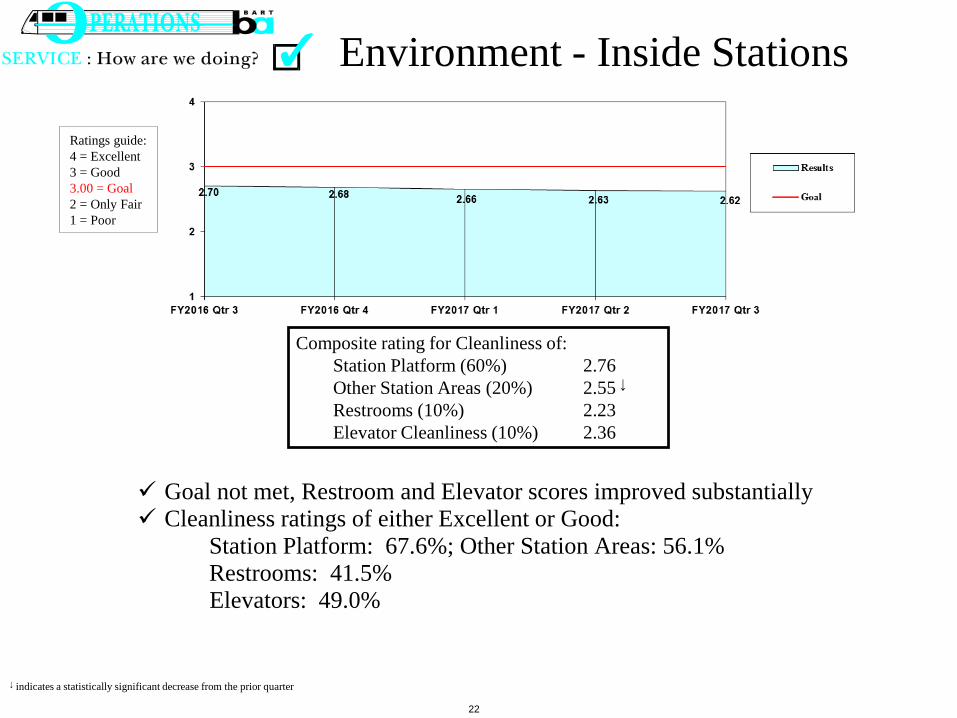
Environment - Inside Stations
Goal not met, Restroom and Elevator scores improved substantially Cleanliness ratings of either Excellent or Good:
Station Platform: 67.6%; Other Station Areas: 56.1% Restrooms: 41.5%Elevators: 49.0%
Composite rating for Cleanliness of:Station Platform (60%) 2.76Other Station Areas (20%) 2.55 ↓
Restrooms (10%) 2.23Elevator Cleanliness (10%) 2.36
Ratings guide: 4 = Excellent3 = Good3.00 = Goal2 = Only Fair 1 = Poor
↓ indicates a statistically significant decrease from the prior quarter
23
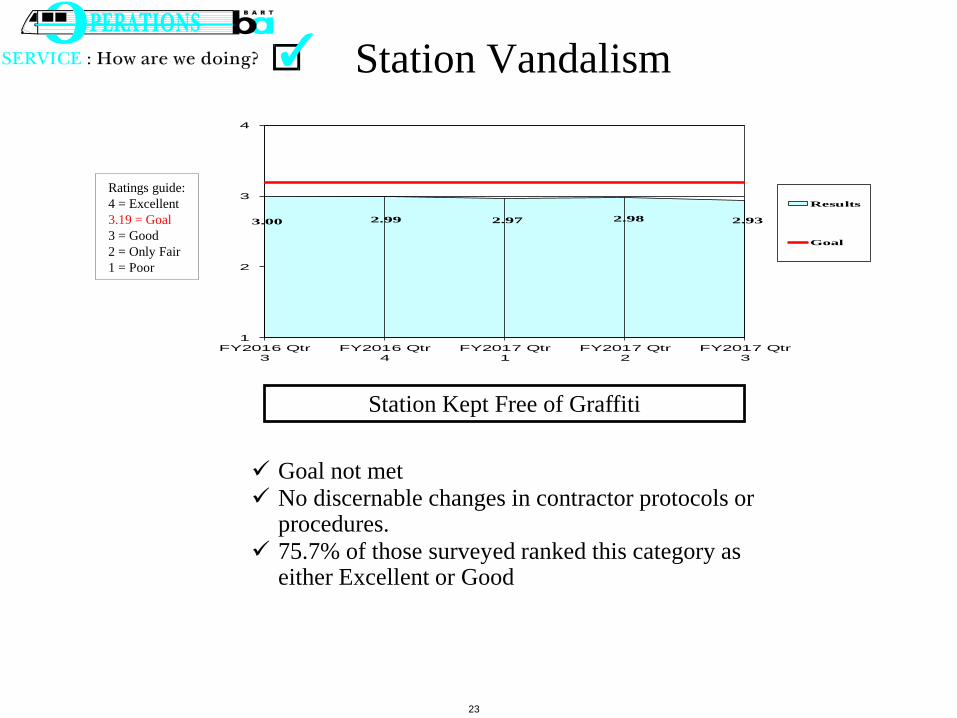
Station Vandalism
3.00 2.99 2.97 2.98 2.93
1
2
3
4
FY2016 Qtr3
FY2016 Qtr4
FY2017 Qtr1
FY2017 Qtr2
FY2017 Qtr3
Results
Goal
Goal not met No discernable changes in contractor protocols or
procedures. 75.7% of those surveyed ranked this category as
either Excellent or Good
Station Kept Free of Graffiti
Ratings guide: 4 = Excellent3.19 = Goal3 = Good2 = Only Fair 1 = Poor

24
Station Services
2.95 2.94 2.92 2.88 2.90
1
2
3
4
FY2016 Qtr3
FY2016 Qtr4
FY2017 Qtr1
FY2017 Qtr2
FY2017 Qtr3
Results
Goal
Composite rating of:Station Agent Availability (65%) 2.87Brochures Availability (35%) 2.96
Goal not met but slightly improved in both categories Availability ratings of either Excellent or Good:
Station Agents: 71.6%Brochures: 76.3%
Ratings guide: 4 = Excellent3.06 = Goal3 = Good2 = Only Fair 1 = Poor
25
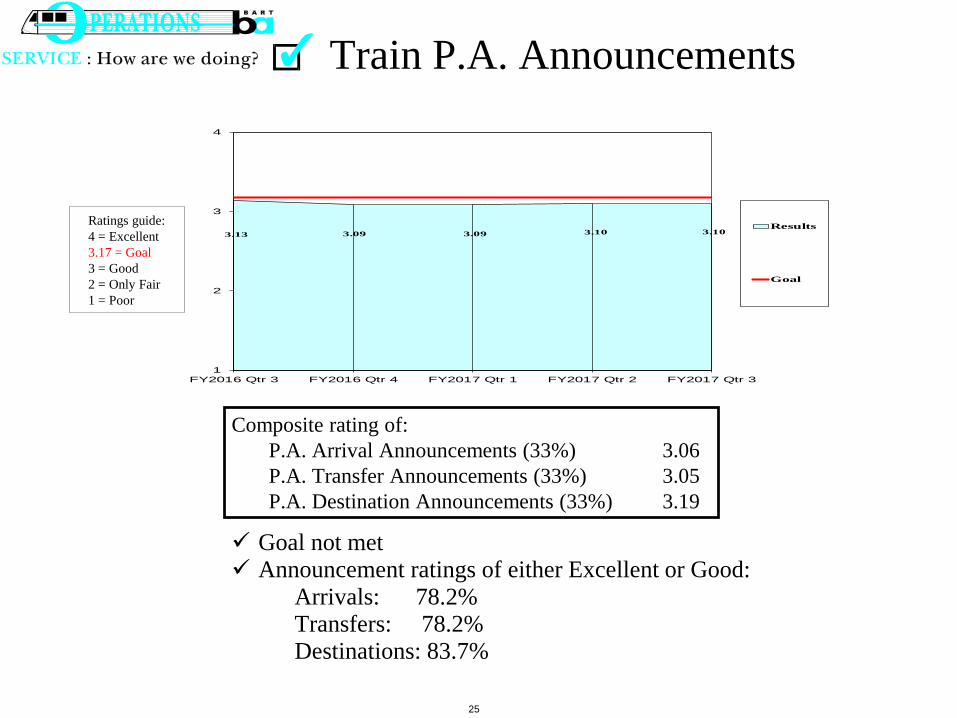
Train P.A. Announcements
3.13 3.09 3.09 3.10 3.10
1
2
3
4
FY2016 Qtr 3 FY2016 Qtr 4 FY2017 Qtr 1 FY2017 Qtr 2 FY2017 Qtr 3
Results
Goal
Goal not met Announcement ratings of either Excellent or Good:
Arrivals: 78.2% Transfers: 78.2% Destinations: 83.7%
Composite rating of:P.A. Arrival Announcements (33%) 3.06P.A. Transfer Announcements (33%) 3.05P.A. Destination Announcements (33%) 3.19
Ratings guide: 4 = Excellent3.17 = Goal3 = Good2 = Only Fair 1 = Poor

26
Train Exterior Appearance
Goal not met73.5% of those surveyed ranked this category as either Excellent or Good
2.88 2.85 2.86 2.83 2.82
1
2
3
4
FY2016Qtr 3
FY2016Qtr 4
FY2017Qtr 1
FY2017Qtr 2
FY2017Qtr 3
Results
Goal
Ratings guide: 4 = Excellent3.00 = Goal3 = Good2 = Only Fair 1 = Poor

27
Train Interior Cleanliness
Composite rating of:Train interior cleanliness (60%) 2.58 ↓
Train interior kept free of graffiti (40%) 3.27 ↓
Goal not met Train Interior ratings of either Excellent or Good:
Train Interior Cleanliness: 57.3%; Graffiti-free: 89.4% Pulled resources from scrub crew to address increased reports of bio-waste
and debris, impacts cycle time for thorough cleaning Changed start times for some cleaners to provide better AM Rush coverage
2.95 2.94 2.95 2.89 2.86
1
2
3
4
FY2016 Qtr 3 FY2016 Qtr 4 FY2017 Qtr 1 FY2017 Qtr 2 FY2017 Qtr 3
Results
Goal
Ratings guide: 4 = Excellent3 = Good3.00 = Goal2 = Only Fair 1 = Poor
↓ indicates a statistically significant decrease from the prior quarter

28
Train Temperature
Comfortable Temperature Onboard Train
Goal met 85.0 % of those surveyed rated this category as either
Excellent or Good
Ratings guide: 4 = Excellent3.12 = Goal3 = Good2 = Only Fair 1 = Poor

29
Customer ComplaintsPe
r 100
,000
Cus
tom
ers
02468
101214
Jan Feb Mar April May June July Aug Sept Oct Nov Dec Jan Feb Mar
Results
Goal
Total complaints increased 437 (21.7%) from last quarter, up 274 (12.6%) when compared with the third quarter of last Fiscal Year.
Complaint numbers increased in all categories except “AFC”, “Trains” and “Passenger Information” which all improved.
“Compliments” are up at 157 from 86 last quarter (one year ago these numbered 140).
Complaints Per 100,000 Customers

30
0
1
2
3
4
5
6
7
8
9
10
FY2016 Qtr 3 FY2016 Qtr 4 FY2017 Qtr 1 FY2017 Qtr 2 FY2017 Qtr 3
Results
Benchmark
Patron Safety:Station Incidents per Million Patrons
Stat
ion
Inci
dent
s/M
illio
n Pa
trons
Goal met

31
0
1
2
3
4
FY2016 Qtr 3 FY2016 Qtr 4 FY2017 Qtr 1 FY2017 Qtr 2 FY2017 Qtr 3
Results
Benchmark
Patron SafetyVehicle Incidents per Million Patrons
Vehi
cle
Inci
dent
s/M
illio
n Pa
trons
Goal met

32
Employee Safety:Lost Time Injuries/Illnessesper OSHA Incidence Rate
Lost
Tim
e In
jurie
s/Ill
ness
per
OSH
A ra
te
0
2
4
6
8
10
12
14
16
FY2016 Qtr 3 FY2016 Qtr 4 FY2017 Qtr 1 FY2017 Qtr 2 FY2017 Qtr 3
Results
Benchmark
Goal met
33
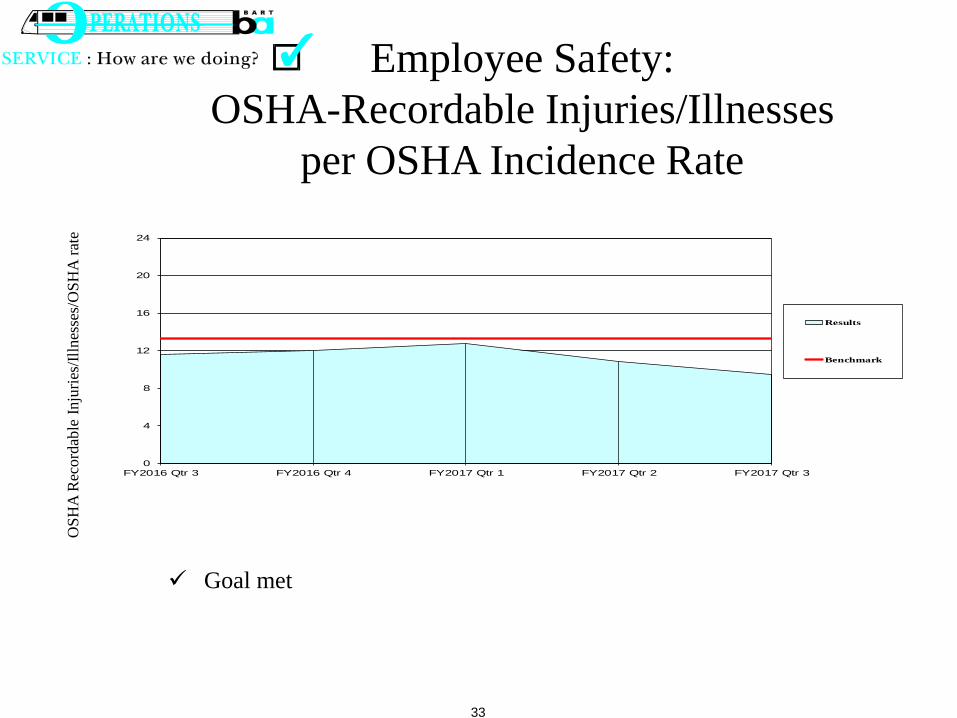
Employee Safety:OSHA-Recordable Injuries/Illnesses
per OSHA Incidence Rate
0
4
8
12
16
20
24
FY2016 Qtr 3 FY2016 Qtr 4 FY2017 Qtr 1 FY2017 Qtr 2 FY2017 Qtr 3
Results
Benchmark
OSH
A R
ecor
dabl
e In
jurie
s/Ill
ness
es/O
SHA
rate
Goal met

34
0.000
0.100
0.200
0.300
0.400
0.500
0.600
0.700
0.800
0.900
1.000
FY2016 Qtr 3 FY2016 Qtr 4 FY2017 Qtr 1 FY2017 Qtr 2 FY2017 Qtr 3
Results
Benchmark
Operating Safety:Unscheduled Door Openings per Million Car Miles
Uns
ched
uled
Doo
r Ope
ning
s/M
illio
n C
ar M
iles
Goal not met – Train Operators reminded to adhere to proper procedures. Types of violations:
– Non-platform side (2)– Improper lock out– Train moved with doors open (2)
35
Operating Safety:Rule Violations per Million Car Miles
0.0
0.5
1.0
1.5
FY2016 Qtr 3 FY2016 Qtr 4 FY2017 Qtr 1 FY2017 Qtr 2 FY2017 Qtr 3
Results
Benchmark
Rul
e V
iola
tions
per
Mill
ion
Car
Mile
s
Goal met
36
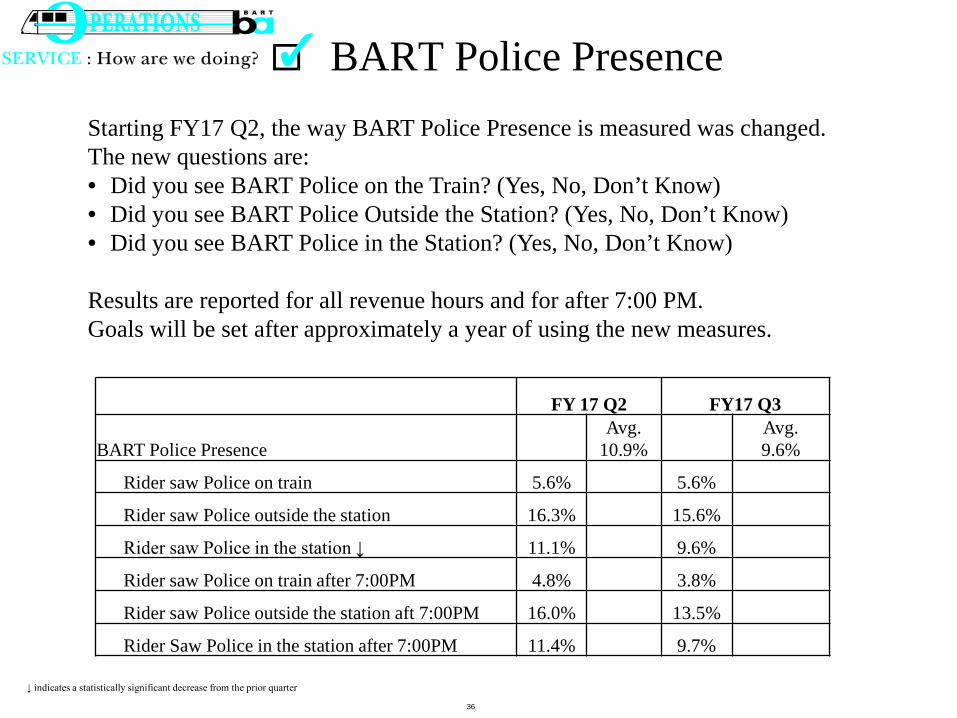
BART Police PresenceStarting FY17 Q2, the way BART Police Presence is measured was changed. The new questions are:• Did you see BART Police on the Train? (Yes, No, Don’t Know)• Did you see BART Police Outside the Station? (Yes, No, Don’t Know)• Did you see BART Police in the Station? (Yes, No, Don’t Know)
Results are reported for all revenue hours and for after 7:00 PM.Goals will be set after approximately a year of using the new measures.
FY 17 Q2 FY17 Q3
BART Police PresenceAvg.
10.9%Avg.9.6%
Rider saw Police on train 5.6% 5.6%
Rider saw Police outside the station 16.3% 15.6%
Rider saw Police in the station ↓ 11.1% 9.6%
Rider saw Police on train after 7:00PM 4.8% 3.8%
Rider saw Police outside the station aft 7:00PM 16.0% 13.5%
Rider Saw Police in the station after 7:00PM 11.4% 9.7%
↓ indicates a statistically significant decrease from the prior quarter
37
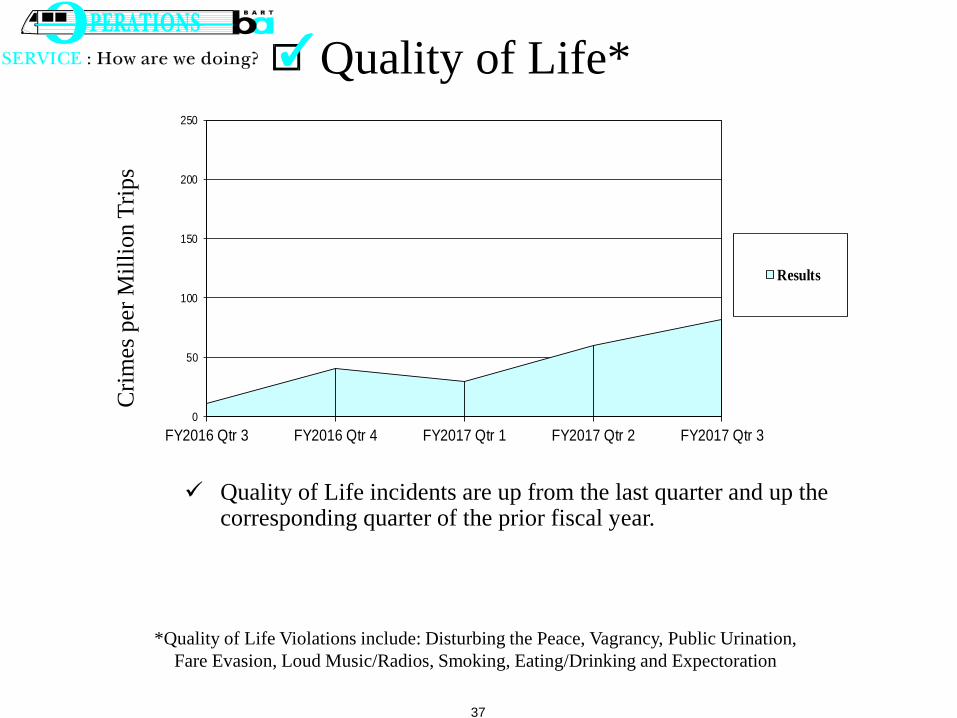
Quality of Life*C
rimes
per
Mill
ion
Trip
s
*Quality of Life Violations include: Disturbing the Peace, Vagrancy, Public Urination,Fare Evasion, Loud Music/Radios, Smoking, Eating/Drinking and Expectoration
Quality of Life incidents are up from the last quarter and up the corresponding quarter of the prior fiscal year.
0
50
100
150
200
250
FY2016 Qtr 3 FY2016 Qtr 4 FY2017 Qtr 1 FY2017 Qtr 2 FY2017 Qtr 3
Results

38
Crimes Against Persons(Homicide, Rape, Robbery, and Aggravated Assault)
Crim
es p
er M
illio
n Tr
ips
0
1
2
3
4
FY2016 Qtr 3 FY2016 Qtr 4 FY2017 Qtr 1 FY2017 Qtr 2 FY2017 Qtr 3
Results
Goal
Goal not met Crimes against persons are up from the last quarter and up from the
corresponding quarter of the prior fiscal year.

39
Auto BurglaryC
rimes
per
100
0 Pa
rkin
g Sp
aces
0
2
4
6
8
10
12
FY2016 Qtr 3 FY2016 Qtr 4 FY2017 Qtr 1 FY2017 Qtr 2 FY2017 Qtr 3
Results
Goal
Goal met The number of incidents per thousand parking spaces are up from last
quarter and up the corresponding quarter from the prior fiscal year.

40
Auto TheftC
rimes
per
100
0 Pa
rkin
g Sp
aces
0
2
4
6
8
10
12
FY2016 Qtr 3 FY2016 Qtr 4 FY2017 Qtr 1 FY2017 Qtr 2 FY2017 Qtr 3
Results
Goal
Goal met The number of incidents per thousand parking spaces are down from last
quarter and down the corresponding quarter from the prior fiscal year.
41
0
2
4
6
8
10
FY2016 Qtr 3 FY2016 Qtr 4 FY2017 Qtr 1 FY2017 Qtr 2 FY2017 Qtr 3
Results
Goal
Average Emergency Response TimeR
espo
nse
Tim
e (in
Min
utes
)
The average Emergency Response Time goal was not met for the quarter but improved over the previous 3 quarters.
42
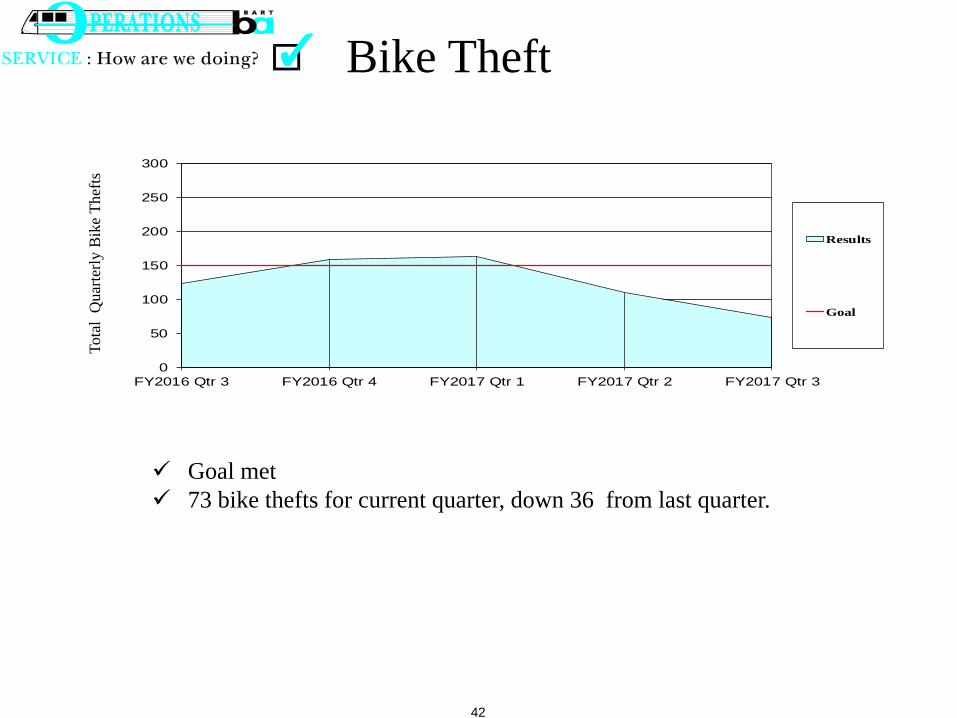
Bike TheftTo
tal
Qua
rterly
Bik
e Th
efts
0
50
100
150
200
250
300
FY2016 Qtr 3 FY2016 Qtr 4 FY2017 Qtr 1 FY2017 Qtr 2 FY2017 Qtr 3
Results
Goal
Goal met 73 bike thefts for current quarter, down 36 from last quarter.