quarterly update fy17 fourth quarter - investors |...
TRANSCRIPT

1 Johnson Controls plc. – November 9, 2017
Quarterly UpdateFY17 Fourth Quarter
November 9, 2017

2 Johnson Controls plc. – November 9, 2017
Johnson Controls International plc Cautionary Statement Regarding Forward-Looking Statements
Johnson Controls International plc has made statements in this communication that are forward-looking and therefore are subject to risks and uncertainties. All statements in this document other than statements of historical fact are, or could be, “forward-looking statements” within the meaning of the Private Securities Litigation Reform Act of 1995. In this communication, statements regarding Johnson Controls’ future financial position, sales, costs, earnings, cash flows, other measures of results of operations, synergies and integration opportunities, capital expenditures and debt levels are forward-looking statements. Words such as “may,” “will,” “expect,” “intend,” “estimate,” “anticipate,” “believe,” “should,” “forecast,” “project” or “plan” and terms of similar meaning are also generally intended to identify forward-looking statements. However, the absence of these words does not mean that a statement is not forward-looking. Johnson Controls cautions that these statements are subject to numerous important risks, uncertainties, assumptions and other factors, some of which are beyond Johnson Controls’ control, that could cause Johnson Controls’ actual results to differ materially from those expressed or implied by such forward-looking statements, including, among others, risks related to: any delay or inability of Johnson Controls to realize the expected benefits and synergies of recent portfolio transactions such as the merger with Tyco and the spin-off of Adient, changes in tax laws, regulations, rates, policies or interpretations, the loss of key senior management, the tax treatment of recent portfolio transactions, significant transaction costs and/or unknown liabilities associated with such transactions, the outcome of actual or potential litigation relating to such transactions, the risk that disruptions from recent transactions will harm Johnson Controls’ business, the strength of the U.S. or other economies, automotive vehicle production levels, mix and schedules, energy and commodity prices, the availability of raw materials and component products, currency exchange rates, and cancellation of or changes to commercial arrangements. A detailed discussion of risks related toJohnson Controls’ business is included in the section entitled “Risk Factors” in Johnson Controls’ Annual Report on Form 10-K for the 2016 fiscal year filed with the SEC on November 23, 2016, and in the quarterly reports on Form 10-Q filed with the SEC aftersuch date, and available at www.sec.gov and www.johnsoncontrols.com under the “Investors” tab. Shareholders, potential investorsand others should consider these factors in evaluating the forward-looking statements and should not place undue reliance on such statements. The forward-looking statements included in this communication are made only as of the date of this document, unless otherwise specified, and, except as required by law, Johnson Controls assumes no obligation, and disclaims any obligation, toupdate such statements to reflect events or circumstances occurring after the date of this communication.

3 Johnson Controls plc. – November 9, 2017
Non GAAP Financial Information
This presentation contains financial information regarding adjusted earnings per share, which is a non-GAAP performance measure.The adjusting items include mark-to-market for pension and postretirement plans, transaction/integration/separation costs, restructuring and impairment costs, nonrecurring purchase accounting impacts related to the Tyco merger, an unfavorable arbitration award and discrete tax items. Financial information regarding adjusted sales, adjusted organic sales, adjusted segment EBITA, adjusted segment EBITA margin, adjusted corporate expense, adjusted EBIT, free cash flow, adjusted free cash flow, and free cash flow conversion are also presented, which are non-GAAP performance measures. Adjusted segment EBITA excludes special items such as transaction/integration/separation costs and nonrecurring purchase accounting impacts because these costs are not considered to be directly related to the operating performance of its business units. Management believes that, when consideredtogether with unadjusted amounts, these non-GAAP measures are useful to investors in understanding period-over-period operating results and business trends of the Company. Management may also use these metrics as guides in forecasting, budgeting and long-term planning processes and for compensation purposes. These metrics should be considered in addition to, and not as replacements for, the most comparable GAAP measure. Reconciliations of non-GAAP performance measures can be found in the attached footnotes.

4 Johnson Controls plc. – November 9, 2017
Agenda
Fourth Quarter HighlightsGeorge Oliver, Chairman and Chief Executive Officer
IntroductionAntonella Franzen, Vice President, Investor Relations
2018 GuidanceGeorge Oliver, Chairman and Chief Executive Officer
Q&A
2
4
5
1
Business Results & Financial ReviewBrian Stief, Executive Vice President and Chief Financial Officer3
4 Johnson Controls plc. – November 9, 2017

5 Johnson Controls plc. – November 9, 2017
A Year in Review
What Needs to ImproveWhat Went Well
Significant progress related to merger integration
- Reorganization complete- Merger / Productivity cost savings
EBIT margin expansion of 90 bps
Completed Adient spin-off and sale of Scott Safety
Opportunistic share repurchases- ~$650M of buybacks
Organic growth and orders in Buildings
Gross margins in Buildings
Free cash flow conversion
Consistently delivering on our commitments
6 Johnson Controls plc. – November 9, 2017
What Is Changing As We Move Forward
Senior leadership team fully aligned to driving execution
Compensation incentives directly linked to organic sales growth, EBIT growth, and free cash flow conversion
Increasing sales capacity and execution
Establishment of cash management office to drive free cash flow conversion
Disciplined capital allocation with continued opportunistic share repurchases
Ongoing review of portfolio / non-core divestitures
Setting grounded expectations
Lead with clarity, simplicity, and confidence
Creating Long-term Shareholder Value At The Forefront Of All We Do

7 Johnson Controls plc. – November 9, 2017
FY17 Fourth Quarter Earnings from Continuing Operations*
+4%+2%
FY17 Q4 FY16 Q4
$8.1 B $7.8 B
NET SALES
FY17 Q4 FY16 Q4
$1,131 M
$1,025 M
EBIT
+10%
+14%
DILUTED EPS
FY17 Q4 FY16 Q4
$0.87
$0.76
Organic
COMBINED
COMBINED
COMBINED
Reported
*Non-GAAP excludes special items. 2016 results combine legacy Johnson Controls and legacy Tyco adjusted results. See footnotes for reconciliation.
Reported
+10% Excluding FX
and Lead
EBIT Margin
Reported
+110bps Excluding FX
and Lead
+80bps

8 Johnson Controls plc. – November 9, 2017
FY17 Q4 Results vs. Prior Year*
*Non-GAAP excludes special items. 2016 results combine legacy Johnson Controls and legacy Tyco adjusted results. See footnotes for reconciliation.
$0.87
($0.01)
$0.09 $0.01 $0.02
$0.76
EPS BRIDGE
F Y 1 6 Q 4
C O M B I N E D *
S Y N E R G I E S &P R O D U C T I V I T Y
V O L U M E /M I X
F Y 1 7 Q 4
A C T U A L *
I N V E S T M E N T ST A XR A T E
EPS* Growth of 14% year-over-year
9 Johnson Controls plc. – November 9, 2017
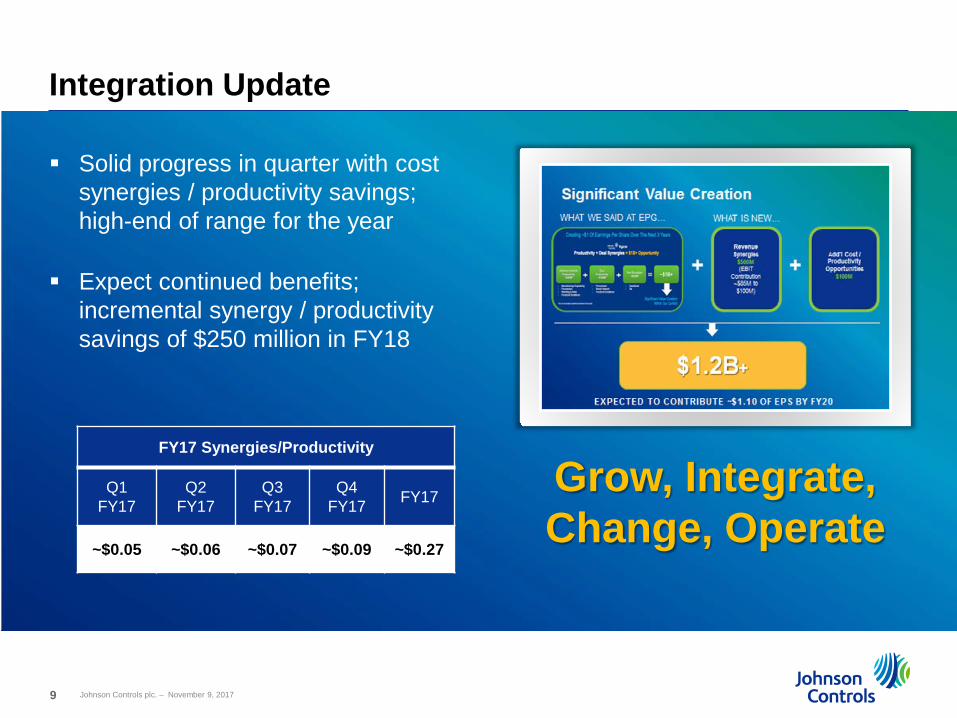
Integration Update
Solid progress in quarter with cost synergies / productivity savings; high-end of range for the year
Expect continued benefits; incremental synergy / productivity savings of $250 million in FY18
Grow, Integrate, Change, Operate
FY17 Synergies/Productivity
Q1 FY17
Q2 FY17
Q3 FY17
Q4 FY17 FY17
~$0.05 ~$0.06 ~$0.07 ~$0.09 ~$0.27

10 Johnson Controls plc. – November 9, 201710 Johnson Controls plc. – November 9, 2017
Fire & Security
HVAC & Controls*
Latin America
ME&Africa
Europe Building Management
HVAC/R Equipment
Specialty Products
Chillers Unitary Hitachi HVAC Products Industrial Refrigeration Marine
Controls Fire Detection SecurityBuilding
Solutions Field / Direct Channel
~$15B FY17 Sales
GlobalProducts
Indirect Channel
~$8B FY17 Sales
Scott Safety Fire Suppression
Building Technologies & Solutions Segment Structure
$23B
*Includes performance contracting.

11 Johnson Controls plc. – November 9, 2017
Building Technologies & Solutions*Strong Margin Expansion
(1)%
+1%FY17 Q4 FY16 Q4
$6.0BNET SALES
+5%
FY17 Q4 FY16 Q4
$904 M $863 M
SEGMENT EBITA
Organic
Organic sales growth +1%
Building Solutions down 1% - North America down low-single digits - EMEA /LA up low-single digits- Asia Pacific flat
Global Products +3%- Building Management up low single digits- HVAC & Refrigeration Equipment up low-single digits- Specialty Products up low-single digits
Segment EBITA margin +80bps Productivity savings and cost synergies Price cost pressure Product and channel investments
COMBINED
COMBINED
Reported
Excluding FX
Reported
+5%*Non-GAAP excludes special items. 2016 results combine legacy Johnson Controls and legacy Tyco adjusted results. See footnotes for reconciliation.
$6.0B

12 Johnson Controls plc. – November 9, 2017
Building Technologies & SolutionsOrders & Backlog
Orders secured +2% vs prior year (ex. FX and M&A) - Building Solutions: Flat
- North America down low-single digits- EMEA / LA down low-single digits- APAC up high-single digits
- Global Products: +5%
Backlog $8.5B, +4% vs prior year (ex. FX and M&A)
Q4 FY17COMBINED
Q4 FY16Y-o-Y
Ex. FX and M&A
Backlog $8.5B $8.2B +4%
13 Johnson Controls plc. – November 9, 2017
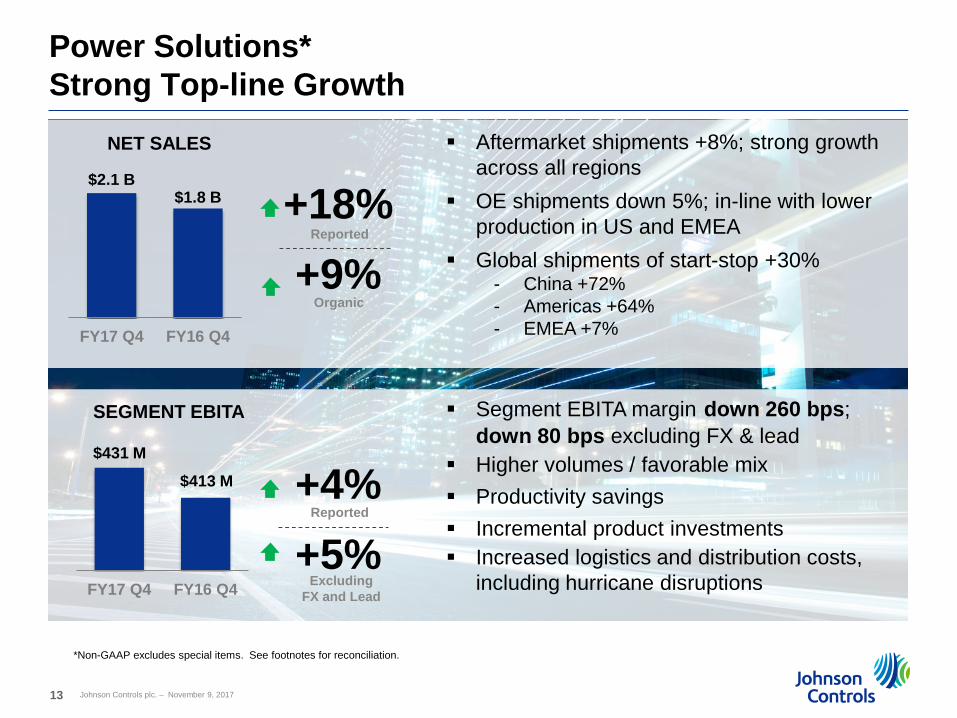
Power Solutions*Strong Top-line Growth
Segment EBITA margin down 260 bps; down 80 bps excluding FX & lead
Higher volumes / favorable mix Productivity savings Incremental product investments Increased logistics and distribution costs,
including hurricane disruptions
+18%+9%
FY17 Q4 FY16 Q4
$2.1 B$1.8 B
NET SALES
FY17 Q4 FY16 Q4
$431 M
$413 M
SEGMENT EBITA
Aftermarket shipments +8%; strong growth across all regions
OE shipments down 5%; in-line with lower production in US and EMEA
Global shipments of start-stop +30%- China +72%- Americas +64%- EMEA +7%
Organic
Reported
*Non-GAAP excludes special items. See footnotes for reconciliation.
+4%+5%
Excluding FX and Lead
Reported

14 Johnson Controls plc. – November 9, 2017
Corporate Expense*
Ongoing realization of synergy and productivity savings
Full year corporate expense of $465M vs. guidance of $480M to $500M (~14% improvement vs prior year) (25%)
FY17 Q4 FY16 Q4
$107 M
$143 M
CORPORATE EXPENSE
COMBINED
*Non-GAAP excludes special items. 2016 results combine legacy Johnson Controls and legacy Tyco adjusted results. See footnotes for reconciliation.

15 Johnson Controls plc. – November 9, 2017
$ In billions
Free Cash Flow
Adjusted free cash flow of $1.1 billion in the quarter
- Inventory and accounts receivable improvement of $200 million in Q4
Capex in-line with expectations
Expected FY18 free cash flow conversion 80%+
- Excludes net one-time payments of $800M to $900M related to integration, restructuring, and income taxes
FY17Q4 YTD
Cash provided by operating activities $1.3 $ -
Capital expenditures (0.3) (1.3)Reported free cash flow 1.0 (1.3)
Adjustments:
Transaction tax payments - 1.4Adient cash outflow - 0.3
Transaction related restructuring and change in control pension distributions
- 0.4
Transaction/integration/separation costs 0.1 0.5
Adjusted free cash flow $ 1.1 $ 1.3

16 Johnson Controls plc. – November 9, 2017
Balance Sheet Net debt to capital: 39.3% at 9/30/17 vs. 41.2% as of 6/30/17 Q4 debt issuances / repayments
Scott Safety divestiture closed Oct. 4th
- $1.9 billion net proceeds- 100% used to reduce $4 billion TSarl merger-related debt
Share repurchases- Q4: 5.5M shares; $225M- FY17: 15.7M shares; $651M
Note: Net debt = Total debt less cash
Repayments ~$1 billion commercial paper ~$165 million TSarl debt ~$150 million bonds
Issuances Interest Rate and Maturity
¥35 billion (~$310M) 0.40%; 5 year term
€150 million (~$175M) 0.775%; 1 year term

17 Johnson Controls plc. – November 9, 2017
Other Items
Q4 Special items- Restructuring and impairment costs- Transaction / integration costs- Unfavorable arbitration award- Pension / OPEB mark-to-market- Discrete income tax items
Buildings segment change
Evaluation of US Tax Reform

18 Johnson Controls plc. – November 9, 2017
FY18 GuidanceConsolidated
Sales$30.1 - $30.7B
Flat to +2% ReportedLow-single Digit Organic Growth
EBIT Margin12.2% - 12.4%
+30 to +50 bps(including 30 bps headwind related to
divestiture of Scott Safety)
EPS$2.75 - $2.85
+6% to +10%
Free Cash Flow Conversion
80%+Including Capital Expenditures of
up to $1.3B
Segment Details
Buildings Power
Low-single DigitsOrganic Growth
Low to Mid-single DigitsOrganic Growth
+10 to +30 bpsEBITA Margin Expansion
(including 40 bps headwind related to divestiture of Scott Safety)
down 10 to +10 bpsEBITA Margin Expansion
Corporate expense $425 to $440M Net Financing Charges $460 to $475M
Tailwind from TSarl debt pay down Headwinds from variable rate interest debt
Effective Tax Rate of ~14.0% Noncontrolling Interest of $200 to $210M Weighted Average Diluted Share Count ~935M
Other Items

19 Johnson Controls plc. – November 9, 2017
Appendix

20 Johnson Controls plc. – November 9, 2017
FY17 Fourth QuarterFinancial Highlights (continuing operations)
(in millions)2017GAAP
2017 *NON-GAAP
COMBINED2016 *NON-GAAP
% Change
Sales $8,136 $8,136 $7,848 4%
Gross profit% of sales
2,51330.9%
2,45330.1%
2,49031.7%
(1%)
SG&A expenses 1,253 1,385 1,518 (9%)
Restructuring & impairment costs 141 - -
Equity income 63 63 53 19%
EBIT $1,182 $1,131 $1,025 10%
14.5% 13.9% 13.1%
*Non-GAAP excludes special items. 2016 results combine legacy Johnson Controls and legacy Tyco adjusted results. See footnotes for reconciliation.
Gross Profit % Impact of lead prices, increased logistics and distribution costs, and price cost pressure
SG&A expense Ongoing productivity and synergy savings
EBIT margin +80 bps reflects realization of cost synergies and productivity savings; +110bps adjusted for FX and lead

21 Johnson Controls plc. – November 9, 2017
(in millions, except earnings per share)2017GAAP
2017 *NON-GAAP
COMBINED2016 *NON-GAAP
EBIT $1,182 $1,131 $1,025
Net financing charges 120 120 114
Income before income taxes 1,062 1,011 911
Income tax provision 135 152 155
Net income 927 859 756
Income attributable to noncontrolling interests 52 46 37
Net income attributable to JCI $875 $813 $719
Diluted EPS $0.93 $0.87 $0.76
FY17 Fourth QuarterFinancial Highlights (continuing operations)
Net financing charges Increase due to 2017 debt issuances
Income tax provision Tax rate of 15% in 2017 vs. 17% in 2016
Noncontrolling interests Increase due to improved performance in consolidated Hitachi JVs
*Non-GAAP excludes special items. 2016 results combine legacy Johnson Controls and legacy Tyco adjusted results. See footnotes for reconciliation.

22 Johnson Controls plc. – November 9, 2017
Special Items (continuing operations)
Q4 Pre-tax Income (Expense)
Tax (Expense) Benefit
NCI (Expense) Benefit
After-tax Income (Expense) EPS Impact
Integration Costs ($90) $16 $- ($74) ($0.08)
Restructuring & Impairment Costs (141) 14 - (127) (0.14)
Nonrecurring Purchase Accounting 2 (1) - 1 -
Unfavorable Arbitration Award (50) - - (50) (0.05)
Pension and Postretirement Mark-to-Market 330 (90) (4) 236 0.25
Discrete Income Tax Items - 78 (2) 76 0.08
Total $51 $17 ($6) $62 $0.06
$ In millions, except EPS
YTD Pre-tax Income (Expense)
Tax (Expense) Benefit
NCI (Expense) Benefit
After-tax Income (Expense) EPS Impact
Transaction/Separation Costs ($113) $12 $- ($101) ($0.11)
Integration Costs* (319) 57 - (262) (0.28)
Restructuring & Impairment Costs (367) 63 - (304) (0.32)
Nonrecurring Purchase Accounting (133) 35 - (98) (0.10)
Unfavorable Arbitration Award (50) - - (50) (0.05)
Pension and Postretirement Mark-to-Market 420 (126) (4) 290 0.31
Discrete Income Tax Items - (278) (2) (280) (0.30)
Total ($562) ($237) ($6) ($805) ($0.85)
*Includes $85M of sunk costs for which no synergies will be realized.

23 Johnson Controls plc. – November 9, 2017
Fourth Quarter and YTD FY17 Restructuring and Impairment Costs
Restructuring and Non-cash Impairment Charges Primarily Related to Workforce Reductions and Asset Impairments
Business Unit Cash Non-cash TotalQ4 YTD Q4 YTD Q4 YTD
Building Technologies & Solutions $35 $129 $3 $52 $38 $181
Power Solutions 13 13 3 7 16 20
Corporate 85 147 2 19 87 166
Total pre-tax charge $133 $289 $8 $78 $141 $367
Tax benefit (14) (63)
Total after-tax charge $127 $304
$ In millions

24 Johnson Controls plc. – November 9, 2017
2017 Full Year Foreign Exchange Impact
Q4 FX Impact Full Year FX Impact
2017 Sales $49M ($114M)
2017 EPS $0.00 ($0.03)
Top Foreign Currency ExposuresQ4
Average RatesFiscal Year
Average Rates
EUR/USD 1.18 1.11
USD/JPY 110.91 111.26
USD/CNY 6.67 6.81
USD/CAD 1.25 1.31
GBP/USD 1.31 1.27
USD/MXN 17.81 19.14

25 Johnson Controls plc. – November 9, 2017
2018 Full Year Foreign Exchange Impact
Full Year FX Impact
2018 Sales $265M
2018 EPS $0.04
Top Foreign Currency
ExposuresFX
Rates*
EUR/USD 1.16
USD/JPY 113.37
USD/CNY 6.63
USD/CAD 1.29
GBP/USD 1.32
USD/MXN 19.20
*As of 10/31/17

26 Johnson Controls plc. – November 9, 2017
Reorganized Segment Financial Information*
*Non-GAAP excludes special items. See 8-K filed November 9, 2017 for reconciliation.
Q1FY17 Q2FY17 Q3FY17 Q4FY17 FY17Building Solutions North America 1,942$ 2,074$ 2,135$ 2,165$ 8,316$ Building Solutions EMEA / LA 878 891 889 921 3,579 Building Solutions Asia Pacific 576 562 630 677 2,445 Global Products 1,800 2,014 2,406 2,241 8,461 Total Building Technologies & Solutions 5,196 5,541 6,060 6,004 22,801 Power Solutions 1,900 1,696 1,609 2,132 7,337 Sales 7,096 7,237 7,669 8,136 30,138
Building Solutions North America 236 12.2% 229 11.0% 290 13.6% 315 14.5% 1,070 12.9%Building Solutions EMEA / LA 65 7.4% 79 8.9% 89 10.0% 95 10.3% 328 9.2%Building Solutions Asia Pacific 72 12.5% 67 11.9% 84 13.3% 109 16.1% 332 13.6%Global Products 205 11.4% 253 12.6% 445 18.5% 385 17.2% 1,288 15.2%Total Building Technologies & Solutions 578 11.1% 628 11.3% 908 15.0% 904 15.1% 3,018 13.2%Power Solutions 390 20.5% 303 17.9% 304 18.9% 431 20.2% 1,428 19.5%Segment EBITA 968 13.6% 931 12.9% 1,212 15.8% 1,335 16.4% 4,446 14.8%
Amortization of Intangibles (103) (92) (90) (97) (382) Corporate Expenses (108) (128) (122) (107) (465) EBIT 757 10.7% 711 9.8% 1,000 13.0% 1,131 13.9% 3,599 11.9%Net Financing Charges (119) (116) (124) (120) (479) Income before Tax 638 595 876 1,011 3,120 Tax (96) (89) (131) (152) (468) Tax Rate 15.0% 15.0% 15.0% 15.0% 15.0%Noncontrolling Interest (40) (33) (74) (46) (193) Net Income 502$ 473$ 671$ 813$ 2,459$ EPS 0.53$ 0.50$ 0.71$ 0.87$ 2.60$ Diluted weighted average shares outstanding 947.4 948.6 944.4 938.0 944.6

27 Johnson Controls plc. – November 9, 2017
johnsoncontrols.com/investors@JCI_IR
November 9, 2017
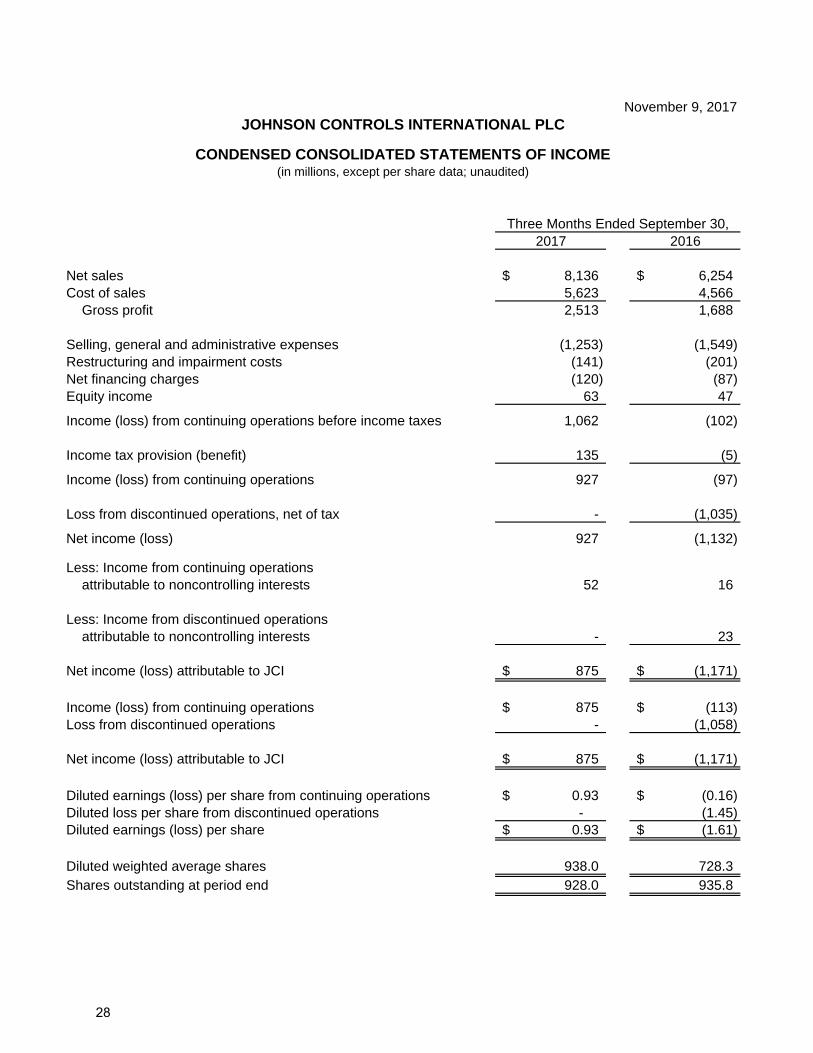
2017 2016
Net sales 8,136$ 6,254$ Cost of sales 5,623 4,566
Gross profit 2,513 1,688
Selling, general and administrative expenses (1,253) (1,549) Restructuring and impairment costs (141) (201) Net financing charges (120) (87) Equity income 63 47
Income (loss) from continuing operations before income taxes 1,062 (102)
Income tax provision (benefit) 135 (5)
Income (loss) from continuing operations 927 (97)
Loss from discontinued operations, net of tax - (1,035)
Net income (loss) 927 (1,132)
Less: Income from continuing operationsattributable to noncontrolling interests 52 16
Less: Income from discontinued operationsattributable to noncontrolling interests - 23
Net income (loss) attributable to JCI 875$ (1,171)$
Income (loss) from continuing operations 875$ (113)$ Loss from discontinued operations - (1,058)
Net income (loss) attributable to JCI 875$ (1,171)$
Diluted earnings (loss) per share from continuing operations 0.93$ (0.16)$ Diluted loss per share from discontinued operations - (1.45)Diluted earnings (loss) per share 0.93$ (1.61)$
Diluted weighted average shares 938.0 728.3 Shares outstanding at period end 928.0 935.8
JOHNSON CONTROLS INTERNATIONAL PLC
CONDENSED CONSOLIDATED STATEMENTS OF INCOME(in millions, except per share data; unaudited)
Three Months Ended September 30,
28

November 9, 2017
2017 2016
Net sales 30,172$ 20,837$ Cost of sales 20,833 15,183
Gross profit 9,339 5,654
Selling, general and administrative expenses (6,158) (4,190) Restructuring and impairment costs (367) (288) Net financing charges (496) (289) Equity income 240 174
Income from continuing operations before income taxes 2,558 1,061
Income tax provision 705 197
Income from continuing operations 1,853 864
Loss from discontinued operations, net of tax (34) (1,516)
Net income (loss) 1,819 (652)
Less: Income from continuing operationsattributable to noncontrolling interests 199 132
Less: Income from discontinued operationsattributable to noncontrolling interests 9 84
Net income (loss) attributable to JCI 1,611$ (868)$
Income from continuing operations 1,654$ 732$ Loss from discontinued operations (43) (1,600)
Net income (loss) attributable to JCI 1,611$ (868)$
Diluted earnings per share from continuing operations 1.75$ 1.09$ Diluted loss per share from discontinued operations (0.05) (2.38) Diluted earnings (loss) per share * 1.71$ (1.29)$
Diluted weighted average shares 944.6 672.6 Shares outstanding at period end 928.0 935.8
* May not sum due to rounding.
JOHNSON CONTROLS INTERNATIONAL PLC
CONDENSED CONSOLIDATED STATEMENTS OF INCOME(in millions, except per share data; unaudited)
Twelve Months Ended September 30,
29

November 9, 2017
September 30, September 30,2017 2016
ASSETSCash and cash equivalents 321$ 579$ Accounts receivable - net 6,666 6,394 Inventories 3,209 2,888 Assets held for sale 189 5,812 Other current assets 1,907 1,436
Current assets 12,292 17,109
Property, plant and equipment - net 6,121 5,632 Goodwill 19,688 21,024 Other intangible assets - net 6,741 7,540 Investments in partially-owned affiliates 1,191 990 Noncurrent assets held for sale 1,920 7,374 Other noncurrent assets 3,931 3,510
Total assets 51,884$ 63,179$
LIABILITIES AND EQUITYShort-term debt and current portion of long-term debt 1,608$ 1,706$ Accounts payable and accrued expenses 5,342 5,333 Liabilities held for sale 72 4,276 Other current liabilities 4,832 5,016
Current liabilities 11,854 16,331
Long-term debt 11,964 11,053 Other noncurrent liabilities 6,315 6,583 Noncurrent liabilities held for sale 173 3,888 Redeemable noncontrolling interests 211 234 Shareholders' equity attributable to JCI 20,447 24,118 Noncontrolling interests 920 972
Total liabilities and equity 51,884$ 63,179$
CONDENSED CONSOLIDATED STATEMENTS OF FINANCIAL POSITION(in millions; unaudited)
JOHNSON CONTROLS INTERNATIONAL PLC
30

November 9, 2017
Three Months Ended September 30,2017 2016
Operating ActivitiesNet income (loss) attributable to JCI 875$ (1,171)$ Income from continuing operations attributable to noncontrolling interests 52 16 Income from discontinued operations attributable to noncontrolling interests - 23
Net income (loss) 927 (1,132)
Adjustments to reconcile net income (loss) to cash provided by operating activities:Depreciation and amortization 269 273 Pension and postretirement benefit expense (income) (384) 507 Pension and postretirement contributions (72) (43) Equity in earnings of partially-owned affiliates, net of dividends received (15) (48) Deferred income taxes 69 (1,577) Non-cash restructuring and impairment costs 8 141 Gain on business divestitures (9) (12) Other - net 27 75 Changes in assets and liabilities, excluding acquisitions and divestitures:
Accounts receivable (201) (231) Inventories 187 234 Other assets (222) 195 Restructuring reserves 67 73 Accounts payable and accrued liabilities 825 441 Accrued income taxes (143) 2,303
Cash provided by operating activities 1,333 1,199
Investing ActivitiesCapital expenditures (347) (427) Sale of property, plant and equipment 10 4 Acquisition of businesses, net of cash acquired - 486 Business divestitures, net of cash divested 40 (22) Other - net (8) (57)
Cash used by investing activities (305) (16)
Financing ActivitiesDecrease in short and long-term debt - net (755) (503) Debt financing costs - (45) Stock repurchases (225) (26) Payment of cash dividends (233) (371) Proceeds from the exercise of stock options 27 36 Dividends paid to noncontrolling interests (10) (66) Other - net (2) 2
Cash used by financing activities (1,198) (973) Effect of exchange rate changes on cash and cash equivalents 42 7 Cash held for sale (9) 15 Increase (decrease) in cash and cash equivalents (137)$ 232$
JOHNSON CONTROLS INTERNATIONAL PLC
CONDENSED CONSOLIDATED STATEMENTS OF CASH FLOWS(in millions; unaudited)
31

November 9, 2017
Twelve Months Ended September 30,2017 2016
Operating ActivitiesNet income (loss) attributable to JCI 1,611$ (868)$ Income from continuing operations attributable to noncontrolling interests 199 132 Income from discontinued operations attributable to noncontrolling interests 9 84
Net income (loss) 1,819 (652)
Adjustments to reconcile net income (loss) to cash provided by operating activities:Depreciation and amortization 1,188 953 Pension and postretirement benefit expense (income) (568) 460 Pension and postretirement contributions (347) (137) Equity in earnings of partially-owned affiliates, net of dividends received (181) (250) Deferred income taxes 1,125 (1,241) Non-cash restructuring and impairment costs 78 221 Gain on business divestitures (9) (26) Other - net 144 143 Changes in assets and liabilities, excluding acquisitions and divestitures:
Accounts receivable (520) (344) Inventories (398) 1 Other assets (480) 148 Restructuring reserves 89 141 Accounts payable and accrued liabilities 217 398 Accrued income taxes (2,145) 2,080
Cash provided by operating activities 12 1,895
Investing ActivitiesCapital expenditures (1,343) (1,249) Sale of property, plant and equipment 33 32 Acquisition of businesses, net of cash acquired (6) 353 Business divestitures, net of cash divested 220 32 Other - net (41) (55)
Cash used by investing activities (1,137) (887)
Financing ActivitiesIncrease in short and long-term debt - net 713 758 Debt financing costs (18) (45) Stock repurchases (651) (501) Payment of cash dividends (702) (915) Proceeds from the exercise of stock options 157 70 Dividends paid to noncontrolling interests (88) (306) Dividend from Adient spin-off 2,050 - Cash transferred to Adient related to spin-off (665) - Cash paid related to prior acquisitions (75) - Other - net (4) 6
Cash provided (used) by financing activities 717 (933) Effect of exchange rate changes on cash and cash equivalents 54 12 Cash held for sale 96 (61) Increase (decrease) in cash and cash equivalents (258)$ 26$
JOHNSON CONTROLS INTERNATIONAL PLC
CONDENSED CONSOLIDATED STATEMENTS OF CASH FLOWS(in millions; unaudited)
32

November 9, 2017FOOTNOTES
1. Financial Summary
(in millions; unaudited)
ActualAdjusted
Non-GAAP ActualAdjusted
Non-GAAP ActualAdjusted
Non-GAAP ActualAdjusted
Non-GAAPNet sales (1)Building Technologies & Solutions 6,004$ 6,004$ 4,443$ 4,463$ 22,835$ 22,801$ 14,184$ 14,204$ Power Solutions 2,132 2,132 1,811 1,811 7,337 7,337 6,653 6,653 Net sales 8,136$ 8,136$ 6,254$ 6,274$ 30,172$ 30,138$ 20,837$ 20,857$
Segment EBITA (1)Building Technologies & Solutions 831$ 904$ 512$ 597$ 2,831$ 3,018$ 1,427$ 1,537$ Power Solutions 431 431 405 413 1,427 1,428 1,327 1,336 Segment EBITA 1,262 1,335 917 1,010 4,258 4,446 2,754 2,873 Corporate expenses (2) (163) (107) (284) (130) (768) (465) (607) (367) Amortization of intangible assets (3) (106) (97) (54) (49) (489) (382) (116) (111) Mark-to-market gain (loss) for pension and postretirement plans (4) 330 - (393) - 420 - (393) - Restructuring and impairment costs (5) (141) - (201) - (367) - (288) - EBIT (6) 1,182 1,131 (15) 831 3,054 3,599 1,350 2,395 Net financing charges (7) (120) (120) (87) (86) (496) (479) (289) (288) Income (loss) from continuing operations before income taxes 1,062 1,011 (102) 745 2,558 3,120 1,061 2,107 Income tax benefit (provision) (8) (135) (152) 5 (125) (705) (468) (197) (360) Income (loss) from continuing operations 927 859 (97) 620 1,853 2,652 864 1,747 Income from continuing operations attributable to noncontrolling interests (9) (52) (46) (16) (38) (199) (193) (132) (169) Net income (loss) from continuing operations attributable to JCI 875$ 813$ (113)$ 582$ 1,654$ 2,459$ 732$ 1,578$
In the first quarter of fiscal 2017, the Company began evaluating the performance of its business units primarily on segment earnings before interest, taxes and amortization (EBITA), which represents income from continuing operations before income taxes and noncontrolling interests, excluding general corporate expenses, intangible asset amortization, net financing charges, significant restructuring and impairment costs, and the net mark-to-market adjustments related to pension and postretirement plans. Historical information has been revised to present the comparable periods on a consistent basis. Also in the first quarter of fiscal 2017, the Company began reporting the Automotive Experience business as a discontinued operation, which required retrospective application to previously reported financial information. As a result, the segment EBITA amounts shown below are for continuing operations and exclude the Automotive Experience business. In addition, the financial results for the three and twelve months ended September 30, 2016 include only the September results for the Tyco business as the merger closed September 2, 2016.
Twelve Months Ended September 30,2017 2016
Three Months Ended September 30,2016
Building Technologies & Solutions - Provides facility systems and services including comfort, energy and security management for the non-residential buildings market, and provides heating, ventilating, and air conditioning products and services, security products and services, fire detection and suppression products and services, and life safety products for the residential and non-residential building markets.
2017
Power Solutions - Services both automotive original equipment manufacturers and the battery aftermarket by providing advanced battery technology, coupled with systems engineering, marketing and service expertise.
33

November 9, 2017
(in millions)2017 2016 2017 2016 2017 2016
Net sales as reported 6,004$ $ 4,443 2,132$ $ 1,811 8,136$ $ 6,254
Adjusting items: Nonrecurring purchase accounting impacts - 20 - - - 20
Adjusted net sales 6,004$ 4,463$ 2,132$ 1,811$ 8,136$ 6,274$
Segment EBITA as reported 831$ 512$ 431$ 405$ 1,262$ 917$ Segment EBITA margin as reported 13.8% 11.5% 20.2% 22.4% 15.5% 14.7%
Adjusting items: Transaction costs - 6 - - - 6 Integration costs 34 5 - - 34 5 Nonrecurring purchase accounting impacts (11) 69 - - (11) 69 Unfavorable arbitration award 50 - - - 50 - Other - 5 - 8 - 13
Adjusted segment EBITA 904$ 597$ 431$ 413$ 1,335$ 1,010$ Adjusted segment EBITA margin 15.1% 13.4% 20.2% 22.8% 16.4% 16.1%
(in millions)2017 2016 2017 2016 2017 2016
Net sales as reported 22,835$ $ 14,184 7,337$ $ 6,653 30,172$ $ 20,837
Adjusting items: Nonrecurring purchase accounting impacts (34) 20 - - (34) 20
Adjusted net sales 22,801$ 14,204$ 7,337$ 6,653$ 30,138$ 20,857$
Segment EBITA as reported 2,831$ 1,427$ 1,427$ 1,327$ 4,258$ 2,754$ Segment EBITA margin as reported 12.4% 10.1% 19.4% 19.9% 14.1% 13.2%
Adjusting items: Transaction costs 33 16 1 1 34 17 Integration costs 78 20 - - 78 20 Nonrecurring purchase accounting impacts 26 69 - - 26 69 Unfavorable arbitration award 50 - - - 50 - Other - 5 - 8 - 13
Adjusted segment EBITA 3,018$ 1,537$ 1,428$ 1,336$ 4,446$ 2,873$ Adjusted segment EBITA margin 13.2% 10.8% 19.5% 20.1% 14.8% 13.8%
Building Technologies & Solutions
(2) Adjusted Corporate expenses for the three months ended September 30, 2017 excludes $56 million of integration costs. Adjusted Corporate expenses for the twelve months ended September 30, 2017 excludes $241 million of integration costs, $58 million of transaction costs and $4 million of separation costs. Adjusted Corporate expenses for the three months ended September 30, 2016 excludes $144 million of transaction costs, $5 million of separation costs and $5 million of other costs. Adjusted Corporate expenses for the twelve months ended September 30, 2016 excludes $184 million of transaction costs, $51 million of separation costs and $5 million of other costs.
Power Solutions Consolidated JCI plc
The following is the three months ended September 30, 2017 and 2016 reconciliation of net sales, segment EBITA and segment EBITA margin as reported to adjusted net sales, adjusted segment EBITA and adjusted segment EBITA margin (unaudited):
(1) The Company's press release contains financial information regarding adjusted net sales, adjusted segment EBITA and adjusted segment EBITA margins, which are non-GAAP performance measures. The Company's definition of adjusted segment EBITA excludes special items because these costs are not considered to be directly related to the underlying operating performance of its business units. Management believes these non-GAAP measures are useful to investors in understanding the ongoing operations and business trends of the Company.
(3) Adjusted amortization of intangible assets for the three and twelve months ended September 30, 2017 excludes $9 million and $107 million, respectively, of nonrecurring asset amortization related to Tyco purchase accounting. Adjusted amortization of intangible assets for the three and twelve months ended September 30, 2016 excludes $5 million of nonrecurring asset amortization related to Tyco purchase accounting.
Power Solutions Consolidated JCI plc
The following is the twelve months ended September 30, 2017 and 2016 reconciliation of net sales, segment EBITA and segment EBITA margin as reported to adjusted net sales, adjusted segment EBITA and adjusted segment EBITA margin (unaudited):
Building Technologies & Solutions
34

November 9, 2017
2. 2016 Supplemental Combined Information
For the avoidance of doubt, this supplemental combined information is not intended to be, and was not, prepared on a basis consistent with the unaudited pro forma condensed combined financial information in Exhibit 99.3 to the Company’s Current Report on Form 8-K/A filed October 3, 2016 with the U.S. Securities and Exchange Commission (the “Pro Forma 8-K/A Filing”), which provides the pro forma financial information required by Item 9.01(b) of Form 8-K. The supplemental combined information is intentionally different from, but does not supersede, the pro forma financial information in the Pro Forma 8-K/A Filing.
In addition, the supplemental combined information does not purport to indicate the results that actually would have been obtained had the JCI and Tyco businesses been operated together on the basis of the new segment structure during the periods presented, or which may be realized in the future.
(6) Management defines earnings before interest and taxes (EBIT) as income from continuing operations before net financing charges, income taxes and noncontrolling interests.
(4) The three months ended September 30, 2017 pension and postretirement mark-to-market gain of $330 million and the twelve months ended September 30, 2017 pension and postretirement mark-to-market gain of $420 million are excluded from the adjusted non-GAAP results. The three and twelve months ended September 30, 2016 pension and postretirement mark-to-market loss of $393 million is excluded from the adjusted non-GAAP results.
(5) The three and twelve months ended September 30, 2017 restructuring and impairment costs of $141 million and $367 million, respectively, are excluded from the adjusted non-GAAP results. The three and twelve months ended September 30, 2016 restructuring and impairment costs of $201 million and $288 million, respectively, are excluded from the adjusted non-GAAP results.
(7) Adjusted net financing charges for the twelve months ended September 30, 2017 exclude $17 million of transaction costs related to the debt exchange offers. Adjusted net financing charges for the three and twelve months ended September 30, 2016 exclude $1 million of integration costs.
(8) Adjusted income tax provision for the three months ended September 30, 2017 excludes the tax benefits for tax audit settlements of $191 million, integration costs of $16 million and restructuring and impairment costs of $14 million, partially offset by the tax provisions for the pension and postretirement mark-to-market gain of $90 million, change in the deferred tax liability related to the outside basis of certain nonconsolidated subsidiaries of $53 million, change in assertion over permanently reinvested earnings of $33 million, net valuation allowance adjustments in various legal entities of $27 million, and Tyco nonrecurring purchase accounting impacts of $1 million. Adjusted income tax provision for the twelve months ended September 30, 2017 excludes the non-cash tax charge of $457 million related to establishment of a deferred tax liability on the outside basis difference of the Company’s investment in certain subsidiaries of the Scott Safety business, pension and postretirement mark-to-market gain of $126 million, change in the deferred tax liability related to the outside basis of certain nonconsolidated subsidiaries of $53 million, change in assertion over permanently reinvested earnings of $33 million and net valuation allowance adjustments in various legal entities of $27 million, partially offset by the tax benefits of tax audit settlements of $191 million, changes in entity tax status of $101 million, restructuring and impairment costs of $63 million, integration costs of $57 million, Tyco nonrecurring purchase accounting impacts of $35 million and transaction costs of $12 million. Adjusted income tax benefit for the three months ended September 30, 2016 excludes tax benefits of loss on mark-to-market pension and postretirement of $119 million, restructuring and impairment costs of $52 million, Tyco nonrecurring purchase accounting impacts of $20 million, transaction costs of $12 million and other costs of $4 million, partially offset by the tax provision of $77 million due to the merger with Tyco. Adjusted income tax provision for the twelve months ended September 30, 2016 excludes the tax benefits of loss on mark-to-market pension and postretirement of $119 million, restructuring and impairment costs of $76 million, Tyco nonrecurring purchase accounting impacts of $20 million, transaction costs of $18 million, other costs of $4 million, integration costs of $2 million and separation costs of $1 million, partially offset by the tax provision of $77 million due to the merger with Tyco.
(9) Adjusted income from continuing operations attributable to noncontrolling interests for the three and twelve months ended September 30, 2017 excludes the noncontrolling interest impact of $4 million for mark-to-market pension gain and $2 million for valuation allowance adjustments. Adjusted income from continuing operations attributable to noncontrolling interests for the three months ended September 30, 2016 excludes the noncontrolling interest impact of $11 million for mark-to-market pension loss, $10 million for restructuring and impairment costs and $1 million for integration costs. Adjusted income from continuing operations attributable to noncontrolling interests for the twelve months ended September 30, 2016, excludes the noncontrolling interest impact of $16 million for restructuring and impairment costs, $11 million for mark-to-market pension loss and $10 million for transaction/integration costs.
As a result of the reverse merger between JCI and Tyco, which closed on September 2, 2016, the Company is providing supplemental combined financial information. As supplemental information that management believes will be useful to investors, the Company has provided unaudited selected historical information which combines JCI’s historical Building Efficiency business with historical Tyco results of operations as if these businesses had been operated together during the periods presented.
The merger is accounted for as a reverse acquisition with JCI considered to be acquiring Tyco for accounting purposes. As a result, the amounts reflected in Column A in the below table present the historical results of JCI, revised for the reporting changes described within footnote 1 above. The amounts in Column B reflect the impact of the special items, as set forth in the notes to the table and within footnote 1 above. The amounts in Column C reflect the inclusion of Tyco’s historical results for the period prior to the merger on an adjusted basis.
35

November 9, 2017
(in millions, except per share data; unaudited)A B C D A B C D
Net salesBuilding Technologies & Solutions 4,443$ 20$ 1,574$ 6,037$ 14,184$ 20$ 8,712$ 22,916$ Power Solutions 1,811 - - 1,811 6,653 - - 6,653 Net sales 6,254$ 20$ 1,574$ 7,848$ 20,837$ 20$ 8,712$ 29,569$
Income from continuing operationsBuilding Technologies & Solutions 512$ 85$ 266$ 863$ 1,427$ 110$ 1,365$ 2,902$ Power Solutions 405 8 - 413 1,327 9 - 1,336 Segment EBITA 917 93 266 1,276 2,754 119 1,365 4,238 Corporate expenses (284) 154 (13) (143) (607) 240 (174) (541) Amortization of intangible assets (54) 5 (59) (108) (116) 5 (319) (430) Mark-to-market loss for pension and postretirement plans (393) 393 - - (393) 393 - - Restructuring and impairment costs (201) 201 - - (288) 288 - - EBIT (15) 846 194 1,025 1,350 1,045 872 3,267 Net financing charges (87) 1 (28) (114) (289) 1 (161) (449) Income (loss) from continuing operations before income taxes (102) 847 166 911 1,061 1,046 711 2,818 Income tax benefit (provision) 5 (130) (30) (155) (197) (163) (119) (479) Noncontrolling interest (16) (22) 1 (37) (132) (37) 3 (166) Net income (loss) (113)$ 695$ 137$ 719$ 732$ 846$ 595$ 2,173$
Diluted weighted average shares 728.3 940 672.6 940 Diluted earnings (loss) per share (0.16)$ 0.76$ 1.09$ 2.31$
C - Includes Tyco adjusted non-GAAP results for the two and eleven months ended September 2, 2016, as if the merger occurred October 1, 2015. Tyco’s first three fiscal quarters of 2016 ended on the last Friday of December, March and June, while JCI’s fiscal quarters ended on the last day of each such month. Because the historical statements of income of each company represent full and equivalent quarterly periods, no adjustments were made to align the fiscal quarters. The income tax provision also includes an adjustment to arrive at an annualized 17% tax rate for fiscal 2016 as a combined company.
Twelve Months Ended September 30, 2016
Amounts Adjusted for Certain Special Items
The supplemental combined information includes line items, such as net sales, income from continuing operations before income taxes, income tax provision, noncontrolling interest, net income and diluted EPS, that have been adjusted for the special items set forth in the notes to the table. Such amounts should be viewed in addition to, and not in lieu of, net sales, income from continuing operations before income taxes, income tax provision, noncontrolling interest, net income and diluted EPS and other financial measures on an unadjusted basis. In addition, per share amounts presented in the tables take into account the effects of (i) the issuance of ordinary shares to JCI shareholders in connection with the merger, and (ii) the consolidation of Tyco ordinary shares immediately prior to the merger. As a result, share counts reflect shares outstanding as of September 2, 2016 immediately following the consummation of the merger transaction.
The Company’s management believes that these adjusted amounts, when considered together with the unadjusted amounts, provide information that is useful to investors in understanding period-over-period operating results separate and apart from items that may, or could, have a disproportionate positive or negative impact on results in any particular period. The Company’s management also believes that these adjusted amounts enhance the ability of investors to analyze trends in the Company’s underlying business and to better understand the Company’s performance. In addition, the Company may utilize adjusted amounts as guides in forecasting, budgeting and long-term planning processes and to measure operating performance for compensation purposes. Adjusted amounts should be considered in addition to, and not as a substitute for, or superior to, unadjusted amounts.
A - Johnson Controls, as reported.B - Adjusted to exclude special items because these costs are not considered to be directly related to the underlying operating performance of the Company. Management believes these non-GAAP measures are useful to investors in better understanding the ongoing operations and business trends of the Company. The special items are described by line item in footnote 1 above. The income tax provision and noncontrolling interest adjustments are a result of the special items discussed in footnote 1.
D - Combined financial information as if the merger with Tyco was completed on October 1, 2015. Reflects annual 17% tax rate and 940 million share count.
Three Months Ended September 30, 2016
36
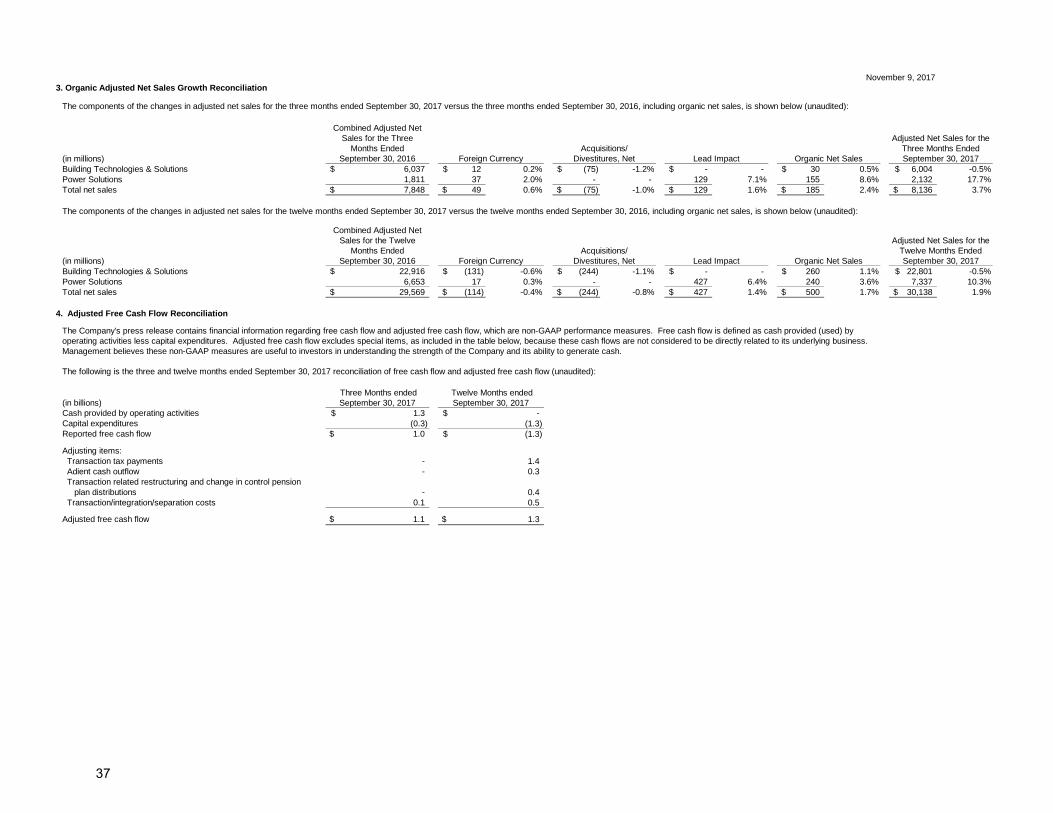
November 9, 2017 3. Organic Adjusted Net Sales Growth Reconciliation
(in millions)Building Technologies & Solutions 12$ 0.2% (75)$ -1.2% -$ - 30$ 0.5% 6,004$ -0.5%Power Solutions 37 2.0% - - 129 7.1% 155 8.6% 2,132 17.7%Total net sales 49$ 0.6% (75)$ -1.0% 129$ 1.6% 185$ 2.4% 8,136$ 3.7%
(in millions)Building Technologies & Solutions (131)$ -0.6% (244)$ -1.1% -$ - 260$ 1.1% 22,801$ -0.5%Power Solutions 17 0.3% - - 427 6.4% 240 3.6% 7,337 10.3%Total net sales (114)$ -0.4% (244)$ -0.8% 427$ 1.4% 500$ 1.7% 30,138$ 1.9%
4. Adjusted Free Cash Flow Reconciliation
(in billions)Cash provided by operating activitiesCapital expendituresReported free cash flow
Adjusting items: Transaction tax payments Adient cash outflow Transaction related restructuring and change in control pension plan distributions Transaction/integration/separation costs
Adjusted free cash flow
Adjusted Net Sales for the Three Months EndedSeptember 30, 2017
The components of the changes in adjusted net sales for the twelve months ended September 30, 2017 versus the twelve months ended September 30, 2016, including organic net sales, is shown below (unaudited):
Combined Adjusted Net Sales for the Twelve
Months Ended September 30, 2016 Foreign Currency
Acquisitions/Divestitures, Net Lead Impact Organic Net Sales
Adjusted Net Sales for the Twelve Months EndedSeptember 30, 2017
Lead Impact Organic Net Sales
22,916$
Combined Adjusted Net Sales for the Three
Months Ended September 30, 2016
Acquisitions/Divestitures, Net
- 0.1
(0.3) 1.3$ -$
- -
1,811 6,037$
Foreign Currency
$ 1.1
0.4 0.5
$ 1.3
Twelve Months ended September 30, 2017
$ 1.0
1.4 0.3
(1.3)
7,848$
(1.3)$
The components of the changes in adjusted net sales for the three months ended September 30, 2017 versus the three months ended September 30, 2016, including organic net sales, is shown below (unaudited):
6,653 29,569$
The Company's press release contains financial information regarding free cash flow and adjusted free cash flow, which are non-GAAP performance measures. Free cash flow is defined as cash provided (used) by operating activities less capital expenditures. Adjusted free cash flow excludes special items, as included in the table below, because these cash flows are not considered to be directly related to its underlying business. Management believes these non-GAAP measures are useful to investors in understanding the strength of the Company and its ability to generate cash.
The following is the three and twelve months ended September 30, 2017 reconciliation of free cash flow and adjusted free cash flow (unaudited):
Three Months ended September 30, 2017
37
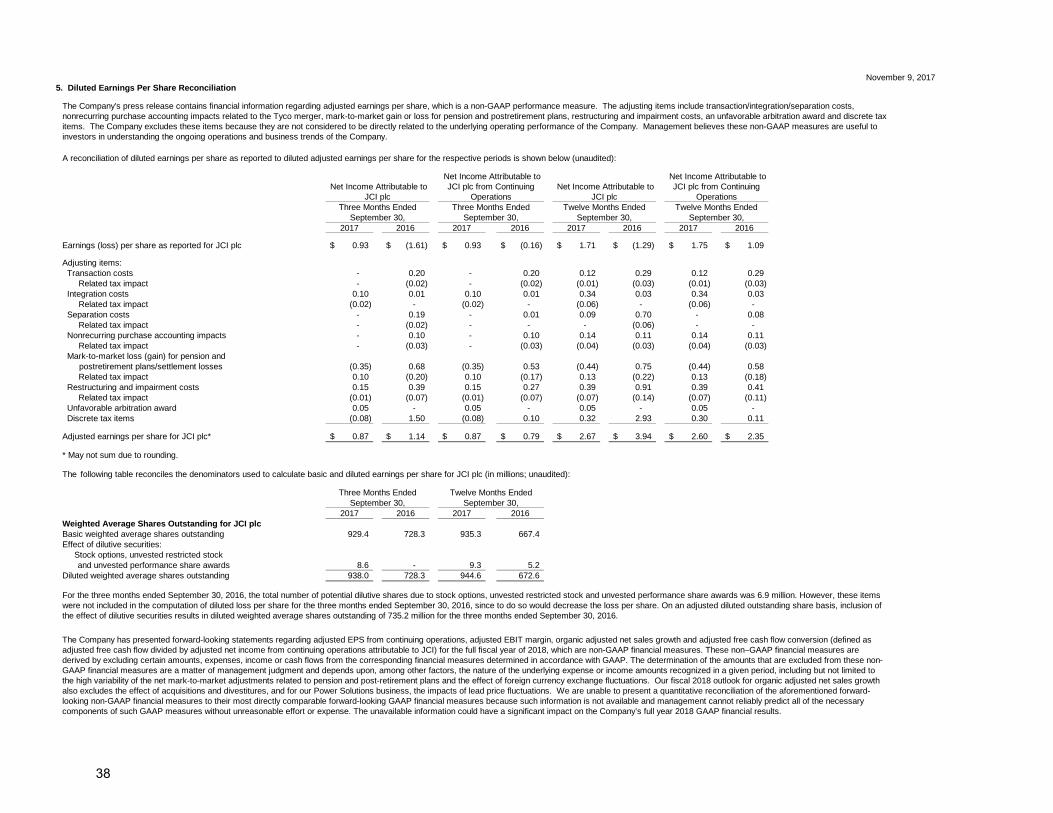
November 9, 2017 5. Diluted Earnings Per Share Reconciliation
2017 2016 2017 2016 2017 2016 2017 2016
Earnings (loss) per share as reported for JCI plc 0.93$ (1.61)$ 0.93$ (0.16)$ 1.71$ (1.29)$ 1.75$ 1.09$
Adjusting items: Transaction costs - 0.20 - 0.20 0.12 0.29 0.12 0.29
Related tax impact - (0.02) - (0.02) (0.01) (0.03) (0.01) (0.03) Integration costs 0.10 0.01 0.10 0.01 0.34 0.03 0.34 0.03
Related tax impact (0.02) - (0.02) - (0.06) - (0.06) - Separation costs - 0.19 - 0.01 0.09 0.70 - 0.08
Related tax impact - (0.02) - - - (0.06) - - Nonrecurring purchase accounting impacts - 0.10 - 0.10 0.14 0.11 0.14 0.11
Related tax impact - (0.03) - (0.03) (0.04) (0.03) (0.04) (0.03) Mark-to-market loss (gain) for pension and postretirement plans/settlement losses (0.35) 0.68 (0.35) 0.53 (0.44) 0.75 (0.44) 0.58
Related tax impact 0.10 (0.20) 0.10 (0.17) 0.13 (0.22) 0.13 (0.18) Restructuring and impairment costs 0.15 0.39 0.15 0.27 0.39 0.91 0.39 0.41
Related tax impact (0.01) (0.07) (0.01) (0.07) (0.07) (0.14) (0.07) (0.11) Unfavorable arbitration award 0.05 - 0.05 - 0.05 - 0.05 - Discrete tax items (0.08) 1.50 (0.08) 0.10 0.32 2.93 0.30 0.11
Adjusted earnings per share for JCI plc* 0.87$ 1.14$ 0.87$ 0.79$ 2.67$ 3.94$ 2.60$ 2.35$
* May not sum due to rounding.
The following table reconciles the denominators used to calculate basic and diluted earnings per share for JCI plc (in millions; unaudited):
2017 2016 2017 2016Weighted Average Shares Outstanding for JCI plcBasic weighted average shares outstanding 929.4 728.3 935.3 667.4 Effect of dilutive securities: Stock options, unvested restricted stock
and unvested performance share awards 8.6 - 9.3 5.2 Diluted weighted average shares outstanding 938.0 728.3 944.6 672.6
Three Months Ended
A reconciliation of diluted earnings per share as reported to diluted adjusted earnings per share for the respective periods is shown below (unaudited):
Net Income Attributable to JCI plc
Net Income Attributable to JCI plc from Continuing
Operations
The Company's press release contains financial information regarding adjusted earnings per share, which is a non-GAAP performance measure. The adjusting items include transaction/integration/separation costs, nonrecurring purchase accounting impacts related to the Tyco merger, mark-to-market gain or loss for pension and postretirement plans, restructuring and impairment costs, an unfavorable arbitration award and discrete tax items. The Company excludes these items because they are not considered to be directly related to the underlying operating performance of the Company. Management believes these non-GAAP measures are useful to investors in understanding the ongoing operations and business trends of the Company.
Three Months EndedSeptember 30,
Net Income Attributable to JCI plc
Net Income Attributable to JCI plc from Continuing
Operations
September 30, September 30,Three Months Ended
Twelve Months EndedSeptember 30,
Twelve Months Ended Twelve Months EndedSeptember 30, September 30,
For the three months ended September 30, 2016, the total number of potential dilutive shares due to stock options, unvested restricted stock and unvested performance share awards was 6.9 million. However, these items were not included in the computation of diluted loss per share for the three months ended September 30, 2016, since to do so would decrease the loss per share. On an adjusted diluted outstanding share basis, inclusion of the effect of dilutive securities results in diluted weighted average shares outstanding of 735.2 million for the three months ended September 30, 2016.
The Company has presented forward-looking statements regarding adjusted EPS from continuing operations, adjusted EBIT margin, organic adjusted net sales growth and adjusted free cash flow conversion (defined as adjusted free cash flow divided by adjusted net income from continuing operations attributable to JCI) for the full fiscal year of 2018, which are non-GAAP financial measures. These non–GAAP financial measures are derived by excluding certain amounts, expenses, income or cash flows from the corresponding financial measures determined in accordance with GAAP. The determination of the amounts that are excluded from these non-GAAP financial measures are a matter of management judgment and depends upon, among other factors, the nature of the underlying expense or income amounts recognized in a given period, including but not limited to the high variability of the net mark-to-market adjustments related to pension and post-retirement plans and the effect of foreign currency exchange fluctuations. Our fiscal 2018 outlook for organic adjusted net sales growth also excludes the effect of acquisitions and divestitures, and for our Power Solutions business, the impacts of lead price fluctuations. We are unable to present a quantitative reconciliation of the aforementioned forward-looking non-GAAP financial measures to their most directly comparable forward-looking GAAP financial measures because such information is not available and management cannot reliably predict all of the necessary components of such GAAP measures without unreasonable effort or expense. The unavailable information could have a significant impact on the Company’s full year 2018 GAAP financial results.
38

November 9, 2017 6. Mark-to-Market of Pension and Postretirement Plans
7. Acquisitions and Divestitures
8. Income Taxes
9. Restructuring
The Company's effective tax rate from continuing operations before consideration of the transaction/integration/separation costs, nonrecurring purchase accounting impacts related to the Tyco merger, mark-to-market gains or losses for pension and postretirement plans, restructuring and impairment costs, an unfavorable arbitration award and discrete tax items for the three months ending September 30, 2017 and 2016 is approximately 15 percent and 17 percent, respectively.
On October 31, 2016, the Company completed the spin-off of its Automotive Experience business by way of the transfer of the Automotive Experience business from JCI plc to Adient plc and the issuance of ordinary shares of Adient plc directly to holders of JCI plc ordinary shares on a pro rata basis. Following the separation, Adient plc is now an independent public company trading on the New York Stock Exchange (NYSE) under the symbol "ADNT." The Company did not retain any equity interest in Adient plc. Beginning in the first quarter of fiscal 2017, Adient’s historical financial results are reflected in the Company’s consolidated financial statements as a discontinued operation.
On September 2, 2016, JCI Inc. and Tyco completed their combination which was announced on January 25, 2016. The merger is accounted for as a reverse acquisition using the acquisition method of accounting in accordance with Accounting Standards Codification (ASC) 805, "Business Combinations." JCI Inc. is the accounting acquirer for financial reporting purposes. Accordingly, the historical consolidated financial statements of JCI Inc. for periods prior to this transaction are considered to be the historical financial statements of the Company. The total fair value of the consideration transferred was $19.7 billion. As part of the transaction in the fiscal 2016 fourth quarter, the Company recorded $16.4 billion of goodwill and $6.2 billion of intangible assets, of which $3.9 billion are subject to amortization.
The three and twelve months ended September 30, 2017 include restructuring and impairment costs of $141 million and $367 million, respectively, related primarily to workforce reductions, plant closures and asset impairments in the Building Technologies & Solutions and Power Solutions businesses, and at Corporate. The three and twelve months ended September 30, 2016 restructuring and impairment costs of $201 million and $288 million, respectively, related primarily to workforce reductions, plant closures and asset impairments in the Building Technologies & Solutions and Power Solutions businesses, and at Corporate.
On October 1, 2015, the Company formed a joint venture with Hitachi to expand its legacy Building Efficiency product offerings. The Company acquired a 60 percent ownership stake in the new entity for approximately $133 million ($563 million purchase price less cash acquired of $430 million).
The pension and postretirement mark-to-market gain or loss for each period is excluded from adjusted diluted earnings per share. The three and twelve months ended September 30, 2017 include a mark-to-market gain for pension and postretirement plans of $330 million and $420 million, respectively. The three and twelve months ended September 30, 2016 include a mark-to-market loss for pension and postretirement plans of $393 million.
On March 16, 2017, the Company announced that it signed a definitive agreement to sell its Scott Safety business to 3M for approximately $2.0 billion. The transaction closed on October 4, 2017. Net cash proceeds from the transaction approximated $1.9 billion. Scott Safety is a leader in the design, manufacture and sale of high performance respiratory protection, gas and flame detection, thermal imaging and other critical products for fire services, law enforcement, industrial, oil and gas, chemical, armed forces, and homeland defense end markets. The Scott Safety business is included within assets held for sale and liabilities held for sale in the accompanying condensed consolidated statement of financial position as of September 30, 2017.
39