queensland economic foundations paper - .net framework
TRANSCRIPT

South East QueenslandEconomic Foundations PaperJanuary 2018
Queensland Government

© State of Queensland, January 2018. Published by the Queensland shed by e QueenslatheGovernment, 1 William Street, Brisbane Qld 4000, Australia.e Qld tra
Licence: This work is licensed under the wo hCreative Commons CC BY 4.0 Australia Licence. mm LIn essence, you are free to copy and distribute e, st
this material in any format, as long as you attribute the work to the as rkState of Queensland (Queensland Government) and indicate if any en echanges have been made. To view a copy of this licence, visit . T ihttp://creativecommons.org/licenses/by/4.0/o .
Attribution: ttrib The State of Queensland, Queensland Government.Q ment.m
The Queensland Government supports and encourages the nsland Government supports and encourages thedissemination and exchange of information. However, copyrightnd exchange of information. However, copprotects this publication. The State of Queensland has no objection he State of Queensland has noto this material being reproduced, made available online or duced, made available onlineelectronically but only if the Queensland Government is recognisedQueensland Government isas the owner of the copyright and this material remains unaltered.nd this material remai
The Queensland Government is committed to providing accessible services to Queenslanders of all cultural and linguistic backgrounds. If you have difficulty understanding this publication and need a translator,
please call the Translating and Interpreting Service (TIS National) easeason 131 450 and ask them to telephone the Queensland Government 31n 1on 13 QGOV (13 74 68).Qon
Disclaimer:m While every care has been taken in preparing this publication, the State of Queensland accepts no responsibilityifor decisions or actions taken as a result of any data, information,istatement or advice, expressed or implied, contained herein. nTo the best of our knowledge, the content was correct at the etime of publishing.p
2 SEQ City Deal | Economic Foundations Paper

ContentsPurpose of this paper 5
Executive summary 6
Introduction 11
Global trends that are shaping the 13
economic opportunity for SEQ
SEQ’s economic growth opportunity 14
Structure of this report 17
PART 1 | SEQ context 19
The SEQ region 21
A growing region 22
An economy in transition 24
SEQ’s Economic Assets 27
Established foundations for collaboration 31
Positioning SEQ 35
SEQ in the Queensland context 36
SEQ in the Australian context 38
SEQ in the international context 41
PART 2 | Foundation for sustainable 45 prosperity in SEQ
The social environment 47
Infrastructure 48
Human capital 50
Stability 52
Civic services 53
Culture and environment 53
The natural environment 55
Developing resilience to adverse weather events 56
Reducing greenhouse gas emissions 56
Waste disposable management 57
Ensuring water security 57
Maintaining biodiversity 58
PART 3 | Economic foundations 59
Priority industries driving growth 61
Determining priority industry clusters 62
Determining inter-industry links 63
Determining key spatial locations 64
Priority industry clusters in SEQ 67
The economic foundation of SEQ 113
Priority industry clusters 114
Enablers to growth 115
Location of priority industry clusters 120
Strategic planning to support growth 124
SEQ Economic Foundation 126
Informing the SEQ City Deal framework 133
Appendix A : List of stakeholders 135
Appendix B : Technical note 136
3SEQ City Deal | Economic Foundations Paper

Index of Figures and Tables
Figure A – SEQ clusters, corridors and growth fronts 8 that will underpin regional growth
Figure B – Overview of the SEQ Economic Foundations 9 Paper structure
Figure 1 – South East Queensland local governments 12
Figure 2 – Trade oriented share of Australia’s eastern 16 Greater Capital City economies in terms of gross valued added (GVA), 2016
Figure 3 – SEQ’s current and projected population 2017–2041 22
Figure 4 – Key urban growth fronts for the SEQ region 23
Figure 5 – Queensland gross state product at factor cost, 24 2005–06 to 2015–16*
Figure 6 – Share of Queensland’s gross state product by 25 industry in 2005–06, 2010–11 and 2015–16
Figure 7 – Value of construction work done by sector, 27 Queensland
Figure 8 – Economic foundations of the SEQ region 29
Figure 9 – Existing strategic plans guiding the 32 development of the economic foundations paper
Figure 10 – SEQ local government areas population 36 growth, 2016
Figure 11 – Queensland and SEQ Employment by Industry 37 Cluster, 2015
Figure 12 – Mean price of residential dwellings, June 2017 38
Figure 13 – Export Share of Australia’s Eastern Capital 39 City Ports, 2016
Figure 14 – Total Gross Weight of Australia’s Eastern 40 Capital City Industry Cluster Products, 2016
Figure 15 – Total Value of Australia’s Eastern Capital 40 City Industry Cluster Products, 2016
Figure 16 – Value per Tonne of Australia’s Eastern 40 Capital City Industry Cluster Products, 2016
Figure 17 – Population growth, 2000–2017* 42
Figure 18 – Projected population growth, most recent 42 available–2040
Figure 19 – Share of output by industry 42
Figure 20 – Annual air passengers (millions) 43
Figure 21 – Private vehicle access to nearest REC in SEQ 48
Figure 22 – Public transport access to nearest REC in SEQ 48
Figure 23 – SEQ’s highest education attainment arrivals 50 and departures by age group, 2016
Figure 24 – SEQ’s highest education attainment arrivals 50 and departures by location, 2016
Figure 25 – SEQ highest education attainment by secondary school qualification for SA2s, 2016 51
Figure 26 – SEQ labour force participation rates for SA2s, 2016 51
Figure 27 – Areas of socio-economic disadvantage in SEQ 52
Figure 28 – CO2 emissions per capita 56
Figure 29 – Exposure to pollution 57
Figure 30 – The historical level and cause of land covering 58 in SEQ
Figure 31 – Queensland inter-industry relationship 63 chord diagram
Figure 32 – Examples of Regional Economic Clusters 65 and Knowledge and Technology Precincts in SEQ
Figure 33 – Focus area for industry cluster figures 66
Figure 34 – Advanced Manufacturing Industry Cluster 68 Overview
Figure 35 – Key industry cluster characteristics – 70 advanced manufacturing
Figure 36 – Advanced manufacturing in the SEQ region 72
Figure 37 – Advanced manufacturing inter-industry 73 input and output links
Figure 38 – Agribusiness industry cluster overview 77
Figure 39 – Key industry cluster characteristics – agribusiness 80
Figure 40 – Agribusiness in the SEQ region 81
Figure 41 – Agribusiness inter-industry input and output links 82
Figure 42 – Traded health and education industry 86 cluster overview
Figure 43 – Key industry cluster characteristics – 88 traded health and education
Figure 44 – Traded health and education in SEQ 90
Figure 45 – Traded health and education inter-industry 91 input and output links
Figure 46 – Transport and Communications Industry 95 Cluster Overview
Figure 47 – Key industry cluster characteristics – 96 transport and communications
Figure 48 – Infrastructure Australia’s indicative map 97 of a national land freight network
Figure 49 – Transport and communications in the SEQ region 98
Figure 50 – Transport and communications inter-industry 99 input and output links
Figure 51 – Tourism and creative industry cluster overview 104
Figure 52 – Key industry cluster characteristics – 106 tourism and creative
Figure 53 – Tourism and creative in the SEQ region 107
Figure 54 – Tourism and creative inter-industry 108 input and output links
Figure 55 – Economic foundations paper relationship 113 with the SEQ City Deal
Figure 56 – ETCS an example of technology initiative 115
Figure 57 – Enablers for an innovation hub 119
Figure 58 – SEQ Economic Clusters 123
Figure 59 – SEQ Residential Growth Fronts 125
Figure 60 – SEQ Economic Foundation – SEQ region 130
Figure 61 – SEQ Economic Foundation – Capital City Knowledge Corridor 131
Figure 62 – SEQ Economic Foundation – SEQ Urban Extent 132
Figure 63 – SEQ clusters, corridors and growth fronts that will underpin regional growth 134
4 SEQ City Deal | Economic Foundations Paper

Purpose of this paperThis report has been drafted by the Queensland
Government’s Cities Transformation Taskforce
(CTT). The CTT is responsible for the negotiation of
City Deals on behalf of the Queensland Government
as well as making a contribution to wider cities
policy. This document is intended to inform the
development of a tri-partite agreement between
local, state and Commonwealth governments to
progress a South East Queensland (SEQ) City Deal.
It provides the foundation for development of a framework
for investment into the region that will support the growth
of priority industries, support the expansion, efficiency and
connectivity of key corridors and clusters, and ensure the
effective connectivity of key labour market areas to centres
of employment activity. This framework will then guide the
identification and prioritisation of programs and projects to
achieve these outcomes.
The SEQ City Deal is the second City Deal proposed to be
negotiated for the State of Queensland, following the signing of
the Townsville City Deal in December 2016. These City Deals are
guided by the Commonwealth Smart Cities Plan as well as the
Memorandum of Understanding to establish and implement
City Deals signed by the Queensland and Commonwealth
Governments in September 2016. The SEQ City Deal builds on a
period of two years of collaboration between local governments
in the region, the Council of Mayors SEQ (CoM(SEQ)) and the
state government to define the parameters and potential
scope of such a deal. There has also been active engagement
between officers from the Queensland Government, SEQ
councils and the Commonwealth Department of Prime Minister
and Cabinet Cities Unit.
The economic foundations paper also has broader applicability
to a wider range of government policy considerations. Inputs
have been drawn from a variety of government agencies and
stakeholders to ensure that a robust paper has been developed
to guide regional economic development planning activities.
A full list of stakeholders consulted in the development of this
report has been provided in Appendix A.
5SEQ City Deal | Economic Foundations Paper

Many of the world’s established economies
have experienced significant growth in new
knowledge intensive service industries at the cost
of traditional labour intensive industries, while
other emerging economies have benefited from
increased traditional industry activity. This creates
new opportunities for trade activity, as the demand
for new knowledge intensive services increase, and
the economies of scale for traditional industries
are realised in emerging economies.
For established Western economies such as SEQ, traditional
industries are in decline as they move offshore to lower
cost competitors or are redefined through technology
transformation. This is most notable in industries with
a traditional manufacturing base; steel, automotive and
textile manufacturing. The increasing use of technology in
industry is automating labour intensive processes, improving
productivity, and allowing for higher value-adding activities
in these industries. Globalisation too, has been driving the
geographical relocation of business from higher cost to lower
cost locations. Regions such as SEQ, with a wealth of human
capital, can benefit from opportunities in new knowledge
industries, while also adding value to the supply chains of
traditional industries.
Global megatrends and a transitioning economy are shaping
the future of SEQ. There is a key opportunity for the leadership
of the SEQ region to determine a clear economic growth
aspiration for the region. This aspiration should leverage the
areas of comparative advantage without jeopardising the
unique social and environmental characteristics and values of
the region.
SEQ’s opportunity
SEQ is in a unique position. It has a unique set of natural
assets, established transport infrastructure networks, quality
educational institutions, and access to some of the world’s
fastest growing domestic and international markets. As the
state’s capital region, it also offers scale, covering 12 local
government areas which are home to 3.4 million people, one in
seven Australians.
SEQ also has reached collaborative maturity levels in both
a political and institutional sense, with strong relationships
between its local government areas and a regional land use
plan that highlights the critical interplay between economic,
spatial and infrastructure perspectives. The South East
Queensland Regional Plan 2017 (ShapingSEQ) sets out the
economic aspirations for the region as:
“…Australia’s eastern gateway to international
markets. Globally visible and competitive, SEQ
will grow its export share of the economy to create
new activity and skills. More jobs will be located
throughout the region with better and healthier
options for accessing them.”
This statement provides a clear aspiration for the economic
foundation that the region is seeking. It is seeking high value,
globally competitive employment opportunities that are readily
accessible by the region’s population. The focus on the export
share of the economy reflects analysis highlighting that, while
the Sydney and Melbourne metropolitan regions have more
than half of their economic activity being driven by export
oriented activities, this figure is closer to 45 percent in
Greater Brisbane.1
SEQ needs to consider how it is best leveraging its local
advantages through natural resources such as its productive
agricultural lands near its metropolitan areas and key trading
gateways, as well as its scenic amenity and tourism appeal.
Similarly, the region needs to consider how it is leveraging its
significant population serving activities and translating these
into export oriented activities. Examples include the significant
health and education infrastructure across the region that are
already engaging in traded activity (international education
and health research) but that could provide the foundation
for further industry development and innovation.
Executive summary
1 Greater Brisbane has been used to provide a more precise comparison with Sydney and Melbourne
6 SEQ City Deal | Economic Foundations Paper

Identifying priority industries and
their spatial distribution in SEQ
This paper identifies industries within the economy that have
the greatest potential to lift productive economic output in
the future. It applies a robust analytical approach to: firstly,
ascertain which industries within the Australian economy are in
fact traded (or export-oriented), versus industries that primarily
serve the local population; and secondly, identify if there are
traded industries within SEQ that exhibit characteristics that
may deem them to have comparative advantage.
The analysis identifies key sectoral clusters across the region
that are driving economic growth as well as the key corridors
that link these clusters with one another and the key labour
pools across the region. This builds on the geographies
described in ShapingSEQ and provides further consideration
for place-based initiatives to enable future industry specific
economic activity.
Five priority industries
From both the research undertaken and feedback received
through engagement with state and local policymakers,
there was broad consensus that there are five priority traded
industries. These five industries in SEQ have characteristics
that were determined to be a comparative advantage and will
be a major source of future export and job growth. The five
priority industry clusters include:
• Advanced manufacturing will bring new products to market,
from design through to full scale manufacturing, driven
by the integration of digital technologies, 3D printing, and
automation.
• Agribusiness will feed the growing populations within
Queensland, interstate and offshore, underpinned by SEQ’s
productive agricultural soils, sub-tropical climate, and
access markets.
• Traded health and education is a strategic priority for SEQ
due to its role in growing knowledge, jobs and innovation,
and its continued expansion in SEQ supported by demand
from the rising middle-class in the Asia-Pacific region.
• Transport and communications is underpinned by
increasing online business and consumer transactions
which require both digital infrastructure and the storage and
distribution of goods.
• Tourism and creative will continue to expand as the growing
middle-class, both domestically and in the Asia-Pacific
region, seek out more unique and personalised travel
experiences and leisure products.
This paper identifies key enablers to support growth in these
priority industry clusters. These include land (and other natural
resources), infrastructure, open information, human capital,
financial capital, policy and technology.
7SEQ City Deal | Economic Foundations Paper

8 SEQ City Deal | Economic Foundations Paper
Spatial distribution placehold of economic activity
The SEQ Economic Foundation Paper identifies key
economic corridors that serve as both key inter-regional and
cross-regional corridors for passengers and freight. These
have been identified on the basis of their capacity to link key
economic clusters with one another, urban growth areas and
the key export gateways for the region. These include:
• East-West Corridor;
• Capital City Knowledge Corridor;
• South Corridor;
• North Corridor; and
• South-West Corridor
When overlaid against the key economic clusters and growth
fronts for the region, these corridors form a critical organising
frame for the region’s economic geography (Figure A).
Regional initiatives
Sub-regional initiatives
Re
gio
na
l E
con
om
ic C
lus
ters
East-West
Corridor
Capital City
Knowledge
Corridor
South CorridorSouth-West
Corridor North Corridor
• Australia Trade
Coast
• South west
industrial corridor
• Ipswich
• Western Gateway
• Capital City • Pacific Motorway
• Meadowbrook–
Loganholme
• Yatala Stapylton–
Beenleigh
• Southport–
Broadbeach
• Robina Varsity
Lakes
• Southern Gateway
• Bromelton SDA • Strathpine–
Brendale–Petrie
• North Lakes–
Mango Hill
• Kawana
• Northern Gateway
Urb
an
Gro
wth
Fro
nts
• Ripley
• Springfield
• Westbrook
• Under-Utilised
Urban Footprint
• Southern Redland
Bay
• Yarrabilba
• Coomera
• Under-Utilised
Urban Footprint
• Greater Flagstone
• Beaudesert
• Park Ridge
• Under-Utilised
Urban Footprint
• Caloundra South
• Beerwah East
• Palmview
• Caboolture West
• Under-Utilised
Urban Footprint
Place making initiatives
Figure A – SEQ clusters, corridors and growth fronts that will underpin regional growthSource: CTT, Queensland Government

QUT Gardens Point
9SEQ City Deal | Economic Foundations Paper
Gardens PointQUTQUTTQUT GaGaG rdrdens P
Figure B – Overview of the SEQ Economic Foundations Paper structure
Next steps
The SEQ economic foundations paper has identified both
the industry clusters with the potential to drive the economic
growth to which the region’s leaders aspire, as well as the
key spatial locations and enablers that will be critical to
realising this growth. These insights will be valuable to both
an overarching narrative (Figure B) for the region’s economic
future, as well as providing the foundations for an investment
framework for the region.
This investment framework has been identified as a priority
input for the development of an SEQ City Deal for the
region. The parameters of the City Deal are currently being
negotiated between all three tiers of government (local, state
and Commonwealth) and will ultimately culminate in a joint
agreement on a series of investments and initiatives for the
region.
Priority industries
SEQ Economic Foundation
SEQ City Deal Framework consideration
Clusters Enablers
Economic Spatial Infrastructure

Introduction
10 SEQ City Deal | Economic Foundations Paper
Volunteer Surf Life Savers, Noosa Main Beach, Noosa Heads

The South East Queensland
(SEQ) economic foundations
paper has been collaboratively
developed between local,
Queensland and Commonwealth
Government representatives to
shape a consistent view on the
industries, locations (corridors
and clusters) and labour
markets that drive the region’s
economy. Critically, it considers
the economic geography of
the region independently of
local government boundaries,
providing a collective view on
the way in which industries are
locating and growing.
This perspective on the region’s
economic strengths, opportunities
and enablers is complementary to
existing strategic frameworks outlining
the spatial reality and direction for
the region ShapingSEQ as well as key
infrastructure planning documents
(State Infrastructure Plan, SEQ Regional
Transport Plan and local government
infrastructure strategies). It has
been designed to draw through key
messages and policy anchors from these
documents to provide a foundation
on how investment in the region could
unlock further economic growth.
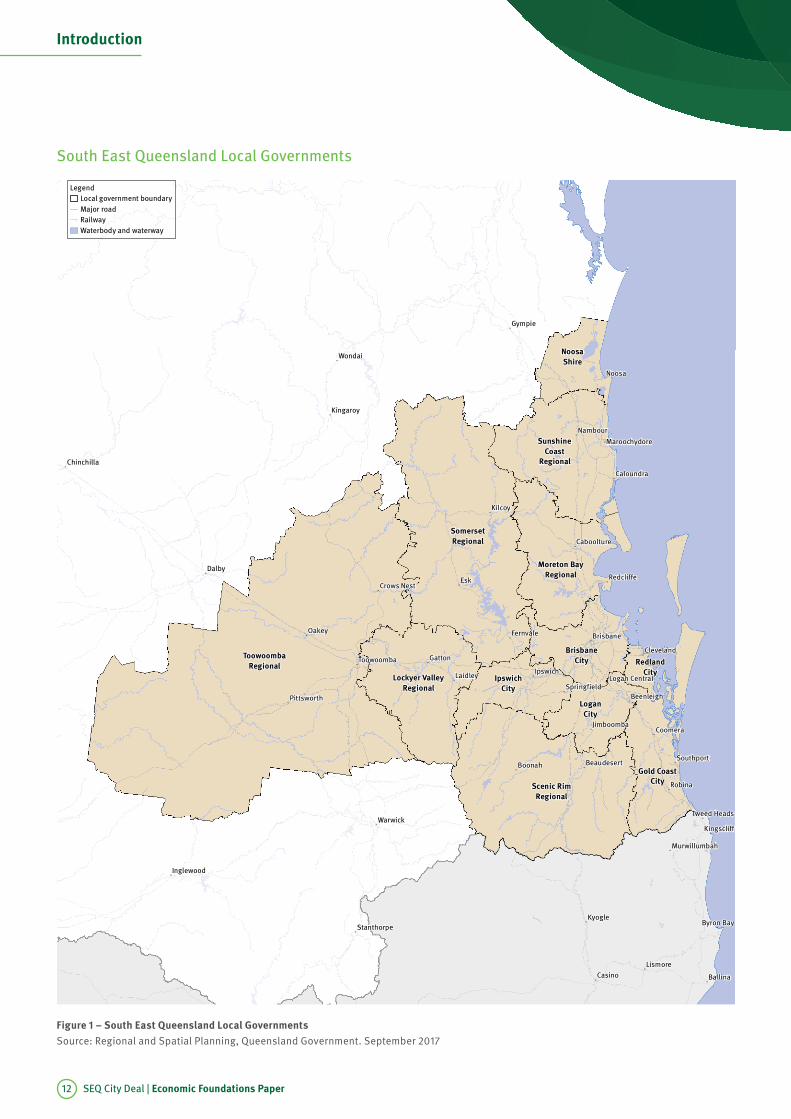
ShapingSEQ defines the SEQ
region to include the following
12 local governments:
• Brisbane City Council;
• Gold Coast City Council;
• Ipswich City Council;
• Lockyer Valley Regional Council;
• Logan City Council;
• Moreton Bay Regional Council;
• Noosa Shire Council;
• Redland City Council;
• Scenic Rim Regional Council;
• Somerset Regional Council;
• Sunshine Coast Council; and
• Toowoomba Regional Council.
Introduction
Introduction
11SEQ City Deal | Economic Foundations Paper
"
"
"
"
"
"
"
"
"
"
"
"
"
"
"
"
"
"
"
"
"
"
"
"
"
"
"
""
"
"
"
"
"
"
"
"
"
"
"
"
"
"
"
Esk
Oakey
Dalby
Noosa
Kyogle
Wondai
Gympie
Casino
Robina
Kilcoy
Boonah
Gatton
Warwick
Ballina
Lismore
Coomera
Nambour
LaidleyIpswich
Kingaroy
Fernvale Brisbane
Inglewood
Byron Bay
Jimboomba
Southport
Cleveland
Caloundra
Beenleigh
Redcliffe
Toowoomba
Kingscliff
Crows Nest
Pittsworth
Chinchilla
Stanthorpe
Beaudesert
Caboolture
Tweed Heads
Springfield
Murwillumbah
Maroochydore
Logan Central
Toowoomba
Regional
Somerset
Regional
Regional
Noosa
Shire
Sunshine
Coast
Scenic Rim
Regional
Logan
City
Brisbane
City
Ipswich
City
Lockyer Valley
Regional
Moreton Bay
Regional
Redland
City
Legend
Local government boundary
Major road
Railway
Waterbody and waterway
Figure 1 – South East Queensland Local Governments
Source: Regional and Spatial Planning, Queensland Government. September 2017
South East Queensland Local Governments
Introduction
12 SEQ City Deal | Economic Foundations Paper

Global trends that are shaping the economic opportunity for SEQThis paper recognises the effects that global megatrends
are having in rapidly changing the structural makeup of
regional economies around the world. Many of the world’s
established economies have experienced significant growth
in new knowledge intensive service industries at the cost of
traditional labour-intensive industries, while other emerging
economies have benefited from increased traditional industry
activity. This creates new opportunities for trade activity, as
the demand for new knowledge intensive services increase,
and the economies of scale for traditional industries are
realised in emerging economies.
For established Western economies, such as SEQ, traditional
industries are in decline as they move offshore to lower
cost competitors or are redefined through technology
transformation. This is most notable in industries with
a traditional manufacturing base: steel, automotive and
textile manufacturing. The increasing use of technology in
industry is automating labour intensive processes, improving
productivity, and allowing for higher value-adding activities
in these industries. Globalisation, too, has driven the
geographical relocation of business from higher cost to lower
cost locations. Regions such as SEQ, with a wealth of human
capital, can benefit from opportunities in new knowledge
industries, while also adding value to the supply chains of
traditional industries.
The future success of metropolitan areas such as SEQ will
depend on their ability to respond in their decision making
to these megatrends. Responding to global megatrends may
prompt a rethink of governance models, business processes
and social systems. Consequently, the ongoing success of
SEQ will depend on the entire economic ecosystem. For the
economy to grow, it requires the appropriate environment for
the continued generation of new ideas and products, adoption
of new technologies and a skilled workforce.
SEQ is well placed to respond to these transformative global
megatrends. The region can leverage its existing advantages
which include: world-class knowledge and technology
precincts with links to high-quality research and development
facilities, training and education institutions, its brand as a
major tourist destination and its organisations that specialise
in commercialising innovation.
Critical global megatrends that will shape the region’s
economic potential include:2 3 4
Introduction
2 CSIRO, 2012, Our Future World: Global Megatrends that will change the way we live. Accessed 25 July 2017. https://www.csiro.au3 KPMG, 2014, Future State 2030 4 Department of Infrastructure, Local Government and Planning, 2017, ShapingSEQ – SEQ Regional Plan5 United Nations Human Settlements Programme, 2016. World Cities Report 2016 – Chapter 16 United Nations Human Settlements Programme, 2016. World Cities Report 2016 – Chapter 2
The world’s population is becoming more urbanised
with over half the world’s population living in urban
areas. This is increasing the demand for diverse forms of
infrastructure, goods and services, but also generating
new challenges as waste, pollution, congestion, and
housing affordability issues compound.5
SEQ is already an urbanised but dispersed region, and
is expected to experience significant further growth.
Accordingly, the region is faced with the challenge of
sustainably absorbing this growth, while maintaining
liveability, prosperity and competitiveness.
SEQ, through ShapingSEQ, is focused on delivering
a diverse range of housing, with an emphasis on the
‘missing middle’ forms of housing (i.e. housing
types between detached houses and high-rises).
This urbanisation also brings to the region new
opportunities in the form of skills and capability.
Increasing urbanisation
Fast paced technological advancements are transforming
society, changing the way we work, live and play. The rate
of adoption of new technologies has been unprecedented,
and current forecasts expect this to continue with the
global smart cities market expected to grow from
USD$506 billion in 2012, to USD$1.3 trillion in 2019.6
New technologies, including automation, 3D printing
and digital technologies are appearing, rapidly and
simultaneously, across industries as disparate as
healthcare and advanced manufacturing.
In SEQ, adapting to the new digital economy will require
innovation, early adoption and new thinking on how
we plan for jobs, commerce and retailing. It will also
accelerate the importance of reskilling, transition support
and investment in employment generating enablers
that will support growth in key emerging sectors.
Technology will also bring new opportunities to
overcome some of Australia’s historical
economic challenges, including distance to
global markets.
Technology and digital disruption
13SEQ City Deal | Economic Foundations Paper

SEQ’s economic growth opportunityIn an environment of economic transition and global
megatrends that are shaping the potential for industry
growth, there is a key opportunity for the leadership of the
SEQ region to determine a clear economic growth aspiration
that is consistent with its areas of comparative advantage and
that do not jeopardise its unique social and environmental
characteristics and values.
An economy underpinned by skilled labour,
knowledge sharing and innovation
SEQ is unable to compete globally on a low-cost basis.
Distance to global markets, wage levels and the size
of domestic demand provide substantial challenges to
Australian firms achieving the economies of scale necessary
to compete on this basis. Instead, Australian firms have
differentiated their offerings based on higher value offerings
as well as in the export of services that are not reliant on
expensive transportation costs.
These higher value industries and service exports rely on the
knowledge base and capabilities of the local workforce as well
as their ability to utilise technology to improve productivity
and innovate to retain their comparative advantages.9
Knowledge based economies such as SEQ offer skilled
workers attractive jobs with higher wages, however the region
needs to be able to attract, retain and train this workforce
to ensure that opportunities for economic growth can be
realised.
The key characteristics of regions and cities are increasingly
being recognised as critical in the attraction and retention
of workers. SEQ is a highly liveable region well placed to
attract skilled workers, offering a sub-tropical climate,
scenic hinterlands and pristine beaches. In an increasingly
competitive global economy however, there is a key
opportunity for the leadership of the SEQ region to determine
how to best attract, train and retain knowledge workers who
support its economic growth aspirations. Further, the region’s
leaders have the opportunity to consider how to encourage
innovation and technology adoption that will support the
competitiveness of the region’s key industries.
Introduction
7 United Nations Human Settlements Programme, 2016. World Cities Report 2016 – Chapter 1. Accessed 18 July 2017. http://wcr.unhabitat.org/main-report/8 International Monetary Fund, 2016. World Economic Outlook Database. Accessed 18 July 2017. https://www.imf.org9 OECD. 2011. Competencies for the knowledge economy. www.oecd.org/innovation/research/1842070.pdf
Around the world, valuable ecosystems are under pressure
from urban expansion, agricultural clearing and the effects
of climate change.
In SEQ, the environment has intrinsic ecological value,
in addition to economic and community benefits.
Protecting the ecosystem against new environmental
pressures is required to support the future
liveability and economic prosperity in
the region.
Unpredictable extreme weather events, sea level rises,
temperature shifts and changed environmental conditions
have the potential to cause significant global disruption,
with cities and urban areas among the major contributors
to rising carbon dioxide emissions, accounting for more
than 70 percent of the global emissions.7
SEQ has long experienced the impacts of extreme weather,
floods, heatwaves and bushfires. Climate change is
expected to amplify the frequency and severity of these
events. Limiting the adverse impacts of climate
change, improving resilience and reducing
recovery time is a priority for government
and industry.
The world is becoming more interconnected and the global
economic focus is shifting towards Asia. China, India
and Japan will be three of the world’s largest economies,
forecast to contribute almost 35 percent of total world GDP
to 2021.8
SEQ is ideally positioned as an international gateway
to the Asia-Pacific region, located on the doorstep of
the fast-growing economies of Asia. Ensuring the
efficiency of gateways to key markets will be
critical as well as the way in which SEQ’s
unique services are globally promoted to
meet rising demand.
Pressure on biodiversity
Climate change and disaster resilience
A growing Asia-Pacific region
14 SEQ City Deal | Economic Foundations Paper

Introduction
10 Greater Brisbane has been used to provide a more precise comparison with Sydney and Melbourne
Growing the traded economy
The region’s spatial plan, ShapingSEQ, outlines the economic
aspirations for the region as:
“…Australia’s eastern gateway to international
markets. Globally visible and competitive, SEQ
will grow its export share of the economy to create
new activity and skills. More jobs will be located
throughout the region with better and healthier
options for accessing them.”
This statement provides a clear aspiration for the economic
growth that the region is seeking and is a component of the
50-year vision. SEQ is seeking high value, globally competitive
employment opportunities that are readily accessible by the
region’s population.
The focus on the traded industry’s output (along with
export share) of the economy reflects analysis highlighting
that, while the Sydney and Melbourne metropolitan regions
have more than half of their economic activity being driven by
trade oriented activities, this figure is closer to 48 percent in
Greater Brisbane.10 As highlighted in Figure 2, the predominant
share of SEQ’s economy is driven by population servicing
industries, such as local retail, health or public services.
These industries tend to be dependant on population
growth and are typically of a lower value than trade oriented
activity. By contrast, trade oriented activities are not directly
dependant on population growth and present an opportunity
for expansion of economic opportunity that is tied to wider
national and global demand and are typically
of a higher value.
There is an opportunity for the leadership of the SEQ region
to determine the pathway that enables the region to grow the
export share of its economy. In a global marketplace, traded
industries are typically free to choose their location. However,
some traded industries have developed in key locations
as they are dependent on proximity to natural resources
(for example, mining industries that locate near resource
and mineral deposits). SEQ needs to consider how it is best
leveraging its local advantages through natural resources
such as its productive agricultural lands near its metropolitan
areas and key trading gateways, as well as its scenic amenity
and tourism appeal.
Similarly, the region needs to consider how it is leveraging its
significant population serving activities and translating these
into trade oriented activities. Examples include the significant
health and education infrastructure across the region that are
already engaging in traded activity (international education
and health research) but that could provide the foundation for
further industry development and innovation.
The northern hub of the Eastern Seaboard
As the northern most capital city region on the Eastern
Seaboard of Melbourne, Sydney and Brisbane, SEQ is well
located to connect South Eastern Australia to the Asia Pacific
rim. As the northern destination for Inland Rail, the Port of
Brisbane has substantial potential for growth. Paralleling the
route for Inland Rail, Wellcamp International Airport will be
the northern end of an inland air freight corridor that begins
in Shepparton, Bendigo and Deniliquin in Victoria, passes
through Parkes and Forbes in New South Wales and finally
connects Wellcamp with the Asia Pacific.
These dual air and rail freight corridors run through Australia’s
East Coast and have the potential to transport goods to SEQ’s
industrial, logistical and intermodal hubs, where value can be
added by a skilled workforce and technology before export.
With room to grow in strategically considered ways, SEQ has
the potential to further develop well-planned inland ports,
intermodal hubs and industrial areas that are co-located
with these major freight corridors. There is a clear economic
opportunity for the rise of these job centres adjacent to Inland
Rail, such as Wellcamp, Bromelton and Ebenezer, which
has the potential to significantly build SEQ’s share of traded
oriented economic activity.
Truck freight movements, Brisbane
15SEQ City Deal | Economic Foundations Paper

Figure 2 – Trade oriented share of Australia’s eastern Greater Capital City economies in terms of gross valued added (GVA), 2016
Source: CTT, Queensland Government. Refer to Appendix B – Technical Note
Local health and education
Retail and local wholesale
Traded health and education
Transport and communications
Primary
Industrial and construction services
Public administration
Tourism and cultural
Advanced manufacturing
Agribusiness
Other local services
Food and recreation
Utilities and traded wholesale
Finance and professional services
Traditional manufacturing
Agriculture
45%
GreaterBrisbane
53%
GreaterMelbourne
55%
GreaterSydney
Redcliffe, Moreton Bay
16 SEQ City Deal | Economic Foundations Paper

Structure of this reportThe economic foundations paper has been structured to
outline the fundamental characteristics of the SEQ economy
that will provide a platform to address the economic growth
challenges outlined above. It has been developed through
consultation with key government and industry stakeholders
on three key questions to address these challenges:
• What is it that differentiates the SEQ region?
• What are the opportunities for growth in key trade oriented
industries in the region?
• What are the enablers with the potential to drive growth in
these industries?
The findings from this engagement have highlighted the key
spatial and industry characteristics of the region’s potential for
economic growth. These findings have been presented in three
parts.
Part 1 | SEQ Context
Part 1 highlights the key characteristics of the SEQ region which
differentiate it from other metropolitan regions in Australia and
globally.
Chapter 2: The SEQ region – highlights the key demographic,
economic and infrastructure foundations that comprise the
region’s economic geography.
Chapter 3: Established leadership – outlines the
characteristics of the mature policy platform and governance
structures that differentiate the region from other metropolitan
capitals.
Chapter 4: Positioning SEQ – outlines the unique characteristic
of SEQ in the Queensland, Australian and international context.
Part 2 | Foundation for sustainable prosperity
in SEQ To achieve economic growth which has a sustained positive
change – sustainable prosperity – it is necessary to plan and
actively implement social and environmental actions facilitated
by good governance.
The following sections identify the considerations necessary to
achieve sustainable prosperity in the context of SEQ:
Chapter 6: The social environment – outlines the importance
of the accessibly, stability, greenspace and civic services
characteristics which underpin the liveability of the region and
economic development.
Chapter 7: The natural environment – outlines the importance
of the environmental consideration and environmental
characteristics which underpin the liveability of the region and
economic development.
Part 3 | Economic foundation
Part 3 identifies the priority industries with the potential to
drive economic growth as well as the key spatial economic
foundations that will be critical considerations to unlock this
potential.
Chapter 9: Priority industries driving growth – details the five
trade oriented (or ‘export’) industry clusters of the economy
that have a high density and value of employment activity
in the region. The impact of global trends on these industry
clusters, as well as the opportunities and risks that these
present for each industry in SEQ, are discussed, in conjunction
with the potential enablers that could support the future
growth of these industry clusters.
Chapter 10: The economic foundation of SEQ – brings
together the region’s spatial, infrastructure and economic
characteristics to highlight the corridors, clusters and growth
fronts that will be critical to the achievement of the region’s
aspiration to grow its trade oriented economy.
17SEQ City Deal | Economic Foundations Paper

Introduction
State Disaster Coordination Centre, Brisbane
18 SEQ City Deal | Economic Foundations Paper

The following Part 1 sets out the characteristics
which make SEQ unique.
It includes information about:
• Key demographic, economic and infrastructure information
that comprise the region’s economic geography.
• The characteristics of the government and policy structures
that differentiate the region from other metropolitan
capitals.
• The unique characteristic of SEQ in the Queensland,
Australian and international context.
Part 1 highlights the following key characteristics:
A significant regional economy in
Queensland and Australia
SEQ is a high value, high demand, diverse economy within
Australia. With focused investment on areas of highest
impact, SEQ will continue to drive the growth of the
Queensland economy.
Strong and continuing population growth
By the standards of other high performing mid-sized regions,
SEQ has undergone and is projected to continue a strong
cycle of population growth. The growing population provides
the necessary human capital to support increased economic
activity.
Established infrastructure assets
connecting the region
The region has a robust infrastructure network consisting
of five international gateways, coordinated industrial land
capacity, strategic defence assets, and knowledge and
technology precincts. This infrastructure network serves
SEQ as a platform for future development and will continue
to connect the region to domestic and global markets as a
primary enabler of economic activity.
SEQ natural endowments enable unique
niche industries
Highly productive agricultural land, picturesque natural
landscapes, and coastal location have provided a foundation
for development of niche industries. SEQ’s natural
endowments and technology are enabling innovation in these
key industries.
SEQ has a collaborative and coordinated
regional leadership dynamic
The region has mature governance structures demonstrating
successfully consolidated council objectives and a strong
track record of collaboration. SEQ’s 11 local governments,
along with the State Government, have an aligned vision for
the future of the region. Where other regions are focused on
trying to align council objectives, SEQ is focused on delivering
regional coordinated investment to benefit the region and its
councils.
Strong position for growth
SEQ is in a strong position to grow the economy of the region
through traded industries. The region has an established
foundation to continue the transition of the economy to one
which is underpinned by strong use of technology and a highly
skilled workforce.
PART 1 | SEQ context
Part 1
19SEQ City Deal | Economic Foundations Paper

The SEQ region
Active lifestyle, Brisbane River
20 SEQ City Deal | Economic Foundations Paper

SEQ is differentiated by its lifestyle, culture, climate and rich natural
environment, which underpins the region’s diversified traded
economy and skilled local workforce. The diverse city-region extends
from the Sunshine Coast in the north, to the Gold Coast in the south,
is anchored by Brisbane in the east and stretches to Toowoomba in
the west.
The SEQ region
The SEQ region
21SEQ City Deal | Economic Foundations Paper
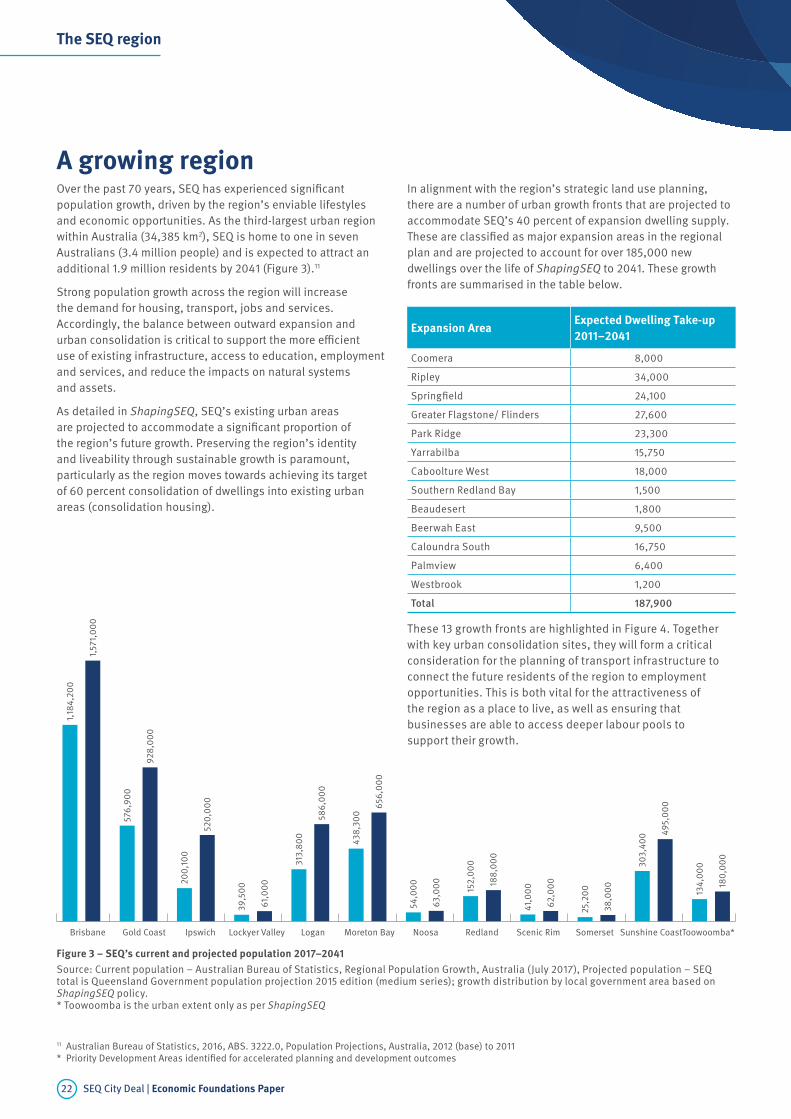
A growing regionOver the past 70 years, SEQ has experienced significant
population growth, driven by the region’s enviable lifestyles
and economic opportunities. As the third-largest urban region
within Australia (34,385 km2), SEQ is home to one in seven
Australians (3.4 million people) and is expected to attract an
additional 1.9 million residents by 2041 (Figure 3).11
Strong population growth across the region will increase
the demand for housing, transport, jobs and services.
Accordingly, the balance between outward expansion and
urban consolidation is critical to support the more efficient
use of existing infrastructure, access to education, employment
and services, and reduce the impacts on natural systems
and assets.
As detailed in ShapingSEQ, SEQ’s existing urban areas
are projected to accommodate a significant proportion of
the region’s future growth. Preserving the region’s identity
and liveability through sustainable growth is paramount,
particularly as the region moves towards achieving its target
of 60 percent consolidation of dwellings into existing urban
areas (consolidation housing).
In alignment with the region’s strategic land use planning,
there are a number of urban growth fronts that are projected to
accommodate SEQ’s 40 percent of expansion dwelling supply.
These are classified as major expansion areas in the regional
plan and are projected to account for over 185,000 new
dwellings over the life of ShapingSEQ to 2041. These growth
fronts are summarised in the table below.
Toowoomba*Sunshine CoastSomersetScenic RimRedlandNoosaMoreton BayLoganLockyer ValleyIpswichGold CoastBrisbane
1,18
4,2
00
1,5
71,
00
0
576
,90
0
92
8,0
00
20
0,1
00
520
,00
0
39
,50
0
61,
00
0
313
,80
0
58
6,0
00
43
8,3
00
65
6,0
00
54
,00
0
63
,00
0
152
,00
0
188
,00
0
41,
00
0
62
,00
0
25
,20
0
38
,00
0
30
3,4
00 4
95
,00
0
134
,00
0
180
,00
0
Figure 3 – SEQ’s current and projected population 2017–2041
Source: Current population – Australian Bureau of Statistics, Regional Population Growth, Australia (July 2017), Projected population – SEQ total is Queensland Government population projection 2015 edition (medium series); growth distribution by local government area based on ShapingSEQ policy.* Toowoomba is the urban extent only as per ShapingSEQ
The SEQ region
These 13 growth fronts are highlighted in Figure 4. Together
with key urban consolidation sites, they will form a critical
consideration for the planning of transport infrastructure to
connect the future residents of the region to employment
opportunities. This is both vital for the attractiveness of
the region as a place to live, as well as ensuring that
businesses are able to access deeper labour pools to
support their growth.
11 Australian Bureau of Statistics, 2016, ABS. 3222.0, Population Projections, Australia, 2012 (base) to 2011
* Priority Development Areas identified for accelerated planning and development outcomes
Expansion AreaExpected Dwelling Take-up
2011–2041
Coomera 8,000
Ripley 34,000
Springfield 24,100
Greater Flagstone/ Flinders 27,600
Park Ridge 23,300
Yarrabilba 15,750
Caboolture West 18,000
Southern Redland Bay 1,500
Beaudesert 1,800
Beerwah East 9,500
Caloundra South 16,750
Palmview 6,400
Westbrook 1,200
Total 187,900
22 SEQ City Deal | Economic Foundations Paper

!
o
!
o
!
o
!
o
Esk
Oakey
Noosa
Wondai
Gympie
Robina
Kilcoy
Boonah
Gatton
Warwick
Coomera
Nambour
LaidleyIpswich
Kingaroy
FernvaleBrisbane
Jimboomba
Southport
Cleveland
Caloundra
Beenleigh
Redcliffe
Toowoomba
Kingscliff
Crows Nest
Pittsworth
Beaudesert
Caboolture
Tweed Heads
Springfield
Murwillumbah
Maroochydore
Logan Central
Coolangatta
Toowoomba
Regional
Somerset
Regional
Noosa
Shire
Sunshine
Coast
City of
Gold Coast
Scenic Rim
Regional
Logan
City
Brisbane
City
Ipswich
CityLockyer Valley
Regional
Moreton Bay
Regional
Redland
City
Caloundra South
Palmview
Beerwah East
Caboolture
West
RipleySpringfield
Park Ridge
Coomera
Yarrabilba
Beaudesert
Greater
Flagstone /
Flinders
Westbrook
Legend
!
o
International airport
!! Port of Brisbane
Regional activity centres network
!Capital city centre
!( Principal
!( Major
!! Principal rural
!! Major rural
Local government boundary
Major road
Railway
Waterbody and waterway
Agricultural land
Regional land use category
Urban Footprint
Rural Living Area
Major expansion area
Southern
Redland Bay
The SEQ region
Figure 4 – Key urban growth fronts for the SEQ region
Source: Regional and Spatial Planning, Queensland Government. September 2017
Key urban growth fronts for the SEQ region
23SEQ City Deal | Economic Foundations Paper

-6
-4
-2
0
2
4
6
8
10
12
14
16
11%
8%
13%
-5%
7%8%
0%
3% 3%2%
2009–10
2015–162014–152013–142012–132011–122010–112008–092007–082006–07
An
nu
al
Gro
wth
Ra
te (
%)
Figure 5 – Queensland gross state product at factor cost, 2005–06 to 2015–16*
Source: ABS 5220.0, Australian National Accounts, State Accounts, 2015–16
The SEQ region
An economy in transitionSEQ is an economy in transition. The first decade of the 21st
century saw the region’s economic activity grow rapidly off the
back of significant mineral and gas exploration and extraction
activities across the state. With this activity slowing, the
region’s economy has returned to a more stable rate of growth
that has largely been driven by a rapidly growing population
and subsequent demand for services and residential
construction. Key exports of agriculture and advanced
manufacturing have also experienced recent growth that lends
optimism to the potential for the future of these industries.
The importance of these industries is reinforced by recent
below-trend wage growth and consumption figures that
suggest that population growth alone will not provide the
foundation for strong economic growth.
SEQ is a critical driver of the SEQ economy
SEQ accounts for the largest share of economic activity in
Queensland, generating almost two-thirds of the state’s gross
regional product.12 It is also intrinsically linked to supply chains
across the state and into New South Wales, offering a critical
export and import gateway for goods, as well as a range of
professional services and specialised inputs to production that
are concentrated in the state’s capital city metropolitan region.
Economic growth has stabilised
The Queensland economy has experienced sustained
economic growth over the period between 2005–06 and
2015–16. Notable falls in economic output (2009–10) were
attributed to significant slowdowns in the mining sector and
construction investment – both of which suffered from the
sharp fall in investment activity in the wake of the global
financial crisis (Figure 5). Recently, the Queensland economy
has stablised as it reduces its reliance on resource activities
and shifts towards growing its service based economy.
12 Queensland Treasury and Trade, 2011, Experimental Estimates of Gross Regional Product 2000–01, 2006–07 and 2010–11
* Ownership of dwellings excluded from GSP estimates
24 SEQ City Deal | Economic Foundations Paper

Figure 6 – Share of Queensland’s gross state product by industry in 2005–06, 2010–11 and 2015–16
Source: ABS 5220.0, Australian National Accounts, State Accounts, 2015–16
2005–06 2011–12 2015–16
03
69
1215
Oth
er serv
ices
Arts a
nd recr
eation
serv
ices
Health c
are a
nd
soci
al ass
ista
nce
Educatio
n and tr
ainin
g
Public a
dmin
istra
tion
and safe
ty
Admin
istra
tive a
nd
support
serv
ices
Profe
ssio
nal, sc
ientifi
c
and tech
nical s
ervic
es
Rental,
hiring a
nd
real e
state
serv
ices
Financi
al and
insu
rance
serv
ices
Comm
unicatio
n
Transp
ort. p
ostal
and ware
housing
Accom
modatio
n
and food s
ervic
es
Retail
trade
Whole
sale
trade
Constru
ctio
n
Elect
ricity
, gas,
wate
r
and wast
e serv
ices
Manufa
cturin
g
Min
ing
Agricultu
re,
fore
stry
and fi
shin
g
Sh
are
of
GS
P (
%)
The SEQ region
The services sector is critical to Queensland’s
growth
The growth of the service based economy is depicted in
Figure 6, which illustrates the share of Queensland’s GSP
by industry in 2005–06, 2010–11 and 2015–16. This change
in the make-up of the state’s economic activity has been
underpinned by significant growth in the health care and social
services sector. Between 2005–06 and 2015–16, the sector
expanded in terms of GSP output by 123 percent, which grew
its contribution to the total Queensland GSP from 6 percent
to 9 percent. In contrast, the mining sector grew by only
10 percent, with its share of total Queensland GSP falling from
12 percent to 8 percent over the same period.
Further increases in service based activity have also been
prominent in the transport, postal and warehousing sector,
as well as the education and training sector. This has seen
education and training GSP output grow by 44 percent between
2010–11 and 2015–16, with transport, postal and warehousing
growing by 34 percent over the same period.
The region’s agricultural sector has also been growing, with
GSP from agriculture, forestry and fishing growing by 18 percent
between 2010–11 and 2015–16.
25SEQ City Deal | Economic Foundations Paper
The SEQ region
Goods exports are also growing
SEQ is growing as a major trading partner with the Asia-Pacific
region. Analysis of trade through the Port of Brisbane indicates
that its agribusiness and advanced manufacturing industries
have both experienced strong export growth between 2006–07
and 2016–17.13 This has seen advanced manufacturing
exports grow at a faster pace than the Australian benchmark
(62 percent for SEQ’s port of Brisbane – which includes air
and shipping freight – versus 14 percent for Australia)14. The
gateway is also the state’s major agribusiness export hub,
with approximately 90 percent of agribusiness related exports
leaving via SEQ, often destined for one Queensland’s top 5
trading partners (all of which are in the Asia-Pacific: China,
Japan, India, Korea, and Taiwan).15
The majority of SEQ’s workforce engage in
population serving activities
SEQ’s population serving economic activity captures
industries that include: local health and education, retail and
wholesale trade, industrial and construction services, food and
recreation, and public administration. While these industries
do not account for a significant amount of traded economic
activity or the majority of value added activity, they do account
for the greatest share of employment in the region.
An estimated 900,000 workers are employed in population
serving industries throughout SEQ, accounting for
approximately 64 percent of the workforce. Activity in these
industries directly contributes an estimated $89 billion in GVA
to the region’s economy per annum.16
Modest growth in real wages is weakening
household’s disposable incomes
Between 2011 and 2016 Queensland’s gross household
disposable income per capita has grown at a compound
annual growth rate of 1.2 percent, currently representing
$43,851 per capita.17 This low growth reflects the modest wage
growth currently being experienced throughout the Australian
economy. Queensland’s real wage growth for 2016–17 was only
1.9 percent, just ahead of inflation at 1.8 percent. This period of
supressed wage growth has impacted household expenditure.
Weaker growth has tightened household
expenditure
Recent estimates suggest that Queensland’s consumption
activity is also slowing down. In 2015–16, the Queensland
State Final Demand (SFD) fell by 1.3 percent, demonstrating a
fall in demand for the total value of goods and services sold
in the state. This decline was in part attributed to a slowdown
in construction related activity for the state, particularly in
the mining sector, and modest real wage growth, all of which
contributed to lower household expenditure.18
While much of these macro indicators relate to state wide
trends, many of the same outcomes are similar in SEQ
given the region’s significant contribution to the state’s
economic performance. It follows that lifting the productive
economic performance of SEQ, particularly by growing its
traded industries, will be critical for Queensland’s economic
objectives. This will support growth in the state’s headline
economic indicators by contributing to improved real wage
growth and renewing consumer confidence, lifting demand in
the region’s population serving industries, in turn creating new
employment opportunities.
New dwelling approvals are underpinning the
construction sector
New dwelling approvals continue to drive construction
activity in SEQ. Between June 2015 and June 2016, there were
over 48,000 new dwellings commencing construction in
Queensland, of which 90 percent were located in SEQ.19 New
dwelling activity has historically been further supported by
commercial and public investment in new offices and public
assets (hospitals and schools).
In Queensland, total investment in construction activity by
both the private and public sector have recently returned
to pre-LNG investment norms (Figure 7). In SEQ, this period
of soft investment has implications for small businesses
which are dependant on construction related activity. Of the
280,000 small businesses operating in the SEQ region during
the 2015–16 financial year, the construction sector experienced
the greatest degree of cotraction (approximately 18 percent).
13 Advanced manufacturing exports include SITC 1-digit: 5 Chemicals and related products, and 7 Machinery and transport equipment. Agribusiness products
exports include SITC 1-digit: 0 food and live animals, 1 beverages and tobacco, and 4 animal and vegetable oils, fats and waxes14 Queensland Government Statistician’s Office, 2017, Trade data – exports – port of loading (3-digit SITC revision 3) 2006–07 to 2016–17 (preliminary) pivot
table15 Queensland Government Statistician’s Office, 2017, Exports of Queensland Goods overseas, July 201716 CTT Calcs17 ABS, 2016, 522004 – Annual Queensland State Accounts, 2015–1618 ABS, 2016, 522004 – Annual Queensland State Accounts, 2015–1619 https://www.mbqld.com.au/__data/assets/pdf_file/0007/566980/Building-Industry-Outlook-2017.pdf
26 SEQ City Deal | Economic Foundations Paper
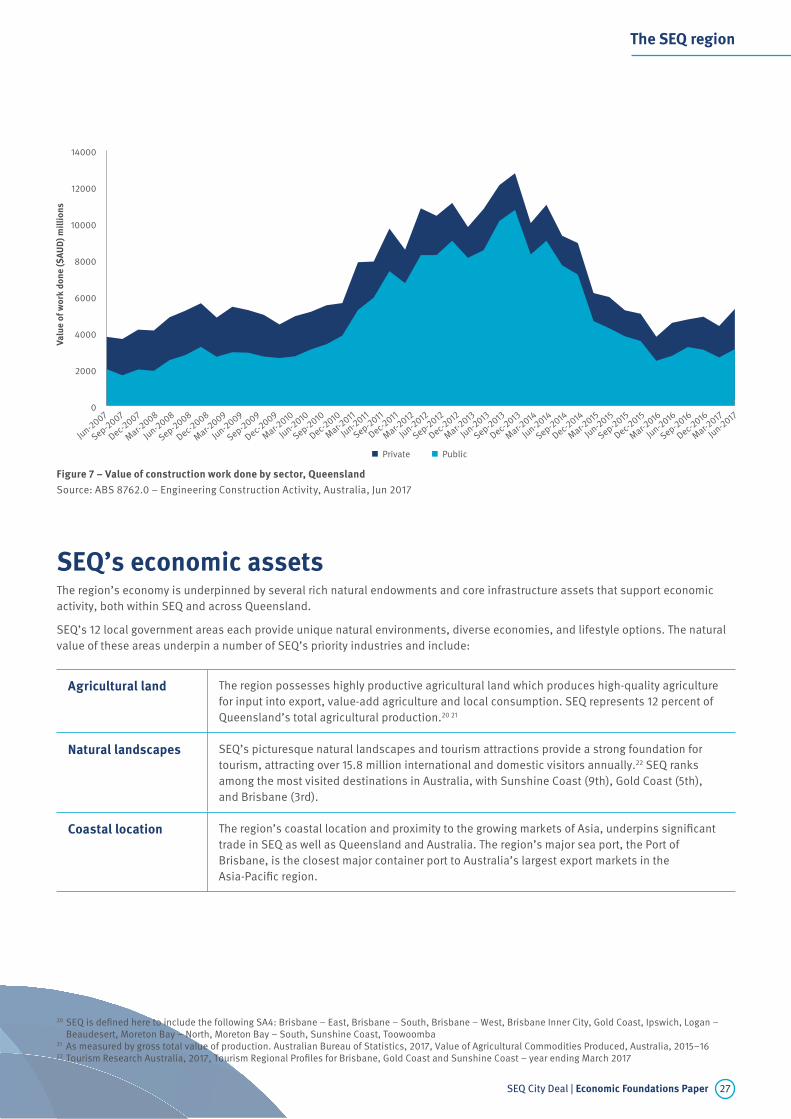
Figure 7 – Value of construction work done by sector, Queensland
Source: ABS 8762.0 – Engineering Construction Activity, Australia, Jun 2017
Private Public
Jun-2
017
Mar-2
017
Dec-2016
Sep-2016
Jun-2
016
Mar-2
016
Dec-2015
Sep-2015
Jun-2
015
Mar-2
015
Dec-2014
Sep-2014
Jun-2
014
Mar-2
014
Dec-2013
Sep-2013
Jun-2
013
Mar-2
013
Dec-2012
Sep-2012
Jun-2
012
Mar-2
012
Dec-2011
Sep-2011
Jun-2
011
Mar-2
011
Dec-2010
Sep-2010
Jun-2
010
Mar-2
010
Dec-2009
Sep-2009
Jun-2
009
Mar-2
009
Dec-2008
Sep-2008
Jun-2
008
Mar-2
008
Dec-2007
Sep-2007
Jun-2
0070
2000
4000
6000
8000
10000
12000
14000
Va
lue
of
wo
rk d
on
e (
$A
UD
) m
illi
on
s
The SEQ region
SEQ’s economic assetsThe region’s economy is underpinned by several rich natural endowments and core infrastructure assets that support economic
activity, both within SEQ and across Queensland.
SEQ’s 12 local government areas each provide unique natural environments, diverse economies, and lifestyle options. The natural
value of these areas underpin a number of SEQ’s priority industries and include:
Agricultural land The region possesses highly productive agricultural land which produces high-quality agriculture
for input into export, value-add agriculture and local consumption. SEQ represents 12 percent of
Queensland’s total agricultural production.20 21
Natural landscapes SEQ’s picturesque natural landscapes and tourism attractions provide a strong foundation for
tourism, attracting over 15.8 million international and domestic visitors annually.22 SEQ ranks
among the most visited destinations in Australia, with Sunshine Coast (9th), Gold Coast (5th),
and Brisbane (3rd).
Coastal location The region’s coastal location and proximity to the growing markets of Asia, underpins significant
trade in SEQ as well as Queensland and Australia. The region’s major sea port, the Port of
Brisbane, is the closest major container port to Australia’s largest export markets in the
Asia-Pacific region.
20 SEQ is defined here to include the following SA4: Brisbane – East, Brisbane – South, Brisbane – West, Brisbane Inner City, Gold Coast, Ipswich, Logan –
Beaudesert, Moreton Bay – North, Moreton Bay – South, Sunshine Coast, Toowoomba21 As measured by gross total value of production. Australian Bureau of Statistics, 2017, Value of Agricultural Commodities Produced, Australia, 2015–1622 Tourism Research Australia, 2017, Tourism Regional Profiles for Brisbane, Gold Coast and Sunshine Coast – year ending March 2017
27SEQ City Deal | Economic Foundations Paper

Core transport
infrastructure
SEQ is unique in its concentration of transport assets, including five international gateways that
connect the region directly to international markets – the Port of Brisbane, Brisbane Airport, Gold
Coast Airport, Sunshine Coast Airport and Wellcamp Airport (Toowoomba). These gateways are
serviced by the region’s road and heavy rail freight networks providing clear north-south and
east-west connections to support economic activity through the efficient and effective movements
of goods from industry to market.
The region’s core transportation infrastructure underpins the efficiency of SEQ’s supply chains,
which are central to SEQ’s ability to compete in international markets, and to compete with
imports to the domestic market.
Knowledge and
technology precincts
SEQ has a number of world-class health, education and training facilities that contribute to
the region’s knowledge and technology precincts. These precincts are urban clusters that contain
a core high-level health, education, research or similar facility that provides opportunities for
complementary and supporting activities. There are four strategically significant health and
knowledge precincts within the region – Herston Health Precinct, Princess Alexandra Health
& Knowledge Precinct in Woolloongabba, the Gold Coast Health & Knowledge Precinct and
the Sunshine Coast University Hospital Precinct.
The region is also home to a range of world class tertiary education campuses that have
developed as critical precincts to support the region’s workforce capacity, research activities
and clustering of knowledge sector businesses.
The region’s high-quality knowledge and technology precincts are critical to support SEQ’s
well-educated and skilled workforce, and on further maturing SEQ’s knowledge intensive activity.
Strategic defence
assets and supply
chains
Key assets across the region that underpin defence activity include: the Greenbank Training
Area in Logan; the Royal Australian Air Force (RAAF) base at Amberley; the Amberley Aerospace
and Defence Support Centre in Ipswich; and the Kokoda Barracks (Land Warfare Centre) located
in Canungra.
Identified,
coordinated industrial
land capacity
The Queensland Government has designated the Bromelton SDA as a strategic location for
industrial uses and logistics operations with direct access to the national standard gauge
network. Adjacent to the corridor for the inland rail project, the SDA will form a critical economic
asset for the expansion of industrial and high impact industries in the region as well as
providing a valuable intermodal hub for the connection of freight to the Port of Brisbane.
The region’s natural endowments are complemented by a number of key infrastructure assets that further promote and enable
economic development. These include:
Key assets that reflect the region’s built endowments that underpin the region’s economic competitiveness are highlighted
in Figure 8.
The SEQ region
28 SEQ City Deal | Economic Foundations Paper

The SEQ region
!
o
!
o
!
o
!
o
Esk
Oakey
Noosa
Wondai
Gympie
Robina
Kilcoy
Boonah
Gatton
Warwick
Coomera
Nambour
LaidleyIpswich
Kingaroy
Fernvale Brisbane
Jimboomba
Southport
Cleveland
Caloundra
Beenleigh
Redcliffe
Toowoomba
Kingscliff
Crows Nest
Pittsworth
Beaudesert
Caboolture
Tweed Heads
Springfield
Murwillumbah
Maroochydore
Logan Central
Coolangatta
Legend!
o
International airport
!
o
Defence airbase
!! Port of Brisbane
P!! Intermodal terminal
P!! Future Intermodal terminalMajor roadRailwayFuture road connectionFuture/investigation rail connectionCity Deals areaWaterbody and waterwayBromelton State Development AreaRegional Economic Cluster
Oakey
Amberley
Figure 8 – Economic foundations of the SEQ region
Source: Regional and Spatial Planning, Queensland Government. September 2017
Economic foundations of the SEQ region
29SEQ City Deal | Economic Foundations Paper

Established foundations for collaboration
Tourism and technology, Holoverse, Gold Coast
30 SEQ City Deal | Economic Foundations Paper

The size, capability and capacity of the 12 local governments in SEQ
make it a unique metropolitan region in an Australian context. The
region is home to the three largest local governments by population
size (Brisbane, Gold Coast and Moreton Bay), as well as five of the
top 10 (including Sunshine Coast and Logan). The scale and maturity
of collaboration between these local governments has provided
a strong foundation for partnership on key policy initiatives, the
setting of consistent economic aspirations and the collaborative
investment in key infrastructure initiatives.
Established foundations for collaboration
Established foundations for collaboration
31SEQ City Deal | Economic Foundations Paper

SEQ has local governments with the
capacity and capability to establish effective
partnerships
In 2007, the region’s governance was strengthened with
the amalgamation of 29 local government areas (LGAs) to
12.23 The consolidation of local councils has improved the
council’s financial sustainability through economies of
scale and increased geographic size of most LGAs, thereby
reducing fragmentation of governance across the region.
The amalgamations have reduced the barriers to regional
cooperation by providing a stable platform for regional
partnership and investment.
Ten years since the amalgamations, the SEQ region is a
model region for local government collaboration. The Council
of Mayors (SEQ) has provided a leadership role in bringing
11 of the 12 LGAs across the region to work together around
joint advocacy and policy initiatives, including key planning
activities, infrastructure coordination, leading environmental
initiatives and improved engagement with other tiers of
government.
The established collaboration and strong fiscal
management across the region’s LGAs is further evidenced
by the co-investment that its councils have made in key
regional transport projects, such as Gold Coast light rail,
Moreton Bay rail link and key road projects.
The track record of the region’s local governments working
collaboratively and partnering with the state on key
policy initiatives should provide greater certainty to the
Commonwealth Government and industry that there is a stable,
reliable platform for partnership on key regionally significant
investments and initiatives.
A mature policy platform developed through
regional collaboration
Local and Queensland governments have developed a mature
policy platform across spatial, infrastructure and economic
planning perspectives (Figure 9). Typically each of these three
policy areas are mutually interdependent. However, significant
investment has been made at both the Local and State levels of
Government to ensure that the plans for the region across each
of these policy areas are mutually reinforcing.
ShapingSEQ was released by the Queensland Government
in August 2017 and provides a central pillar for a number of
these strategies. ShapingSEQ is the Queensland Government’s
statutory plan outlining a guide for the development that
will shape the future population growth of the SEQ region,
and was prepared in collaboration with the region’s 12
local governments. The plan also benefited from extensive
community engagement as part of its development, which
were all included in the ShapingSEQ 2017 Consultation Report.
ShapingSEQ is the region’s pre-eminent strategic land use
plan made under the Sustainable Planning Act 2009 and
provides a framework to manage growth, change, land
use and development in SEQ.
The core themes – grow, live, sustain, prosper and connect –
highlight a strong commitment by the state government and
the local government partners to delivering improved regional
prosperity, liveability and long-term sustainability.
The SEQ City Deal will seek to build on this mature policy
platform by drawing together key elements of the spatial,
infrastructure and economic planning for the region to
deliver a package of transformative investment.
23 Including Noosa Shire Council which de-amalgamation in 2013
Established foundations for collaboration
Figure 9 – Existing strategic plans guiding the development of the economic foundations paper
Source: CTT, Queensland Government
Strategy Spatial Infrastructure Economic
State State Planning PolicyState Infrastructure
Plan
Advancing Qld Industry
Roadmaps
Regional Shaping SEQSEQ Regional
Transport Plan
Committed under State
Infrastructure Plan
LocalLocal Planning
Schemes
Local Government
Infrastructure Plans
Local Economic
Development Plans
Delivery
32 SEQ City Deal | Economic Foundations Paper

A consistent regional vision for a ‘liveable
gateway’
The region has also developed a consistent view around
the economic vision for the region. The SEQ City Deal Vision
has been prepared separately, and builds on this economic
analysis and highlights the region’s aspiration to continue to
develop as a ‘liveable gateway’. This term has been developed
to succinctly capture the unique characteristics of the region,
relative to other key metropolitan regions in Australia. It
reflects two critical differentiators of the region’s identity
and advantages. Firstly, SEQ is arguably best known for its
diversity and various lifestyle choices. With scenic hinterlands,
pristine beaches, vast agricultural land and a commercial hub
all within an hour of the CBD, SEQ is home to many world
class destinations. SEQ has the luxury of a distinct warm
sub-tropical climate, affordable housing, safe communities
and low sovereign risk for business investment.
Along with diverse lifestyle choices, SEQ is also well positioned
to become a trading region to directly connect with the world,
primarily its closest neighbours in the Asia Pacific region.
Supplemented by significant infrastructure capacity and linked
by five international gateways, SEQ holds a strategic advantage
of growth in aviation, tourism, leisure and freight. It is these
existing differentiating factors that provide SEQ with the unique
opportunity to become a globally and domestically recognised
trading portal.
The economic foundations paper seeks to build on this
aspiration for the region to grow as a ‘liveable gateway’ and
provide greater context around the economic drivers that are
shaping the region’s potential economic future. It will do this
by identifying the key spatial characteristics of the region that
will be critical to a step-change in economic development to
support greater trade oriented growth.
Established foundations for collaboration
Kitefest, Redcliffe, Moreton Bay
33SEQ City Deal | Economic Foundations Paper

Positioning SEQ
Sir Leo Hielscher Bridges, Gateway Motorway, Brisbane
34 SEQ City Deal | Economic Foundations Paper

SEQ makes a large and unique contribution to the Queensland and
Australian economies. As Queensland’s capital and the third largest
metropolitan region in the county, it is a diverse and rapidly growing
economy that is also contributing to Australia’s trade growth into
the Asia-Pacific region. The relative contribution and performance of
the region is summarised below against Queensland, Australia and
global benchmarks for similar regions.
Positioning SEQ
Positioning SEQ
35SEQ City Deal | Economic Foundations Paper

SEQ in the Queensland contextSeven out of ten Queenslanders live in the SEQ city regionSEQ is Queensland’s growing metropolitan capital city region.
It is home to over 3.4 million Australians, 70 percent of the
state’s population.24 The region’s population growth has been
underpinned by a period of sustained net migration inflows
from both interstate and overseas. This population growth
has been most evident amongst young families seeking out
the region’s economic opportunities, sub-tropical climate and
affordable living.25
New populations growing the region’s centres
While Brisbane remains the region’s largest contributor to total
population growth, SEQ’s inner local government areas are
experiencing high population growth rates facilitated by the
development of urban growth fronts. In 2015–16, Ipswich grew
by 2.9 percent, Sunshine Coast by 2.5, Gold Coast by 2.4, and
Moreton Bay by 2.3 while Brisbane grew at 1.6 percent over the
same period.26
SEQ’s urban growth patterns present a
challenge for the region
The continued urban expansion is both a strength and a
challenge for SEQ’s long term economic performance. SEQ will
continue to attract new skilled migrants to the region, as they
seek the affordable subtropical lifestyle. The region will require
greater investment in key infrastructure assets to ensure that
growth can continue to sustainably occur, without significantly
impacting commuter congestion, the demand for utilities and
the natural environment.
24 Australian Bureau of Statistics (2016), 3218.0 Regional Population Growth, Australia 201625 Queensland Government Statistician’s Office, 2017, Population Growth Highlights and trends, Queensland, 2017 edition26 Population growth highlights and trends, Queensland, 2017 edition (2017) Queensland Government Statistician’s Office
Figure 10 – SEQ local government areas population growth, 2016
Source: 3218.0 – Regional Population Growth, Australia, 2016 (2016), ABS
0
2000
4000
6000
8000
10000
12000
14000
16000
18000
20000
Toowoom
ba (R)
Redland (C
)
Logan (C)
Lockyer V
alley (
R)
Brisbane (C
)
Scenic R
im (R
)
Somers
et (R)
More
ton B
ay (R)
Gold C
oast (C)
Sunshine C
oast (R)
Ipswich
(C)
0.0%
0.5%
1.0%
1.5%
2.0%
2.5%
3.0%
Incr
ea
se
in
pe
rso
ns
Pe
rce
nt
gro
wth
3.5%
2.9%
1.9%
1.6%1.5%
1.3%
0.8%
1.6%
2.5%2.4%
2.3%
1.6%
Positioning SEQ
36 SEQ City Deal | Economic Foundations Paper

SEQ is the economic driver of Queensland As with its population, SEQ is home to over 70 percent of
the state’s employment. All industry clusters (excluding the
primary and agriculture industry clusters) have more than
50 percent of their employment within the capital region (see
Figure 11). This is consistent with the region’s economic output
indicators with an estimated $170 billion in Gross Regional
Product (GRP) recorded in 2011, accounting for 64 percent of
the Queensland economy at the time.27
Moving from a traditional to a knowledge
economy
SEQ’s economy has already commenced transitioning from
a historical base of agriculture, mining and traditional
manufacturing, to a more diverse knowledge economy with
increased high value manufacturing and professional service
activities.
SEQ has been able to transition the skill base of its workforce
to align to emerging industries and add value to the outputs
of its historical base industries. This economic shift has
materialised in the region growing advanced manufacturing,
agribusiness and traded health and education industries.
Encouraging innovation through improved
collaboration between research institutions
and industry
The region’s tertiary education industry has experienced strong
growth as a collaborator with the private sector. Queensland
universities have experienced a 75 percent increase in
revenues associated with consultancy and contract work
between 2010 and 2015.28 This growth demonstrates the
region’s increased collaboration throughout its industries
and institutions, allowing for increased industry specific
innovation.
27 Experimental Estimates of Gross Regional Product 2000–01, 2006–07 and 2010–11 (2013). Queensland Treasury and Trade28 Finance 2015: Financial Reports of Higher Education Providers (2016) Australian Government Department of Education and Training
Figure 11 – Queensland and SEQ Employment by Industry Cluster, 2016
Source: CTT, Queensland Government
0 50000 100000 150000 200000 250000 300000 350000 400000 450000
Agriculture
Agribusiness
Primary
Traditional manufacturing
Advanced manufacturing
Transport and communications
Finance and professional services
Tourism and cultural
Traded health and education
Utilities and traded wholesale
Public administration
Retail and local wholesale
Food and recreation
Industrial and construction services
Local health and education
Other local services
SEQ Queensland
Positioning SEQ
37SEQ City Deal | Economic Foundations Paper

World class universities, hospitals, and
knowledge precincts
As Queensland’s capital region, there are a variety of world
class institutions that have located and grown with the
region’s population. These institutions (universities, hospitals
and knowledge precincts) provide the knowledge skills and
services to SEQ’s population along with regional Queensland,
the Northern Territory and northern NSW. SEQ has the assets
required to attract international students to the region, to grow
a strong traded health and education industry.
A gateway to Queensland and northern NSW
SEQ is the key transport hub for Queensland and northern
NSW. The region includes four international airports, the port
of Brisbane and two major freight corridors (east-west and
north-south) which efficiently move people and goods through
the region and beyond. The interconnectedness of the region
to more remote areas of Australia is demonstrated on a regular
basis, with freight movements to and from the port of Brisbane
reaching as far as northern and inland Australia. Brisbane’s
port is key to this activity and, along with the planned Inland
Rail project link, will continue to support economic growth
throughout SEQ and the surrounding regions.
SEQ in the Australian contextSEQ is Australia’s third most populous capital region – home to one in seven AustraliansBetween 2006 and 2016, the SEQ population grew by over
24 percent, outpacing Queensland, New South Wales and
Victoria’s total growth over the same period (21, 15, and
22 percent respectively).
Young families are attracted to SEQ’s
affordable lifestyle
The cost of living in SEQ is more attractive to young families
than its southern counterparts. SEQ has seen net inflows
of young families migrating to Queensland and SEQ from
all around Australia. This has in part been driven by the
mean price of residential dwellings in Brisbane being
$497k compared to $904k in Sydney and $723k in Melbourne
(see Figure 12). These lower average prices make the property
market in SEQ significantly more accessible to young families
looking to purchase their first home.
Despite affordability young professionals are
moving away
Nevertheless, the affordable lifestyle offered in the region
does not retain some of Queensland’s young professionals
(age 25–29) who are moving outside the region, primarily to
Victoria.29
Third largest region on the eastern seaboard
with the potential to grow as a major export
gateway
SEQ has a major port and four international airports linked
by major road and rail infrastructure. These infrastructure
assets have the capacity to increase import and export activity
supporting increased economic growth throughout the region.
29 Queensland Government Statistician’s Office, 2017, Population Growth Highlights and trends, Queensland, 2017 edition
Figure 12 – Mean price of residential dwellings, June 2017
Source: Australian Bureau of Statistics (2017) 6416.0 Residential Property Price Indexes: Eight Capital Cities
Sydney Melbourne Brisbane
0
100
200
300
400
500
600
700
800
900
1000
Mean Property Value
AU
D'0
00
Positioning SEQ
38 SEQ City Deal | Economic Foundations Paper

SEQ’s growing high value export productsSEQ’s major export gateway – the Brisbane port – has the
greatest export volume (in terms of gross weight) of the
three eastern capital city ports. However, the port has the
lowest value (in terms Free On Board (FOB) cost) of exports
demonstrating its comparatively lower value commodities
(Figure 13). Better leveraging the capacity of SEQ’s major
export gateway has the potential to yield significant economic
returns. The challenge for the region will be increasing
the volume of its high value exports, in industries such as
advanced manufacturing, to lift the total export value of SEQ.
Primary industry is the highest volume of
export but lowest in value
As highlighted in Figure 13-15, SEQ’s port is currently utilised
moving low value, high volume and weight primary industry
goods (including minerals). Sydney and Melbourne’s primary
industry exports are significantly higher in value per tonne.
SEQ is nationally competitive in agribusiness
exports
While Melbourne has the greatest volume and value of
agribusiness exports, SEQ has the highest value per tonne
exports (Figure 15 and 16). Currently, exports from the
agribusiness industry make up the largest value share of the
region’s exports, over $3 billion. This exceeds the value of
Sydney’s agribusiness exports, but is comparatively lower
than Melbourne. SEQ’s large export value of agribusiness
has recently been driven by significant increases in demand
from the world’s largest vegetarian population (India) for the
region’s chickpea produce.
Advanced manufacturing is SEQ’s highest
value good per volume
SEQ has the second highest value per tonne of advanced
manufacturing exports on the eastern seaboard. However,
both Sydney and Melbourne experience higher total volume
and value of exports in advanced manufacturing. The high
value per tonne of SEQ’s advanced manufacturing exports
has the potential to become an even more important
contributor to the region’s economy, with the current total
value of SEQ’s advanced manufacturing exports reflecting
the industry’s diverse products: aircraft manufacturing,
pharmaceutical manufacturing, and mining and construction
machinery manufacturing. Supporting the region’s advanced
manufacturing activities has the potential to significantly boost
the headline value of the region’s exports.
Sydney MelbourneBrisbane
Value (FOB)
Volume (Gross Weight)
Sydney MelbourneBrisbane
42%Melbourne
35%Melbourne
21%Brisbane
42%Brisbane
37%Sydney
23%Sydney
Positioning SEQ
Figure 13 – Export Share of Australia’s Eastern Capital City Ports, 2016
Source: ABS, Customised report, 2016
39SEQ City Deal | Economic Foundations Paper

Figure 14 – Total Gross Weight of Australia’s Eastern Capital City Industry Cluster Products, 2016
Source: ABS, Customised report, 2016
Figure 15 – Total Value of Australia’s Eastern Capital City Industry Cluster Products, 2016
Source: ABS, Customised report, 2016
Figure 16 – Value per Tonne of Australia’s Eastern Capital City Industry Cluster Products, 2016
Source: ABS, Customised report, 2016
Advanced manufacturing Traditional manufacturing
Agribusiness Agriculture
Primary
0500000
10000001500000
20000002500000
30000003500000
Brisbane
Sydney
Melbourne
Advanced manufacturing Traditional manufacturing
Agribusiness Agriculture
Primary
01000000
20000003000000
40000005000000
6000000
Brisbane
Sydney
Melbourne
05000
1000015000
2000025000
Brisbane
Sydney
Melbourne
Advanced manufacturing Traditional manufacturing
Agribusiness Agriculture
Primary
Positioning SEQ
SEQ’s growing service exportsIn the increasingly connected global economy, SEQ provides
high quality services, tertiary education, health services, and
unique tourism experiences to the Asia-Pacific region and
beyond.
SEQ has high visitor attraction, though is
lagging on tourism expenditure
SEQ has some of the highest international visitation numbers
in Australia. The region’s top three tourist regions (Brisbane,
Gold Coast and Sunshine Coast) attracted 33 percent of
Australia’s total visitations in 2017.30 This is the result of
the existing four internationally connected airports located
within each tourist region, along with the unique attractions
located throughout SEQ. Nevertheless, the direct connections
to some of the fastest growing middle-income areas in the
world (including Singapore, Hong Kong, Shanghai, Manila,
Guangzhou, among others) has not been able to directly
translate into higher tourism expenditure. At present, tourism
expenditure in SEQ is lagging behind the other eastern
capitals, and accounts for only 13 percent of the total tourism
expenditure in Australia. The challenge for SEQ will be to better
leverage its four international airports to increase visitation
numbers and to demonstrate the value of the region’s
attractions to improve tourism expenditure.
Opportunity to grow as a key destination for
international students
SEQ’s higher education sector is growing rapidly, servicing
both domestic and international students. The region’s
reputable higher education providers have seen the direct
contribution of international student fees in the Queensland
economy exceed $860 million in 2015.31 This does not account
for the flow on benefits of international students studying in
the region, which also supports economic outcomes in the
tourism and creative industries, as families and friends of
international students’ visit. This is a market with significant
potential to continue to grow and will be critical to the region’s
economic future.
30 Table 9A International Visitors, Visitor Nights and Regional Expenditure by Top 50 Tourism Regions, 2017, Tourism Research Australia31 Finance 2015: Financial Reports of Higher Education Providers, 2016, Australian Government Department of Education and Training
40 SEQ City Deal | Economic Foundations Paper

Positioning SEQ
32 The benchmarking report compares SEQ against nine regions: Barcelona Province, Busan Region, Fukuoka Prefecture, Hamburg Region, Metro Vancouver,
San Diego Region, South Florida (Miami), South Holland (Rotterdam), Western Cape (Cape Town) 33 Globalization and World Cities (2017). ‘The World According to GaWC 2016’, www.gawc.com34 World Shipping Council, 2017, top 100 ports in the world in 2015, available at: http://www.worldshipping.org/about-the-industry/global-trade/ports35 CityRepTrak, 2017, Annual Ranking of Most Reputable Cities Worldwide, available at: https://www.reputationinstitute.com/city-reptrak; Economic
Intelligence Unit, 2017, The Global Liveability Report 2017: A free overview, available at: http://www.eiu.com36 QS, 2017, World University Rankings 2018, available at: https://www.topuniversities.com/university-rankings/world-university-rankings/2018; Shanghai
Jiao Tong University, 2017, Academic Ranking of World Universities 2017, available at: http://www.shanghairanking.com/ARWU2017.html; Times Higher
Education, 2017, World University Rankings 2018, available at: https://www.timeshighereducation.com; 2thinknow Consulting, 2017, Innovation Cities™
Index 2016- 017: Global, available at: http://www.innovation-cities.com/innovation-citiesindex-2016-2017-global/9774
SEQ in the international context A recent study benchmarking SEQ against nine international
city regions of similar sized economies has identified factors
that make SEQ internationally competitive and which are
imperative to improve and invest in.32 These regions form a
‘peer group’ because they possess most or all of the following
attributes:
• Medium-sized with a functional population of 3 to 5 million.
• Strategic location within their continent or sub-regions.
These coastal regions act as gateways or hubs for global
traffic. In terms of size, they are second tier economies in
their (sub-) continental ‘system’ of cities.
• An advanced globalised core city. The main city in the
region typically rates among the top 100 for the presence of
global firms in advanced services sectors.33
• Trading functions. By measures of freight, cargo, or
distribution functions, these regions are consistently ranked
among the top 100 globally.34
• Reputation for a high regional standard of Quality of Life
and Public Services. The cities and regions are on average
rated within the Global Top 20 for Health and Education and
within the Global Top 30 for Global Admiration and Trust.35
• Emerging centres of Knowledge and Innovation. All the
regions possess Global Top 200 Universities and average in
the Top 60 for Innovation production globally.36
A snapshot of the benchmarking report for city-regional performance in terms of population and economic growth, trade and
logistics platform, tourism and destination flows is outlined below.
SEQ
Fukuoka
Prefecture
Busan
Region
Cape Town
Metro
Barcelona
ProvinceSan Diego
County
Metro
Vancouver
South Holland
(Rotterdam)
Hamburg
Region
South East
Florida (Miami)
41SEQ City Deal | Economic Foundations Paper

SEQ has undergone a strong cycle of
population growth since 2000
SEQs population has grown more than 40 percent over
10 years – more than the international regions and almost
twice as much as Vancouver. This population growth has
been primarily driven by the inbound migration of Australians
and overseas residents. SEQ has acquired a highly diverse
population with almost one-quarter of the population born
overseas. The region is projected to grow by more than 50
percent over the next 20 years, making it the fastest growth
region among its international peers in the benchmarking
study.
Low population density
SEQ has the lowest regional population density out of the
similar international city regions. Comparing the centres in
each region, Brisbane also had the lowest density by some
distance. This urbanisation pattern leads to higher sprawl,
a more dispersed infrastructure network and a more weakly
connected region than most of its peers. Other regions
have made investments in transport infrastructure, digital
connectivity, and medium density, high quality urban living
promoting multi-centred regions.
Room to grow the economy through increased
export oriented industries
The SEQ region also has comparatively low export related
industry activity with slightly lower labour productivity than
most other Euro-American regions. SEQ has been improving
GDP per capita, but is still only moderate when compared to
the sample of regions in the benchmarking study.
SEQ has the lowest share of output from export oriented
industries in the benchmarking study (Figure 19). When
compared to the sample of international regions, SEQ could be
considered as emerging, as it has only recently began shifting
towards more traded services and expertise.
Positioning SEQ
Figure 17 – Population growth, 2000–2017*
*Busan Region refers in this case to Busan Metropolitan CitySource: Moonen T., Nunleyn J. and Clark G., 2017. Benchmarking SEQ in a Global Context
-10% 0% 10% 20% 30% 40% 50%
Busan Region
Fukuoka Prefecture
Hamburg Region
S Holland (Rotterdam)
Barcelona Province
San Diego County
SE Florida (Miami)
Metro Vancouver
SEQ
Cape Town Metro
*Most recent data available used – in some cases 2016 figures are used
Figure 19 – Share of output by industry
Source: Moonen T., Nunleyn J. and Clark G., 2017. Benchmarking SEQ in a Global Context.
Business/Finance Trade & tourism Manufacturing Commodities
Local/Non-market Construction Transportation Utilities
0
10
20
30
40
50
60
70
80
90
100
SEQ
Metro Vancouver
S Holland (R
otterdam)
Fukuoka Prefecture
SE Florida (M
iami)
Hamburg Region
Barcelona Province
San Diego County
Cape Town Metro
Busan Region
Figure 18 – Projected population growth, most recent available–2040
*Busan Region refers in this case to Busan Metropolitan City. **Hamburg Region refers in this case to EUROSTAT’s Metropolitan Region of HamburgSource: Moonen T., Nunleyn J. and Clark G., 2017. Benchmarking SEQ in a Global Context
-20% -10% 0% 10% 20% 30% 40% 50% 60%
Busan Region
Fukuoka Prefecture
Barcelona Province
S Holland (Rotterdam)
San Diego Region
Hamburg Region
Cape Town Metro
SE Florida (Miami)
Vancouver Metro
SEQ
42 SEQ City Deal | Economic Foundations Paper

SEQ lags behind its peers in trade volumes
Despite SEQ’s sizeable trading functions and a strong platform
for growth, it is one of the lowest ranking regions for port
cargo tonnage. Compared to its peer regions, SEQ’s trade
throughput via the port and airports is limited. In recent
years, the other international regions have implemented port
improvement programs; undertaking significant investment
initiatives aimed at increasing capacity and competitiveness
of ports, particularly the port giants of Busan, Rotterdam and,
increasingly Fukuoka.
Increasing numbers of air passengers, but
limited international connectivity
SEQ is a moderate performer in terms of the number of air
passengers with around 29 million passengers per year.
Brisbane’s domestic and international airports account for
approximately 23 million of these passengers, with Gold Coast
Airport accounting for a further 6 million.
The region has fewer direct international flight connections,
behind all European and American peer regions (excluding
San Diego) (Figure 20). SEQ’s relatively limited international
connectivity may be partly due to geographical isolation.
Noting that San Diego is also relatively geographically isolated
and ranks in last place in the study.
Successful internationalisation of the higher
education sector
The region exports significantly more education than any of
its peers based on number of international students enrolled
in QS top 1000 universities.37 SEQ exports about 20 percent
more than that of Vancouver, which ranks second, and over
double that of Barcelona, which ranks third. The region attracts
particularly high numbers of students from China, India, South
Korea and Taiwan.
SEQ’s internet infrastructure and speed is well
below average
SEQ’s average upload and download speeds are substantially
lower than every other region except for Cape Town metro.
Internet speed is one of the weakest areas of comparative
performance for SEQ. This deficit is likely due to its lack of
access directly or indirectly to the global submarine cable
network that connects the world’s internet. Other regions have
direct access to up to 13 underwater sea cables. Those regions
without direct access to a cable generally have up to five
cables within a 200km radius.
Positioning SEQ
Figure 20 – Annual air passengers (millions)
Source: Moonen T., Nunleyn J. and Clark G., 2017. Benchmarking SEQ in a Global Context
0
10
20
30
40
50
60
70
80
Cape Town M
etro
Busan Region
Hamburg Region
San Diego Region
Metro Vancouver
Fukuoka Prefecture
SEQ
Barcelona Province
S Holla
nd (Rotte
rdam)
SE Florida (M
iami)
Mil
lio
ns
37 QS Quacquarelli Symonds Limited, 2017. QS World University Rankings. Accessed on 25 October 2017.
https://www.topuniversities.com/university-rankings
QUT Robotics, Brisbane
43SEQ City Deal | Economic Foundations Paper

Positioning SEQ
QIMR Berghofer Medical Research Institute, Brisbane
44 SEQ City Deal | Economic Foundations Paper

Left unchecked, rapid population, urban, and economic
growth can impact on environmental areas and adversely
impact on a region’s prosperity. Impulsive urbanisation
and poor management can significantly hamper the potential
‘emerging futures’ of regions. In particular, when management
of regional policy fails to address the sustainability issues
of growth, it can lead to visible and devastating impacts
on the region’s land management, ecosystems, inhabitants’
liveability, and the overall long-term sustainability of
the region.
Conversely, prosperous regions support the growth of
economic activities with infrastructure development,
preservation of quality of life, equity and social inclusion,
and environmental sustainability. To achieve economic
growth which has a sustained positive change and does
not impact on a region’s core social and environmental
values, it is necessary to plan and actively implement
social and environmental actions.
“Sustainable prosperity is a result of sustainable
development that enables all human beings to
live with their basic needs met, with their dignity
acknowledged, and with abundant opportunity
to pursue lives of satisfaction and happiness, all
without risk of denying others in the present and the
future the ability to do the same”.38
The following section identifies the considerations necessary
to achieve sustainable prosperity in the SEQ region. This
focuses on the quality of life (social) and sustainable
ecosystems (environmental) facets of sustainable prosperity.
For the purposes of the remainder of the Economic
Foundations Paper, the SEQ region is defined by the 11 Local
Governments that are currently engaged in consultation with
the State and Commonwealth governments for a SEQ City
Deal. These are:
• Brisbane City Council;
• Gold Coast City Council;
• Ipswich City Council;
• Lockyer Valley Regional Council;
• Logan City Council;
• Moreton Bay Regional Council;
• Redland City Council;
• Scenic Rim Regional Council;
• Somerset Regional Council;
• Sunshine Coast Council; and
• Toowoomba Regional Council.
PART 2 | Foundation for sustainable prosperity in SEQ
Part 2
38 The Worldwatch Institute. (2012). State of the world 2012: Creating sustainable prosperity. Washington, DC: Island Press.
www.worldwatch.org/stateoftheworld2012
45SEQ City Deal | Economic Foundations Paper

The social environment
46 SEQ City Deal | Economic Foundations Paper
Kirra Beach, Gold Coast
46 SEQ City Deal | Economic Foundations Paper

The social environment is
an important consideration
in the future planning for a
city-region. In planning for
economic growth, attention
must be provided to identify the
potential social externalities.
These can influence the unique
societal factors that shape
the social liveability of the
city-region.
The consideration of social outcomes
in the development of a city-region
typically seek to assess factors that
determine the quality of the region’s
living conditions. In this context,
where a region is deemed highly
liveable, it is likely to experience few,
if any, challenges to living standards,
whereas if a region has significantly
low liveability, most aspects of day-to-
day living for the region’s population
are severely hampered. Indicators that
typically provide insight to a region’s
social performance include:
• infrastructure – the quality of
the transport network, provision
of utilities, availability of quality
housing, digital connectivity etc.
• human capital – the skills and
capabilities of the region’s workforce,
including level of education
attainment
• stability – such as prevalence
of crime and disadvantage
communities, civil unrest, threat of
terror
• civic services – such as access to
quality healthcare and education
• culture and environment – such as
average temperatures, community,
access to public places, sport, social
or religious restrictions, food and
drink, consumer goods and services.
Improving the social environment of
a region can contribute to the overall
liveability, economic outcomes, and
provide more equitable returns from
economic growth for society. The
remainder of this section identifies
social factors that will be important for
the future development outcomes of the
SEQ region.
The social environment
47SEQ City Deal | Economic Foundations Paper
The social environment
47SEQ City Deal | Economic Foundations Paper

Infrastructure Provision of infrastructure provides citizens with access
to quality services. Future growth will place greater pressure
on some of the region’s already constrained networks.
Transport and utilities infrastructure has a significant impact
on the social outcomes of an area. These services provide
the basis for an adequate standard of living, allowing
residents to enjoy day-to-day life.
Access to transport
Quality transport infrastructure allows residents to easily
move around the region to engage in activities and access
services and employment. Poor transport infrastructure
hampers the movement of inhabitants – increasing the
amount of time required for commuting and decreasing time
available for other activities. Transport accessibility to key
areas of employment provides an indication to the quality of
transport infrastructure in SEQ and its capacity to support
employment accessibility.
In order to assess this accessibility, the travel times to
and from the Regional Economic Clusters (REC) identified in
ShapingSEQ have been plotted for the am peak. This analysis
has shown that the majority of SEQ has good access to these
clusters (<30min commute) for private vehicles owners, but it
is much less accessible for public transport (see Figure 21 and
Figure 22). Current modelling using Google Maps (2017) and
2016 Census data highlights that 90 percent of the region’s
population has access via private vehicle to a REC within
30 minutes, while only 20 percent have access via public
transport within 30 minutes.
As evident in the two figures below, SEQ has high quality
private vehicle access throughout the majority of the region,
but relatively poor public transport accessibility. This
mismatch in accessibility creates equity issues throughout
the region, particularly to the groups of society where vehicle
ownership is not an option (such as children, disabled, and
elderly) and those where the cost of vehicle ownership is too
high. These groups must rely on the public transport network
as their primary mode of transport. As such, where public
transport accessibility is particularly poor, it can compound
socio-economic issues of disadvantaged communities who
are already more likely to experience lower levels of
standard of living.
Improving public transport access has the greatest potential
to equitably improve overall accessibility throughout the
region, allowing greater ease of access to all the region has
to offer. In addition to equitable access improvements, it
can also reduce the reliance on vehicle ownership and the
presence of associated negative externalities on society –
such as CO2 emissions, congestion and fatalities due to
car accidents.
Figure 21 – Private vehicle access to nearest REC in SEQ
Source: Google Maps API (2017)
Figure 22 – Public transport access to nearest REC in SEQ
Source: Google Maps API (2017)
The social environment
48 SEQ City Deal | Economic Foundations Paper

Access to energy
SEQ’s energy market is currently in a transition period as
deregulation is introduced. Deregulation is intended to
improve the competition in the energy market, ultimately
reducing electricity costs to the community. The current
reliability and performance of the energy infrastructure is best
assessed by understanding the performance of the region’s
primary provider and operator of energy utility infrastructure,
Energex. In 2015–16, Energex reported that the energy
network met the provider’s network reliability standards,
reporting only 0.032 events of System Average Interruption
Frequency Index (SAIFI) for the CBD, 0.747 events for the SEQ
urban area, and 1.730 events for short rural areas.39 This met
all of the provisions of energy targets for the provider, and
demonstrates that the network is currently able to meet the
demand for energy supply in SEQ.
Access to water
The region has continual access to high quality water supply.
SEQ’s major water supplier, Queensland Urban Utilities,
reported that in 2016–17 they met all of their water quality
targets with only 0.02 water quality incidents reported per
1000 properties. Similarly, continuity of water supply which
measures service interruptions in the region recorded 66
unplanned service interruptions, of which 97 percent were
restored within five hours of reporting.40 These indicators
demonstrate the high level of access to quality water that the
region currently enjoys.
As the region continues to grow and with population growth
intensifying within the region, and industry activity requiring
greater use of water to continue expansion, there will be
greater pressure on water suppliers to meet the growing
demands of the region’s water users.
39 Energex, 2016, Annual Performance Report 2015/1640 Queensland Urban Utilites, 2017, Enriching Quality of Life 2016/17 Annual
The social environment
Transport, Brisbane
49SEQ City Deal | Economic Foundations Paper

Human capital Higher education and a technical skills underpin SEQ’s
growing resident workforce.
Tertiary education attainment is a critical indicator of the
supply of education labour to support the growth of high
value industries. Despite SEQ’s high representation of tertiary
institutions and significant exports of tertiary education
to international students, the highest level of education
attainment by SEQ residents remains lower than that of the
Sydney and Melbourne metropolitan regions. While this
level of attainment has improved over the five years to 2016,
this growth has been outperformed by further gains in the
education attainment of residents in Sydney and Melbourne.
As a measure of SEQ’s human capital, the highest level of
education attainment provides insight into the capability
of the resident workforce. Between 2011 and 2016, SEQ’s
residents aged 15 and over with a bachelor degree or higher
increased by 117,000 (representing a 26 percent increase).
This was outperformed by Sydney and Melbourne which
increased by 255,000 and 237,000 representing increases
of 30 percent and 31 percent respectively.41
The growth in level of education attainment was
predominantly driven by the net interstate migration of highly
skilled workers moving to SEQ. In 2016, SEQ recorded a net
gain of 12,312 residents with a bachelor degree or higher,
primarily driven by the 25–44 age group (see Figure 23).
Interestingly, this included a net gain of highly qualified
residents from NSW, but a net loss to Victoria (see Figures 24).
This trend sheds light on the relative attractiveness of SEQ
to knowledge workers in NSW, but that the historical trend of
losing young, educated residents to Melbourne continues.
Current student enrolments for SEQ has been trending
above the region’s population growth. Between 2011 and
2016, tertiary students currently enrolled in a bachelor’s
degree or higher in SEQ grew by 23 percent, while population
growth was only 10 percent over the same period. This,
however, was lower than Sydney and Melbourne, which grew
by 27 percent and 34 percent respectively, demonstrating the
greater capacity for student numbers in their universities.
SEQ’s technical student enrolments (diploma, advanced
diploma, and certificate students) grew by 2 percent over the
period, while Sydney and Melbourne declined by 13 percent
and 9 percent respectively.42 This demonstrates that SEQ is
still maintaining a well diversified skills base at the heart of
the economy as its industries continue to grow.
The social environment
Figure 23 – SEQ’s highest education attainment arrivals and departures by age group, 2016
Source: ABS, 2017, Census of Population and Housing, Australia, 2016
Figure 24 – SEQ’s highest education attainment arrivals and departures by location, 2016
Source: ABS, 2017, Census of Population and Housing, Australia, 2016
0
20000
40000
60000
80000
100000
120000
65+ Yrs45–64 Yrs25–44 Yrs15–24 Yrs
Arr
iva
ls
De
pa
rtu
res
Arr
iva
ls
De
pa
rtu
res
Arr
iva
ls
De
pa
rtu
res
Arr
iva
ls
De
pa
rtu
res
Below Bachelor Bachelor and above
0
20000
40000
60000
80000
100000
Outside SEQOther States and unknown
VictoriaNew SouthWales
Arr
iva
ls
De
pa
rtu
res
Arr
iva
ls
De
pa
rtu
res
Arr
iva
ls
De
pa
rtu
res
Arr
iva
ls
De
pa
rtu
res
Below Bachelor Bachelor and above
41 ABS, 2017, Census of Population and Housing, Australia, 201642 ABS, 2017, Census of Population and Housing, Australia, 2016; Various, 2017, University Annual Reports
50 SEQ City Deal | Economic Foundations Paper

The social environment
Figure 26 – SEQ labour force participation rates for SA2s, 2016
ABS, 2017, Census of Population and Housing, Australia, 2016
Figure 25 – SEQ highest education attainment by secondary school qualification for SA2s, 2016
ABS, 2017, Census of Population and Housing, Australia, 2016
The two maps above (Figure 25 and 26) have been
developed to highlight latent capacity in the SEQ labour
market. They outline the relative education levels and
workforce participation rates across SEQ. In the inner
metropolitan areas of SEQ, the data indicates that there
is relatively high labour force participation coupled with a
relatively low portion of the population with only a secondary
school highest education attainment. Comparatively, this
trend reverses across the middle-ring out outer regions
of SEQ, with a few notable exceptions.
These exceptions include Toowoomba, which has a relatively
lower educated workforce, though a very high participation
rate. This suggests that local workforce skills meet the
demand of local employment opportunities. Similar trends
can be observed in Moreton Bay and the Gold Coast.
Key pockets across SEQ where there are both a lower
education attainment rate and a lower labour force
participation rate include Logan Central, the South-West
Industrial Corridor through to Ipswich and areas of the Lockyer
Valley and Somerset around Gatton, Laidely, Esk and Fernvale.
When overlaid against a backdrop of high population density
and forecast growth in Logan and Ipswich, it is clear that there
is an opportunity to better connect residents with employment
opportunities in these locations, both through economic
development and transport connectivity investment.
51SEQ City Deal | Economic Foundations Paper

The social environment
StabilityStable institutions and communities contribute positively to
the quality of life experienced by residents.
In terms of stability, SEQ enjoys relatively low levels
of crime, civil unrest and threat of terror, however the
region experiences some rising inequality issues in some
disadvantaged communities.
Socio-economic disadvantage
As a measure of socio-economic conditions, the 2011
Socio-Economic Indexes for Areas (SEIFA) provides a measure
for disadvantage – the Index of Relative Socio-economic
Disadvantage (IRSD). The IRSD measures an areas, level of
disadvantage from most disadvantaged (areas with an IRSD
score of 1) to least disadvantaged (areas with an IRSD score
of 10) by assessing census variables such as: households
with low income, number of people with no qualifications,
and number of people in low skilled occupations.43 Figure 27
maps the areas of socio-economic disadvantage from most
disadvantaged to least disadvantaged for SEQ.
Figure 27 highlights pockets of disadvantage along some
of SEQ’s major transport corridors. This trend highlights
the importance of complementary interventions to support
economic participation and economic wellbeing for SEQ’s
residents. Other areas of disadvantage are located on the
outskirts of the region which have poor accessibility to
services and employment. These areas of disadvantage
include some of the most vulnerable residents in the region
which should be considered when undertaking strategic
planning for interventions to facilitate economic growth.
43 ABS, 2013, Census of Population and Housing: Socio-Economic Indexes for Areas (SEIFA), Australia, 2011
Figure 27 – Areas of socio-economic disadvantage in SEQ
ABS, 2013, Census of Population and Housing: Socio-Economic Indexes for Areas (SEIFA), Australia, 2011
52 SEQ City Deal | Economic Foundations Paper

Civic servicesSEQ has a number of world-class universities throughout the
region, however education attainment has been falling.
The SEQ region has a strong tertiary education system,
underpinned by five universities in the QS top 500 university
rankings.44 However, when comparing against similar
international regions, SEQ’s higher education attainment for
the region’s population is relatively low.45 This demonstrates
that, while SEQ’s universities perform strongly, with over
100,000 enrolments, the region has not been able to
effectively retain the knowledge, with many graduates leaving
the region upon graduation.
The lack of retained knowledge in SEQ may be attributed
to a number of factors. These may include international
students returning home after studies or a lack of employment
opportunities in the region. The second possibility is a more
concerning problem for the region, in that its educational
institutions are not effectively collaborating with the region’s
industries to supply the skills required by industry. This
can result in knowledge leakage, particularly to places with
more established knowledge intensive industries, such as
Melbourne and Sydney.
Culture and environmentSEQ’s capital city Brisbane has 7 out of 10 of Australia’s most
liveable suburbs and one-third of the top 50.46
The SEQ region benefits from warm sub-tropical climates
with average temperatures ranging from 15.7 °C to 25.5 °C.
The region’s communities are afforded plentiful access to
public spaces and world class beaches, with its suburbs
ranking highly in Australia for access to parks, schools, and
beaches.47
Metropolitan revitalisation is competing with the need for
green spaces.
Comparing the rate of change in green space available in the
Brisbane metropolitan area to other similar areas around the
world SEQ ranks poorly with a 30 percent decline in available
green space between 2000 and 2014.48
The decline in available green space has been in part
the result of the region’s capital city undergoing rapid
transformation. Population growth and consolidation
development at the heart of SEQ has seen active vibrant
metropolitan communities expand, providing the population
with new social experiences in which to engage. This has seen
Brisbane ranking highly on a number of livability lists moving
up the Economic Intelligence Unit’s (EIU) livable cities index,
from rank 20 in 2014 to 16 in 2017, and Monocoles’s list of top
25 liveable cities, 25 to 23 over the same period.
Future consolidation development and expansion of
metropolitan communities should seek to ensure that green
space is maintained as a priority. Preservation of green space
will contribute to sustainable growth and lifestyle values for
the region’s current and future generations.
44 QS Higher Education rankings, 201645 Moonen T., Nunleyn J. and Clark G., 2017. Benchmarking SEQ in a Global Context46 REA Group Ltd., 2017, Australia’s Best Lifestyle Suburbs47 REA Group Ltd., 2017, Australia’s Best Lifestyle Suburbs48 Moonen T., Nunleyn J. and Clark G., 2017. Benchmarking SEQ in a Global Context
The social environment
53SEQ City Deal | Economic Foundations Paper

The natural environment
54 SEQ City Deal | Economic Foundations Paper
Natural landscape, Scenic Rim
54 SEQ City Deal | Economic Foundations Paper

Governments are increasingly
faced with policy issues that are
multi-disciplinary in nature and
require an understanding of the
links between socio-economic
and environmental factors.
The natural environment provides a
myriad of benefits to the SEQ community
including fresh air, clean water,
pollination, healthy soils, flora and
fauna, fish and livestock. These public
and private goods underpin lifestyle
and economic development and activity
across a diverse range of sectors such as
agriculture and fisheries, construction
and tourism.
Economic growth and development
can in turn result in environmental
externalities across all stages of industry
supply chains that place stress on public
works infrastructure and lead to impacts
such as land clearing, land degradation
and greenhouse gas emissions. The
depletion of non-renewable resources or
broader residual environmental impacts
can undermine the sustainability of
economic growth by reducing the quality
and quantity of natural resources
available to future generations.
This section outlines five prominent
environmental issues facing the SEQ
community today, each of which are
driven by a multitude of economic,
environmental and social factors. The
section highlights that a coordinated
whole-of-government approach is
required to address the identified issues
and to ensure that the sustainability
of the natural environment is not
undermined.
The natural environment
55SEQ City Deal | Economic Foundations Paper
The natural environment
55SEQ City Deal | Economic Foundations Paper

Developing resilience to adverse weather eventsIn the past 15 years, South East Queenslanders have
experienced the worst drought in 100 years, followed by the
worst flood in 100 years.49
SEQ’s current climate patterns and coastal population suggest
that the region is particularly prone to adverse weather
events. Prominent scientific research suggests that the
increase in frequency and severity of adverse weather events
is set to continue into the future. For example, the Climate
Council has recently found that:
• The time spent in drought is projected to increase across
Australia. Extreme drought is expected to increase in both
frequency and duration.
• The intensity of extreme rainfall events is projected to
increase across most of Australia.
• The increase in coastal flooding from high sea level events
will become more frequent and more severe as sea levels
continue to rise.50
Adverse weather events have the potential to significant
impact on the region’s communities and economic
infrastructure. This will disrupt economic activity and
threaten the livelihoods (and lives) of the community. For
example, beginning in December 2010, a series of floods in
Queensland were estimated by the Federal Treasury to reduce
coal production by between $4 billion to $5 billion, crop
production by $1 billion, and tourism by $300 million to $400
million.51 Overall, Federal Treasury estimated that the floods
led to Queensland Gross Domestic Product (GDP) growth
being lower in 2010–11 by between an estimated 1/2 to 3/4
of a percentage point.52 In addition to the loss of income and
activity, reconstruction activities required the utilisation of a
significant amount of resources to restore communities and
critical economic infrastructure.
Looking forward, design and maintenance of critical
infrastructure, as well as mitigation and response systems,
that complies with best practice principles of resilience
will help to reduce the impacts from more frequent adverse
weather events.
Reducing greenhouse gas emissions SEQs’ low pollution is offset by its high levels of CO
2
emissions.
SEQ boasts low overall exposure to pollution relative to
international benchmarks due in part to high levels of green
space per capita, and comparatively lower population and
density. On the other hand, while CO₂ emissions have declined
in recent years across many internal cities, emissions per
capita in SEQ remain high relative to international benchmarks
(Figure 28, Figure 29).53 Rises in greenhouse gas emissions
have been strongly correlated with the growth of SEQ’s
population and industry activity. The region’s dispersed
population requires expansive transport and energy related
infrastructure, which are both primarily fueled by non-
renewable fuel sources.54
Looking forward, the Queensland Government has committed
to a 30 percent reduction in greenhouse gas emissions by 2030
as part of a Climate Transition Strategy. A coordinated whole-
of-government approach will help to achieve the structural
change necessary to meet these targets while limiting the level
of economic disruption.
49 Seqwater, Water for Life, South East Queensland’s Water Security Program, 2015–2045, July 201550 Climate Council, Cranking Up the Intensity: Climate Change and Extreme Weather Events, 201751 Australian Government, Treasury, FOI Disclosures, Economic and fiscal impacts of Queensland floods,
available at: https://treasury.gov.au/foi/economic-and-fiscal-impacts-of-the-queensland-floods/52 Ibid53 Moonen T., Nunleyn J. and Clark G., 2017. Benchmarking SEQ in a Global Context 54 The Nous Group and SKM (Sinclair Knight Mertz) 2008, Queensland Marginal Abatement Cost Curve
The natural environment
Figure 28 – CO2 emissions per capita
* All data is at OECD-defined metropolitan scale, except for Cape Town, for which data is presented at the official metropolitan city scaleSource: Moonen T., Nunleyn J. and Clark G., 2017. Benchmarking SEQ in a Global Context
0 5 1510
SE Florida (Miami)
S Holland (Rotterdam)
Metro Vancouver
SEQ
San Diego Region
Hamburg Region
Cape Town Metro
Fukuoka Prefecture
Busan Region
Barcelona Province
56 SEQ City Deal | Economic Foundations Paper

55 Department of Environment and Heritage Protection, 2016 State of Waste and Recycling in Queensland 2015 56 Queensland Government, 2016 Recycling and waste in Queensland57 Seqwater, 2014. South East Queensland’s Water Security Program, 2015–204558 Healthy Land and Water, 2017. Report Card, available at: http://hlw.org.au/report-card
The natural environment
Figure 29 – Exposure to pollution
*Measured manually based on taking weighted averages of key regional centres in each region – see appendix for full details of methodologySource: Moonen T., Nunleyn J. and Clark G., 2017. Benchmarking SEQ in a Global Context
0 20 40 60 8010
Busan Region
Fukuoka Prefecture
Cape Town Metro
S Holland (Rotterdam)
Barcelona Province
Hamburg Region
San Diego County
SEQ
Metro Vancouver
SE Florida (Miami)
PM 10 PM 2.5
30 50 70
Waste disposable managementClose to 75 percent of the headline waste generated across
Queensland is disposed of in SEQ.55
As a product of the region’s sustained growth and
development, both commercial and residential, increased
pressure has been placed on existing waste infrastructure.
This pressure is due to the increased levels of municipal,
commercial, industrial, construction, and demolition waste.
This pressure has been offset to some extent by greater
levels of waste recovery, particularly with paper, glass, and
plastics.56
Continued residential growth will challenge the region’s
waste management processes; both in terms of water and
solid waste. The current absence of a coordinated waste
management strategy represents a risk to the region’s natural
environment, in particular its bay and waterways. Competing
land use requirements, such as urbanisation and agriculture,
will progressively challenge the region’s solid waste disposal
programs.
Improving waste water and catchment management has the
potential to ensure that natural assets are preserved by,
biodiversity is protected, and water quality is maintained.
These all contribute to ensuring that the region’s natural,
tourism and lifestyle values are maintained.
Ensuring water securityWhile the current level of public works infrastructure is
expected to enable the supply of water to meet demand over
the next 10 to 15 years, the quality of inland water ways is
reported to be variable.
SEQ currently enjoys high levels of water security as a result
of ongoing investment in public works infrastructure, the
commitment of the community to keep demand at far lower
than pre-drought levels, and rainfall that has topped up
our water storage dams. Unless the region experiences an
extended drought, only small scale capital works are expected
to be required to continue to meet demand over the next
15 years.57 Whilst there is a good level of water security, cost
of water for industrial and agriculture uses has been identified
as a challenge for the region.
Another critical component of water security is preserving the
quality of inland waterways to ensure they deliver the potential
suite of social and economic benefits to the community. The
Healthy Land and Water Report Card of inland waterways
suggest that the conditions of the rivers within SEQ is highly
variable, with rivers located in proximity to the coast generally
rated as being in ‘excellent’ or ‘good’ condition, while rivers
further inland generally rated ‘poor’ or worse.58 The ongoing
work of the Resilient Rivers Initiative is expected to help
support the health and vibrancy of the inland river system.
Beyond 2030, new water supply options will be needed to
maintain the water security of SEQ which will require a broad
range of resilient water supply, demand and system operating
options to be identified and assessed.
Wivenhoe Dam, Queensland
57SEQ City Deal | Economic Foundations Paper

Maintaining biodiversity Of the 154 regional ecosystems that occur in the region over
60 percent are considered vulnerable or extinct. SEQ supports
324 species considered threatened or near threatened.59
Healthy levels of land-based biodiversity are underpinned
by forests and woodlands, which are vulnerable to the
land-clearing required for economic development and growth.
The statewide Landcover and Trees Study (SLATS) monitors
Queensland’s forests and woodlands to assess vegetation
extent and clearing activities.60 The current total woody
vegetation clearing rate for SEQ is in line with the highest levels
observed since 1988. This has been driven by land clearing
for pasture and forestry purposes, which has coincided with
changes to the Vegetation Management Act which allows the
clearing of native vegetation for high-value agriculture projects
(Figure 30).61
Looking forward, fine tuning the legislative and regulatory
settings within the Vegetation Management Act and the
Environment Offset Framework will help to ensure that
biodiversity is maintained across the region.
59 SEQ Catchments, 2010. Nature Conservation & Biodiversity 60 All clearing in this text refers to the woody vegetation clearing rate which is measured in hectares per year (ha/yr) for each reporting period. Clearing rates
are rounded to the nearest 1000ha/yr and percentages rounded to the nearest whole percentage61 A series of self-assessable codes for landholders to manage clearing in certain areas were also introduced
The natural environment
Figure 30 – The historical level and cause of land covering in SEQ
Source: Department of Science, Information Technology and Innovation, Queensland Government. 2017. Land cover change in Queensland 2015–16: a Statewide Landcover and Trees Study (SLATS) report. DSITI, Brisbane.
Thinning Settlement Pasture Mining Infrastructure Forest Crops
0
5
10
15
20
25
100
0 h
a p
er
yea
r
1988–91
1991–
9519
95–97
1997–
9919
99–2000
2000–01
2001–
0220
02–03
2003–
0420
04–0520
05–06
2006–07
2007–
0820
08–0920
09–10
2010
–11
2011
–12
2012
–1320
13–14
2014
–15
2015
–16
Koala, Queensland
58 SEQ City Deal | Economic Foundations Paper

The following Part 3 identifies the priority
industries with the potential to drive economic
growth as well as the key spatial economic
foundations that will be critical considerations to
unlock this potential.
Priority industries driving growth
Details the five trade oriented (or ‘export’) industry clusters of
the economy that have a high density and value of employment
activity in the region. These industries include:
• advanced manufacturing;
• agribusiness;
• traded health and education;
• transport and communications; and
• tourism and creative.
The impact of global trends on these industry clusters, as well
as the opportunities and risks that these present for each
industry in SEQ, are outlined, in conjunction with the potential
enablers that could support the future growth of these industry
clusters.
The economic foundation of SEQ
Brings together the region’s spatial, infrastructure and
economic characteristics to highlight the corridors, clusters
and growth fronts that will be critical to the achievement of
the region’s aspiration to grow its trade oriented economy. The
investment framework to deliver growth in the traded industry
is also identified.
PART 3 | Economic foundations
Part 3
59SEQ City Deal | Economic Foundations Paper

Priority industries driving growth
Maintaining our vital rural industries
60 SEQ City Deal | Economic Foundations Paper

A focal point for the economic
foundations paper is to identify
priority industries that will
increase the traded (export)
portion of SEQ’s economic
activity. Traded industries are
industries which serve markets
beyond the region in which they
are located. These industries
are typically free to choose
their location of operations,
unless they are dependent on
proximity to natural resources
(for example, mining industries
that locate in close proximity to
resource and mineral deposits),
and as a result tend to be highly
concentrated in areas that afford
them a competitive advantage.
These industries compete in
cross-regional markets and
are consequently exposed to
regional competition. Promoting
the growth and productivity of a
region’s strong traded industries
is often a driving force behind the
prosperity of regional economies.
It is worth noting that while the focus
of this report is on traded industries,
local industries are also important to the
economy as they provide the majority
of employment opportunities. However,
these industries tend to be ‘population
serving’ and, as a result, will usually
occur proportional to population growth
throughout the regions. These industries
are not directly exposed to cross-regional
competition, and, as such, strategic
planning and investment will not derive
the same level of benefit as traded
industries. The remainder of this section
will look at the approach undertaken
in this economic foundations paper to
identify traded industries and the priority
industry clusters for SEQ.
Priority industries driving growth
Priority industries driving growth
61SEQ City Deal | Economic Foundations Paper

Determining priority industry clusters This section provides an overview of the established works
that define the importance of comparative advantages,
industry clusters, and regional clusters of economic activity.
The following three papers have provided the foundation for
developing the approach applied to identify industry clusters
of comparative advantage.
• The Competitive Advantage of Nations (Porter, 1990) –
establishes the importance of competitive advantage
for companies in the comparative advantage of nations.
It explores the competitive advantage links to broader
factors such as government, natural endowments, technical
innovation, and regional economic activity.
• The Economic Performance of Regions (Porter, 2003) –
provides the methodology for identifying comparative
advantage through the estimation of location quotients and
other employment data.
• Defining Clusters of Related Industries (Delgado, Porter,
& Stern, 2014) – provides the methodology for clustering
groups of related industries.
At its core, the theory of comparative advantage refers to the
ability of economic agents (such as firms, regions, nations,
etc.) to more productively produce a good or service relative to
other economic agents. Importantly, in this context, economic
agents tend to export their goods and services where they have
comparative advantage and import where they do not.
The sources of comparative advantage have been examined at
great length, and are influenced by a variety of factors such as
consumer preferences, technology, political context, climate,
skilled labour, natural resources, economies of scale, etc.
These features are generally ascribed to either technologies
or factor endowments. For the purpose of this economic
narrative, the source of potential comparative advantage has
been assessed through the lens of location specific industry
clusters62,63 and supported through engagement with local,
state, and federal government stakeholders and industry.
These two means of attaining comparative advantage have
implications for the SEQ economic narrative. Firstly, where
there are natural endowments occurring, comparative
advantage cannot typically be achieved without the supporting
business and economic environment. This may include the
right policy environment, infrastructure access, access to
capital investment, or other environmental factors. This raises
the question for the broader deal – how can SEQ leverage
the region’s natural endowments to develop comparative
advantages?
Secondly, given the associated links between cluster
economies and technical advancements how can SEQ enable
existing or potential industry clusters in SEQ that may support
future technical advancement?
To answer these questions in the context of the economic
narrative, five priority industry clusters have been selected. The
five priority industry cluster were selected as they are either
currently exhibiting a comparative advantage, are positioned
to achieve a comparative advantage, or have been identified as
being instrumental in facilitating technological advancement.
These five industries are as follows:
• advanced manufacturing;
• agribusiness;
• traded health and education;
• transport and communications; and
• tourism and creative.
These priority industry clusters were tested and confirmed
with SEQ’s local, state, and federal government stakeholders
on 15 June 2017 for Workshop 1, 20 July for Workshop 2 and
over a number of individual meetings.
62 For more information on the analytical approach undertaken see Appendix A – Detailed Technical Note 63 For SEQ’s industry cluster maps see Appendix B – SEQ’s Industry Cluster Maps
Priority industries driving growth
Evolve Skateboards, Gold Coast
62 SEQ City Deal | Economic Foundations Paper

Value by Supply and Use
Utilities and traded wholesale
Transport and communications
Traditional manufacturing
Traded health and education
Tourism and cultural
Retail and local wholesale
Public administration
Primary
Other local services
Local Health and Education
Industrial and construction services
Food and recreation
Finance and professional services
Agriculture
Agribusiness
Advanced manufacturing
Figure 31 – Queensland inter-industry relationship chord diagram
Source: KPMG’s Regional Computable General Equilibrium (KPMG-RCGE).
Determining inter-industry linksTo further understand the role of the priority industry clusters
in SEQ, and the broader state economy, the inter-industry
relationships have been examined for the Queensland
economy using the industry cluster definitions. This provides
greater visibility on the inter-industry relationships, beyond
those contained within the SEQ region’s boundaries.
The inter-industry chord diagrams described below are
intended to demonstrate these relationships. The diagrams,
produced using KPMG-RCGE input-output data, show the
interdependencies of the priority industry clusters to each
other, and other industries, within the Queensland economy.64
It is important to note that these input / output flows only
capture activity that is occurring between the industry clusters
and within the Queensland economy. As such, it does not
account for activity, such as imports and exports, outside of
this region, and also does not directly capture activity that
alights or is destined for consumption within the general
population.65
The inter-industry interdependencies within the Queensland
economy is illustrated in Figure 31 below.
With reference to Figure 31, the coloured industries identify the
input / output flows of traded industries, while the grey colour
identify the local (population serving) industries. Where an
industry’s colour flows from another industry, this represents
the amount of the supply used from the other industry; an
input required to produce the industry’s outputs. For example,
agribusiness (maroon) uses a significant portion of inputs from
agriculture (green) to produce its outputs. This relationship
can be seen by the thick maroon line from agriculture to
agribusiness; the diagram shows that the agriculture industry’s
supply (output) is the most significant output used as an
input in the production of the agribusiness industry’s supply
(output).
The diagram demonstrates the heavy interdependencies
of SEQ’s traded industry clusters, as well as the significant
role that finance and professional services, traditional
manufacturing and industrial and construction services play in
contributing to key supply chains for traded industry clusters.
64 KPMG’s Regional Computable General Equilibrium (KPMG–RCGE) provided current input output data for the Queensland economy to identify the current
inter-industry relationships of the economic narrative’s industry clusters65 For more information refer to Stage 3: Complementary Analysis in Appendix A – Detailed Technical Note
Priority industries driving growth
63SEQ City Deal | Economic Foundations Paper

Determining key spatial locations The choice by inter-dependent industries and businesses to
co-locate already occurs across the region. This is a result
of a desire to reduce input costs associated with transport,
access similar (maximise access to) pools of labour as well as
in recognition of the ease of business and innovation benefits
that come from proximity. Across SEQ, there are a range of
precincts that have emerged through both the choices of
business as well as key zoning and investment decisions by
governments over the course of the region’s development.
These precincts were highlighted in ShapingSEQ as regional
economic clusters of activity (RECs) which are defined as:
“…geographic concentrations of interconnected
businesses, suppliers and associated institutions
(that) result in greater economic activity and are
significant economic drivers.”
ShapingSEQ identifies 16 of these RECs across the region,
including key economic geographies, such as the Capital City
REC that incorporates the Brisbane CBD and surrounds. The
plan also identifies 27 knowledge and technology precincts
across the region, which occur at a much smaller scale than the
RECs (see Figure 32). These are mostly located within the RECs
(e.g. university campuses at Kelvin Grove, St Lucia or Gardens
Point) although seven are located independently of broader
regional scale clusters (i.e. Chermside health and education
precinct, Coomera film and media precinct, or the Gatton
animal sciences precinct).
Appreciating how the businesses within five traded industries
are choosing to locate themselves and their supply chains
across SEQ is important in understanding the role of
infrastructure investment and other policy initiatives to
support growth. Accordingly, this economic foundations paper
highlights the key RECs of greatest significance to each of the
five industries.
Additionally, the following analysis seeks to identify the
corridors that are of greatest economic significance to the
priority industry clusters and the region’s economy. These
corridors are critical considerations to the extent that they
bring key economic activities closer together, as well as
efficiently linking productive precincts with key trade gateways
(e.g. the Port of Brisbane or key airports across the region).
The figures used in the following industry cluster discussion
are focused on the urban areas of SEQ as illustrated in
Figure 33. The focus area has been used to enable the industry
cluster information to be displayed at a clear and legible scale.
This economic foundations paper seeks to provide an
overarching perspective on the spatial clusters and corridors
that are of greatest significance to the traded industry clusters
with the potential to support the next wave of economic growth
in SEQ.
Priority industries driving growth
64 SEQ City Deal | Economic Foundations Paper

Priority industries driving growth
!
o
Ipswich
Capalaba
Beenleigh
Cleveland
Carindale
Chermside
Springwood
Springfield
Indooroopilly
Upper Mt Gravatt
Brisbane
Legend
!
o
International airport
!! Port of Brisbane
P!! Intermodal terminal
kj Knowledge and technology precinct
") Major enterprise and industrial area
!Capital city centre
!( Principal!( Major!! Principal rural!! Major rural
Major roadRailwayWaterbody and waterwayAgricultural landRural activitiesRegional Economic Cluster
Regional land use categoryUrban FootprintRural Living Area
Figure 32 – Examples of Regional Economic Clusters and Knowledge and Technology Precincts in SEQ
Source: Regional and Spatial Planning, Queensland Government. September 2017
Examples of Regional Economic Clusters and Knowledge and Technology Precincts in SEQ
QUT Gardens Point
65SEQ City Deal | Economic Foundations Paper

"
"
"
"
"
"
"
"
"
"
"
"
"
"
"
"
"
"
"
"
"
"
"
"
"
"
"
""
"
"
"
"
"
"
"
"
"
"
"
"
"
"
"
"
Esk
Oakey
Dalby
Noosa
Kyogle
Wondai
Gympie
Casino
Robina
Kilcoy
Boonah
Gatton
Warwick
Ballina
Lismore
Coomera
Nambour
Laidley Ipswich
Kingaroy
Fernvale Brisbane
Inglewood
Byron Bay
Jimboomba
Southport
Cleveland
Caloundra
Beenleigh
Redcliffe
Toowoomba
Kingscliff
Crows Nest
Pittsworth
Chinchilla
Stanthorpe
Beaudesert
Caboolture
Tweed Heads
Springfield
Murwillumbah
Maroochydore
Logan Central
ToowoombaRegional
SomersetRegional
NoosaShire
SunshineCoast
City ofGold CoastScenic Rim
Regional
LoganCity
BrisbaneCity
IpswichCity
Lockyer ValleyRegional
Moreton BayRegional
RedlandCity
LegendLocal government boundaryFocus areaMajor roadRailwayWaterbody and waterway
Regional land use categoryUrban FootprintRural Living Area
Figure 33 – Focus area for industry cluster figures
Source: Regional and Spatial Planning, Queensland Government. September 2017
Focus area for industry cluster figures
Priority industries driving growth
66 SEQ City Deal | Economic Foundations Paper

Solar Farm, Sunshine Coast
Priority industry clusters in SEQ A detailed analysis of each of the five priority industry clusters
is provided below. This analysis provides:
• an overview of the industries which constitute the industry
cluster
• articulation of whether the industry cluster is currently
exhibiting a comparative advantage, positioned to achieve
a comparative advantage, or instrumental in facilitating
technical advancement in SEQ
• key locations and assets relevant to the industry cluster
• the inter-industry links (both inputs and outputs) with other
industry clusters
• the key opportunities and challenges that have the potential
to impact on the future growth of the cluster
• key enablers that have the potential to support the future
growth and performance of the cluster.
Priority industries driving growth
67SEQ City Deal | Economic Foundations Paper

Priority industry overview
Globally, manufacturing markets are being transformed by
advances in technology, a shift towards bespoke goods and
a drive towards a more efficient and sustainable process
and operating models. This change in manufacturing
production incorporates the use of ‘cutting edge’ technology,
expertise and innovation in the delivery of a broad range of
manufacturing activities, from research and development
to full-scale production and distribution. Globalisation and
digitalisation are changing the traditional manufacturing
landscape causing Australia’s historical disadvantages,
such as high labour costs, a small domestic market and
geographical remoteness, to be less important.
Responding to these global trends and the rise of advanced
manufacturing is the focus for both Commonwealth and
Queensland Governments. Both governments have identified
a range of opportunities to ensure that both the country and
state remain competitive in this emerging, high value economy.
Advanced manufacturing has been identified as a priority
industry cluster due to its strategic importance in supporting
economic growth and advancement, particularly in leveraging
advancing technologies for innovation and skill diversification.
Figure 34 provides an overview of the advanced manufacturing
industry cluster in SEQ. Most of the growth in this industry
cluster in SEQ is expected to come from increased global
value chain operations in aerospace and defence, transport,
biofutures, pharmaceuticals and medical technologies,
precision agriculture, renewable energy, scientific instruments,
and mining equipment, technology and services.
Advanced manufacturing
Figure 34 – Advanced manufacturing industry cluster overview
Source: CTT, Queensland Government.
Advanced
manufacturing
SEQ comparative context
• Strong manufacturing base
• Diversified industry cluster
• Government policy and investment
• Existing defence hubs
Key supply industries
• Traditional manufacturing
• Advanced manufacturing
(self contained)
• Finance and professional services
• Transport and communications
• Utilities and traded wholesale
Enablers of economic growth
• Skilled workforce
• Access to technology
• Investment
• Co-location of industries
• Land supply
Industry cluster risks
• Global competition
• Digital security
• Access to capital
• Workforce readiness
• Land availability
Key demand industries
• Advanced manufacturing
• Other local services
• Transport and communications
• Industrial and construction
services
Outputs
• Vehicles and machinery
• Bio-products
• New technologies
Key inputs
• Technology
• Freight and logistics
• Precious metal commodities
• Energy supply
Industry cluster opportunities
• Technology adoption
and innovation
• Defence
• Climate change
• Supportive business
environment
Key demand drivers
• New technologies
• Renewable energy targets
• Productivity targets
Priority industries driving growth
68 SEQ City Deal | Economic Foundations Paper

Advanced manufacturing in SEQ
SEQ’s historical traditional manufacturing base provides the
foundation to support the shift to advanced manufacturing
providing access to established infrastructure and labour
expertise.66 Where other regions have transitioned to more
service based economies, there is typically a notable decline
in manufacturing and loss of manufacturing expertise. This
loss of expertise can lead to skills gaps in the activities of
advanced manufacturing. In contrast, emerging economies
tend to have greater activity in traditional manufacturing, due
to the relatively lower level of expertise required and lack of a
supporting business environment to grow industries such as
advanced manufacturing. SEQ is currently in a unique position,
where there still remains a strong traditional manufacturing
backbone, but also the skilled supporting business
environment to grow advanced manufacturing.
At present, advanced manufacturing is estimated to employ
approximately 23,000 workers within the region. This
represents approximately 1.6 percent of total employment in
SEQ. The closely linked traditional manufacturing industry
supports a further estimated 34,000 workers in the region,
representing approximately 2.3 percent of total employment
in SEQ.
While employment in advanced manufacturing is a relatively
small proportion of total employment in the region, advanced
manufacturing activities generate approximately $134,000
GVA per worker – which is higher compared to the average
Australian worker in this industry elsewhere. The industry’s
relatively higher value activities support its identification
as a priority industry cluster.
In addition to infrastructure and labour expertise, advanced
manufacturing has a diverse base from which to generate
economic activity. The existing business environment
supports access to mature markets (both domestically and
internationally). For example, there is significant demand
for vehicle manufacturing and technology and service
development from both the defence and mining industries
which have a strong presence in Queensland, interstate
and in emerging Southeast Asian markets.
SEQ is a region with an increasing amount of highly innovative
small and medium sized enterprises (SMEs). Australia’s SMEs
are ranked fifth in the OECD for innovation67, making the SMEs
well suited to rapidly adapt to changing and differing customer
demands. Practiced at serving the small domestic market, SEQ
manufacturers are experienced in profitably manufacturing
low volume, niche products.68 In addition, SEQ has a proximity
advantage in supplying advanced manufacturing products to
the mining, agriculture and defence industries in the region.
A key anchor for the advanced manufacturing industry cluster
in SEQ is the defence industry with bases located at:
• RAAF Base (Amberley);
• Gallipoli Barracks (Enoggera);
• Swartz Barracks (Oakey);
• Kokoda Barracks (Canungra);
• Borneo Barracks (Cabarlah, north of Toowoomba);
• Victoria Barracks (Petrie Terrace, Brisbane); and
• Damascus Barracks (Pinkenba).
Advanced manufacturing for the Australian Defence Force
leverages the region’s traditional strengths in heavy vehicle,
truck and bus manufacturing activities. A demonstration
of the region’s land defence, heavy vehicle and advanced
manufacturing capabilities has recently led to Rheinmetall
Defence (one of the world’s leading producers of systems and
equipment for ground, air and naval forces) selecting Brisbane,
along with Townsville, as their preferred locations for its
Australia-New Zealand headquarters and an associated Military
Vehicle Centre of Excellence (MVCE).69
While SEQ has limited energy and resource deposits (e.g.
natural gas) compared to other parts of Queensland, it is
the service centre which can support these activities. The
skilled workers in SEQ support the mining industries by
providing technology, equipment and services. Advanced
manufacturing for the mining equipment, technology and
services (METS) and energy sectors includes the development
and commercialisation of new processes, technologies and
products. Queensland’s unique geography requires locally
developed improvements in technology and innovative
solutions to support the productivity of the mining industry.
The advanced manufacturing industry cluster is central to
unlocking national economic prosperity through its influence
on infrastructure development, job creation, research and
development, export earnings, and flow on impacts to other
industries.
66 Traditional Manufacturing includes metal, glass, cement, paper and pulp, rubber, polymer, textile, and clothing and footwear manufacturing.
Traditional Manufacturing has been defined in line with the methodology in the Technical Note Appendix B67 Hendrickson, L. et al (2014). Australian Innovation System Report 2014, Department of Industry, Commonwealth of Australia, Canberra68 Future Manufacturing Industry Innovation Council (2011). Trends in manufacturing to 2020: A foresighting discussion paper. Canberra69 Rheinmetall Defence. 2017. Rheinmetall selects Queensland for Military Vehicle Centre of Excellence. Accessed 6 September 2017.
https://www.rheinmetall-defence.com
Priority industries driving growth
69SEQ City Deal | Economic Foundations Paper

Priority industries driving growth
Figure 35 – Key industry cluster characteristics – advanced manufacturing
Source: CTT, Queensland Government. Refer Appendix B – Technical Note; University annual reports, 2016; ABS Census, 2016
$134,000GVA per worker
SEQ’s advanced manufacturing workers are more productive than
the typical advanced manufacturing worker in Australia
23,000employed in industry cluster
1.6 percent of total employment in SEQ
Advanced manufacturing Highest level of education attainment, 2016
0.0
0.1
0.2
0.3
0.4
0.5
Bachelor and aboveDiplomas and CertificatesSecondary Education – Years 10 and aboveSecondary Education – Years 9 and below
70 SEQ City Deal | Economic Foundations Paper

Key locations
Advanced manufacturing activities benefit from access to
export gateways and co-location with complimentary activities
such as traditional manufacturing, including polymer, metal
and glass production. Within SEQ, the location of advanced
manufacturing activity has been most dominant in large
designated industrial zones, which often are well connected
to telecommunication and transport infrastructure with
access to export gateways.
The Port of Brisbane, located to the east of Brisbane City, in
the Australia Trade Coast is a key cluster (Australia Trade Coast
REC) which is adjacent to, and well serviced by, the port and
airport respectively (Figure 36).
In addition, there is a corridor of advanced manufacturing
activity from Riverview, Ipswich to Salisbury, and Brisbane.
This area, referred to as the South West Industrial Corridor REC,
supports the co-location of manufacturing businesses and
other industrial uses in one of the region’s most established
industrial precincts which is well serviced by key freight
routes. There is a concentration of advanced manufacturing
activity in the Ipswich REC which is likely due to the location of
Amberley defence base, a key driver of demand for advanced
manufacturing goods. Within the Western Gateway REC, there
is an advanced manufacturing cluster in Toowoomba which is
co-located with the Wellcamp Airport and Business Park.
Through access to freight corridors, the Pacific Highway
corridor south, which includes the Pacific Motorway and
Yatala–Staplyton–Beenleigh, has enabled a corridor of
advanced manufacturing activity. There are additional
advanced manufacturing clusters along this corridor,
particularly Coomera on the Gold Coast.
These established industry cluster areas and corridors are
supported by pockets of emerging activity in areas including
the Lockyer Valley, Sunshine Coast and Moreton Bay (including
Strathpine–Brendale–Petrie and North Lakes–Mango Hill).
The Bromelton SDA, located near Beaudesert in the Scenic
Rim, is an emerging expansion industrial development area.
This development area will allow future growth in advanced
manufacturing activity within the region, and provide
supporting freight and logistics operations.
There are also a number of emerging precincts that will further
support advanced manufacturing activities.
Priority industries driving growth
Aerial of Port of Brisbane
71SEQ City Deal | Economic Foundations Paper

!
o
!
o
!
o
!
o
!
o
!
o
"
"
"
"
"
"
"
"
"
"
"
"
"
"
"
"
"
"
"
"
"
"
"
"
"
"
"
"
"
"
"
"
"
"
"
Esk
Oakey
Noosa
Wondai
Gympie
Robina
Kilcoy
Boonah
Gatton
Warwick
Coomera
Nambour
LaidleyIpswich
Kingaroy
Fernvale Brisbane
Jimboomba
Southport
Cleveland
Caloundra
Beenleigh
Redcliffe
Toowoomba
Kingscliff
Crows Nest
Pittsworth
Beaudesert
Caboolture
Tweed Heads
Springfield
Murwillumbah
Maroochydore
Logan Central
Coolangatta
Legend!
o
International airport
!
o
Defence airbase
!! Port of Brisbane
P!! Intermodal terminal
P!! Future Intermodal terminalMajor roadRailwayFuture road connectionFuture/investigation rail connectionWaterbody and waterwayCity Deals areaRegional Economic Cluster (REC)Advanced manufacturing RECBromelton State Development Area(SDA)
Regional land use categoryUrban FootprintRural Living AreaMajor expansion area
WesternGateway REC
South WestIndustrialCorridor REC
Strathpine-Brendale-Petrie REC
AustraliaTradeCoast REC
Ipswich REC
Yatala-Stapylton-Beenleigh REC
Oakey
Amberley
PacificMotorway REC
BromeltonSDA
Figure 36 – Advanced manufacturing in the SEQ Region
Source: Regional and Spatial Planning, Queensland Government. September 2017.
Advanced manufacturing in the SEQ Region
72 SEQ City Deal | Economic Foundations Paper

Local Healthand Education 9%
Other localservices 13%
Transport andcommunications 6%
Utilitiesand traded wholesale 6%
Other localservices 6% Agribusiness 2%
Primary 7%
Traditional manufacturing 28%
Advancedmanufacturing 21%
Finance andprofessional services 17%
Agriculture 8%
Primary 7%
Traditional manufacturing 7%
Advancedmanufacturing 17%
Transport andcommunications 11%
Finance andprofessional services 4%
Utilities andtraded wholesale 6%
Industrialand construction services 10%
Inputs
Advanced Manufacturing
Outputs
Input industries Output industries
Figure 37 – Advanced manufacturing inter-industry input and output links
Source: CTT, Queensland Government. Refer to Appendix B – Technical Note.
Inter-industry links
The interdependency of advanced manufacturing with other
industry clusters is varied given the diversity of inputs
and outputs of this industry cluster’s intermediate supply
chains. These interactions highlight the interconnectedness
of this industry within the Queensland economy. The key
relationships to other industry clusters is illustrated in
the inter-industry input-output in Figure 37. The advanced
manufacturing industry cluster also significantly supports,
and is supported by, activity within its own industry cluster
(21 percent of inputs and 17 percent of outputs).
The industry cluster’s input activity is further supported
by traditional manufacturing (28 percent) and finance and
professional services (17 percent). Traditional manufacturing
provides a variety of first-stage processing outputs for further
processing using advanced manufacturing techniques. For
example, metal, polymer and glass (outputs from traditional
manufacturing) are further developed into professional and
scientific equipment (outputs from advanced manufacturing).
Finance and professional services contribute to activities
in advanced manufacturing through scientific services,
information technology services, legal and accounting services
for activities such registering of patents and coordination
of medical trails.
The largest users of outputs from the advanced manufacturing
industry cluster include other local services (13 percent),
transport and communications (11 percent), and industrial and
construction services (10 percent). In this context, advanced
manufacturing provides products and services that are utilised
in automotive repair and maintenance, passenger transport,
and heavy engineering and construction (many of which are
local industry clusters).
Advanced manufacturing and its growing role in SEQ’s
economy is also a platform for emerging activities in the
defence sector, including aeronautical engineering, specialised
parts manufacturing and other high value manufacturing
activities. These types of activities are generally observed
within the advanced manufacturing cluster, thus supporting
the large share of input / output of the cluster to itself.
73SEQ City Deal | Economic Foundations Paper

Opportunities
A number of opportunities that have the potential to grow the
advanced manufacturing industry cluster in SEQ are listed
below.
Technology and skills
Technological change provides a significant opportunity to
grow advanced manufacturing. Advances in technology and
greater consumer expectations are changing the industry
composition and output, including the shift from mass
production of goods to bespoke solutions. SEQ is well
positioned to leverage and upskill the works force through
its very strong higher-education sector, characterised by
high education levels and skilled labour. Additionally,
SEQ’s broader manufacturing sector boasts a talent pool of
engineers, technicians and designers who are supported by
world-class research capabilities.
Defence
The expansion of defence facilities in SEQ and throughout
Australia present a significant opportunity for the advanced
manufacturing industry clusters in SEQ, connecting with
the defence locations, to provide the capability to develop,
manufacture, and maintain the products and systems of
the defence sector. Supporting the growth of the already
established advanced manufacturing supply chains in SEQ will
provide secure job opportunities for the region’s workforce as
the economy continues to diversify and integrate a greater use
of technology into advanced manufacturing processes.
Renewable energy
Climate change has seen demand for renewable energy
sources increase significantly. This has supported the
need for environmental preservation and is driving the
need for sustainable manufacturing production and green
technology. Activities in advanced manufacturing have begun
to research and develop new products to enable climate
change adaptation and mitigation, particularly in the form of
biofutures. This advanced manufacturing activity in SEQ will
continue to support adaptation and mitigation advancements
as a primary opportunity for economic growth more generally.
Strong policy focus
Advanced manufacturing activities in SEQ, and Australia more
broadly, benefit from a priority policy focus and commitment by
all tiers of government. The Queensland Government supports
and enables advanced manufacturing to be a key pillar of
the state’s economy. Additionally, the federal government
has committed significant focus to supporting the creating of
‘smart cities’ which includes the growth of knowledge jobs,
and higher order economic activities – of which, advanced
manufacturing is both a fundamental input (for local activities)
and output (for traded activities), connecting with established
global markets.
Opportunity exists to establish government regulations and
policies that support innovation, research and development
to enable the rise of “smart specialisation” to support a shift
from larger vertically integrated organisations to smaller niche
production companies that undertake advanced manufacturing
activities.
Priority industries driving growth
74 SEQ City Deal | Economic Foundations Paper

Priority industries driving growth
Risks and challenges
A number of risks and challenges that have the potential to
impact on the future growth of the advanced manufacturing
industry cluster in SEQ are listed below.
Global competitiveness
As developing economies mature, improving their
manufacturing processes and adoption of technology,
global competition in advanced manufacturing will intensify.
Advanced manufacturing is a well-established driver of
economic activities in other cities globally, and ensuring
that the advanced manufacturing activities undertaken in
an Australian and SEQ context more specifically remains
competitive is an ongoing challenge. Some key challenges
that will restrict SEQ’s competitiveness may include the cost of
labour, skills, regulatory environment and other macro factors.
Access to capital
At present, the advanced manufacturing industry cluster is
dominated by small-to-medium sized enterprises. Emerging
manufacturing technology companies are often considered
risky investments given technology risk, market adoption risk,
long lead times and often significant capital requirements to
establish activities. When there is limited capital investment,
it constrains research and development activities and could
limit future growth of this industry cluster. Creating a policy
environment to support the contribution of venture capital into
advanced manufacturing could be one mechanism that would
unlock greater innovation and increase the size of the industry
cluster.
Workforce adaption
The contribution of advanced manufacturing to the regional
economy is underpinned by innovation and advancing
technologies. Therefore, the workforce needs to be
appropriately skilled to leverage new technologies and adapt
to ongoing technological change within the industry cluster.
Emerging opportunities for growth in advanced manufacturing
may be constrained by a lack of suitably skilled labour.
Land availability
Advanced manufacturing activities require a range of different
land footprints and associated infrastructure due to the
diverse nature of activities. The availability of fit-for-purpose,
large-scale industrial land is a growing challenge in SEQ.
Limited land supply in locations with suitable connectivity to
freight and logistics corridors, as well as digitally enabling
infrastructure, constrains the development of advanced
manufacturing.
Digital security
The rapid change in the digital and technology environment
of businesses has brought about new risk in digital security.
As businesses continue to expand and adopt new technology,
and increasingly go more online, for their day to day business,
industry stakeholders need to be more careful with their
intellectual property. The rise of open source information and
other sharing platforms places a higher risk of technology and
products losing their value. This becomes an even greater risk
when dealing with the products of the defence sector. Any
initiatives that seek to improve cyber security would assist in
mitigating these risks.
75SEQ City Deal | Economic Foundations Paper

Enablers
Enablers of the advanced manufacturing industry cluster will
deliver fit-for-purpose industrial land, and increase research
and development activities, fast uptake of new technologies,
innovation and advancement of new technologies.
Recent investment in Queensland’s advanced manufacturing
industry has been directed at industry growth strategies
including the Advance Queensland Roadmaps.
To encourage the future growth of the industry cluster, and
complement existing initiatives, the key enablers identified
for the advanced manufacturing industry cluster include:
investment, coordination and collaboration, and promotion
and skills. These enablers are further detailed in the table
below.
Land
Appropriate industrial
land
Ensuring that there is suitable availability of suitably zoned, flat, large industrial lots is critically
important to some areas of the sector, with availability of this land constrained in some parts of the
region. Similarly, appropriately located sites close to key demand activities are critical for smaller
footprint, technology-driven businesses.
Infrastructure
Transport connectivity Ensuring that the workforce can access key advanced manufacturing precincts and other
complementary employment opportunities. Effective freight connectivity to markets will be critical.
Human capital
Digital enablement,
capacity and capability
Ensuring that reliable digital infrastructure is in place (including energy and telecommunications),
in key locations and that the workforce is suitability skilled to utilise emerging technologies and
digital opportunities.
Skills and training Establishment of training programs and partnerships with key education and training providers,
and industry to ensure workforce capability keeps pace with advancing technologies and change.
Financial capital
Investment and
incentivisation
Ensuring that there are frameworks and mechanisms to support alternative funding, financing and
investment for advanced manufacturing activities. Establishment of an incentivisation structure
that is targeted at attracting investment, as well as encouraging student participation in advanced
manufacturing education and training.
Policy
Ecosystem support Ensuring that there is a supportive policy framework and investments in a start-up ecosystem will
ensure that new businesses can readily be supported to grow.
Fit-for-purpose facilities
and co-location of like
activities
Establishment of specialised precincts in key locations focused on advanced manufacturing and
complementary economic activities. Enabling advanced manufacturing to locate in areas which
will encourage increased innovation through interactions, sharing of facilities, and exchange of
expertise and knowledge. To enable these outcomes, this industry cluster should be located in
industrial areas with access to freight networks and in knowledge precincts to enable co-location
with university and medical institutions.
Priority industries driving growth
76 SEQ City Deal | Economic Foundations Paper

Priority industries driving growth
Priority industry overview
Across Queensland, and within SEQ in particular, the
agricultural sector has historically been a major contributor
to the region’s economic make-up. This sector will continue to
be of primary importance, with the Queensland Government’s
stated vision of a productive and profitable agriculture,
fisheries and forestry sector.70 Leveraging SEQ’s natural
comparative advantages, this sector offers a key opportunity
for future growth, as demand is set to increase in line with
population growth, both domestically and abroad. In addition,
there is a growing global demand for food and fibre as
affluence in emerging economies drives demand for protein
foods, niche primary products and agricultural scientific
expertise.
Agriculture also provides indirect benefits for communities.
Reservation of agricultural land provides green space near
areas of urban development and improves the amenity of
nearby urban space. There are also opportunities for tourism,
farm stays and other non-urban attractions.
The focus of this economic foundations paper is on a
narrower range of activities within the broader agricultural
sector, referred to as ‘agribusiness’. Agribusiness refers to
the production and first-stage processing (or “value adding”
activities) required to send agricultural goods to market,
noting that other publications often include a much broader
definition.71
Agribusiness
Figure 38 – Agribusiness industry cluster overview
Source: CTT, Queensland Government
Agribusiness
SEQ comparative context
• Sub-tropical climate and
agricultural land availability
• Established resilient supply chains
• Access to domestic and
international markets
Key supply industries
• Agriculture
• Agribusiness (self contained)
• Finance and professional
services
• Transport and communications
• Traditional manufacturing
Enablers of economic growth
• Land availability
• Skilled workforce
• Access to markets
• Population growth
Key demand industries
• Agribusiness (self contained)
• Food and recreation
• Retail and local wholesale
• Tourism and cultural
Outputs
• Processed food and drink
• Sub-tropical fruit and
vegetables
• Pre-prepared ready-to-eat
meals
Key inputs
• Technology
• Freight and logistics
• Pesticides
• Arable land availability
Industry cluster risks
• Next generation of farmers
• Natural disasters
• Perishable produce
• Product quality perception
• Water availability
Industry cluster opportunities
• Recycled water
• Intelligent agriculture
• The rise of Asia
• Improved supply chains
• Robust biosecurity practices
Key demand drivers
• Population growth
• Consumer preferences
• Technology
• Access to markets
70 Department of Agriculture and Fisheries Strategic Plan 2017 – 2021 https://publications.qld.gov.au71 The Australian Government Department of Industry, Innovation and Science (DIIS) definition of agribusiness includes all agriculture activities from on the
farm activity, first-stage processing, equipment manufacturing and leasing, and other support services – see Australia’s Food and Agribusiness sector –
Data Profile (April, 2016). For this economic narrative, analysis of agribusiness refers to the place based first-stage processing, but also considers up and
downstream supply chain activity more broadly as agricultural activity
77SEQ City Deal | Economic Foundations Paper

Defining agribusiness in this way helps to identify the specific
place-based agricultural activity that is occurring in SEQ.
However, given the industry cluster’s reliance on the agriculture
industry cluster, and the significant contribution of agriculture
to SEQ’s (and the broader state and national) economy, this
section will explore both industry clusters. Figure 38 provides
an overview of the agribusiness industry cluster in SEQ.
Agribusiness in SEQ
Agriculture forms the backbone of many of Queensland’s
regional communities, and feeds the growing population
within Queensland, interstate and offshore. This highly
productive supply chain is anchored in the south east corner
of Queensland, where the majority of the agribusiness
(first-stage processing) activities occur at the closest point
to final consumption, through export hubs (such as the Port
of Brisbane) and within the large SEQ population of over
3.4 million.72 This spatial pattern is the result of decades of
population growth and innovation within the sector.
Currently, agribusiness activity in SEQ is estimated to employ
19,900 workers, or 1.4 percent of the workforce, generating
approximately $132,000 GVA per worker in 2016. This activity
links with SEQ’s regional agricultural activity, which employs
a further 18,300 workers, generating approximately $241,600
GVA per worker in 2016. SEQ’s agribusiness industry is more
productive, as measured by GVA per worker, than the typical
agribusiness worker in Australia. The industry cluster’s
productivity supports the identification of agribusiness as a
priority industry cluster for SEQ.
SEQ has high quality sub-tropical agricultural products that
meet the demand of domestic and international markets. The
characteristics of the region provide significant advantages to
the industry, with highly productive soils, sub-tropical climate,
agricultural land, recreational and commercial fisheries,
access markets, established supply chains, processes and
experienced labour. In particular, a strong historical base
in agriculture has led to the development of spatial clusters
of agribusiness activity throughout SEQ. This established
agricultural supply chain provides businesses operating in
SEQ’s agribusiness industry cluster with a basis for competitive
advantage in their target markets, as the mature processes in
the supply chains have reached efficient economies of scale.
While agribusiness has been selected as a priority industry
cluster for SEQ, it is important to acknowledge the related
comparative advantage in agriculture, which is the largest
input into agribusiness activity. Queensland’s agriculture
sector produces $15.54 billion of primary sector commodities
at the farm-gate.73 This is achieved through Queensland’s vast
144 million hectares of land dedicated to agriculture, with
over 30,000 businesses conducting agricultural business
activity.74 The sector exports $9 billion in rural goods, of which
approximately 90 percent of the equivalent trade volume
is dispatched from the Port of Brisbane. This reinforces
the critical role that SEQ plays in the state’s agribusiness
supply chains 75,76 the related comparative advantage in
agriculture, which is the largest input into agribusiness
activity. Queensland’s agriculture sector produces
$15.54 billion of primary sector commodities at the
farm-gate.77 While agricultural land in SEQ is being depleted
for urban development, Queensland has 144 million hectares
of land dedicated to agricultural activity, with over 30,000
businesses conducting agricultural business activity.78 The
sector exports $9 billion in rural goods exports, of which
approximately 70–80 percent of the equivalent trade volume
is dispatched from the Port of Brisbane, demonstrating the
size of the SEQ agribusiness supply chain.79,80
72 Australian Bureau of Statistics, 2016, ABS. 3222.0, Population Projections, Australia, 2012 (base) to 201173 Department of Agriculture and Fisheries (2017), Queensland AgTrends 2016–17 report update April 201774 Department of Agriculture and Fisheries (2017), Queensland AgTrends 2016–17 report update April 201775 Queensland Government Statisticans Office. 2017, “Exports of Queensland goods overseas, June 2017” Accessed September 6,2017
http://www.qgso.qld.gov.au/products/reports/exports-qld-goods-overseas/exports-qld-goods-overseas-201706.pdf76 Australia Bureau of Statistics, 2016, ABS 5368.0, Trade data – exports – port of loading (3-digit SITC revision 3) 2005–06 to 2015–1677 Department of Agriculture and Fisheries (2017), Queensland AgTrends 2016–17 report78 Department of Agriculture and Fisheries (2017), Queensland AgTrends 2016–17 report79 Queensland Government Statisticans Office. 2017, “Exports of Queensland goods overseas, June 2017” Accessed September 6,2017
http://www.qgso.qld.gov.au/products/reports/exports-qld-goods-overseas/exports-qld-goods-overseas-201706.pdf80 Australia Bureau of Statistics, 2016, ABS 5368.0, Trade data – exports – port of loading (3-digit SITC revision 3) 2005–06 to 2015–16
Priority industries driving growth
78 SEQ City Deal | Economic Foundations Paper

81 The University Of Queensland, Queensland Alliance for Agriculture and Food Innovation. 2017. QAAFI research centres. Accessed 18 July 2017.
https://qaafi.uq.edu.au/research82 The University Of Queensland. 2017. Queensland-led team develops effective economical Ebola treatment. Accessed 18 July 2017.
https://www.uq.edu.au/news/
Priority industries driving growth
The agribusiness’ first-stage processing activity occurring
in SEQ is a key component of the agricultural supply chain.
SEQ’s population size is one of the determining factors in the
decision for this agribusiness activity to occur in the region.
The local population serves as a major market, with over
3.4 million people to feed. The other key factor is the region’s
strong links to global markets via access through the Port of
Brisbane and the four major airports throughout SEQ. This
location-based activity is supported by established agricultural
supply chains that link SEQ’s agricultural production areas
to market.
Technological advancement has increased the efficiency and
resilience of SEQ’s agribusiness industries. This has been
observed with new innovation occurring on the input side
(through the use of drones in crop management) through to
disaster and flood resistance planning, allowing for a much
more flexible supply chain. The historical strengths in this
sector have attracted significant investment and led to the
development of world-class institutions throughout the SEQ,
such as the University of Queensland’s Alliance for Agriculture
and Food Innovation (QAAFI) research centres81. These
institutions have brought with them new ways of thinking
to address the challenges and opportunities in the region’s
economy.
Notably, innovation, within both the agribusiness and
agriculture industry clusters, has supported the realisation of
economies of scale in agricultural production. The introduction
of technology, such as the increasing use of drones in
monitoring pests and diseases, has reduced production
costs and increased agricultural yields. Furthermore, the links
between research and agriculture have contributed to the
development of an effective treatment for Ebola, using horse
antibodies.82 This demonstrates the benefits of having strong
collaboration across industry clusters.
Building on SEQ’s longstanding agricultural
industry, the opportunities in agribusiness are in
abundance.
Agribusiness, Gatton
79SEQ City Deal | Economic Foundations Paper

Key locations
In SEQ, agribusiness activity has clustered in locations
with close proximity to agricultural areas and final markets
where there is fit-for-purpose industrial land with access to
freight networks. Where the agribusiness clusters in rural
areas, it is typical to efficiently move products to final points
of consumption through road and rail networks, and export
hubs. These rural agribusiness clusters are primarily located
around the periphery of SEQ, including Lockyer Valley,
Somerset, Toowoomba and Scenic Rim local government
areas. These areas draw in inputs from agricultural land
within SEQ and outside the region as illustrated in
Figure 19. In Lockyer Valley, there is a key cluster of
agribusiness associated with the Gatton university campus,
which is a result of strategic planning from the QAAFI.
In addition, there are clusters of agribusiness industry activity
within SEQ’s urban industrial areas. These urban clusters are
located within the Ipswich, South West Industrial Corridor,
Australia Trade Coast and Western Gateway RECs. These
RECs are located centrally to access freight networks,
co-located with other industries and consist of fit-for-purpose
industrial land. This co-location of activity has occurred as
the industries draw from similar labour forces, sharing skills,
infrastructure and freight paths to final markets.
Priority industries driving growth
Figure 39 – Key industry cluster characteristics – agribusiness
Source: CTT, Queensland Government. Refer Appendix B – Technical Note; University annual reports, 2016; ABS Census, 2016
$132,000 GVA per worker
SEQ’s agribusiness workers are more productive than
the typical agribusiness worker in Australia
18,300 employed in industry cluster
1.5 percent of employment in SEQ
Agribusiness
Highest level of education attainment, 2016
0.0
0.1
0.2
0.3
0.4
0.5
Bachelor and aboveDiplomas and CertificatesSecondary Education – Years 10 and aboveSecondary Education – Years 9 and below
80 SEQ City Deal | Economic Foundations Paper

Priority industries driving growth
!
o
!
o
!
o
!
o
"
"
"
"
"
"
"
"
"
"
"
"
"
"
"
"
"
"
"
"
"
"
"
"
"
"
"
"
"
"
"
"
"
"
"
Esk
Oakey
Noosa
Wondai
Gympie
Robina
Kilcoy
Boonah
Gatton
Warwick
Coomera
Nambour
LaidleyIpswich
Kingaroy
Fernvale Brisbane
Jimboomba
Southport
Cleveland
Caloundra
Beenleigh
Redcliffe
Toowoomba
Kingscliff
Crows Nest
Pittsworth
Beaudesert
Caboolture
Tweed Heads
Springfield
Murwillumbah
Maroochydore
Logan Central
Coolangatta
Legend!
o
International airport
!! Port of Brisbane
Major roadRailwayWaterbody and waterwayCity Deals areaAgricultural landRegional Economic Cluster (REC)Agribusiness REC
Regional land use categoryUrban FootprintRural Living AreaMajor expansion area
AustraliaTradeCoastREC
South WestIndustrialCorridor REC
Ipswich REC
WesternGateway REC
Figure 40 – Agribusiness in the SEQ region
Source: Regional and Spatial Planning, Queensland Government. September 2017
Agribusiness in the SEQ region
81SEQ City Deal | Economic Foundations Paper

Inter-industry links
The interdependency of agribusiness with other industry
clusters is important when considering how to enable future
growth. The key relationships to other industry clusters are
illustrated in Figure 41. Primarily, the agribusiness industry
cluster is supported by the outputs of the agriculture
cluster, with over 57 percent of its total inputs sourced from
agriculture. This dependency demonstrates the inherent
reliance on agriculture in production, and the reliance on the
agribusiness industry cluster as the “value add” component of
agriculture in its first-stage processing.
Secondly, the agribusiness cluster is supported by
activity within the industry cluster itself (agribusiness to
agribusiness) with just over 17 percent demonstrating the
strong inter-linkages of agribusiness activities. This is
again evident in the large amount of outputs destined for
agribusiness activity contained in the industry cluster
(29 percent of agribusiness output is destined for
agribusiness).
The local food and retail industry cluster is the next largest
receiver of output from the agribusiness industry cluster
(27 percent). This local cluster relies on outputs of agribusiness
activity in the production of its retail consumer food products.
The third largest consumer of agribusiness activity is the
retail and recreation cluster (12 percent). These two local,
population serving, industry clusters demonstrate the link
between population and demand for agricultural products. As
the population continues to grow, so too will the demand for
agricultural products.
Given agriculture’s large share of the agribusiness
inter-industry input structure, it is valuable to identify the
interdependencies of agriculture with other industries.
Agriculture relies primarily on activities within its own cluster
(32 percent of agriculture’s inputs come from agriculture
activity), for example, the use of grains in the production of
livestock. Furthermore, agriculture is supported by activity
in the advanced manufacturing cluster (12 percent), for
pesticides and heavy machinery, as well as activities in the
finance and professional services cluster (14 percent). The
broader agribusiness and agriculture clusters demonstrate how
important the agriculture sector is for SEQ, and more broadly,
Queensland economy.
Local Healthand Education 5%
Agribusiness 17%
Utilitiesand traded wholesale 3%
Other localservices 4%
Agribusiness 29%
Agriculture 57%
Finance and professional services 6%
Traditional manufacturing 5%
Agriculture 3%
Traditional manufacturing 3%
Tourism and cultural 3%
Retail and local wholesale 12%
Food andrecreation 27%
Utilities andtraded wholesale 4%
Industrialand construction services 10%
Transport andcommunications 3%
Inputs
Agribusiness
Outputs
Input industries Output industries
Figure 41 – Agribusiness inter-industry input and output links
Source: CTT, Queensland Government. Refer to Appendix B – Technical Note
Priority industries driving growth
82 SEQ City Deal | Economic Foundations Paper

Priority industries driving growth
Opportunities
Opportunities that have the potential to grow the agribusiness
industry cluster in SEQ are listed below.
The rise of the Asia-Pacific region
SEQ is located on the door step of the world’s fastest growing
region, the Asia-Pacific region.
The increasing affluence of Asia’s growing population will drive
demand for Queensland’s quality agricultural produce. This
ongoing demographic trend is driving the shift in consumer
preferences towards quality products, and Queensland has
established a ‘clean and green’ brand for its produce that is
driving demand in the Asia-Pacific region in particular. These
new market conditions will increase demand for a greater
variety and supply of quality agricultural produce.
SEQ’s sub-tropical climate, proximity to Asia and existing
supply chains provide a significant opportunity to the
agribusiness industry cluster to meet this demand. This will
become increasingly evident as the effects of recent free trade
agreements (with China, Japan, Korea and other Trans-Pacific
Partnership countries) are realised and historical barriers to
trade are reduced.83
Intelligent agriculture
SEQ is home to Queensland’s agriculture intellectual base
in the region’s traded health and education clusters and
working with agriculture and agribusiness industry clusters.
SEQ agricultural producers are linking with researchers,
entrepreneurs and other businesses to develop new processes,
products, and technologies to support the growth of the
agriculture sector. Beyond improving the direct activities of
agribusiness, there are opportunities to commercialise some of
these developments into broader offerings, such as “agtech”
and agricultural education.
Improved supply chains
Improving supply chain efficiencies would significantly
improve the productive output of the agribusiness industry
cluster. There are opportunities to achieve this through better
utilisation of existing assets, last mile links to port by rail
and big data analytics (to better manage distribution). These
opportunities can contribute to a fully-integrated, transparent
and streamlined agricultural supply chain to reduce the
industry cluster‘s total input costs.
Robust biosecurity practices
Australian and Queensland biosecurity laws protect the
state’s ecosystem. These strict biosecurity practices ensure
that agriculture products exported from (and imported into)
Queensland are monitored and inspected for compliance
with food safety standards. As consumers become better
informed about the quality of products they buy, there will
likely be greater emphasis placed on the quality of agricultural
produce. SEQ is well positioned to meet changing consumer
preferences as a result of the region’s regulatory environment.
However, producers will be challenged as to how best to inform
consumers of the region’s quality produce.
Water
As SEQ’s population continues to grow, so too will the demand
for water. As pressure on bulk water supply increases, there
will be increasing demand for alternative water sources,
such as recycled water. Providing agricultural areas access to
recycled water has the potential to support the agriculture and
agribusiness industry clusters realise significant economies
of scale. In particular, the use of recycled water in agriculture
production could significantly improve the productivity of the
industry cluster. Using recycled water in agricultural areas
would relieve the pressure on bulk water supply, enabling it to
be redirected to support emerging residential areas. Currently,
realising this opportunity is constrained by the high cost
barrier, which if incurred solely by agricultural producers would
detrimentally impact the productivity of the industry. It is likely
that any significant improvement in productivity through the
use of recycled water would require government assistance or
subsidies to producers.
83 Australian Government, Department of Foreign Affairs and Trade. 2017. Status of FTA negotiations. Accessed 18 July 2017.http://dfat.gov.au/trade/
agreements/Pages/status-of-fta-negotiations.aspx
83SEQ City Deal | Economic Foundations Paper

Risks and challenges
A number of risks and challenges that have the potential
to impact on the future growth of the agribusiness industry
cluster in SEQ are listed below.
Competition
Australia’s agricultural sector faces competition from other
international agricultural producers. Agricultural exporters
such as Brazil have established market control in Southeast
Asia as a major exporter to China. Queensland’s agriculture
sector will need to demonstrate its point of difference to the
global market to ensure it maintains its market share. Improved
access to markets and reduced barriers to trade will also assist
in ensuring the sector’s long-term performance.
Macro-economic impacts
Geopolitical tensions, supply and demand shocks, technology
changes, and exchange rate fluctuations, among other
macroeconomic conditions, will impact the demand for SEQ’s
agricultural products. While the SEQ agribusiness industry
cluster has little influence over these macroeconomic and
geopolitical events, there are mechanisms that could be put
in place to make the cluster more flexible in dealing with such
shocks.
The next generation of farmers
Demographic shifts, innovation in farming practices, and
the rise of new agriculture industries have transformed
the traditional expectation of the “family farm”. The next
generation of potential farmers are gravitating towards urban
centres to attend the university and build their careers away
from agriculture, resulting a decline of the “family farm”. This
trend will put significant pressure on the future performance of
regional economies. Putting succession plans in place, along
with career pathways to attract the next generation of farmers,
will be critical to ensure that generational knowledge is not lost
and the sector can maintain its competitiveness.
Urban sprawl
Land availability is one of the primary enablers of agricultural
activity, including land associated with fisheries and other
aquaculture activities. As densification and urban sprawl in
SEQ has already significantly reduced the amount of productive
land available to agriculture and aquaculture production and
agribusiness activity, retention of agricultural land will become
increasingly important. Consideration of further trade-off
between agriculture and residential land use will need to be
weighed against the value of arable land to the SEQ economy.
In addition, protection of natural resources for recreational and
commercial fisheries will be needed to protect aquacultural
activities. This in turn will help to preserve water resources for
urban and agricultural use and add to the amenity of urban
areas.
Natural disaster resilience
The agricultural sector’s exposure to weather conditions and
natural disasters exposes it to volatile market conditions.
Drought, cyclones, and other extreme weather events have the
potential to wipe out entire crops, significantly impacting the
output of the sector, which as a result causes global prices to
fluctuate due to changes in supply and demand. The impacts
of these events were recently seen in the wake of Tropical
Cyclone Debbie. While the local agribusiness industry cluster
is one of the most resilient in the broader Asia-Pacific region,
improving local resilience mechanisms could make the sector
and industry clusters more proactive. There is also potential
to bring this capability to the global market as an emergency
response and resilience educational offering, linking with the
region’s traded health and education industry clusters.
Priority industries driving growth
84 SEQ City Deal | Economic Foundations Paper

Priority industries driving growth
Enablers
Enablers of the agribusiness industry cluster are initiatives
which encourage growth by reducing input costs, encouraging
innovation and improving productivity. Recent initiatives to
enable this industry cluster have included better connecting
production centres to markets, and negotiating free
trade agreements with key Asia-Pacific trading partners.
To encourage future growth of the industry cluster, and
complement existing initiatives, the key enablers identified for
the agribusiness industry cluster include skills, infrastructure,
regulation, and coordination and collaboration. These enablers
are further detailed in the table below.
Land
Land protection Critical to industry growth is ensuring protection of good quality land for agriculture and
aquaculture, as well as maintaining appropriate planning controls to facilitate a balance between
value-adding agribusiness activities and urban encroachment.
Infrastructure
Improved links to export
hubs
Prioritising initiatives that improve the industry cluster’s access to export hubs will support
the ongoing competitiveness of the broader sector. This includes transport and intermodal
investments to improve the efficiency of freight movements and reduce costs to the supplier.
Recycled water Allocating recycled water to agriculture use is a significant potential enabler for agribusiness. The
allocation of recycled water to agriculture could support large increases in production capacity for
some of SEQ’s high value agricultural produce, such as sub-tropical fruits. It is likely that provision
of recycled water would require Government funding.
Water infrastructure Water infrastructure is a key enabler in the production of agricultural produce and directly relates
to the sector’s output scalability (the more water available, the more agriculture outputs that can
be produced). A water solution would require development of a viable solution for government and
industry. Prioritising initiatives that support access to, and provide greater quantities of, water to
the agriculture sector will enable future growth.
Information
Central agriculture data
source
Improving the visibility of data and reporting in the agriculture sector would greatly assist future
planning for growth. This may be achieved through active stakeholder participation (government,
producers, and other supply chain agents) to arrive at new and innovative ways to manage the
sector’s produce and supply chains.
Human capital
Agriculture career
pathways
Working with educational providers to develop modernised career pathways for agribusiness
would be beneficial to support innovation and future job growth in the agriculture sector.
A regional hub for
agriculture skills and
innovation
Connecting regional agricultural skills with a regional knowledge hub would provide a location for
agglomeration of skills between these two sectors to occur, for example, establishing a cluster
precinct similar to a Brisbane Technology Park or linking business with existing universities, such
as the QAAFI, to establish a niche service (University of Queensland Gatton and agricultural water
management).
Policy
Expansion of trade policy Maintaining and expanding Australia’s trade access policies and regulations, as well as
strengthening bio-security initiatives, will be critical to the future of regional agribusiness exports.
85SEQ City Deal | Economic Foundations Paper

Traded health and education
Priority industry overview
Traded health and education is one of SEQ’s most strategic
priority industries due to its links to knowledge intensive
industries and spillover benefits. This industry cluster drives
innovation, enables collaboration with industry, builds a
stronger economy and improves the skills of the workforce. In
dollar terms, research from the Australian Bureau of Statistics
(ABS) reported that international education and training
contributed $3.25 billion in export revenue to the Queensland
economy in 2016.84
Growing the traded health and education industry cluster
enhances SEQ’s global relationships, enriches communities,
facilitates international linkages, creates global business
networks and enhances the region’s reputation for research
and innovation.
The traded health and education industry cluster encompass
activities typically found in knowledge precincts. These include
integrated locations for education, research, knowledge
creation and the commercialisation of newly developed
research and technologies. Tertiary education makes up
the greatest portion of this industry cluster, but the health
component also includes pathology and diagnostic services,
which share skills and other resources with the research of
education institutions.
Strong educational institutions are also critical in terms of
their ability to create innovation and agglomeration spillovers,
typically in the form of knowledge sharing, to companies
and related industries, which has the potential to catalyse
technological advancement. This unique characteristic of
knowledge precincts places it as a key enabler of future
economic growth, through the use of research and innovation
agendas in achieving sustained economic comparative
advantages. Figure 42 provides an overview of the traded
health and education industry cluster in SEQ.
Figure 42 – Traded health and education industry cluster overview
Source: CTT, Queensland Government
Traded health and education
Key supply industries
• Finance and professional
services
• Other local services
• Advanced manufacturing
• Transport and communications
• Utilities and traded wholesale
Key demand industries
• Finance and professional
services
• Local health and education
• Other local services
• Public administration
Outputs
• Tertiary education
• Research and development
• Pathology
Enablers of economic growth
• Government policy
• Research and development
• Population growth
• Reputation
• Collaboration
Industry cluster risks
• Politics and perception
• Retention
• Visa changes
• Competition
Industry cluster opportunities
• The growth of the Asian middle
class
• Technology
• Government commitment
• Strong university presence
• Inter-industry collaboration
SEQ comparative context
• Established world class institutes
• Access to markets
• Government commitment
• Population
Key inputs
• New industry
• Population growth
• Technology
• Research and development
Key demand drivers
• Population growth
• International students
• Educational reputation
• Research and development
84 Australian Bureau of Statistics’ 2016 publication International Trade in Services
Priority industries driving growth
86 SEQ City Deal | Economic Foundations Paper

Priority industries driving growth
Health and education in SEQ
The health and education industry cluster has been identified
as a priority industry cluster as it is a key economic enabler.
The continued rise of Asia’s middle class underpins the
increasing demand for SEQ’s quality tertiary education.
Furthermore, the increase in international education generates
indirect benefits in terms of visitor expenditure, as friends and
relatives of international students visit the region.
Traded health and education is estimated to employ over
46,500, or 3.2 percent, of workers within SEQ, generating
approximately $86,000 of GVA per worker in 2016. This
economic activity is driven by clusters of industry activity
around SEQ’s core knowledge precincts, particularly in the
central areas of Brisbane, Toowoomba, Sunshine Coast
and Gold Coast. The traded health and education industry
cluster has lower GVA per worker compared to the Australian
worker in the same industry cluster. Through improvements
to productivity, there is opportunity to increase the GVA per
worker in SEQ to increase economic output of this industry
cluster.
International education and training is projected to maintain
strong growth. Population growth in the Asia-Pacific region is
expected to drive the current world population of 7.6 billion to
reach 8.6 billion in 2030.85 This population growth, along with
the growing affluence of the Asian middle class, provides the
opportunity to expand SEQ’s international education market
share. Currently, forecasts expect SEQ enrolments to grow by
33 percent over the next decade.86
As an enabler, the activity within knowledge hubs will continue
to provide the capacity to maintain a highly skilled workforce
and provide a platform for collaboration, innovation and
technological leadership within SEQ’s other priority industry
clusters.
Providing quality education and training underpins the
capability and capacity of the workforce improving the
region’s human capital. This allows the workforce to engage
in more productive, higher value adding, activities within the
economy. This type of activity improves the overall economic
performance and prosperity of the region, and serves to attract
new talent, as the region’s universities become more reputable
sources of innovative activity. For SEQ, precincts will need
to ensure their service offering integrates and collaborates
well with local industries, to provide a service offering that is
unique to the domestic and international markets.
In addition, the health and education industry clusters
are important places for enabling economic activity where
education, research, hospital and business activities are
all co-located. The close proximity of these activities in a
location generates spillover benefits. These benefits occur
from social interactions which generate learning opportunities
that enhance innovation and productivity.87 Industry specific
research and development can lead to productivity benefits
through the commercialisation of research. Therefore,
improved linkages between education, research, and business
activities is a key enabler in the growth for the region’s
knowledge base. Importantly, precincts should seek to
develop their unique strengths, rather than compete, in order
to support local traded industry clusters in bringing the right
service offerings to domestic and international markets.
While SEQ already has a wealth of educational anchor
institutions, there is scope to improve the translation of
research into commercial activities. Many of the region’s health
and education precincts have made major breakthroughs in
research and development, however this does not always
translate into new local commercial opportunities. Policy
settings that incentivise research, as well as the competitive
pressures of international supply chains in international
manufacturing, have seen large portions of the developed
products produced overseas.
85 United Nations. 2017. World Population Prospects: The 2017. Accessed 18 July 2017. http://www.un.org/ 86 Australian Bureau of Statistics. 2017. Australian National Accounts: State Accounts, 2015–16, cat. no. 5220.087 Katz, B. and Wagner, J. 2014. The Rise of Innovation Districts. Brookings Institute
87SEQ City Deal | Economic Foundations Paper

Priority industries driving growth
Figure 43 – Key industry cluster characteristics – traded health and education
Source: CTT, Queensland Government. Refer Appendix B – Technical Note; University annual reports, 2016; ABS Census, 2016
$86,000 GVA per worker
SEQ’s traded health and education workers are slightly less productive
than the typical traded health and education worker in Australia
46,500 employed in industry cluster
3.2 percent of employment in SEQ
Traded health and education
Highest level of education attainment, 2016
Bachelor and aboveDiplomas and CertificatesSecondary Education – Years 10 and aboveSecondary Education – Years 9 and below
0.0
0.1
0.2
0.3
0.4
0.5
0.6
0.7
0.8
88 SEQ City Deal | Economic Foundations Paper

Key locations
The health and education industry cluster is located in a
number of well-established spatial clusters within SEQ as
investment has been intrinsically linked to locations where
population growth has occurred. The clusters of education
and / or medical institutions in SEQ are identified in
ShapingSEQ’s knowledge and technology precincts which
are identified in Figure 42. The dominant spatial clusters
for health and education in the region include Capital City,
Southport–Broadbeach, Kawana, and Western Gateway
Emerging clusters of health and education industry
activity have been established in more recent urban areas
within SEQ, for example, the Springfield Health City which
envisions the establishment of a large tradeable health
industry development in the expansion site of Springfield
(K16 in Figure 44). The Meadowbrook–Loganholme and
Strathpine–Brendale–Petrie RECs are emerging traded health
and education industry clusters (K19 and K11 in Figure 44).
Meadowbrook–Loganholme has the opportunity to mature the
existing health and education industries in this precinct.
This trend demonstrates that strong population growth around
strategic centres continues to be the focus of investment into
established and emerging health and educational institutions.
These existing investments will continue to support population
growth, and serve to attract new talent into the fields of
health and education, but with a more strategic approach to
integrating with cluster activities.
Overall, the distribution of clusters across SEQ illustrates the
concentration of related activity occurring around the nine
universities, hospitals and co-located businesses with good
access to transport networks.
Sunshine Coast University Hospital
Priority industries driving growth
89SEQ City Deal | Economic Foundations Paper

!
o
!
o
!
o
!
o
!
o
!
o
!
o
!
o
"
"
"
"
"
"
"
"
"
"
"
"
"
"
"
"
"
"
"
"
"
"
"
"
"
"
"
"
"
"
"
"
"
"
"
kj
kj
kj
kj
kj
kj
kj
kj
kj
kj
kj
kj
kj
kj
kj
kj
kj
kjkj
kj
kj
kj
kj
kj
kjEsk
Oakey
Noosa
Wondai
Gympie
Robina
Kilcoy
Boonah
Gatton
Warwick
Nambour
LaidleyIpswich
Kingaroy
Fernvale
Jimboomba
Southport
Caloundra
Beenleigh
Toowoomba
Kingscliff
Crows Nest
Pittsworth
Beaudesert
Caboolture
Tweed Heads
Springfield
Murwillumbah
Maroochydore
Logan Central
Coolangatta
Redcliffe
Cleveland
Brisbane
Coomera
K5K8
K1K6
K9
K2
K27
K26
K25
K11
K15
K13
K19K16
K17
K24
K22
K20
K23
K12
K18
Legend!
o
International airport!! Port of Brisbanekj Knowledge and technology precinct
Major roadRailwayWaterbody and waterwayCity Deals areaRegional Economic Cluster (REC)Traded health and education REC
Regional land use categoryUrban FootprintRural Living AreaMajor expansion area
!
o
!
o
"
kj
kj
kj
kj
kj
kj
kj
kj
kj
kjK5
K3
K8
K4
K1
K6
K9
K20
K2
K7
Brisbane
Inset
See inset
Capital City REC
Southport-Broadbeach REC
K1K2K3K4K5K6K7K8K9K11K12K13K14
K15K16K17K18K19K20K22K23K24K25K26K27
AuchenflowerDutton Park/BurandaGardens PointHerstonKelvin GroveSt LuciaSouth BrisbaneAustralia TradeCoastNathan/Coopers PlainsPetrieSouthportRobina/Varsity LakesCoolangatta
ToowoombaSpringfieldIpswichKawana WatersMeadowbrookChermsideCoomeraGattonSippy DownsClevelandCabooltureRedcliffe
Kawana REC
Figure 44 – Traded health and education in SEQ
Source: Regional and Spatial Planning, Queensland Government. September 2017
Traded health and education in SEQ
Priority industries driving growth
90 SEQ City Deal | Economic Foundations Paper

Inter-industry links
Traded health and education is a key intermediary in
facilitating business-to-business research and collaboration.
This type of activity improves businesses’ access to
research facilities and new technologies, providing a place
for cross-coordination and new development and innovation.
In this situation, the inter-dependencies of this activity are
observed through the co-location of businesses, research
institutes and education providers. The inter-industry links of
traded health and education are demonstrated in Figure 45.
The health and education industry cluster has significant
input from the financial and professional services industry
cluster (26 percent of total inter-industry input), including
business administration, legal and financial, and insurance.
This relationship between the two industry clusters is spatially
visible in the co-location of these industries in Brisbane, Gold
Coast and Sunshine Coast CBDs.
The industry also has significant inputs from various other
clusters, including other local services (18 percent) and
advanced manufacturing (11 percent) which includes activities
such as biomedical, pre-clinical and early phase clinical
trials, pharmaceuticals, medical devices, vaccines, in vitro
diagnostics, and biopharmaceuticals. Other large inputs are
provided by transport and communications (10 percent), and
utilities and traded wholesale (9 percent).
The health and education industry cluster has the opportunity
to grow by increasing productivity in these key input industry
clusters. This productivity can be achieved by improving the
connections between health and education and financial
and professional services, other local services and advanced
manufacturing. Agglomeration of these industries in knowledge
precincts is a means of creating physical connectedness which
improves the transfer of information, improving products and
productivity of traded health and education.
The traded health and education priority industry clusters
also support the finance and professional services cluster
(25 percent of total inter-industry outputs). This is followed by
local health and education industry cluster (15 percent) through
shared service offerings, such as school education, hospitals,
and residential care services. The other major users of traded
health and education activities include other local services
(10 percent), public administration (8 percent), utilities and
traded wholesale (7 percent), and traded health and education
(7 percent).
The below diagram highlights the importance of co-location
of traded education and health industry cluster activities
with finance and professional services, as well as advanced
manufacturing and transport. The diversity of inputs and
outputs also highlights the significance of cross-sectoral
collaboration through co-location.
Local Healthand Education 15%
Other localservices 10%
Traded healthand education 3%
Other localservices 18%
Agribusiness 3% Traditional manufacturing 6%
Traditional manufacturing 4%
Advancedmanufacturing 11%
Transport andcommunications 10%
Publicadministration 4%
Publicadministration 8%
Finance andprofessional services 26%
Finance andprofessional services 25%
Local Healthand Education 2%
Transport andcommunications 7%
Traded healthand education 7%
Utilities andtraded wholesale 6%
Industrialand construction services 4%
Utilities andtraded wholesale 9%
Inputs
Traded health and education
Outputs
Input industries Output industries
Figure 45 – Traded health and education inter-industry input and output links
Source: CTT, Queensland Government. Refer to Appendix B – Technical Note
Priority industries driving growth
91SEQ City Deal | Economic Foundations Paper

Opportunities
A number of opportunities that have the potential to grow the
traded health and education industry cluster in SEQ are listed
below.
The growth of the Asian middle class
Rapid population and economic growth in India and the Asia-
Pacific region is anticipated to increase demand for Australian
onshore international student enrolments. Ensuring that SEQ’s
educational offer meets the expectations of this market can
generate significant economic benefits, beyond those directly
observed in the traded health and education cluster (such as
tourism).
Technology
Technological advances will enable remote or online education
and research (a supply-side shift). This will provide the
localised SEQ industry cluster with greater access to a much
larger, and relatively untapped, market via online education
and training.
A demonstrated government commitment to innovation
Governments are committed to enabling and enhancing
SEQ’s health and education industries, including targeted
infrastructure and investment, to support collaboration in multi
disciplinary health research and innovation.
World class universities and training institutions
SEQ is home to a number of world class universities with
major campuses located in Brisbane, the Gold Coast, and the
Sunshine Coast. The universities in SEQ include Queensland
University of Technology, the University of Queensland,
Griffith University, Bond University, Southern Cross University,
University of Southern Queensland and the University of
Sunshine Coast. Curriculum strengths include agriculture,
biological and environmental sciences, psychology, and
health care.88
Inter-industry collaboration
Better linking the research and development activities
with SEQ’s other priority industry clusters can enable
future economic growth. This can be achieved through
new innovations leading to productivity benefits, through
knowledge spillover activities between industry and
educational institutions.
88 Queensland Government. 2017. ‘Study Queensland’. Accessed 18 July 2017. http://www.studyqueensland.qld.gov.au/
Priority industries driving growth
92 SEQ City Deal | Economic Foundations Paper

89 https://theconversation.com/lost-international-student-enrolments-may-cost-australia-billions-2199
Sunshine Coast University
Risks and challenges
A number of risks and challenges that have the potential
to impact on the future growth of the traded health and
education industry cluster in SEQ are listed below.
Politics and perception
Political stability and community acceptance of international
students impacts on a prospective student’s decision to
choose a particular location. An observed drop in international
student numbers has been seen when there is poor community
acceptance.89 It is therefore important to ensure there are
positive perceptions of international students.
Visa changes impacting attraction and retention.
Changes to the Australian visa system creates uncertainty for
international students and skilled labour when choosing to
come to Australia to study or work. The recent cut-backs to the
visa system will limit the ability of skilled workers in health
and education to enter and / or gain permanent residency. This
could compound a shortage of academic staff (researchers,
teachers and lecturers), doctors and nurses.
This uncertainty impacts international students when
considering to study abroad can result in a decline in
enrolments. Whilst changes may not relate to student visas,
international students may consider future visa options as
part of their decision making when choosing an international
location.
Competition
University competition for students will be unrelenting,
and health and innovation precincts that are on the rise
internationally and nationally, particularly can be seen in:
• Westmead Health & Medical Research Precinct (Sydney);
• Melbourne Biomedical Precinct; Carlton Connect
(Melbourne); and
• South Australian Health and Biomedical Precinct (Adelaide).
Increasing competition from other parts of Australia may
threaten the future growth projected for this traded industry
in SEQ.
Changing nature of service delivery
The increasing pace of technological development is changing
the way the international education services are being
demanded and delivered. Increasingly, education is being
delivered through online delivery methods, either as a primary
or complementary training approach. This is causing the need
for precincts to reconsider the best use of key physical assets.
Priority industries driving growth
93SEQ City Deal | Economic Foundations Paper

Enablers
Enablers of the traded health and education industry
cluster are initiatives which encourage growth by attracting
international students, enhancing the student experience,
enabling transfer of knowledge and the commercialisation
of ideas.
Recent investments to enable growth in international education
have focused on state-wide initiatives which include industry
strategy, collective marketing and promotional effort, and
partnership funding to support collaborative initiatives. SEQ
has focused on improving the connectivity between key spatial
clusters of industry activity through improvements to public
transport networks.
To encourage the future growth of this industry cluster, and
complement existing initiatives, the key enablers identified
for the traded health and education industry cluster
include transport, investment, government regulation, and
coordination and collaboration. These enablers are further
detailed in the table below.
Infrastructure
Transport connections
to and from health and
education clusters
Ensure the transport network provides efficient connections to existing and potential clusters.
Financial capital
Investment under
existing strategies
Existing strategies have identified opportunities for investment including Queensland’s biomedical
road map and the Queensland Trade and Investment Strategy.
Translation and
commercial focus
Development of investment funding and performance measures to focus on increasing economic
outcomes. Venture capital is also critical.
Policy
Grow niche industries SEQ has five established and emerging clusters in which to focus refinement to service delivery
and further develop precinct level governance and collaboration.
Integration With the local health service promotes service improvement, strong workforce development and
translational synergies (transfer of research outcomes to practice).
Industry partnerships Industry engagement enables faster commercialisation, a stable workforce and professional
development.
Co-location Enables co-location of education and health industries to stimulate innovative activity through
interactions, sharing of facilities and exchange of expertise and knowledge. Clustering of activities
contributes to technology transfer, networking and information circulation.
Priority industries driving growth
94 SEQ City Deal | Economic Foundations Paper

Transport and
communications
Key supply industries
• Finance and professional
services
• Other local services
• Transport and communications
• Traditional manufacturing
• Advanced manufacturing
Key demand industries
• Transport and communications
• Utilities and traded wholesale
• Finance and professional
services
• Retail and local wholesale
Outputs
• Freight and logistics
• Telecommunications
• Storage (digital and physical)
Enablers of economic growth
• Infrastructure
• Network Management
• Technology
Industry cluster risks
• Network congestion
and inefficiencies
• Policy and regulatory
environment
• Digital security
Industry cluster opportunities
• Technology and automation
• Enabling transport
infrastructure
• Rise of online retailing
• Containerised freight
SEQ comparative context
• Concentration of transport assets
• Natural endowments – coastal
location
• Government policy and investment
Key inputs
• Infrastructure (transport and
telecommunications)
• Business inventory volumes
• Business process outsourcing
Key demand drivers
• Total merchandise imports
and exports
• Demand from wholesale
and retail trade
• Australian dollar
• Telecommunication/internet
services
• Population growth
Priority industry overview
Transport and communications is a core enabler of economic
activity in SEQ. In the context of the economic narrative,
the transport and communications industry cluster broadly
captures key traded industries within the freight and logistics,
telecommunications, and warehousing and storage (physical
or online) industries. Figure 46 provides an overview of the
transport and communications industry cluster in SEQ.
Transport and communications
Figure 46 – Transport and communications industry cluster overview
Source: CTT, Queensland Government
Priority industries driving growth
95SEQ City Deal | Economic Foundations Paper

Transport and communications in SEQ
The transport and communications industry cluster has been
identified as a priority industry cluster due to its strategic
importance in enabling and supporting economic growth.
Specifically, the industry cluster facilitates the efficient
movement and transfer of goods and information to, from, and
within SEQ. Accordingly, the industry cluster underpins the
efficiency of SEQ’s supply chains, which are central to SEQ’s
ability to compete in interstate and international markets.
SEQ is unique in its concentration of transport assets,
including five international gateways that connect the region
directly to international markets – the Port of Brisbane,
Brisbane Airport, Gold Coast Airport, Sunshine Coast Airport
and Wellcamp Airport (Toowoomba). This infrastructure
supports the industry cluster, enabling a number of freight,
logistics, warehousing and storage industry functions.
SEQ’s communications network provides essential connections
between the region’s key infrastructure assets to enable
the transfer of information, support research and enable
digital efficiencies. Specifically, the communications network
provides connections between SEQ’s health, knowledge and
technology precincts, regional activity centres, and major
enterprise and industrial areas.
The transport and communications industry cluster is
estimated to employ close to 64,700, or 4.4 percent, of workers
within SEQ, generating approximately $171,400 GVA per
worker in 2016. Economic output per worker in SEQ’s transport
and communications industry cluster is comparative to the
economic output of an Australian worker in the same industry
cluster. This economic activity is driven by clusters of industry
activity in close proximity to SEQ’s core transport infrastructure
assets and industrial areas such as the Port of Brisbane,
Brisbane Airport, and Rocklea.
Priority industries driving growth
Figure 47 – Key industry cluster characteristics – transport and communications
Source: CTT, Queensland Government. Refer Appendix B – Technical Note; University annual reports, 2016; ABS Census, 2016
$171,400 GVA per worker
SEQ’s traded transport and communications workers productivity is in line with the typical transport and
communications worker in Australia
64,700 employed in industry cluster
4.4 percent of employment in SEQ
Transport and communications
Highest level of education attainment, 2016
0.0
0.1
0.2
0.3
0.4
0.5
Bachelor and aboveDiplomas and CertificatesSecondary Education – Years 10 and aboveSecondary Education – Years 9 and below
96 SEQ City Deal | Economic Foundations Paper

Key locations
The transport and communications industry cluster is
located in a number of significant spatial clusters across the
region, particularly on the Australia Trade Coast REC, and in
pockets of industrial land across the region, such as Rocklea,
Jimboomba, Caboolture and Southport. The Western Gateway
is an emerging cluster of transport and communications
enabled by the airport, inland rail and intermodal terminal.
Overall, the industry cluster is established in key locations
that leverage and support the region’s core trading functions,
industrial activity and network coverage.
The SEQ freight network is well connected to the national
freight network. The import-export gateways located in SEQ
connect directly to central Queensland, Darwin and Melbourne
through the Western gateway, northern Queensland through
the northern corridor, and northern NSW and Sydney through
the south and south-western corridors (see Figure 48).
As shown in Figure 49, SEQ’s distribution of transport and
communication infrastructure assets delineates clear
transport corridors within the region, which connect the
spatial clusters of transport and communication industry
activity. The Port of Brisbane and the region’s four
international airports located in Brisbane, Sunshine Coast,
Gold Coast and Toowoomba are serviced by the region’s road
and heavy rail freight networks providing clear north-south
and east-west connections. Intermodal facilities within the
region align to these corridors with facilities in the Port of
Brisbane, Acacia Ridge and Toowoomba. The operation of
the Bromelton SDA’s intermodal facility and construction of
Inland Rail will strengthen the freight corridor south-west of
Brisbane.
Ongoing investment into strategic transport and
communications infrastructure will influence the location
and spatial clustering of future industry activity. The roll-out
of the National Broadband Network (NBN) has the potential
to promote further transport and communications industry
development within areas including Western Gateway
REC, South West Industrial Corridor REC, Ipswich REC and
Bromelton SDA.
Figure 48 – Infrastructure Australia’s indicative map of a national land freight network
Source: Australian Government Department of Infrastructure and Regional Development, 2017, National Key Freight Route Map
Priority industries driving growth
97SEQ City Deal | Economic Foundations Paper

!
o
!
o
!
o
!
o
"
"
"
"
"
"
"
"
"
"
"
"
"
"
"
"
"
"
"
"
"
"
"
"
"
"
"
"
"
"
"
"
"
"
"
Esk
Oakey
Noosa
Wondai
Gympie
Robina
Kilcoy
Boonah
Gatton
Warwick
Coomera
Nambour
LaidleyIpswich
Kingaroy
Fernvale Brisbane
Jimboomba
Southport
Cleveland
Caloundra
Beenleigh
Redcliffe
Toowoomba
Kingscliff
Crows Nest
Pittsworth
Beaudesert
Caboolture
Tweed Heads
Springfield
Murwillumbah
Maroochydore
Logan Central
Coolangatta
Legend!
o
International airport!! Port of BrisbaneP!! Intermodal terminalP!! Future Intermodal terminal
Major roadRailwayFuture road connectionFuture/investigation rail connectionWaterbody and waterwayCity Deals areaBromelton State Development Area(SDA)Regional Economic Cluster (REC)Transport and communications REC
Regional land use categoryUrban FootprintRural Living AreaMajor expansion area
Australia TradeCoastREC
Bromelton SDA
WesternGatewayREC
BromeltonSDA
Figure 49 – Transport and communications in the SEQ region
Source: Regional and Spatial Planning, Queensland Government. September 2017
Transport and communications in the SEQ region
Priority industries driving growth
98 SEQ City Deal | Economic Foundations Paper

Inter-industry links
From an industry perspective, the transport and
communications industry cluster has direct and indirect
links with all industries of the economy. Specifically, as
per the Input-Output industry analysis, there are a number
of key industry interdependencies. These are illustrated in
Figure 50 below.
Primarily, the priority industry cluster supports (15 percent),
and is supported by (17 percent), activity within its own
industry cluster. For example, the movement of freight
demonstrates this inter-industry relationship as goods move
from warehousing and storage through the region on the
transport network for export through the region’s export
gateways.
The transport and communications industry cluster has
significant input from the financial and professional services
industry cluster (21 percent). In addition to being a consumer
of freight services, the financial and professional services are a
user of digital storage, software publishing, data process, web
hosting and other internet related services.
Other local services (18 percent) and traditional manufacturing
(12 percent) also support the transport and communications
industry cluster. Other local services include rail and road
passenger transport which are likely linked to various freight
networks (rail, road, air). Growth in the demand for these
industries is closely linked to the subsequent growth of the
transport and communications industry cluster.
The transport and communications priority industry cluster
supports utilities and traded wholesale (13 percent), the
finance and professional services cluster (11 percent), retail
and local wholesale (11 percent). The output into the financial
and professional services includes telecommunication and
internet services that support businesses’ services such as
administration, legal and financial, and insurance.
Local Healthand Education 3%
Tourism and cultural 2%
Other localservices 18%
Other localservices 9%
Traditional manufacturing 12%
Advancedmanufacturing 9%
Transport andcommunications 17%
Transport andcommunications 15%
Publicadministration 3%
Publicadministration 8%
Finance andprofessional services 21%
Finance andprofessional services 11%
Retail and local wholesale 11%
Traded healthand education 2%
Utilities andtraded wholesale 11%
Industrialand construction services 6%
Industrialand construction services 7%
Utilities andtraded wholesale 8%
Agribusiness 2%
Traditional manufacturing 5%
Advanced manufacturing 3%
Primary 6%
Agriculture 2%
Inputs
Transport and communications
Outputs
Input industries Output industries
Figure 50 – Transport and communications inter-industry input and output links
Source: CTT, Queensland Government. Refer to Appendix B – Technical Note
Priority industries driving growth
99SEQ City Deal | Economic Foundations Paper

Opportunities
A number of opportunities that have the potential to grow
the transport and communications industry cluster in SEQ
are listed below.
Technology and automation
Technology and automation is one of the most significant
opportunities for the industry cluster, the impacts of which
are already being realised. While the exact scope of change
is difficult to anticipate, known advancements in new
technologies, including data analytics, automation and
platform solutions, have the potential to significantly improve
the competitiveness of the industry cluster.
In an increasingly competitive environment, technological
advancement has the potential to increase productive
output for the industry cluster through improved system
efficiency, capacity utilisation and process execution. Within
warehousing and logistics industry groups, technology is
enabling value-added services such as cross-docking (direct
distribution from supplier / manufacturer to customer / retail
with minimal handling or storage time), precise inventory
management, and full supply chain solutions.
Additional opportunities may be realised through technological
advancements within complementary and supporting
industries; technology-driven changes in freight and logistics
inputs, the creation of new market segments and changing
consumer preferences will increase demand for transport and
communication services and functions.
Enabling transport infrastructure
SEQ has significant enabling transport infrastructure which
supports the transport and communications industry cluster.
Importantly, the region has an integrated transport network
that connects industries, and supports the movement of freight
between production and final markets. Most notably, SEQ
has a number of international gateways which connect the
region directly to international markets – the Port of Brisbane,
Brisbane Airport, Gold Coast Airport, Sunshine Coast Airport
and Wellcamp Airport. These gateways are supported by a
network of road and rail infrastructure.
New infrastructure projects, such as Inland Rail and the
Toowoomba Second Range Crossing, will provide additional
landside capacity, better freight connections and improve
multimodal freight efficiency within SEQ.90
Leveraging the region’s transport network, there are a number
of opportunities for the transport and communications
industry cluster to adapt and respond to increasing demand
for inter-regional and interstate freight.
Rise of online retailing
The rise of online retailing and e-commerce is a significant
opportunity for the industry cluster, particularly for the
logistics, warehousing and storage, internet and web hosting
industry groups.
Changing consumer preferences is driving innovation and the
development of omni-channel logistics solutions which are
required to meet the demand for more personalised, dynamic
delivery options, e.g. just in time delivery.
The continued expansion of online retailing will generate
further opportunities through increasing demand for
third-party supply chain solutions; retail is no longer
restricted to brick and mortar storefronts and, accordingly,
there is growing demand for warehousing and storage.
Containerised freight
The growth of containerised freight movements, both
import and exports, is an opportunity for the transport and
communications industry cluster. Containerisation has
increased globally as the freight sector adapts to provide agile
and globally efficient freight transport.
Since 2004, containerised freight exports from the Port of
Brisbane has increased by 202,604 TEU (56 percent from
2004 to 2014).91 Further growth is anticipated in containerised
freight volumes as projected strong economic growth in Asia
increases the demand for SEQ’s containerised exports (such as
agricultural products) through the Port of Brisbane.92
The growth of containerised freight in SEQ has further
implications for the transport and communications
industry cluster, including the requirements for additional
infrastructure, such as intermodal facilities, to support efficient
and effective global supply chains.
90 Department of Infrastructure, Local Government and Planning, 2017, State Infrastructure Plan Part B91 Twenty-foot equivalent (TEU) is a measure of cargo capacity of container ships92 Ports Australia. 2015. “Trade Statistics: Containerised Trade In TEU for 2004/2005 and 2014/15” Accessed September 6, 2017. http://www.portsaustralia.
com.au/aus-ports-industry/trade-statistics/?id=5&period=15
Priority industries driving growth
100 SEQ City Deal | Economic Foundations Paper
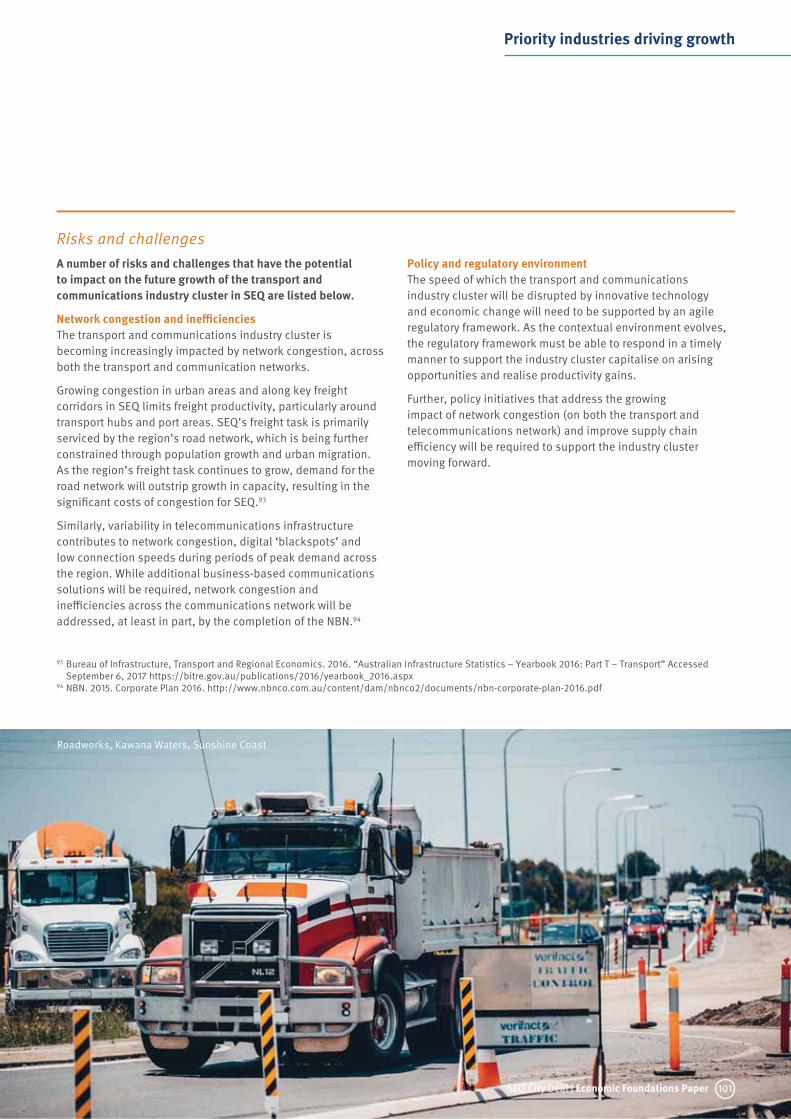
93 Bureau of Infrastructure, Transport and Regional Economics. 2016. “Australian Infrastructure Statistics – Yearbook 2016: Part T – Transport” Accessed
September 6, 2017 https://bitre.gov.au/publications/2016/yearbook_2016.aspx94 NBN. 2015. Corporate Plan 2016. http://www.nbnco.com.au/content/dam/nbnco2/documents/nbn-corporate-plan-2016.pdf
Risks and challenges
A number of risks and challenges that have the potential
to impact on the future growth of the transport and
communications industry cluster in SEQ are listed below.
Network congestion and inefficiencies
The transport and communications industry cluster is
becoming increasingly impacted by network congestion, across
both the transport and communication networks.
Growing congestion in urban areas and along key freight
corridors in SEQ limits freight productivity, particularly around
transport hubs and port areas. SEQ’s freight task is primarily
serviced by the region’s road network, which is being further
constrained through population growth and urban migration.
As the region’s freight task continues to grow, demand for the
road network will outstrip growth in capacity, resulting in the
significant costs of congestion for SEQ.93
Similarly, variability in telecommunications infrastructure
contributes to network congestion, digital ‘blackspots’ and
low connection speeds during periods of peak demand across
the region. While additional business-based communications
solutions will be required, network congestion and
inefficiencies across the communications network will be
addressed, at least in part, by the completion of the NBN.94
Policy and regulatory environment
The speed of which the transport and communications
industry cluster will be disrupted by innovative technology
and economic change will need to be supported by an agile
regulatory framework. As the contextual environment evolves,
the regulatory framework must be able to respond in a timely
manner to support the industry cluster capitalise on arising
opportunities and realise productivity gains.
Further, policy initiatives that address the growing
impact of network congestion (on both the transport and
telecommunications network) and improve supply chain
efficiency will be required to support the industry cluster
moving forward.
Priority industries driving growth
Roadworks, Kawana Waters, Sunshine Coast
101SEQ City Deal | Economic Foundations Paper

Enablers
There are a number of enablers that will support the
future growth and productivity of the transport and
communications industry cluster. These enablers capture
both the infrastructure and policy initiatives that will improve
the productivity of the industry cluster, creating a strong
foundation to support the growth complementary industries
throughout SEQ.
Recent investment and planning by the Australian and
Queensland Governments to improve interstate freight
movements through the committed Inland Rail project will
support the future growth of this industry cluster. Government
has also been focused on establishing freight links to emerging
industrial areas in SEQ, including the Bromelton SDA and
Ebenezer industrial area.
At a regional level, recent investment in SEQ has included
Wellcamp Airport in Toowoomba, the construction of a second
runway at the Brisbane Airport, and the continued expansion of
the Port of Brisbane. In addition, the development of the SEQ
Regional Transport Plan will provide the context and direction
for future strategic transport network and supply chain
planning.
Key enablers to support the growth of the transport and
communications industry cluster will improve accessibility
and connectivity within and outside sthe region. These
include infrastructure provision, network management and
the integration and coordination of land-use and transport
planning. These enablers are further detailed in the table
below.
Land
Land-use planning Preserve land for corridor expansion and development, and development of intermodal
terminals. Protect future freight corridors to facilitate growing freight movements. Ensure
suitable land is available for Intermodal facilities which consume large areas of land and
generate substantial amounts of truck flows. These activities are increasingly difficult to
accommodate as a result of competing land uses.
Infrastructure
Improve the efficiency and
capacity of the freight network
Optimise use of existing infrastructure through demand management and other network
optimisation solutions.
Infrastructure
Infrastructure linkages Develop strategic intermodal facilities at key transport nodes to provide connections to, from
and between industries and market.
Develop a business-based
broadband solution
Prioritise targeted business-based communications solutions / enabling technology to
provide certainty to businesses and industry, improving the desirability and viability of
operating in the regional areas of SEQ.
Policy
Integration of transport, land
use and industry development
planning
Better integrate and coordinate transport, land use and industry development planning to
improve supply chain efficiency and support multi-modal freight movements.
Whole-of-system solutions Develop whole-of-system solutions for SEQ, integrating the transport and communications
network with the Internet of Things and other smart technology.
Financial capital
Alternative funding and
financing solutions
Consider alternative funding and financing solutions, such as user pricing and opportunities
for leveraging value sharing mechanisms.
Priority industries driving growth
102 SEQ City Deal | Economic Foundations Paper

Priority industry overview
Tourism is a major employer and contributor to the SEQ
economy, building on the unique natural and cultural
experiences that SEQ offers. Similarly, creative and cultural
activities contribute to vibrant, liveable communities, as well
as niche exports, though they make up a smaller proportion
of the overall economy. These two industries have been
grouped into a single priority industry cluster because of their
similar geographic distribution and their interrelatedness.
Co-location of these industry clusters often occurs as places
desirable to tourists are often also desirable to the creative
community. Both industries are enhanced by the same natural
amenity, connectivity and services of a place. In addition,
creative activities (shows or events) draw national and
international visitors to the region.
Domestic tourism continues to be the foundation of the tourism
sector, and represents 64 percent of visitor expenditure
in Australia.95 The Gold Coast, Sunshine Coast, and City of
Brisbane are top domestic tourist destinations for SEQ and,
given their established tourism industries and natural assets,
they will likely continue to attract the largest share of tourism
activity in the region.
However, this is a highly competitive industry and will require
careful consideration to continue to compete with other
destinations and meet shifting consumer preferences. This
is particularly true of the ‘experience economy’ section of the
market. Tourists no longer want to be merely spectators but
are instead driven by the need for meaning and memorable,
personalised experiences. Tourism and Events Queensland
(2015) describe this transformation in consumer expectations:
“Today’s guests want more than just to see the
sights. They want to learn, participate and engage
with local people and places when they travel. They
want stories of amazing people and places they can
share with their friends and family. Consumers are
looking for a tourism experience – the emotional
feeling or personal achievement a visitor derives
from the purchase, participation or consumption of
a tourism product. The ‘tourism product’ is what the
consumer buys; the ‘tourism experience’ is what
they remember.”96
The need to develop new experiences to drive growth in this
industry cluster is imperative.
The creative industry has an important role in supporting the
tourism industry with creative outputs which often contribute
to the amenity of the area and attract increased visitation.
Further, the region has a strong visual production industry,
anchored in film production on the Gold Coast as well as local
radio, television and performing arts content across the region.
The industry is also strongly tied to an array of professional
services industries that move this content into other mediums,
such as digital marketing, web design and other value-adding
industries.
Figure 49 provides an overview of the tourism and creative
industry cluster in SEQ.
Tourism and creative
95 Griffith University Institute for Tourism. 2015. Australian Tourism Demand for Domestic Travel Experiences: Insights for the Gold Coast96 Tourism and Events Queensland. 2015. Destination Hero Experiences
Priority industries driving growth
Movieworld, Gold Coast
103SEQ City Deal | Economic Foundations Paper

Figure 51 – Tourism and creative industry cluster overview
Source: CTT, Queensland Government
Tourism and creative
Key supply industries
• Finance and professional
services
• Other local services
• Utilities and traded wholesale
• Tourism and creative
Key demand industries
• Finance and professional
services
• Transport and communications
• Tourism and creative
• Other local services
Outputs
• Holidays and accommodation
• Media broadcasting
• Travel, tours and transfers
• Creative intellectual property
SEQ comparative context
• Pristine beaches
• Knowledge hubs
• Established tourism and creative
clusters
• Four international airports
Key inputs
• Total visitor nights
• International travel to Australia
• Domestic travel
• Australian dollar
• Household discretionary income
Key demand drivers
• Middle class wealth
• Access to international markets
• Population
• Reputation
• Unique attractions
Enablers of economic growth
• Key attractions
• Airport access
• Australian dollar
• Supportive regulatory environment
Industry cluster risks
• Competition
• Shifting consumer preferences
• Technology disruption
• Deterioration of natural assets
• International terrorism
Industry cluster opportunities
• Growth of Asia’s middle class
• Rising demand for service
and experience
• Quality products, events
and experiences
Priority industries driving growth
104 SEQ City Deal | Economic Foundations Paper

Tourism and creative in SEQ
Activity in the tourism and creative industry clusters has
grown throughout SEQ over consecutive decades, leveraging
the region’s natural assets to establish mature industry
clusters, particularly in coastal and hinterland areas. SEQ has
been a popular destination for tourists seeking a sub-tropical
climate, beaches, islands, rainforests and rural hinterland.
The tourism and creative industry cluster is a priority industry
cluster in SEQ because of the region’s natural assets, mature
industry clusters, access to a stable workforce and existing
infrastructure (e.g. accommodation, preforming arts facilities).
A clear example of a prominent cluster of creative industry
activity is the Oxenford cluster on the Gold Coast. This cluster
brings together a specialised workforce in the surrounding
area, and utilises the surrounding natural landscape and built
studios to underpin film production.
Similarly, the City of Brisbane, Gold Coast and Sunshine Coast
have seen significant investment in tourism infrastructure,
including a second runway at Brisbane Airport, Brisbane
International Cruise Ship Terminal, new luxury hotels, the
planned extension to the Gold Coast light rail and investments
associated with the Commonwealth Games 2018. Businesses,
such as major hotels and sightseeing services, continue to
grow within the region building on the region’s advantages.
The tourism and creative industry cluster is estimated to
employ close to 42,400, or three percent of workers within
SEQ, generating approximately $81,100 GVA per worker in
2016. This industry cluster has lower GVA per worker compared
to the Australian worker in the same industry cluster. Through
improvements to productivity, there is opportunity to increase
the GVA per worker, growing the contribution to the economy
from this industry cluster. This economic activity is driven by
large employment bases around its established tourism and
creative hubs, located at the Gold Coast (tourism and creative),
Sunshine Coast (tourism), and Brisbane (tourism and creative).
A key differentiator for the industry cluster relative to other
industry clusters is the predominantly small business nature
of its participants.
Priority industries driving growth
Festival of Lights, Gold Coast
105SEQ City Deal | Economic Foundations Paper

Figure 52 – Key industry cluster characteristics – tourism and creative
Source: CTT, Queensland Government. Refer Appendix B – Technical Note; University annual reports, 2016; ABS Census, 2016
$81,000 GVA per worker
SEQ’s tourism and creative workers are lower than the
typical tourism and creative worker in Australia
42,500 employed in industry cluster
3 percent of employment in SEQ
Tourism and creative
Highest level of education attainment, 2016
Bachelor and aboveDiplomas and CertificatesSecondary Education – Years 10 and aboveSecondary Education – Years 9 and below
0.0
0.1
0.2
0.3
0.4
Key locations
Business activity in the tourism and creative industry sector is
concentrated in areas with key natural endowments that lend
themselves to visitor experiences. These include the region’s
beaches, islands, rainforests and rural hinterland. These are
highlighted in the ‘regionally significant scenic amenity’ areas
(Figure 53) that have been identified through the development
of ShapingSEQ.
Business location decisions also reflect key built form
investments, including the region’s airports as well as the
significance of key business districts across the region that
provide demand for accommodation.
The tourism and creative industry cluster is located in a number
of significant spatial clusters including the Moreton Bay islands
and the coast and hinterland areas of the Sunshine Coast and
Gold Coast including the Southport–Broadbeach and Southern
Gateway REC (all predominantly small-business led clusters).
The Coomera Precinct similarly reflects the concentration of
high value creative activities in one location, including film
production and associated supply chains. In addition, the
Brisbane CBD (Capital City REC) is a key spatial cluster of
tourism and creative industry activity. The CBD cluster has
a strong concentration of services, activities and cultural
precincts, including preforming arts, museums, art galleries
and accommodation.
106 SEQ City Deal | Economic Foundations Paper

!
o
!
o
!
o
!
o
!
o
!
o
!
o
!
o
"
"
"
"
"
"
"
"
"
"
"
"
"
"
"
"
"
"
"
"
"
"
"
"
"
"
"
"
"
"
"
"
"
"
"
Esk
Oakey
Noosa
Wondai
Gympie
Robina
Kilcoy
Boonah
Gatton
Warwick
Coomera
Nambour
LaidleyIpswich
Kingaroy
Fernvale Brisbane
Jimboomba
Southport
Cleveland
Caloundra
Beenleigh
Redcliffe
Toowoomba
Kingscliff
Crows Nest
Pittsworth
Beaudesert
Caboolture
Tweed Heads
Springfield
Murwillumbah
Maroochydore
Logan Central
Coolangatta
Legend!
o
International airport
!! Port of BrisbaneMajor roadRailwayWaterbody and waterwayCity Deals areaRegionally significant scenic amenity(SEQ)Regional biodiversity valueRegional Economic Cluster (REC)Tourism and creative REC
Regional land use categoryUrban FootprintRural Living Area
Southport-BroadbeachREC
CapitalCity REC
!!CoomeraPrecinct
SouthernGatewayREC
Figure 53 – Tourism and creative in the SEQ Region
Source: Regional and Spatial Planning, Queensland Government. September 2017
Tourism and creative in the SEQ Region
107SEQ City Deal | Economic Foundations Paper

Inter-industry links
To continue to grow the tourism and creative industry cluster
within SEQ, it is necessary to identify which other industry
clusters can support and enable growth. The key relationships
to other industry clusters are illustrated in the inter-industry
link diagram (Figure 54).
The tourism and creative industry cluster primarily supports
(32 percent of inter-industry outputs) and is supported
by (24 percent of inter-industry inputs) the financial and
professional services industry cluster. This includes
businesses’ administration, property operation, and legal
and accounting services. Financial and professional services
generate business tourism – for example, people coming to
a region for trade shows, capital raising, and visiting other
office branches or suppliers. The tourism and creative industry
cluster also requires various inputs related to running a
business which include legal advice, administration, marketing
and employment services. This relationship between the two
industry clusters is spatially visible in the co-location of these
industries in key centres across the Brisbane, Gold Coast and
Sunshine Coast local government areas.
Secondly, the priority industry cluster supports (nine percent)
and is supported by (10 percent) activity within its own
industry cluster. For example, travel agents sell products which
are generated in the industry cluster such as tours, airport
transfers and accommodation.
The priority industry cluster also supports activity in
transport and communications (nine percent) which includes
international and domestic air service provision, and other
local services industry cluster (eight percent). These other local
services include takeaway, cafe and restaurant operation, and
retail. Other local services are often included as part of the
tourism industry in other publications. However, as these are
non-traded industries, they are not the focus of this paper.
The tourism and creative industry cluster also supports the
growth of other priority industry clusters in a more holistic
sense through the promotion of the region’s natural assets and
cultural experiences, both fundamental aspects of liveability
and attractiveness of a region.
Local Healthand Education 4%
Other localservices 8% Other local
services 14%
Food and recreation 3%
Food and recreation 5%
Agribusiness 8%
Traditional manufacturing 5%
Publicadministration 4%
Publicadministration 4%
Finance andprofessional services 24%
Finance andprofessional services 32%
Transport andcommunications 9%
Transport andcommunications 9%
Utilities andtraded wholesale 7%
Industrialand construction services 7%
Retail and local wholesale 5%
Industrialand construction services 5%
Utilities andtraded wholesale 11%
Tourism and cultural 10% Tourism
and cultural 9%
Traditional manufacturing 4%
Advanced manufacturing 3%
Inputs
Tourism and creative
Outputs
Input industries Output industries
Agriculture 4%
Figure 54 – Tourism and creative inter-industry input and output links
Source: CTT, Queensland Government. Refer to Appendix B – Technical Note
Priority industries driving growth
108 SEQ City Deal | Economic Foundations Paper

Priority industries driving growth
Opportunities
A number of opportunities that have the potential to grow the
tourism and creative industry cluster in SEQ are listed below.
Growth of middle class in Asia
The increasing affluence of Asia’s population will drive
demand in tourism, with wealthy visitors seeking attractive
destinations, cultural experiences, luxury accommodation
and high-quality service. Currently, Asia is the region’s
fastest growing international market (nine percent growth)
in Queensland for the year ending March 2017.97 There is an
opportunity to increase the tourism visiting friends and family
sub market by leveraging the international students visiting
the region.
The increasing affluence of Asia’s population will also drive
demand in, and provide opportunities for, growth of the
creative industry services. Demand across Asia for creative
services and cultural products is growing fast and continues to
present opportunities for organisations.
Grow quality products, events and experiences
SEQ has a strong pipeline of tourism and cultural infrastructure
being developed, including Queen’s Wharf, Integrated Resort
Developments (IRDs), Brisbane International Cruise Terminal,
Howard Smith Wharves and Jewel Towers. Visitors to the SEQ
region have a strong interest in nature-based adventure and
cultural activities, particularly the international leisure tourism
market, however there are some gaps in these types of tourism
product in SEQ.98 For example, indigenous cultural experiences
to provide insight into the region’s cultural heritage offer a
chance to develop the ‘experience economy’. The Queensland
Government ‘North Stradbroke Island Economic Transition
Strategy’ identifies a range of initiatives to stimulate business
growth including promoting tourism, including Indigenous
cultural tourism, on North Stradbroke Island.
There is opportunity to build on existing infrastructure and
natural assets to facilitate the development of new products
and experiences that meet the expectations of target markets.
These could include premium experiences that attract
‘high-yield’ visitors as part of new or existing tourism
developments.
Rising demand for services and experiences
As incomes grow, both domestically and internationally,
people are more likely to spend their discretionary expenditure
on new experiences rather than products. There is rising
demand for services and experiences, including tourism,
education and entertainment. Nationally, between 2004 and
2010, Australians increased their spending on cultural and
entertainment services by 25 percent of average household
expenditure (in nominal terms).99 Future tourist markets will
seek to create experiences that are personalised, ‘authentic’ to
the destination and its people, involve face-to-face interaction
and create emotional connection.
97 Tourism and Events Queensland. 2017. International Tourism Snapshot, https://cdn-teq.queensland.com98 Tourism and Events Queensland. 2008. Brisbane Regional Tourism Investment and Infrastructure Plan99 Australian Bureau of Statistics. 2011. “Arts and Culture in Australia: A Statistical Overview.” Catalogue Number 4172.0
109SEQ City Deal | Economic Foundations Paper

100 Tarrant. N. 2017. IBISWorld Industry Report X0003 Tourism in Australia www.ibisworld.com.au101 Tourism Research Australia. 2017. State of the Industry 2016 Accessed September 6, 2017 https://www.tra.gov.au/research/view-all-publications/
all-publications/state-of-the-industry/state-of-the-industry-2016
Risks and challenges
A number of risks and challenges that have the potential
to impact on the future growth of the tourism and cultural
industry cluster in SEQ are listed below.
Increasing competition and shifting consumer preferences
Australian tourists are increasingly choosing foreign locations
for recreational travel, moving away from domestic long-
term stays in favour of overseas travel. This is reflected in
analysis by Tourism Research Australia (TRA) that outbound
departures by Australian residents have grown at a faster
rate than domestic day and overnight trips over the past five
years.100 Price is one of the main factors in this decision, and is
a point in which the region’s industry operators will struggle to
compete. It is also one that is influenced by exchange rates of
key currencies that are out of the control of the industry cluster.
Currently, the region’s industry operators perform strongly
by offering a superior tourism offering. However, as foreign
locations mature their service offering, they will also become
more competitive in terms of a quality offering, creating a
greater challenge for the region’s operators.
Australia has experienced a strong rise in inbound tourist
numbers over the past five years, with visitor numbers
increasing as the Australian dollar decreases. However, TRA
have identified that SEQ is losing market share to other states
and territories.101
Connecting to global markets
The local market for creative services, such as design, is small
by international standards. Most firms will need to obtain
export revenue to achieve sustainable growth and remain
competitive. Creative industries are often micro businesses
or small to medium sized enterprises. Given their size, these
industries are often challenged to make an impact on the
competitive international stage. Commercially, there can
be difficulties in raising finance, navigating the regulatory
environment, gaining business skills or establishing export
markets.
Technology disruption
Technology has enabled massive transformations in areas
such as music, film, television, publishing and games. It
has provided entrepreneurs with emerging services for new
business, such as the Brisbane based developers of the Fruit
Ninja app, and Half Brick studios. However, it continues to
demand innovation and adaptation of traditional models. In
some areas, it has opened the way to more engagement with
overseas markets and intensified international competition.
Preservation of natural assets
Tourism businesses often choose to locate in proximity to
natural assets (attractions) which underpin the industry.
To ensure the key attractions are preserved, it is necessary
undertake strategic planning to consider the best uses and
sustainable outcomes for the SEQ’s natural environment and
assets.
Priority industries driving growth
110 SEQ City Deal | Economic Foundations Paper

Priority industries driving growth
Enablers
Enablers of the tourism and creative industry cluster are initiatives which encourage growth by overcoming suggested barriers,
and / or leveraging opportunities. Recent investment has been directed at physical assets (mentioned above) as well as several
industry growth strategies (e.g. Destination Success102, Draft Advancing Tourism). Key enablers for the industry cluster include
investment, coordination and collaboration, promotion and skills. These enablers are further detailed in the table below.
Infrastructure
Unique tourist
attractions
Government initiatives that enable and support significant private sector investment in tourism
ventures to develop key attractions in the region. These should complement existing experiences
and natural endowment for example, an indigenous cultural experience / cultural centre or a
regional food trail.
Tourism connections Ensure the transport network provides efficient connections to tourism destinations – airports,
accommodation and sights – to improve the tourism experience. For example, improved frequency
of key international routes to Asian population centres, improved public transport connectivity to
regional airports (i.e. Gold Coast, Sunshine Coast and Wellcamp).
Human capital
High quality workforce Strengthen industry pathways for students to encourage careers in tourism to grow the customer-
focused service culture and experience. Improved skills will deliver higher quality services to meet
market requirements and improve the competitiveness of the industry cluster.
Cultivating skills,
entrepreneurship and
innovation
Creative skills support the development of creative and cultural industries. Stimulating creative
industry entrepreneurship and innovation can drive growth.
Policy
Market Analysis Undertaking ongoing market analysis to enable businesses to meet and adapt to market
expectations. The tourism industry consists of several small businesses without the individual
resources to undertake significant research and development activities. Market analysis would
enable targeted consumer marketing; a more effective use of smaller business resources.
Community engagement
in tourism
Provide complete service offering to people visiting the region to provide a ‘unique experience of
the destination’. Obtaining community acceptance and support for tourism is essential to building
sustainable communities and industry.
Creative hubs Enable co-location of creative industries including creative education to grow innovation through
interactions, sharing of facilities and exchange of expertise and knowledge. Co-location requires
affordable and fit-for-purpose spaces that are well connected within the region.
102 Department of Tourism, Major Events, Small Business and the Commonwealth Games. 2014.
Destination Success – The 20-Year Plan for Queensland Tourism
111SEQ City Deal | Economic Foundations Paper

The economic foundation of SEQ
Road train
112 SEQ City Deal | Economic Foundations Paper

The purpose of this economic foundations paper is two-fold. It has
been designed to:
• Provide an evidence base for a
framework to inform investments in
the region
• Inform an overarching economic
narrative for the region.
The preceding chapters have articulated
how key industry clusters across the
region have the potential to drive growth
in traded economic activity. These will
inform both the framework and the
narrative. This chapter builds on this
analysis by:
• Summarising the key enablers for
growth across all industry clusters
• Identifying the clusters that will be
critical to this growth
• Summarising these elements to
create the economic foundation –
a priority industry and spatial lens
to inform future investment
• Outlining how the above will inform
a framework for investment in this
growth.
It is intended that this foundation can be
applied across a range of infrastructure
and economic planning activities for the
region, including the SEQ City Deal and
the SEQ Narrative.
The economic foundation of SEQ
The economic foundation of SEQ
Figure 55 – Economic foundations paper relationship with the SEQ City Deal
Source: CTT, Queensland Government
Priority industries
SEQ Economic Foundation
SEQ City Deal Framework consideration
Clusters Enablers
SEQ Narrative
Framework
Program of investment
Governance
Economic Spatial Infrastructure
SEQ Economic Foundations Parper
SEQ City Deal
Evidence base to inform
investment in SEQ
Delivery of a range of
regional, sub-regional and
place making initiatives
113SEQ City Deal | Economic Foundations Paper

Priority industry clusters SEQ’s priority industry clusters will position the region to
realise its economic aspirations. As set out earlier in this
report, expanding SEQ’s traded industry clusters is the only
way to generate growth above trend. Local industry clusters, in
contrast, only grow in proportion to population increases, and
therefore cannot generate the volume of jobs – and particularly
high value, knowledge-intensive jobs – that will drive the
competitiveness of the region in a global economy. These
industry clusters which will drive the competitiveness of the
region include:
• advanced manufacturing;
• agribusiness;
• traded health and education;
• transport and communications; and
• tourism and creative.
Growing the traded industry clusters to be a greater proportion
of the overall regional economy (in line with cities such
as Greater Sydney and Greater Melbourne) will ensure the
prosperity of SEQ for future generations.
The priority industry clusters set out in this report were
selected on the basis of:
• A robust analytical method based on the quantitative
techniques developed by Harvard Business School
• Interviews with stakeholders in local and state government
• The trajectory of these industries in light of the megatrends
that are shaping the global markets of tomorrow.
A long-term planning horizon will ensure that these industries
will be well-positioned to grow the region’s economy and
provide the jobs of the future for SEQ.
The economic foundation of SEQ
Priority industries
SEQ Economic Foundation
Clusters Enablers
Economic Spatial Infrastructure
114 SEQ City Deal | Economic Foundations Paper

Enablers to growthEnabling and unlocking growth is a complex proposition.
However, economic theory provides a foundation for thinking
about the inputs into growth, and how these can be best
applied in order to ensure the future prosperity of a region such
as SEQ. In simple terms, economic output can be attributed to:
• Land (and other natural resources) – natural endowments,
such as oil or mineral deposits, can be an important source
of economic growth. However, aside from land supply, these
are finite and therefore difficult or impossible to influence in
order to increase growth.
• Infrastructure – the physical capital, such as machinery,
roads, and increasingly, digital infrastructure, are key
drivers of economic growth and an important role for the
public industry cluster in the provision of public goods.
• Open information – is data that can support technological
innovation and economic growth through the development
of applications and services.
• Human Capital – which includes both growth in the overall
population as well as the skills of that population.
• Financial capital – investment is integral to the ability of
businesses to invest and grow.
• Policy – government policy, regulations, and institutions are
also an important determinant of growth.
• Technology – is technological and an improvement through
both innovation and adoption, which has the potential to
increase productivity.
Unlocking growth therefore needs to focus activity on those
enablers that have the greatest potential to grow SEQ’s priority
industries. For the purposes of the economic foundations
paper, the high level enablers have been broken down into
the categories described in the table below. These have been
generated by reviewing the existing evidence base for these
industry clusters as well as interviews with stakeholders
in local and state government. As such, the enablers listed
primarily relate to initiatives which can be implemented by
government.
The key enablers highlighted in the economic foundations
paper for each industry cluster are indicated in the table
below. These are not designed to be an exhaustive list, rather
they represent the views of stakeholders consulted in the
development of the economic foundations paper.
The economic foundation of SEQ
Priority industries
SEQ Economic Foundation
Clusters Enablers
Economic Spatial Infrastructure
Technology
Technology is a key determinant of productivity and an
important enabler of innovation. It transforms the way of
doing business, establishes new markets and demand, and
changes consumer preferences. Technology can transform
existing industries by making production faster, simpler
and more efficient. The capacity of a region to enable
technological change is a result of a combination of the
enablers identified in this paper. The roll out of ETCS in SEQ
is an example of implementing technology to enable more
efficient passenger and freight movements. This initiative
uses a combination of enablers as seen in the figure
opposite, highlighting how initiatives are not often a single
type of solution.
Technology
European Train Control System (ETCS)
Network optimisation
solution
Digital Infrastructure
Skilled workforce
Figure 56 – ETCS an example of technology initiative
Source: CTT, Queensland Government
115SEQ City Deal | Economic Foundations Paper

The economic foundation of SEQ
Land and natural resources
Land supply Land supply enables economic growth through residential and commercial development as well
as corridor preservation for transport and utilities.
Efficient management of land supply enables both new business and new workers to locate in
the region, and stabilises market prices. Providing sufficient land is necessary to support the
projected workforce population, ensuring supply and affordability of housing and connecting
labour markets to employment. Importantly, development of land requires the land to be serviced
by basic infrastructure which includes road, water, sewer, and communications.
Strategic land supply enables industry co-location: a prerequisite for agglomeration. New
transport infrastructure is often initially enabled by corridor preservation.
Infrastructure
Utilities Utilities are infrastructure services required to enable development or densification of land;
these include water supply, sewerage and electricity. The provision of utilities enables new
productive areas and consolidation growth. These infrastructure assets are necessary
precursors for any development.
In addition to supply of physical utilities, the cost of these services for commercial use is a
determining factor when businesses are establishing or further expanding business operations
in a given region.
Transport Transport infrastructure includes road, rail (freight), public transport (rail, bus, light rail, ferry) and
active transport (cyclist, pedestrian).
Transport investment is fundamentally about improving efficiency, accessibility and safety. The
direct impacts of the investment in transport include changes in journey times and reduced
congestion for freight and labour force movements. The immediate outcome of the investment
is to change the patterns of land uses, both commercial and residential (densification). Finally,
together with transport investment itself, Finally, the impact on land uses combine with the
transport investment will interact to create intermediate outcomes. These include: location
choices, agglomeration, economic interactions between places, and effectively contributing
to the competitiveness of places. These intermediate outcomes all contribute to an uplift in
economic activity.
Network optimisation
solutions
Network optimisation solutions are programs that specifically relate to physical infrastructure
(e.g. transport and water). These investments can augment the existing network without
duplicating or extending existing assets. Network management solutions are targeted at
addressing a particular infrastructure problem through no, or low cost infrastructure interventions
that either improve the capacity of, or demand for, the asset.
Digital Digital infrastructure includes both mobile and fixed line internet connectivity.
High speed internet digital infrastructure connects people and businesses to the information and
business opportunities. Digital connectivity is the predecessor for any economic development;
it is required for business, government, skills development and, equitable access to information
and opportunity.
116 SEQ City Deal | Economic Foundations Paper

The economic foundation of SEQ
Information
Open data Sustainable, high-quality data is necessary for businesses, organisations, governments and
members of society to build new business models, digial applications, plan better services and
products and gain insights into how we live.
Using data requires both privacy and openness and helps create trust. It is necessary that data
is protected, kept private, just as it is necessary that it is openly published, open for everyone to
use.
Human capital
Skills Skills programs enable employees to: undertake more complex and dynamic tasks, upskill in
technological advancements, and obtain the skills required to service emerging industries.
Investment in skills benefits the economy through improved productivity, engagement in higher
value work and increased innovation.
Skills investments may include workforce planning, skills programs for technological change, and
leadership and strategic management.
Leadership and strategic management skills for SMEs can assist in the transition to new business
models, improve productivity and innovation, and highlight the value in investing more time into
long-term planning.
Technology uptake refers to businesses adopting new technologies which requires an
appropriately skilled workforce. New technologies transform the way of doing business, create
new markets and demand, result in changing consumer preferences and increase productivity.
To manage supply of labour, and demand for labour, the appropriate skilling of future employees
requires linkages between education institutions and industry.
Financial capital
Investment and
Financing
Investment is a key enabler for all industry clusters. Investment and financing includes access to
finance, tax incentives, joint investment models, alternate financing, direct foreign investment
and incentives for investment. Ensuring there are frameworks and mechanisms to support
alternative funding, financing and investment improves businesses’ accessibility to capital,
particularly for research and development which drive innovation.
117SEQ City Deal | Economic Foundations Paper

Policy
Coordination and
collaboration
Coordination and collaboration refers to the relationship between businesses within an industry
cluster (business-to-business) and business to research and education institutions (business-to-
research).
Business-to-business collaboration can enable innovative solutions to be identified faster
through pooled knowledge and experience. For example, with increasing the amount of data
available, industries can collaborate to centrally pool data, to draw insights for the benefit of
the entire industry. Alternatively, collaboration can include organisations coming together to
establish good governance for their industry. For example, becoming more active in enabling
growth across their industry.
Business-to-research collaboration improves businesses’ access to research facilities which can
be achieved by business placement opportunities for researchers and structured collaboration
models.
Government
regulation
Government regulation is the set of rules and regulations that govern the conduct of business.
Government regulation is an enabler of industry development when it is conducive to economic
development: a sustained increase to productivity. Government regulation is important for the
protection and management of natural assets, including agricultural land, national parks and
water quality.
Government policy and legislation regulate the use and development of land. Governments
can use policy to enable economic growth by accelerating development through streamlined
assessment processes.
Governance frameworks have a key role in anticipating and shaping the delivery of emerging
technologies and adapting to changing circumstances.
Promotion Promotion is the marketing of the region and the industries to increase investment, sales and
public awareness. Promotion communicates the benefits of the region to businesses, investors,
and skilled workers looking to set-up, invest or move to the region. Effective promotion can
negate public perception issues and attract skilled labour. Working together to undertake
regional promotion helps develop and strengthen the priority industry cluster.
Source: CTT, Queensland Government
The economic foundation of SEQ
118 SEQ City Deal | Economic Foundations Paper

The economic foundation of SEQ
Innovation Hubs
Regions and cities are increasingly setting up knowledge
precincts and hubs to encourage innovation through
information sharing and cross-industry cluster collaboration.
To establish these hubs requires a mix of enablers
depending on the context. These include appropriate
activity designations (land use policies), utilities, digital
infrastructure and passenger connectivity.
Land use policies enable co-location of related industries
to establish specialised precincts. These precincts enable
growth of the traded industries if they are enabled in
key locations, with fit-for-purpose spaces, that are well
connected within the region. Co-location of like activities
grows innovation by supporting interactions, sharing of
facilities and exchange of expertise and knowledge.
Co-location stimulates innovative activity through
interactions, sharing of facilities and exchange of expertise
and knowledge. Clustering of activities contributes to
technology transfer, networking and information circulation.
In addition, government policy to reduce the administrative
burden of creating a new firm, the regulatory protection of
incumbents, and the complexity of regulatory procedures
reduce barriers for new companies and encourage
investment in new ideas, growing innovation.
Figure 57 – Enablers for an innovation hub
Source: CTT, Queensland Government
Innovation Hub
Land use policy
Passenger connectivity
Digital infrastructure
Utilities
119SEQ City Deal | Economic Foundations Paper

Location of priority industry clusters Understanding the location of key activities involved in
the traded industry clusters and their supply chain links
across SEQ is important to appreciate the potential role that
infrastructure investment and other policy initiatives could
play to support growth. The identification of key clusters and
corridors to these activities has been informed by ShapingSEQ
(which identifies 16 RECs across the region as well as key
freight corridors) as well as consultation with government and
industry. Whilst there are other areas of economic significance
in the region, the areas identified below relate specifically
to the priority industry clusters in the economic foundations
paper, which include advanced manufacturing, agribusiness,
traded health and education, transport and communications,
and tourism and cultural.
Regional economic clustersTraded industry clusters have emerged within SEQ in areas
that afford their businesses access to competitive advantage.
This may be the result of a range of factors, including: access
to a suitable labour market, appropriately zoned land in close
proximity to enabling infrastructure (such as key freight routes
and for export industries), a high level of accessibility to export
gateways (such as airports and ports), among other factors. As
these areas of economic activity have matured over time, they
have attracted other related supporting industries and, in some
cases, created specialised precincts.
These precincts occur as businesses benefit from the
productivity improvements associated with co-location. This
is often a result of reduced input costs (through supply chain
efficiencies), access to shared labour markets, ease of doing
business, and the knowledge that spillovers are associated
with the close proximity related economic activity. Key clusters
in the SEQ have been identified by triangulating cluster
analysis with the RECs identified in ShapingSEQ, to determine
areas of significance for the priority industry clusters.
The economic foundations paper seeks to spatially illustrate
the clusters that are of greatest scale, value and potential to
the traded industry clusters. These economic clusters include
the following:
• Capital City;
• Australia Trade Coast;
• South West Industrial Corridor;
• Ipswich;
• Western Gateway;
• Pacific Motorway;
• Meadowbrook–Loganholme;
• Yatala–Stapylton– Beenleigh;
• Southport– Broadbeach;
• Strathpine-Brendale-Petrie; and
• Kawana.
Priority industries
SEQ Economic Foundation
Clusters Enablers
Economic Spatial Infrastructure
The economic foundation of SEQ
120 SEQ City Deal | Economic Foundations Paper

The economic foundation of SEQ
Capital City
The Capital City area includes roughly the inner 5km of Brisbane; encompassing St Lucia, Herston and Dutton Park. Capital
City is the largest concentration of knowledge-intensive industries, such as education, health, professional services, scientific
and technical services, in the region and state. Notably, it is the region’s key traded health and education cluster as it includes
a number of major established education and health facilities, such as the Royal Brisbane and Women’s Hospital, Princess
Alexandra Hospital, Translational Research Institute, Boggo Road Ecosciences Precinct, Mater Hospital, Lady Cilento Children’s
Hospital, and campuses of the University of Queensland, Griffith University and Queensland University of Technology.
Advanced manufacturing, associated with research and health institutions, is also a key traded industry cluster in the area. For
example, biomedical and pharmaceutical manufacturing benefit from co-location with health institutes through the sharing of
knowledge, facilities and resources.
The Capital City is a key tourism and creative industry cluster with both significant cultural assets, accommodation and tourism
services facilitating this activity.
Financial and professional services, whilst not a priority industry cluster, is a key enabler of activity within this area. Financial
and professional services serves the five priority industry clusters within this economic foundations paper, providing a number
of specialised services to businesses operating in these clusters.
Australia Trade Coast
Australia Trade Coast encompasses the Port of Brisbane, Brisbane Airport and Brisbane Intermodal Terminal, and is connected
by the heavy rail network, Port of Brisbane Motorway and Gateway Motorway.
Enabled by this infrastructure, it has developed as a key location for transport and communication, advanced manufacturing,
and agribusiness industry clusters, as they each derive significant benefits from being in close proximity to the major import
and export hub.
South West Industrial Corridor
South West Industrial Corridor is centrally located within the region. It is a large industrial area serviced by the Acacia Ridge
Intermodal Terminal, Ipswich Motorway, heavy rail network, Warrego Highway, Cunningham Highway and Logan Motorway.
Advanced manufacturing and agribusiness are the primary traded industries within this cluster, dispersed across the large
precinct. In addition, in Nathan / Coopers Plain located in the eastern part of the REC, there is a traded health and education
cluster consisting of research, medical and educational institutions.
Ipswich
The Ipswich REC is included in the Western sub-regional directions in ShapingSEQ, positioned between SEQ’s rural
production area and metropolitan centre. It is serviced by a heavy rail network, Warrego Highway and Cunningham Highway.
It is a key precinct for advanced manufacturing, traded health and education and agribusiness. Notably, this REC includes
defence activity located at the RAAF Base Amberley. This type of activity is a key enabler of the advanced manufacturing
industry cluster.
121SEQ City Deal | Economic Foundations Paper

Western Gateway
Western Gateway is an important economic hub as it is a centre for western SEQ and western Queensland. It is a key import-
export hub serviced by Brisbane West Wellcamp Airport, Intermodal Facility, a heavy rail network, Toowoomba Second Range
Crossing, Gore Highway, Warrego Highway and New England Highway. Enabled by this infrastructure, it has developed as a key
location for advanced manufacturing and transport and communication traded industry clusters.
Pacific Motorway
Pacific Motorway is a linear precinct developed along the enabling infrastructure, the Pacific Motorway and South East Busway.
Advanced manufacturing is the key traded industry cluster within this area.
Meadowbrook–Loganholme
Meadowbrook–Loganholme is a precinct bounded by the Logan Motorway and Pacific Motorway. This precinct is serviced by
passenger rail and includes the Logan Hospital, Griffith University Logan campus and TAFE Queensland, Logan campus. Traded
health and education and advanced manufacturing are key traded industries within this precinct.
Yatala–Stapylton– Beenleigh
Yatala–Stapylton– Beenleigh is a large industrial cluster centred on the Pacific Motorway. Advanced manufacturing and
agribusiness are key traded industries within this precinct.
Southport– Broadbeach
Southport–Broadbeach is the primary activity centre in southern SEQ. This precinct is serviced by light rail and heavy rail
networks and is in close proximity to the Pacific Motorway. Traded health and education and advanced manufacturing are the
key traded industries within the precinct.
Griffith University, Gold Coast campus, Gold Coast University Hospital, Queensland Academy for Health Sciences, Gold Coast
Private Hospital are the institutions which enable the high concentration of traded health and education activity.
Strathpine-Brendale-Petrie
Strathpine-Brendale-Petrie is an emerging cluster for traded health and education with the establishment of the University of
Sunshine Coast campus at Petrie. This precinct serviced by the heavy rail network and has direct arterial access to Gateway
Motorway and Bruce Highway.
Kawana
Kawana is a traded health and industry cluster in northern SEQ. The Sunshine Coast University Hospital enables the high
concentration of traded health and education activity.
The distribution of these economic clusters is highlighted in Figure 58.
The economic foundation of SEQ
122 SEQ City Deal | Economic Foundations Paper

The economic foundation of SEQ
!
o
!
o
!
o
!
o
!
o
!
o
"
"
"
"
"
"
"
"
"
"
"
"
"
"
"
"
"
"
"
"
"
"
"
"
"
"
"
"
"
"
"
"
"
"
"
Esk
Oakey
Noosa
Wondai
Gympie
Robina
Kilcoy
Boonah
Gatton
Warwick
Coomera
Nambour
LaidleyIpswich
Kingaroy
Fernvale Brisbane
Jimboomba
Southport
Cleveland
Caloundra
Beenleigh
Redcliffe
Toowoomba
Kingscliff
Crows Nest
Pittsworth
Beaudesert
Caboolture
Tweed Heads
Springfield
Murwillumbah
Maroochydore
Logan Central
Coolangatta
Legend!
o
International airport
!! Port of Brisbane
!
o
Defence airbaseMajor roadRailwayWaterbody and waterwayCity Deals areaPriority Industry Regional EconomicCluster (REC)Bromelton State Development Area(SDA)Agricultural land
Regional land use categoryUrban FootprintRural Living Area
Oakey
Amberley
South WestIndustrial CorridorREC
AustraliaTradeCoast RECCapital
City REC
Yatala-Staplyton-Beenleigh REC
KawanaREC
Southport-Broadbeach REC
WesternGateway REC
Strathpine-Brendale-Petrie REC
BromeltonSDA
IpswichREC
PacificMotorwayREC
SouthernGateway REC
Figure 58 – SEQ Economic Clusters
Source: Regional and Spatial Planning, Queensland Government. September 2017
SEQ Economic Clusters
123SEQ City Deal | Economic Foundations Paper

Urban growth frontsResidential growth fronts have an important role ensuring that
the traded industry clusters have continued access to labour
markets. ShapingSEQ outlines that the region’s future growth
will be accommodated primarily in existing urban areas
(60 percent) and secondly in expansion areas (40 percent).
The future urban growth fronts include:
Expansion AreaEstimated dwelling take-up to
2041103
Coomera 8,000
Ripley 34,000
Springfield 24,100
Greater Flagstone/ Flinders 27,600
Park Ridge 23,300
Yarrabilba 15,750
Caboolture West 18,000
Southern Redland Bay 1,500
Beaudesert 1,800
Beerwah East 9,500
Caloundra South 16,750
Palmview 6,400
Westbrook 1,200
Total 187,900
Strategic planning to support growthAs the region continues to expand, both the economy
and population, and the growing workforce needs to be
accommodated and well connected to major employment
areas. Growth fronts, together with key urban consolidation
sites, are a critical consideration of the planning for transport
infrastructure in connecting the future residential population of
the region to economic activity centres.
The relationship between housing affordability and cost of
transport to employment should be considered in developing
a range of housing options for workers and their families. As
the growth fronts are located well outside capital city areas,
the gains in housing affordability may be offset by increased
transport to work costs. In addition, the growth fronts may not
offer the amenities and options for housing necessary to attract
the range of knowledge workers required by the expanding
economy.
Given the level of expansion anticipated in the growth fronts,
careful planning and quality urban design is required to ensure
the desired level of amenity of the areas is maintained. These
are also necessary to ensure the social value of the region
matches its growing economic value, to attract the knowledge
workers needed to support the growing economy. Preserving
the natural environment and amenity while allowing for
significant population growth is a major challenge for the
SEQ region.
To enable development in these growth fronts, investment
in catalytic infrastructure is required, including road, water,
sewer, and communications. Water supply and sewerage
projects are investments which will unlock the development
potential of land to support residential growth. Transport
networks play a regionally significant role by connecting the
residential population to economic precincts and key labour
markets. As growth fronts are located on the fringe of urban
areas, strategic investment in these emerging residential
areas is particularly important, as they often require significant
upfront works to enable residential development. The initial
investment in these assets creates an environment that attracts
ongoing, market-led private industry cluster investment and
provides the capacity for future expansions.
103 Department of Infrastructure, Local Government and Planning, 2017, ShapingSEQ Background Paper 1: Grow. Figures for Park Ridge, Springfield and
Palmview are estimates based on applying local government wide take-up rates to SEQ Broadhectare study capacity for the selected areas for the
period 2013 to 2041.
The economic foundation of SEQ
124 SEQ City Deal | Economic Foundations Paper

The economic foundation of SEQ
!
o
!
o
!
o
!
o
Esk
Oakey
Noosa
Wondai
Gympie
Robina
Kilcoy
Boonah
Gatton
Warwick
Coomera
Nambour
LaidleyIpswich
Kingaroy
FernvaleBrisbane
Jimboomba
Southport
Cleveland
Caloundra
Beenleigh
Redcliffe
Toowoomba
Kingscliff
Crows Nest
Pittsworth
Beaudesert
Caboolture
Tweed Heads
Springfield
Murwillumbah
Maroochydore
Logan Central
Coolangatta
Toowoomba
Regional
Somerset
Regional
Noosa
Shire
Sunshine
Coast
City of
Gold Coast
Scenic Rim
Regional
Logan
City
Brisbane
City
Ipswich
CityLockyer Valley
Regional
Moreton Bay
Regional
Redland
City
Caloundra South
Palmview
Beerwah East
Caboolture
West
RipleySpringfield
Park Ridge
Coomera
Yarrabilba
Beaudesert
Greater
Flagstone /
Flinders
Westbrook
Legend
!
o
International airport
!! Port of Brisbane
Regional activity centres network
!Capital city centre
!( Principal
!( Major
!! Principal rural
!! Major rural
Local government boundary
Major road
Railway
Waterbody and waterway
Agricultural land
Regional land use category
Urban Footprint
Rural Living Area
Major expansion area
Southern
Redland Bay
Figure 59 – SEQ Residential Growth Fronts
Source: Regional and Spatial Planning, Queensland Government. September 2017
SEQ Residential Growth Fronts
125SEQ City Deal | Economic Foundations Paper

SEQ Economic FoundationThe SEQ Economic Foundation draws together priority
industries, the spatial location of key clusters, and key
enabling infrastructure (e.g export gateways and transport
corridors). The SEQ Economic Foundation identifies key
economic corridors that serve as both key inter-regional and
cross-regional corridors for passengers and freight. These
have been identified on the basis of their capacity to link key
economic clusters with one another, urban growth areas and
the key export gateways for the region. These include:
• East-West Corridor;
• Capital City Knowledge Corridor;
• South Corridor;
• North Corridor; and
• South-West Corridor.
Corridors are the critical link that bring key areas of economic
activity closer together, as well as efficiently linking productive
precincts and clusters with key trade gateways (i.e. the Port of
Brisbane or key airports across the region). Major infrastructure
investment in rail and road has established corridors to enable
the efficient movement of people and goods through the
region.
Industry has located along these corridors to leverage the
efficient freight access and achieve reduced transport input
costs. SEQ freight corridors, intermodal precincts, air and
sea ports connect industries to export opportunities, support
inbound investment, underpin productivity, and support the
competitiveness of the region’s priority industry clusters.
The regional movement of goods and services is central to
the success of advanced manufacturing, agribusiness, and
transport and communications. Notably, corridors are the
key enabler for transport and communications activity which
is dispersed across clusters within the region. The transport
network is radial in nature, focused on the Capital City, and
extending outward along strategic transport corridors to SEQ’s
economic hubs and beyond, connecting the region to activity
throughout Queensland, Australia and international markets.
At a local level, corridor connections between and within
health and knowledge precincts and tourist destinations are
important for the operation of these precincts but are not
drawn out through the regional lens of this report.
The corridors in SEQ highlight the significance of the Capital
City and Australia Trade Coast RECs through their location at
the cross-roads of all four corridors and their connection to
the region’s largest export gateways. On this basis, initiatives
that effectively link these corridors and the Capital City to the
Australia Trade Coast will be of regional economic importance.
Similarly, the economic foundation map highlights the
importance of better linking the key economic clusters and
growth fronts along the length of each of the corridors. This
is critical to ensuring that the businesses driving SEQ’s
economic growth have access to the greatest pools of labour
to support this growth. Similarly, it is critical to ensuring that
residents across the region can readily access a broad range
of employment opportunities within an acceptable travel time.
The importance of this connectivity has been highlighted
through ShapingSEQ, with analysis on each of the large RECs
highlighting the importance of travel time to work as a key
determinant of employment location and choice. On this basis,
initiatives that effectively unlock new capacity in growth fronts
and economic clusters will be of sub-regional importance.
When unlocking growth, it is necessary to be cognisant of
connecting residents and jobs. Similarly, initiatives that better
link growth fronts with key employment locations (whether
physically or digitally) will be of regional economic importance.
Key relationships between the clusters and growth fronts
across each of the corridors are detailed in the table for
each corridor. In addition to these relationships, it will also
be critical for any investment framework to consider how
investments in consolidation development are strategically
unlocked and delivered to support employment accessibility.
Priority industries
SEQ Economic Foundation
Clusters Enablers
Economic Spatial Infrastructure
The economic foundation of SEQ
126 SEQ City Deal | Economic Foundations Paper

The economic foundation of SEQ
East – West Corridor
The east-west corridor is one of the most significant freight routes for the region and to this end, freight productivity and
minimisation of passenger / freight conflicts along the corridor is critical.
The corridor includes a road freight, rail freight and a future rail freight (Inland Rail) networks. The corridor is bookended by
two export gateways: Wellcamp Airport to the west and the Port of Brisbane and Brisbane Airport in the east. This corridor is
dominated by freight movements but also supports passenger connectivity, currently primarily by private vehicles. Recent
infrastructure investments in this corridor include the Toowoomba Second Range Crossing and the Melbourne to Brisbane
Inland Rail.
The east-west corridor is the primary supply chain corridor in SEQ for agriculture, agribusiness, transport and communications
and resources. It links the rural production areas of SEQ to the Australia Trade Coast and Western Gateway. More broadly, it is
a key link for regional Queensland and interstate freight.
The corridor also has several key clusters of co-located growth fronts and economic activities, including the Westbrook growth
front with the Western Gateway Cluster and nearby Swartz Barracks (Oakey), as well as the Ripley and Springfield growth fronts
with the Inner-West cluster of activities and the RAAF Base (Amberley).
Regional Economic Clusters
• Australia Trade Coast
• South west industrial
corridor
• Ipswich
• Western Gateway
Urban Growth Fronts
• Ripley
• Springfield
• Westbrook
• Under-Utilised Urban
Footprint
Connecting agribusiness and advanced
manufacturing outputs to export gateways.
Gateway to wider western Qld, NSW and Victoria
along national freight corridors.
Efficient linkages between export gateways will
grow priority industries.
Capital City Knowledge Corridor
The Capital City Knowledge Corridor is the state’s and region’s most significant concentration of economic activity. It is the
primary employment centre and the largest agglomeration of knowledge-intensive industries.
This corridor includes roughly the first five kilometres of the Brisbane Central Business District (CBD). The corridor includes
traded health and education, tourism and creative and financial and professional services which supports and is supported by
the five priority industry clusters in SEQ.
Achieving high-quality urban amenity and greater levels of accessibility is central to the development of this dense urban
cluster. The existing knowledge and technology precincts provide opportunity for complementary development to build on the
current high-level health, education and research activities. Growth of these precincts will be complemented by additional
consolidation housing development, locating workers and students near work and education centres.
Tourism and creative activity will continue to grow in the cluster with the development of accommodation and cultural assets,
strengthening the cluster as a key anchor for tourism in the region.
The movement of people to the Capital City Knowledge Corridor is facilitated by a radially-based heavy rail network and
dedicated busway connections. Creation of more efficient linkages within the corridor, between the precincts will enable
increased economic activity. Improved passenger movements within the corridor will be facilitated by both active and public
transport.
Regional Economic Clusters
• Capital city
Urban Growth Fronts
• Under-Utilised Urban
Footprint
Largest agglomeration of knowledge-intensive
industries.
Opportunity for increased innovation through
improved collaboration between research and
business.
Efficient linkages between knowledge precincts to
facilitate ongoing growth.
127SEQ City Deal | Economic Foundations Paper

South Corridor
The south corridor is a key passenger commuter route, while also providing a coastal freight route between Queensland and
New South Wales. It links many economic clusters to the south of the Capital City with the large residential populations of
Brisbane, Logan and the Gold Coast.
The corridor services a diverse range of industry clusters with the emergence of key traded service industry clusters (including
tourism and creative and traded health and education) of critical importance to the growth of the Southern Centre. Similarly,
the advanced manufacturing, traded health and education and agribusiness industry clusters are of importance to the growth
of the Inner-South cluster. The diversity of these growth opportunities will be critical to the skill requirements of workers along
this corridor.
Key co-located clusters and growth-fronts include the importance of the Inner-South cluster to the Southern-Redland Bay
and Yarrabilba growth fronts, as well as continuing connections into the Capital City. Similarly, the Coomera growth front and
the large residential population of the Gold Coast will be reliant on the growth in the Southern Gateway cluster to support
employment opportunity.
This corridor is a key freight corridor for activity between the Logan and Gold Coast local government areas. The South corridor
also links SEQ to northern NSW and south-eastern Australia.
This corridor is established around the existing road freight corridor, the Pacific Highway. It is also supported by the passenger
rail corridor from Brisbane to Robina, which links to the Gold Coast light rail network enabling the movement of people
between Gold Coast precincts.
Regional Economic Clusters
• Pacific Motorway
• Meadowbrook-Loganholme
• Yatala Stapylton-Beenleigh
• Southport-Broadbeach
• Robina Varsity Lakes
• Southern Gateway
Urban Growth Fronts
• Southern Redland Bay
• Yarrabilba
• Coomera
• Under-Utilised Urban
Footprint
Connecting key labour markets to employment
through established public transport networks.
Corridor interspersed with transport and
communications, and advanced manufacturing
industries.
Opportunities for increased collaboration to foster
innovation in southern knowledge precincts.
The economic foundation of SEQ
128 SEQ City Deal | Economic Foundations Paper

The economic foundation of SEQ
North Corridor
The north corridor is a key passenger and local freight transport corridor, linking the rapidly growing regions of Moreton Bay
and the Sunshine Coast with key employment opportunities along the length of the corridor and through to the Capital City.
The corridor also provides a freight route linking central and coastal Queensland centres with the Australia Trade Coast and the
export gateways at the Port of Brisbane and Brisbane Airport.
Traded health and education is a key employment industry cluster along the corridor, with the growth of the Sunshine Coast
University Hospital and the Petrie Mill University providing opportunities for employment growth. Similarly, considerations
around the connecting of residents to employment opportunities in the tourism and creative industry cluster in the Northern
Centre as well as the advanced manufacturing industry cluster in the Inner-North will be important to ensure that these
locations can access the skills and workers that they require to grow.
The north corridor is key to the agribusiness, agriculture and transport and communications traded industries. This corridor
links northern SEQ and Queensland with the Port of Brisbane and Brisbane Airport. This corridor allows for the movement of
tourists to and from the Sunshine Coast tourism and cultural industry clusters, linking destinations within SEQ and airports.
The RECs are not serviced by the heavy freight rail network but are in close proximity to the major road freight corridor, the
Bruce Highway.
The corridor includes a number of large growth fronts, including Caloundra South, Beerwah East and Palmview, all of which are
located in close proximity to the Northern Centre. Considerations for how the Caboolture West growth front is effectively linked
to the inner-north and other key employment clusters along the corridor will be critical in the future.
Regional Economic Clusters
• Strathpine-Brendale
• North Lakes-Mango Hill
• Kawana
• Northern Gateway
Urban Growth Fronts
• Caloundra South
• Beerwah East
• Palmview
• Caboolture West
• Under-Utilised Urban
Footprint
Opportunities to improve passenger connectivity
to emerging traded health and education clusters.
Connecting key tourism destinations and airports.
Urban growth fronts provide new labour pools to
grow priority industries.
South-West Corridor
The south-west corridor is an emerging corridor that has traditionally serviced key freight linkages into New South Wales.
Following the construction of the inland rail project and its connection to the growing Bromelton State Development Area, this
corridor has the opportunity to emerge as a significant economic area.
The corridor is characterised by the expansion of growth fronts and economic activity along the Mount Lindesay Highway and
the parallel standard rail gauge line between Brisbane and Sydney. The importance of the economic growth of this corridor is
highlighted not only by the emerging capacity constraints on industrial land in the inner-west (and therefore the importance
of the SDA), but also through the scale of residential development planned for Greater Flagstone, Park Ridge and Beaudesert
growth fronts.
The transport and communications and advanced manufacturing industry clusters will be key employers along this corridor
into the future and this will drive key considerations for workforce planning.
Regional Economic Clusters
• Bromelton State
Development Area
(potential future REC)
Urban Growth Fronts
• Greater Flagstone
• Beaudesert
• Park Ridge
• Under-utilised urban
footprint
Emerging transport and communications cluster
centred on the Bromelton State Development Area.
Inland Rail provides opportunities to grow priority
industries.
Opportunity to connect growth fronts to emerging
industry cluster areas.
The distribution of these economic corridors relative to the economic clusters is highlighted in Figure 60.
129SEQ City Deal | Economic Foundations Paper

!
o
!
o
!
o
!
o
!
o
!
o
Esk
Oakey
Noosa
Wondai
Gympie
Robina
Kilcoy
Boonah
Gatton
Warwick
Coomera
Nambour
LaidleyIpswich
Kingaroy
Fernvale
Brisbane
Jimboomba
Southport
Cleveland
Caloundra
Beenleigh
Redcliffe
Toowoomba
Kingscliff
Crows Nest
Pittsworth
Beaudesert
Caboolture
Tweed Heads
Springfield
Murwillumbah
Maroochydore
Logan Central
Coolangatta
Legend
!
o
International airport
!! Port of Brisbane
!
o
Defence airbase
Major road
Railway
SEQ Economic Corridors
Waterbody and waterway
City Deals area
Priority Industry Regional Economic
Cluster (REC)
Bromelton State Development Area
(SDA)
Agricultural land
Regional land use category
Urban Footprint
Rural Living Area
Major expansion area
Oakey
Amberley
Capital
City Knowlegdecorridor
Figure 60 – SEQ Economic Foundation – SEQ Region
Source: Regional and Spatial Planning, Queensland Government. September 2017
SEQ Economic Foundation – SEQ Region
The economic foundation of SEQ
130 SEQ City Deal | Economic Foundations Paper

The economic foundation of SEQ
Herston
St Lucia
Kelvin Grove
Auchenflower Gardens Point
South Brisbane
Dutton Park / Buranda
Capital City Centre
Toowong
Figure 61 – SEQ Economic Foundation – Capital City Knowledge Corridor
Source: Regional and Spatial Planning, Queensland Government. September 2017
SEQ Economic Foundation – Capital City Knowledge Corridor
131SEQ City Deal | Economic Foundations Paper

!
o
!
o
!
o
!
o
!
o
!
o
Esk
Oakey
Noosa
Wondai
Gympie
Robina
Kilcoy
Boonah
Gatton
Warwick
Coomera
Nambour
LaidleyIpswich
Kingaroy
Fernvale
Brisbane
Jimboomba
Southport
Cleveland
Caloundra
Beenleigh
Redcliffe
Toowoomba
Kingscliff
Crows Nest
Pittsworth
Beaudesert
Caboolture
Tweed Heads
Springfield
Murwillumbah
Maroochydore
Logan Central
Coolangatta
Legend
!
o
International airport
!! Port of Brisbane
!
o
Defence airbase
Major road
Railway
SEQ Economic Corridors
Waterbody and waterway
City Deals area
Priority Industry Regional Economic
Cluster (REC)
Bromelton State Development Area
(SDA)
Agricultural land
Regional land use category
Urban Footprint
Rural Living Area
Major expansion area
Amberley
Oakey
Capital
City knowledge
corridor
Figure 62 – SEQ Economic Foundation – SEQ Urban Extent
Source: Regional and Spatial Planning, Queensland Government. September 2017
SEQ Economic Foundation – SEQ Urban Extent
The economic foundation of SEQ
132 SEQ City Deal | Economic Foundations Paper

The economic foundation of SEQ
Informing the SEQ City Deal framework The SEQ economic foundations paper has identified both
the industry clusters with the potential to drive the economic
growth to which the region’s leaders aspire, as well as the
key spatial locations and enablers that will be critical to
realising this growth. These insights will be valuable to both an
overarching narrative for the region’s economic future, as well
as providing the foundations for an investment framework for
the region.
This investment framework has been identified as a priority
input for the development of an SEQ City Deal for the
region. The parameters of the City Deal are currently being
negotiated between all three tiers of government (local, state
and commonwealth) and will ultimately culminate in a joint
agreement on a series of investments and initiatives for the
region. Accordingly, it is important that the inputs from all tiers
of government that have informed the development of this
economic foundations paper are reflected in the investment
framework and ultimately the City Deal.
The spatial insights from the foundations paper will be of
relevance to the design of sub-regional scale investments
across SEQ. As identified in the figure below, the Deal will
likely consist of:
• Regional initiatives that have a transformative impact
across SEQ, rather than a single corridor or location.
Examples of the potential scale of these projects include
Inland Rail, Cross River Rail, the Resilient Rivers Initiative or
a regional housing investment program.
• Sub-regional initiatives that have an emphasis on
improving the connection or capacity of a key corridor or
cluster of locations. Examples of the potential scale of
these projects include key public transport links or trunk
infrastructure extensions to unlock residential growth fronts.
• Place-making initiatives that improve a location or precinct.
Examples of the potential scale of these projects include the
Commonwealth financing contribution toward the Petrie Mill
university campus or key transit oriented development and
local amenity improvement investments.
Priority industries
SEQ Economic Foundation
SEQ City Deal Framework consideration
Clusters Enablers
Economic Spatial Infrastructure
133SEQ City Deal | Economic Foundations Paper

Figure 61 demonstrates how the corridors, clusters
and urban growth fronts identified through the economic
foundations paper provide a potential organising frame
for the consideration of sub-regional initiatives.
The SEQ City Deal framework will require further design
parameters to determine how individual projects or programs
align to and enable economic activity in these locations. This
will require detailed consideration of the scale of the projects
and their alignment to key enablers for industry development
across the region. This work is ongoing and will be presented
separately during the development of the SEQ City Deal.
Regional initiatives
Sub-regional initiatives
Re
gio
na
l E
con
om
ic C
lus
ters
East-West
Corridor
Capital City
Knowledge
Corridor
South CorridorSouth-West
Corridor North Corridor
• Australia Trade
Coast
• South west
industrial corridor
• Ipswich
• Western Gateway
• Capital City • Pacific Motorway
• Meadowbrook-
Loganholme
• Yatala Stapylton-
Beenleigh
• Southport-
Broadbeach
• Robina Varsity
Lakes
• Southern Gateway
• Bromelton SDA • Strathpine-
Brendale-Petrie
• North Lakes-
Mango Hill
• Kawana
• Northern Gateway
Urb
an
Gro
wth
Fro
nts
• Ripley
• Springfield
• Westbrook
• Under-Utilised
Urban Footprint
• Southern Redland
Bay
• Yarrabilba
• Coomera
• Under-Utilised
Urban Footprint
• Greater Flagstone
• Beaudesert
• Park Ridge
• Under-Utilised
Urban Footprint
• Caloundra South
• Beerwah East
• Palmview
• Caboolture West
• Under-Utilised
Urban Footprint
Place making initiatives
Figure 63 – SEQ clusters, corridors and growth fronts that will underpin regional growthSource: CTT, Queensland Government
The economic foundation of SEQ
134 SEQ City Deal | Economic Foundations Paper

Appendix A
* Under the former Queensland State Government the CTT, as part of the former Department of Infrastructure, Local Government and Planning, engaged
with the State Government Departments included in Appendix A. Following the State Election in November 2017 there were a number of Departmental
adjustments through Machinery of Government changes. As the SEQ City Deal continues to progress the CTT will continue to engage with relevant
government agencies.
135SEQ City Deal | Economic Foundations Paper
Appendix A: List of stakeholdersLocal Government
• Brisbane City Council
• Gold Coast City Council
• Ipswich City Council
• Lockyer Valley Regional Council
• Logan City Council
• Moreton Bay Regional Council
• Redland City Council
• Scenic Rim Regional Council
• Somerset Regional Council
• Sunshine Coast City Council
• Toowoomba Regional Council
• Council of Mayors (SEQ)
State Government Departments*
• Department of Agriculture and Fisheries
• Department of Education and Training
• Department of Infrastructure Local Government
and Planning
• Department of Science, Information Technology
and Innovation
• Department of State Development
• Department of the Premier and Cabinet
• Department of Tourism, Major Events and Small Business
and the Commonwealth Games
• Department of Transport and Main Roads
• Queensland Treasury
• Trade and Investment Queensland
Commonwealth Government
• PM&C, Commonwealth Government
Queensland Government Cities Advisory Panel
• Prof Greg Clark CBE, Global Advisor on City Development
(The Business of Cities)
• Geoff Roberts (Deputy Chief Commissioner and Economics
Commissioner, Greater Sydney Commission)

Appendix B – ReferencesDelgado, M., Porter, M. E., & Stern, S. (2014). Defining Clusters
of Related Industries. Cambridge: National Bureau of Economic
Research.
Porter, E. M. (1990). The Competitive Advantage of Nations.
New York: The Free Press.
Porter, E. M. (2003, August/October). The Economic
Performance of Regions. Regional Studies (37.6&7), 549-578.
Porter, M. E. (1998, November/December). Clusters and the
New Economics of Competition. Harard Bussines Review, 77-
90.
Appendix B
136 SEQ City Deal | Economic Foundations Paper

Image creditsImages courtesy of Tourism and Events
Queensland/Jason Charles Hill
Location Page
Natural landscape, Scenic Rim 54
Koala, Queensland 58
Images courtesy of Tourism and Events
Queensland
Location Page
Movieworld, Gold Coast 103
Images courtesy of Port of Brisbane Pty Ltd
Location Page
Aerial of Port of Brisbane 71
Images courtesy of Ben Vos Productions
Location Page
QIMR Berghofer Medical Research Institute, Brisbane Cover
Volunteer Surf Life Savers, Noosa Main Beach, 10
Noosa Heads
Redcliffe, Moreton Bay 16
State Disaster Coordination Centre, Brisbane 18
Active lifestyle, Brisbane River 20
Tourism and technology, Holoverse, Gold Coast 30
Kitefest, Redcliffe, Moreton Bay 33
Sir Leo Hielscher Bridges, Gateway Motorway, Brisbane 34
QUT Robotics, Brisbane 43
QIMR Berghofer Medical Research Institute, Brisbane 44
Kirra Beach, Gold Coast 46
Transport, Brisbane 49
Innovation Centre, Sunshine Coast 53
Evolve Skateboards, Gold Coast 62
Roadworks, Kawana Waters, Sunshine Coast 101
Festival of Lights, Gold Coast 105
Image credits
137SEQ City Deal | Economic Foundations Paper

138 SEQ City Deal | Economic Foundations Paper

139SEQ City Deal | Economic Foundations Paper

ISBN 978-0-9875431-1-0Queensland Government
Level 12, 1 William StreetBrisbane Qld 4000tel 13 QGOV (13 74 68)
www.qld.gov.au