quenching and tempering hardness response of front axle...
TRANSCRIPT

Quenching and tempering hardness response of front axle steel beams
Different material properties during quenching and tempering
Släckhärdning och anlöpning av hårdhetsresponsen hos fram axel balkar
Simon Zemui
Faculty of Health, Science and Technology
Degree Project for Master of Science in Engineering, Mechanical Engineering
30 hp/ ECTS Credits
Supervisors: Pavel Krakhmalev (KAU), Ramesh Valisemmagar (BFK)
Examiner: Jens Bergström
Date: 2017-08-10

Acknowledgements
This thesis was completed from January 2017 to June 2017 in cooperation between Bharat Forge Kilsta
AB and Karlstad University.
I would like to express my gratitude to my proficient supervisors Pavel Krakhmalev, Ramesh
Valisemmagar and Margareta Magnusson for their help and guidance during the process of completing
this thesis.
I would wish to thank Christer Burman at Karlstad University for his help with the equipment’s at the
lab, as well as Ruslan Sevastopolev at Uddeholm that helped with the analysis of the retained austenite.
Another thanks to Margareta Magnusson and all the workers at Bharat Forge Kilsta AB for all their help
during the surface/core hardness test.
Karlstad 2017-08-10
Simon Zemui

Summary
The aim of this thesis was to investigate what the relation is between as-quench hardness and final
surface hardness for steel beams is, depending on what tempering temperature is used. Also explain how
chemistry, dimension and microstructure effects the final mechanical properties of the front axle beam.
For this a review of literature concerning the effects was completed.
Hardness measurement on the surface was performed on the ends of the beam (bottom and top). This
hardness measurement was performed on 6 different front axle articles of the same material (41CrS4)
and 2 different front axle articles of another material (40CrMo4). The relation diagram gives an
estimation of what type of tempering temperature is needed to achieve the final hardness that is desired.
Because the relation was done with some inconsistences it can’t be said to give a perfect answer. The
relation diagrams only work for material 41CrS4 and 40CrMo4.
For the core hardness test, 2 articles of 41CrS4 and one article of 40CrMo4 was measured on 5 different
position on the cross-section, the beams for the respective articles were taken from quenched state and
quenched+tempered. The beam dimensions have a significant effect when it comes to cooling down the
part and achieve as close to uniform hardness as possible. Even though the Middle point of the I-section
sample is one of the closest cores to the surface, it has a softer core compared with the other cores.
While there exists hardness difference after quenching between different points in the core they even out
after tempering. When comparing the core hardness with the surface hardness it can be said that the
surface hardness is not as hard as the core because of decarburization.
The microstructure analysis was done on 2 articles of 41CrS4 and one article of 40CrMo4. Samples
from the 3 articles is taken from both the as-quenched state and quenched+tempered state. From the
optical microscope it could be seen, that the surface of the beams decarbonizes leading to a higher
amount of ferrite at the structure and softer surface. Because of this 15 mm into the material is harder
than at-surface. Decarburization of the 41CrS4 steels made it so that what should have been a martensite
and bainite dominated surface became a ferrite and bainite dominated.
To decide the actual amount of retained austenite in the sample an XRD-analysis was performed. The
XRD-analysis is done only for one article type of 41CrS4. From the front axle beam three samples of
three different locations (bottom, middle, top) was taken for the analysis.
For the theoretical calculation of the retained austenite vs the actual amount it can be said that is a very
good representation of the total amount of retained austenite in the product. But the theoretical
calculation deviates a bit from the actual amount at the top part of the beam.
Sammanfattning
Syftet med denna avhandling var att undersöka vad relationen är mellan härdat ythårdhet och slut
ythårdhet för stålbalkar är, beroende på vilken anlöpnings temperatur som används. Tar också upp hur
kemi, dimension och mikrostruktur påverkar de sista mekaniska egenskaperna hos framaxel balken. För
detta genomfördes en genomgång av litteraturen om effekterna.
Hårdhetsmätning på ytan utfördes på balkens ändar (botten och toppen). Denna hårdhetsmätning
utfördes på 6 olika främre axelartiklar av samma material (41CrS4) och 2 olika främre axelartiklar av
annat material (40CrMo4). Relationsdiagrammet ger en uppskattning av vilken typ av
anlöpningstemperatur som behövs för att uppnå den slutliga hårdheten som önskas. Eftersom
förhållandet gjordes med vissa inkonsekvenser kan det inte sägas ge ett perfekt svar.
Relationsdiagrammen fungerar endast för material 41CrS4 och 40CrMo4.
För kärnhårdhetstestet mättes 2 artiklar av 41CrS4 och en artikel av 40CrMo4 i 5 olika positioner på
tvärsnittet, stålen för respektive artiklar togs från härdat tillstånd och härdat + anlöpt. Dimensionerna har
en signifikant effekt när det gäller att kyla ner delen och uppnå så nära enhetlig hårdhet som möjligt.
Även om mittpunkten i I-sektionsprovet är en av de närmaste kärnorna till ytan, så har det en mjukare
kärna jämfört med de andra kärnorna. Det finns hårdhetsskillnad efter härdning mellan de olika punkter
men de jämnar ut sig efter anlöpningen. När man jämför kärnhårdheten med ythårdheten kan man säga
att ythårdheten inte är så hård på grund av avkolning.
Mikrostrukturanalysen gjordes på 2 artiklar av 41CrS4 och en artikel av 40CrMo4. Prover från de 3
artiklarna tas från både härdat tillstånd och härdat + anlöpt tillstånd. Från det optiska mikroskopet kunde
man se att stålbalkens yta har blivit utsatt för avkolning vilket leder till en högre mängd ferrit vid
strukturen och en mjukare yta. På grund av detta, så är 15 mm in i materialet hårare än vid ytan.
Avkolning av 41CrS4 stål gjorde så att det som borde ha varit ett martensit och bainit dominerat yta blev
istället ferrit och bainit dominerat.
XRD-analysen görs endast för en artikelart av 41CrS4. Från fram axelbalken togs tre prov från tre olika
platser (botten, mitten, toppen) för analysen. För att bestämma den verkliga mängden restaustenit i
provet utfördes en XRD-analys. För den teoretiska beräkningen av den rest austeniten jämfört med det
faktiska beloppet kan man säga det är en mycket bra representation av den totala mängden kvarhållen
austenit i produkten. Men den teoretiska beräkningen avviker lite från den faktiska mängden vid stålens
övre del.
Table of contents
1. Introduction ........................................................................................................................................................ 1
1.1 Background ....................................................................................................................................................... 1
1.2 Problem formulation ........................................................................................................................................ 1
1.3 Bharat Forge Kilsta ............................................................................................................................................ 1
2.Theory ...................................................................................................................................................................... 2
2.1 Hardening ......................................................................................................................................................... 2
2.2 Hardenability .................................................................................................................................................... 2
2.2.1 Effect of alloy on hardenability during quenching .................................................................................... 3
2.3 Tempering ......................................................................................................................................................... 4
2.3.1 Effect of alloy on tempering ...................................................................................................................... 6
2.4 Grain growth ..................................................................................................................................................... 7
2.5 Austenite-Bainite .............................................................................................................................................. 7
2.5.1 Displacive theory ....................................................................................................................................... 8
2.5.2 Diffusive theory ......................................................................................................................................... 8
2.6 Empirical model ................................................................................................................................................ 8
2.7 Retained austenite............................................................................................................................................ 9
2.7.1Retained austenite problems ................................................................................................................... 10
2.7.2 Behavior ................................................................................................................................................... 10
2.8 Martensite ...................................................................................................................................................... 11
2.9 Austenitizing ................................................................................................................................................... 12
2.10 Decarburization ............................................................................................................................................ 14
3.Experimental.......................................................................................................................................................... 15
3.1 Experimentals ................................................................................................................................................. 15
3.1.1 Polymer quenchants ................................................................................................................................ 15
3.1.2 Composition, mechanical properties and heat treatment ...................................................................... 16
3.2 Heat treatment process .................................................................................................................................. 18
3.2.1Hardening ................................................................................................................................................. 18
3.2.2Tempering ................................................................................................................................................. 18
3.3 Beams ............................................................................................................................................................. 18
3.4 Beam Cutting .................................................................................................................................................. 21
3.5 Theoretical calculation ................................................................................................................................... 21
3.6 X-ray diffraction .............................................................................................................................................. 22
3.7 Microstructure ................................................................................................................................................ 23
3.8 Hardness of core ............................................................................................................................................. 24
4.Results ................................................................................................................................................................... 25
4.1 Actual retained austenite in comparison to the theoretical calculation ........................................................ 25
4.2 Microstructure hardness ................................................................................................................................ 26
4.2.1 Microstructure surface and core ............................................................................................................. 30
4.3 Hardness at surface and core ......................................................................................................................... 34
5.Discussion .............................................................................................................................................................. 39
5.1 Actual retained austenite in comparison to the theoretical calculation ........................................................ 39
5.2 Microstructure surface and core .................................................................................................................... 39
5.3 Composition, alloying, heat treatment .......................................................................................................... 40
5.4 Hardness at surface and core ......................................................................................................................... 41
5.5 Relation between as-quench hardness and final surface hardness. .............................................................. 42
6.Conclusions ............................................................................................................................................................ 45
7.Future work ........................................................................................................................................................... 46
8. References ........................................................................................................................................................... 47
8.Appendix ................................................................................................................................................................ 49
Appendix 1 ............................................................................................................................................................ 49
Appendix 2 ............................................................................................................................................................ 50
Appendix 3 ............................................................................................................................................................ 55
Appendix 4 ............................................................................................................................................................ 73
Appendix 5 ............................................................................................................................................................ 77
1
1. Introduction
1.1 Background
At Bharat Forge Kilsta (BFK) parts are manufactured in alloy steel using hot forging method. In some
cases, the forged parts are undergoing heat treatment processes (quench & tempering) to improve the
mechanical properties.
This is work refers to the products which undergo quench & tempering process to improve mechanical
properties and achieve harder microstructure. Front axle beam is the biggest and most heavy forging
parts in automobile, and it is one of the most important safety parts, which requires the front axle to be
of high strength and fatigue strength. The parts are symmetrical shape, complex shape but have big
section fluctuation, its cross section is not only deep but also narrow, which makes it one of the most
difficult long shaft type forging.
Previous trials at Bharat Forge Kilsta have indicated a fluctuation of the hardness for the steel beams.
It’s desirable to understand what is the thing affecting the whole process.
1.2 Problem formulation
The aim of this thesis was to investigate what the relation is between as-quench hardness and final
surface hardness for steel beams is, depending on what tempering temperature is used. Also explain how
chemistry, dimension and microstructure effects the final mechanical properties of the front axle beam.
For this a review of literature concerning the effects was completed
The experimental part of the thesis is limited to address the hardness after quenching and after tempering
at the surface and at the core, calculation of the actual retained austenite and the microstructure of the
beam this was also done on the different dimensions of the beam.
The purpose is so it will be easy to get the final material properties that you want without having guess
the temperature and time that it has to be heat treated at.
1.3 Bharat Forge Kilsta
Bharat Forge Limited (BFL), the Pune based Indian multinational is a technology driven leader in metal
forming having ten manufacturing facilities across the world, serving different sectors including
automotive, power, oil and gas, rail, construction & mining, aerospace and marine.
It is the world’s largest forging company with manufacturing facilities in India, Sweden, Germany,
France and North America. In the 2005 Bharat Forge acquired Imatra Kilsta AB located in Karlsoga in
Sweden along with its wholly owned subsidiary, Scottish stampings, Scotland. It was after that Imatra

2
Kilsta AB company name changed to Bharat Forge Kilsta AB. Right now, Bharat Forge Kilsta is among
the leading forging companies and among the largest heavy-duty crankshaft producers in Europa. Bharat
Forge Kilsta deliver only to the European automotive industry. Their main product that they are selling
include crankshafts, structural beams, steering knuckles link arms for heavy trucks and passenger cars.
Here they offer the highest quality steels, forged to the highest standards, backed up by research and
development departments and quality control systems that will give the customer the very best products
and value for money [1].
2.Theory
This chapter will attempt to build a theoretical background for this thesis. First, theory surrounding heat
treatment of steel will be presented, followed by a part presenting how alloying effect the heat treatment.
2.1 Hardening
The general process of hardening a steel for example a steel beam involves three steps:
1. Austenitization: the beam is heated to the austenitization temperature to achieve 100% austenite
in the beam. The austenitization temperature is depended on the carbon composition of the steel.
2. Quenching: The hot beam is then quickly cooled by immersion in oil or water.
3. Tempering: To then remove the brittleness of the beam, it is heated to a low temperature.
In order for the beam to be fully harden, the austenite must transform into martensite throughout the
material from the surface to the center of the beam. The only reason that perlite and bainite forms on the
old austenite grain boundaries is because of the temperature does not fall below the Ms temperature fast
enough to avoid their formation [2].
2.2 Hardenability
For metal alloy, the depth up to which a material is hardened after going through a heat treatment
process is called the hardenability. The unit that hardenability is measured at is the same as of length. It
acts as an indicator of how deep into the material a certain hardness can be achieved. Do not confuse it
with hardness, which is a measure of a materials resistance to scratching or indention. Hardenability is
an important property for welding, since it is proportional to weldability, for the case of how easy it is to
weld a material.
If we follow the previous example of quenching a steel beam, the area in contact with the water/oil
immediately cools down and achieves a balance with the medium. But the inner depths of the material
however, do not cool down quite so rapidly for larger work-pieces, this leads to the cooling rate may be
slow enough to allow the austenite to fully transform into a structure that is neither bainite or martensite.

3
This will result in a work-piece that does not have the same crystal structure throughout the whole
structure, with a harder surface and a softer core. The softer core in this example is pearlite which is
some combination of ferrite and cementite.
The hardenability of steels, is a function of the grain size of the austenite and the carbon content and
other alloying elements. The corresponding importance of the various alloying elements is calculated
and this is done by finding the equivalent carbon content of the material. The liquid substance that is
used for quenching the material influences the cooling rate because of varying specific heats and thermal
conductivities. Substances like water and brine cools a lot faster than oil or air. The geometry also
effects the cooling rate of the part: if two samples with equal volume is quenched, the part with the
higher surface area will cool down faster [3].
2.2.1 Effect of alloy on hardenability during quenching
The carbon content in the material is not the only thing that is affecting the hardenability, alloying
elements does it to. When it comes to hardenability, alloying elements can be separated into two
different groups according to whether they are austenite stabilizers (such as nickel, manganese, and
copper) or ferrite stabilizers (such as silicon, molybdenum, titanium, vanadium, zirconium, tungsten and
niobium). Austenite stabilizers require a much higher alloying addition than ferrite stabilizers for an
equivalent increase in hardenability. However, with too many of these ferrite stabilizers, the
“competitive” process of carbide precipitation in the austenite diminishes the austenite of both alloy
addition and carbon, which leads to lower hardenability. Because of the precipitation, it will also
produce grain refinement, which will further decrease hardenability. The important elements for this
thesis are the following [4]:
• Manganese- as long as the amount of manganese is above 0.8% it contributes markedly to
hardenability. Manganese effect up to 1.0% is stronger in low- and high-carbon steels if
compared to medium-carbon steels.
• Nickel – is very much like manganese at low alloy additions, but does not contribute as much at
high alloy levels. Nickel is also affected by how much the carbon content is, where medium
carbon steels having the greatest effect.
• Molybdenum – this alloying element is most effective in improving hardenability. It has a much
greater effect in high-carbon steels than in medium-carbon steels. Molybdenum’s multiplying
factor is depending on two alloying elements, with the presence of chromium it will decrease and
with the presence of nickel it will enhance the hardenability effect of molybdenum.
• Chromium- behaves like molybdenum but has its greatest effect in medium-carbon steels.
4
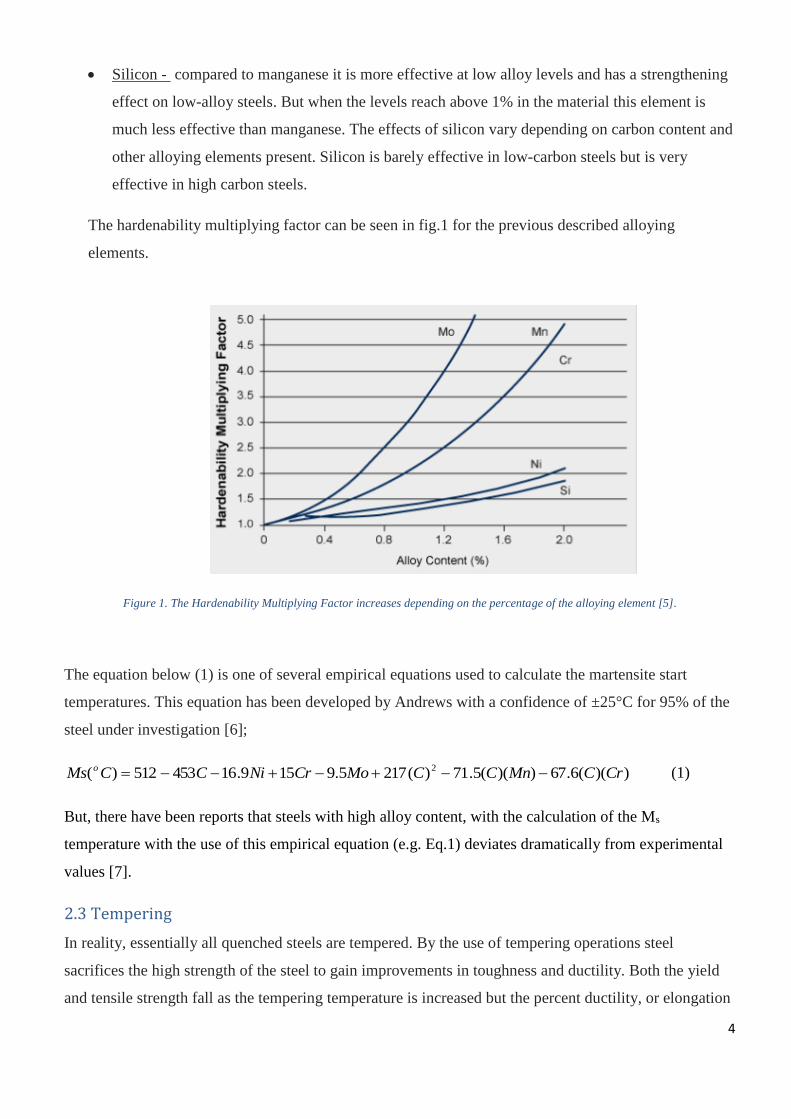
• Silicon - compared to manganese it is more effective at low alloy levels and has a strengthening
effect on low-alloy steels. But when the levels reach above 1% in the material this element is
much less effective than manganese. The effects of silicon vary depending on carbon content and
other alloying elements present. Silicon is barely effective in low-carbon steels but is very
effective in high carbon steels.
The hardenability multiplying factor can be seen in fig.1 for the previous described alloying
elements.
Figure 1. The Hardenability Multiplying Factor increases depending on the percentage of the alloying element [5].
The equation below (1) is one of several empirical equations used to calculate the martensite start
temperatures. This equation has been developed by Andrews with a confidence of ±25°C for 95% of the
steel under investigation [6];
))((6.67))((5.71)(2175.9159.16453512)( 2 CrCMnCCMoCrNiCCMs o (1)
But, there have been reports that steels with high alloy content, with the calculation of the Ms
temperature with the use of this empirical equation (e.g. Eq.1) deviates dramatically from experimental
values [7].
2.3 Tempering
In reality, essentially all quenched steels are tempered. By the use of tempering operations steel
sacrifices the high strength of the steel to gain improvements in toughness and ductility. Both the yield
and tensile strength fall as the tempering temperature is increased but the percent ductility, or elongation
5
increases.
There are more than one process that occurs in the steel during tempering that result in the loss of
strength and the gain in toughness and ductility. First, because of the quenching there exist a high degree
of volume stress in the steel produced by the formation of higher volume per atom martensite phase is
relieved. Then, a series of internal structure changes occur that is often divided into three stages of
tempering [4]:
• Stage 1: here very small carbides are formed in the martensite- they are so small (around 10 nm)
that they can only be seen in an electron microscope. These carbide that are formed first are
metastable carbides (that is, these carbides do not appear on the equilibrium phase diagram).
Eosilon carbide (Fe2.4C) is what forms in hypoeutectoid steels.
• Stage 2: any retained austenite breaks down into carbides and ferrite. The percent retained
austenite will only have a significant importance in high-carbon steels.
• Stage 3: the metastable carbides from stage 1 are replaced with small particles of cementite, they
are the stable carbide of steels. This stage occurs at high tempering temperatures.
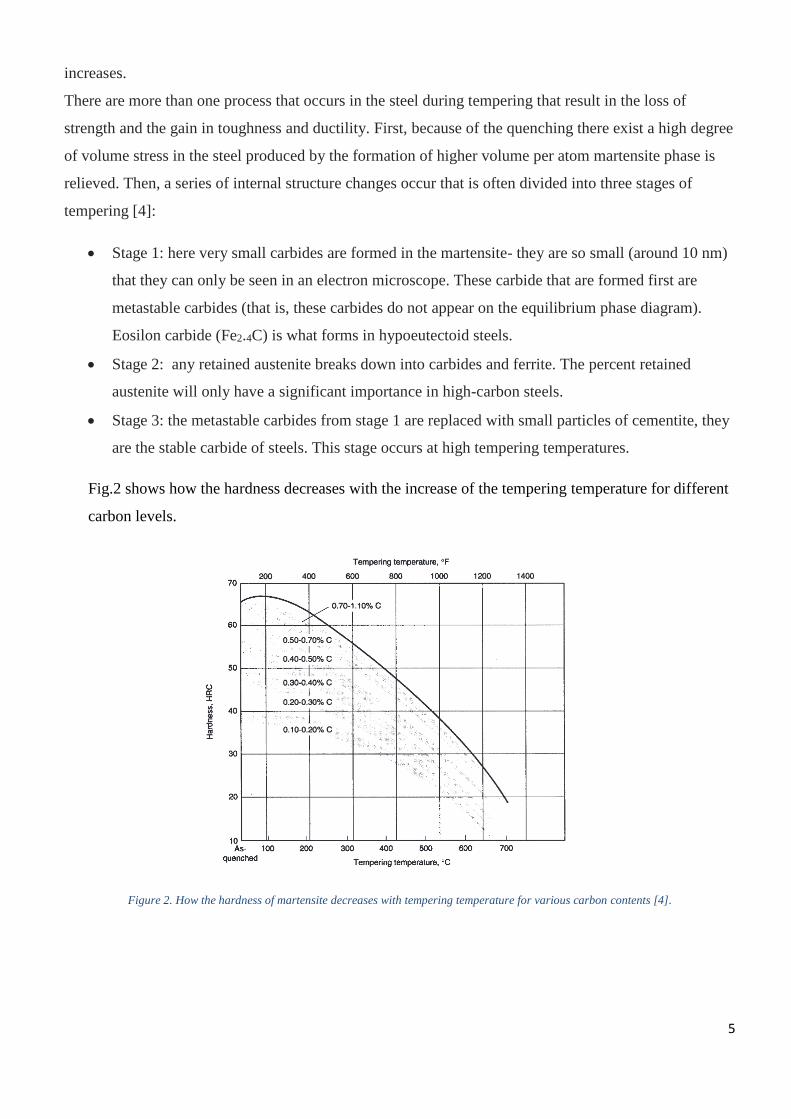
Fig.2 shows how the hardness decreases with the increase of the tempering temperature for different
carbon levels.
Figure 2. How the hardness of martensite decreases with tempering temperature for various carbon contents [4].

6
2.3.1 Effect of alloy on tempering
With the addition of alloying elements some of them will help with retard the degree of softening during
tempering. Some elements are more effective than others. The alloying element here can be separated
into two groups the alloys that act as solid solid-solution strengtheners and the strong carbide-forming
elements. The alloys that are solid-solution strengtheners (silicon, nickel, manganese and aluminum)
remain dissolved in the martensite and do not significantly retard the softening effect of the material.
The elements that are the most effective in retarding the rate of softening during tempering are the strong
carbide-forming elements such chromium, molybdenum, vanadium, titanium and niobium. The metal
carbides that are produced from these elements are harder than martensite and they have a fine
dispersion because the diffusion of the carbide-forming elements is slower than the diffusion of carbon.
Because of the lower diffusion rate the carbide-forming elements inhibits the coarsening of cementite
and thus retards the rate of softening at elevated temperatures. The important elements for this thesis the
following [4]:
Manganese- by increasing the amount of manganese in the material the hardness will increase of
tempered martensite by retarding the coalescence of carbide. This prevent grain growth in the ferrite
matrix. By increasing the total percentage of manganese’s in the steel, will cause a substantial increase
in the hardness of tempered martensite.
Nickel- with the addition of nickel, the effect on the hardness of tempered martensite is relatively small.
Which acts the same on all tempering temperatures. Nickel is not a carbide former, because of that its
considered that it influences with weak solid-solution strengthening.
Molybdenum- Effects the martensite by retarding the softening at all tempering temperatures. When the
tempering temperature reaches above 540 °C, molybdenum separate carbide phase and thus keeps the
carbide particles small and numerous and by that keeps the carbide particles small and numerous. Also,
molybdenum reduces the sensitivity to tempering embrittlement.
Chromium- behaves like molybdenum, is a strong carbide-forming element that retard the softening of
martensite at all temperatures. Also, by exchanging some of the iron to cementite, the fusion of carbides
is retarded.
Silicon- increases the hardness of tempered martensite. Silicon also has a significant retarding effect on
softening at 316°C
7
2.4 Grain growth
When austenite is heated to higher temperatures or held for longer times at elevated temperature, the
average grain size increases in the steel. This is a process where grains grow occurs by smaller grains
shrinking in size until they disappear and larger grains growing in size, which will lead to an increase in
the size of the average grain. The cause of grains growing is because of the surface tension force in the
austenite-austenite grain boundaries [2].
To improve the toughness of the steel it is important to keep the grain size of steels as small as possible.
Cast or wrought steels will arrive with a certain grain size. The grain size can then be changed
significantly by further heat treatment or forging operations and it is essential to understand what control
these changes. When going through heat treating to form martensite, toughness is enhanced by fine
grained austenite, because this will result in a finer lath or plate size in martensite [2].
Just like diffusion, grain growth is very sensitive to what the temperature is, going faster when
temperature is higher, where the thermal energy that is increasing is causing larger vibration of the
atoms. Austenite grain growth are very sensitive to the austenitizing temperature, and that is why it is
important to not austenitize the steel at temperature higher than needed to homogenize the austenite. An
example to see what contributes the most to grain growth if its either the austenitization temperature or
the austenitization hold time, can be proved by the following example [2]. For this example, which was
performed by Verhoeven and John D, 1060 steels are used. First test: by raising the austenitization
temperature with a 6 min hold from 760 to 930 °C will cause the grain size to nearly triple in size, from
33 to 94µm. second test, by instead increasing the austenitization hold time at 930°C from 6 to 120 min
which is a factor of 20 will cause the grain size to change from 94 to 174 µm, that is a factor of only
1.85. In conclusion like most metallurgy rate processes, grain growth is a lot more sensitive to
temperature than time [2].
2.5 Austenite-Bainite
The bainite reaction has many similar features that can be found in both the pearlite and martensite
reactions. The transformation of perlite involves the redistribution of carbon which is then followed by a
structure change, unlike the martensite transformation that only involves the structure change alone, and
when it comes to the bainite transformation it involves a structure change followed by the redistribution
of carbon which precipitates as carbide in the steel. Therefore, the austenite-bainite decomposition can
be regarded as a martensite transformation that involves the diffusion of carbon atoms, so that in this
case makes the rate of coherent growth slow compared with that of martensite.
8
Bainite resides in a region between two different process in a temperature range where it is cooled to
slow to achieve full martensitic structure but faster to not acquire perlite structure. A further distinction
is often made to bainite, this distinction can be separated into two forms, known as lower and upper
bainite. Lower bainite is very similar to martensite in appearance and can be hard to tell what is what,
while upper bainite have an acicular structure (looks like grains or needles). Lower bainite usually forms
between 250 and 400°C [8], upper bainite usually forms between 400 and 550°C. The metallographic
appearance of the transformed steel is altering continuously between these two forms, the actual
structure is found to being governed by the diffusion rate of the carbon, which is directly depending on
the temperature of the transformation. The hardness of the steel product is increasing continuously with
decreasing temperature, upper bainite being softer than lower bainite but being harder than most fine
pearlite. There is some controversy over some of the more specifics of bainite’s transformation
mechanism; there are two theories of how it may occur and they are represented below [9].
2.5.1 Displacive theory
One of the two theories on the specific formation mechanism for bainite is that it happens by a shear
transformation, just as in martensite. This is said to cause a stress-relieving effect, which is proved by
the orientation that exist in bainitic microstructures. There exist, however, “similar” not identical stress-
relief effects seen in transformations that can’t be considered martensitic in nature. The relief associated
with bainite can be counted as an invariant-which is a plane strain with a large shear component.
Diffusion only occurs by this theory during the formation of the carbide phase that usually is cementite
between the ferrite plates [10].
2.5.2 Diffusive theory
The diffusive theory is based on the assumption that a bainitic ferrite plate grows with a similar
mechanism as windmanstätten ferrite at higher temperatures. Because of that its growth rate is
depending on how rapidly carbon can diffuse from the growing ferrite into the austenite. A common
misunderstanding is that this mechanism rules out the possibility of coherent interfaces and surface
relief. Instead it’s fact that formation of Widmanstätten ferrite is controlled by carbon diffusion which
shows a similar surface relief [10].
2.6 Empirical model
Several efforts have been made throughout the ages to describe the relationship between the fraction
transformed austenite and temperature. The first models were derived from collections of data regarding
the amount of retained austenite at different temperatures below Ms so these models where empirical.
9
One of these models was presented by Marburger and Koisten [13]. What they investigated were the
martensitic transformation in plain carbon steels and pure iron-carbon alloys. The amount of retained
austenite in the material was measured by x-ray diffraction. In this model, the only variable that has to
be calculated beforehand or acquired is the quenching temperature and martensitic starting temperature.
Marburger and Koisten acquired the Martensitic starting temperature from previous works. The volume
fraction of the amount of austenite was plotted logarithmically against the undercooling below the Ms.
The following equation below was acquired by the given fractions of martensite:
))(1010,1( 2qs TM
eV
(2)
Where V is the volume fraction of retained austenite, Ms is the martensitic starting temperature and Tq
is the quenching temperature.
Marburger and Koisten assumed that the effect of austenitizing temperature, chemical composition and
some other variables can only be seen with the change of Ms. Because of how this equation is set up the
amount of retained austenite can never reach zero, in conclusion the there is no temperature in which the
martensitic transformation reaches completion.
2.7 Retained austenite
Retained austenite (RA) is austenite that does not transform to martensite after quenching. So, retained
austenite occurs when steel is not quenched to the martensite finish temperature (Mf); this is a
temperature low enough to form 100% martensite. Alloys containing more than 0,30% carbon will have
a Mf temperature that is below room temperature, this may lead to significant amounts of retained
austenite intermingled with martensite at room temperature. Retained austenite have a very specific
crystalline form of steel and iron. When looking at the microstructure retained austenite crystals is the
light-colored areas. The total amount of retained austenite is a function of the carbon content, alloy
content (especially manganese and nickel), subsequent thermal and/or mechanical treatments and
quenchant temperature.
Because of the specific heat treatment and steel chemistry, the total amount of retained austenite can
vary from over 50% of the structure to nearly zero. When the total amount of retained austenite reaches
above >15% it can be detected and estimated by optical microscopy, to get a more accurate result
specialized equipment and techniques, such as x-ray diffraction method are required, that can accurately
measure the amount of retained austenite as low as 0.5%.
One method to reduce the amount of retained austenite in the steel is by tempering. The key here is to
hold for a sufficient amount of time at a temperature [14].
10
2.7.1Retained austenite problems
The characteristics that gives retained austenite is unique properties is also the thing that are responsible
for significant problems in most applications. It’s very known that austenite exists at higher temperatures
for normal phase of steel, but not at room temperatures. Because of this retained austenite exist in a
range that is outside its normal temperature range, it is metastable. What this means is that when the
amount of retained austenite is given the opportunity, it will transform or change from austenite to
martensite. In addition, because retained austenite and martensite does not have the same volume it will
cause the volume to increase which induces a great deal of internal stress in a component, this is often
manifested as cracks [14].
2.7.2 Behavior
Martensite is strong, hard and brittle while austenite is tough and soft. In some instances, a mixture of
both of them creates a composite material that compensates for the short comings of both structures. For
any application, mechanical properties are affected depending on the percentage retained austenite that’s
in the product. Retained austenite affect the following properties listed below [14]:
• Dimensional stability: Retained austenite will transform to martensite as long as the temperature
drops much lower to which it was quenched, or if the retained austenite is subjected to high
levels of mechanical stress. Martensite has a body center tetragonal crystal structure, has a larger
volume than austenite which has a face center cubic structure that it replaces. Where this
transformation occurs at, the volume will increase by 4-5% in the microstructure at room
temperature. If this change in volume is great enough the dimensional change could lead to
growth and in some cases crack initiation.
• Fatigue: Fine austenitic grain sizes and low retained austenite content, creates tempered
martensite and a microstructure of finely dispersed retained austenite, halts nucleation of fatigue
cracks or retard fatigue crack initiation until high stress levels are reached.
• Impact: Impact strength is measuring the ability that a steel has to resist fracture when subjected
to a sharp blow. Austenite is more tough and has also higher impact strength than martensite.
The impact strength increases thus the more austenite content there is. A higher impact strength
can provide depending on the application extra protection against cracking.
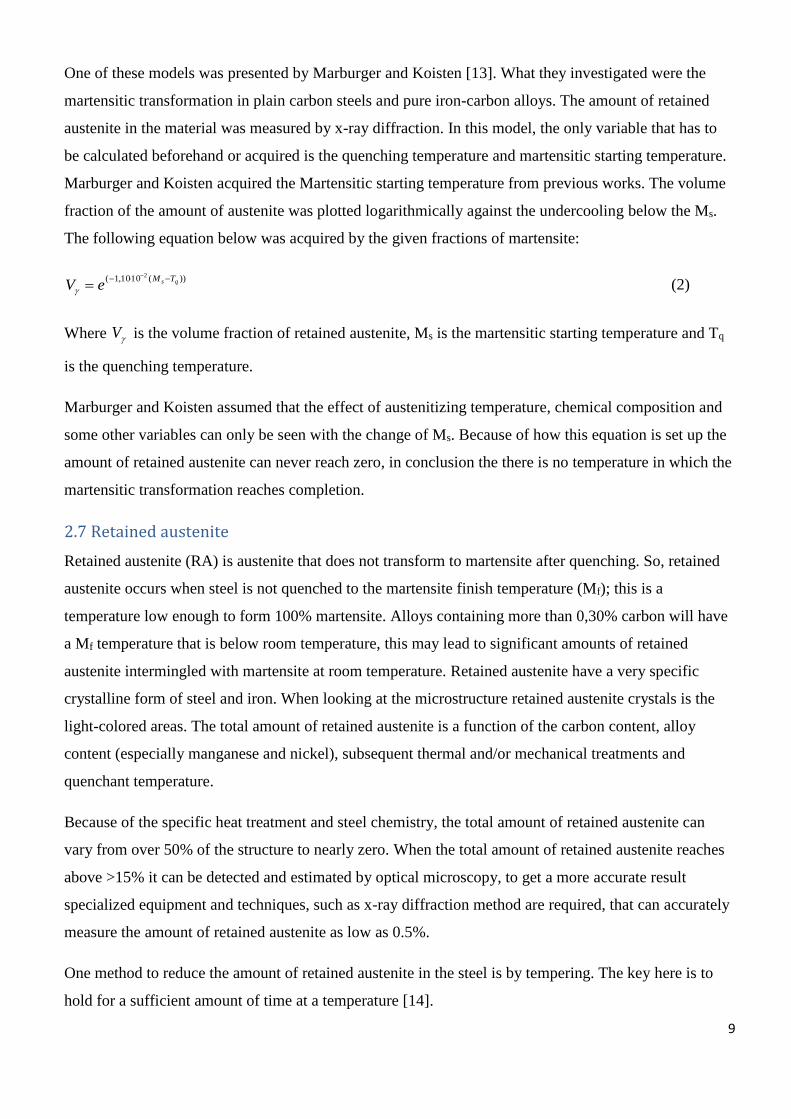
It is important to realize that depending on the application a certain balance must be created between the
mechanical properties of a component and the amount of retained austenite, an illustration of how the
properties will change can be seen in fig.3.
11
Figure 3. An illustration of how the different properties changes depending on the amount of retained austenite [14].
2.8 Martensite
Martensite is a metastable structure that takes form during very fast cooling of austenite. Because
martensite is not a phase associated with thermal equilibrium unlike the isothermal decomposition of
phase which constituents by diffusion. It does not appear on the iron-carbon equilibrium phase diagram.
The mechanism for martensite transformation is a diffusionless process, where fast cooling causes shear
displacement of atoms and individual atomic movements not more than one inter atomic spacing. The
transformation is a sudden systematic shifting or shear of iron atoms into a bct structure, it’s not a bcc
lattice because the bcc lattice cannot accommodate all of the carbon dissolved in the prior austenitic
phase. Even though high cooling rate is required, martensite depends also on the temperature. Martensite
begins to form only at a martensite start (Ms temperature) and the transformation only ceases when the
material reaches a temperature called martensite finish (Mf), These two temperatures are depended on
the alloying of the metal. In alloys where the martensite structure is very hard and highly strained is
because the solute atoms occupy interstitial positions in the martensite lattice (like carbon in iron). But
when the martensite has it substitutional positions occupied by solute atoms (like nickel in iron) it will
be soft and ductile. The hardness of martensite does not only depend on the alloying elements but also
by the carbon content fig.4. The cause of the high hardness is because the bct structure of martensite is
less densely packed than austenite. This leads to lattice distortion and a volumetric expansion at the Ms
temperature, which gives hardness/strength by blocking dislocation movement. When the cooling
reaches the Mf temperature all the remaining γ is referred to as retained austenite. From fig.5 it can be
seen that the martensite start temperature is a function of carbon content. The microstructure of
martensite in steels has different morphologies depending on the carbon content where they can either be
lath martensite or plate martensite. Plate martensite can be found in steels at carbon contents greater than
1%, lath martensite on the other hand forms only at carbon contents up to 0.6% [4].

12
Figure 4. Rockweel hardness on as-quenched martensite [4].
.
Figure 5. Carbon content effect on volume percent of retained austenite and martensite start temperature [4].
2.9 Austenitizing
The first step of heat treatment is austenitizing as previously explained it involves transforming the
initial microstructure to an austenitic structure. To make the whole work piece have the microstructure
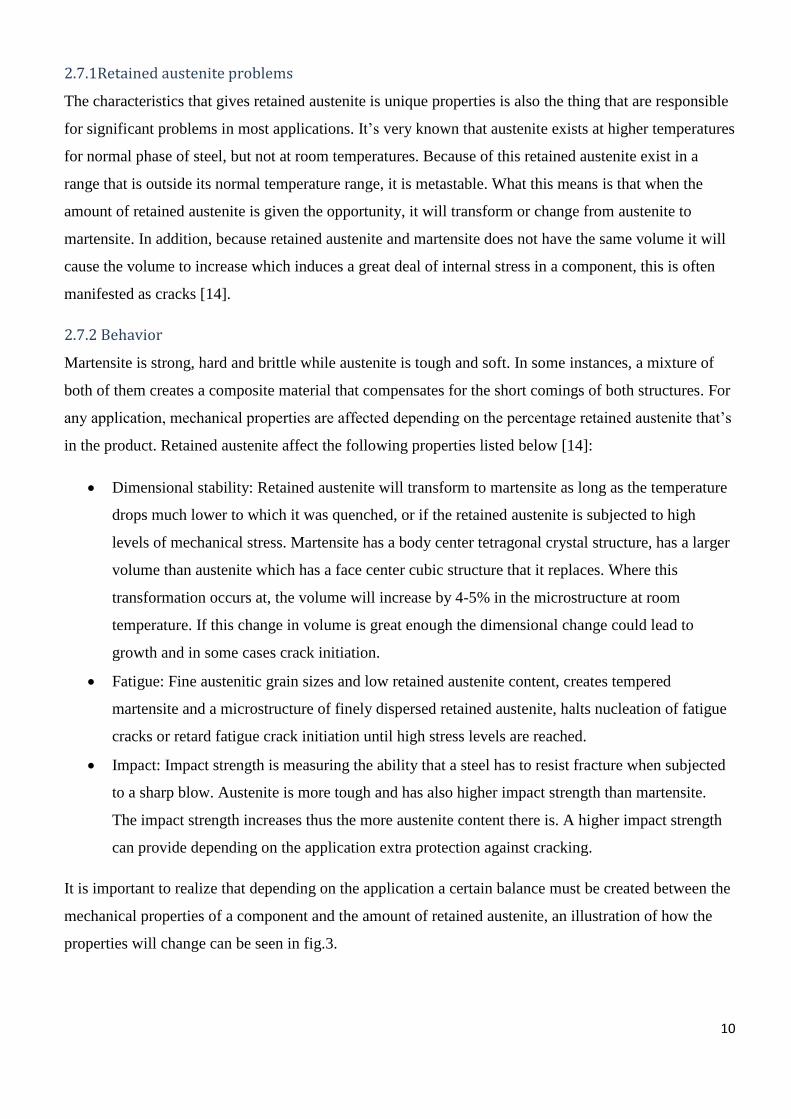
of austenite, the Fe-C phase diagram needs to be used, fig.6 shows the phase transformation. To only get
austenite in the microstructure, the sample must be heated above the eutectoid temperature (727°C). For
alloys steels that are hypoeutectoid (carbon content less than 0.76 weight % C), the ferrite will start to
transform into austenite this will continue on as the temperature increases above the eutectoid
13
temperature. If the material is instead a hypereutectoid alloy (carbon content between 0.76 and 2.14
weight % C), cementite will start to transform into austenite this will also continue on as the temperature
increases.
Figure 6. Fe-C Phase Diagram [22].
The holding time at austenitizing temperature can be calculated using the empirical formula below (3).
Dt 60 (3)
D is the maximum distance of the workpiece in millimeters and t is the holding time in minutes [17].
After the workpiece has been held for the desired time, the steel can be quenched from the austenitic
region to the desired structure. The resulting microstructure is reliant on the alloying concentration as
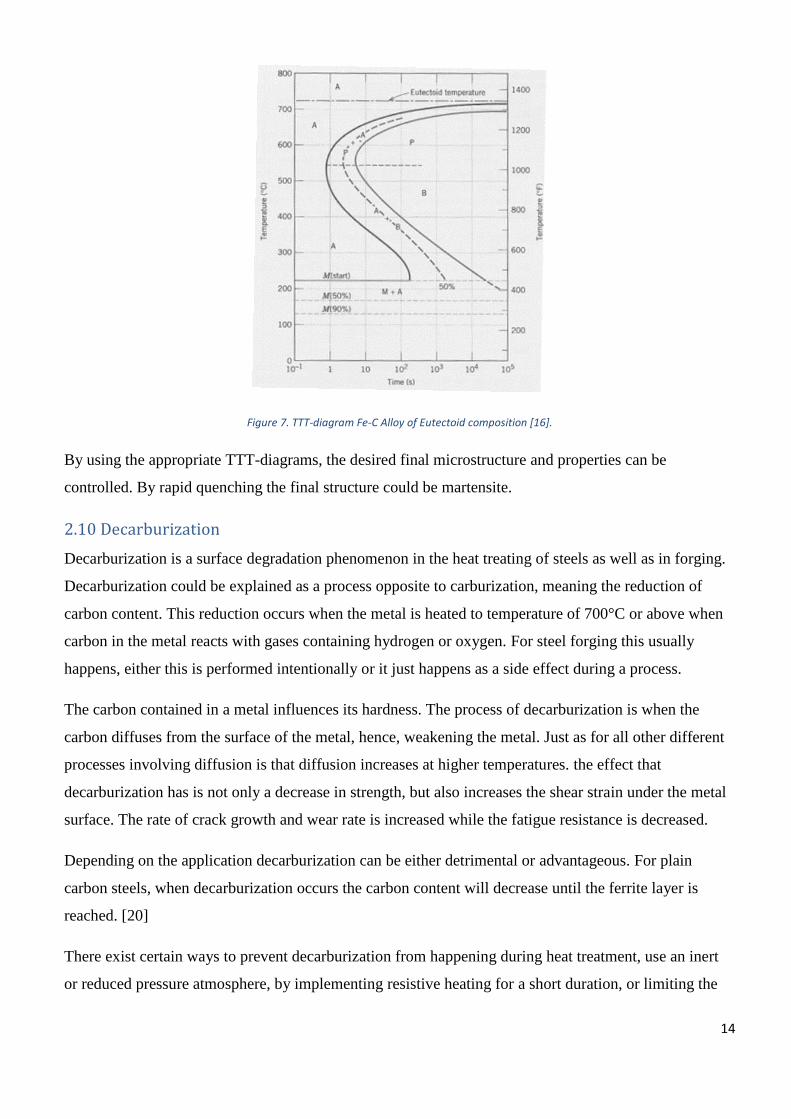
well as the most important part the rate of cooling. The Isothermal transformation diagrams, also known
as time-temperature-transformation (TTT) diagrams, for a steel with a eutectoid composition is present
in fig.7.
14
Figure 7. TTT-diagram Fe-C Alloy of Eutectoid composition [16].
By using the appropriate TTT-diagrams, the desired final microstructure and properties can be
controlled. By rapid quenching the final structure could be martensite.
2.10 Decarburization
Decarburization is a surface degradation phenomenon in the heat treating of steels as well as in forging.
Decarburization could be explained as a process opposite to carburization, meaning the reduction of
carbon content. This reduction occurs when the metal is heated to temperature of 700°C or above when
carbon in the metal reacts with gases containing hydrogen or oxygen. For steel forging this usually
happens, either this is performed intentionally or it just happens as a side effect during a process.
The carbon contained in a metal influences its hardness. The process of decarburization is when the
carbon diffuses from the surface of the metal, hence, weakening the metal. Just as for all other different
processes involving diffusion is that diffusion increases at higher temperatures. the effect that
decarburization has is not only a decrease in strength, but also increases the shear strain under the metal
surface. The rate of crack growth and wear rate is increased while the fatigue resistance is decreased.
Depending on the application decarburization can be either detrimental or advantageous. For plain
carbon steels, when decarburization occurs the carbon content will decrease until the ferrite layer is
reached. [20]
There exist certain ways to prevent decarburization from happening during heat treatment, use an inert
or reduced pressure atmosphere, by implementing resistive heating for a short duration, or limiting the

15
time where the material is at high temperatures, as is done at Bharat Forge Kilsta where they use a
walking-beam furnace. By grinding the surface, the decarburized material layer is removed because the
decarburization only effects the material to a certain depth [21].
3.Experimental
This following section will explain how the result section was achieved and also how the mechanical
properties changes with different parameters during the heat treatment. At Bharat forge kilsta they use 2
material types 41CrS4 and 40CrMo4 which are both European standards for their front axle beams, with
different designs on the beams depending on what is ordered from the customer.
3.1 Experimentals
3.1.1 Polymer quenchants
To quench a material a certain medium has to be used. There are many different types of quenching
mediums like water, brine, caustic, polymer (aqueous), oils, molten Salts and gases. Out of all of these
quenching mediums the polymer quenchant is the one that is used for this thesis, for cooling the steel
from the austenite temperature down to the desired temperature. Polymer quenchants consist of mainly
water with a polymer dissolved in the water at a certain concentration level. Trough out the advancement
in polymer quenchant several types of polymers have been developed for quenching purposes, of them
all the most popular is called Polyakylene Glycol (PAG). The quenching rates of polymer quenchants
are between water and oil. The quenching rate get progressively reduced as the concentration of the
polymer increases in the water from 5 to 15 to 25%. A problem that sometimes happens with water
quenching it that the cooling of the steel can be non-uniform, leading to certain areas being softer than
others. With just a small addition of polymer in the quenching bath it will lead to a more uniform contact
between the quenchant and steel surface during the initial cooling stages. A con of polymer quenchants
is that the polymer will slightly reduce the cooling rate at the cost of a more uniform cooling during the
initial cooling stages. Also, compared with oil quenchants polymer quenchants produce a much cleaner
surface. Something to be noted is that the polymer quench rate in the usual Ms-Mf range increases the
chances of quenching cracking compared to oils.
There are problems with both polymer and oil quenchants to aging of the bath. Steel that has been heated
to the austenitization temperature and then being quenched can lead to oxidation of the liquid
components, and the continual removal of the steel piece will often produce a selective loss of liquid
components. This later effect has a name called drag out. Because the quenching rate is very much
depending on the polymer concentration in the water solution, maintaining this concentration so it is
constant is difficult [11].
16
3.1.1.1FEROQUENCH 2000
The polymer quenchant used under this thesis is called FEROQUENCH 2000. It is a solution that is not
ignitable and thus safe for employees and equipment. Fire hazard and formation of unpleasant smoke
and soot are thus avoided. The product contains no mineral oil nitride or other harmful substances.
FEROQUENCH 2000 is the first water-based that has similar hardening properties as oil [13].
3.1.1.2Characteristics
FEROQUENCH 2000 cools steel material as a regular hardening oil. Meaning because of its short vapor
phase leading to a high cooling ability at the initial stage of the curing process. Compared to water,
FEROQUENCH(FQ) 2000 provides extremely reduced hardening in solution phase and thereby
reducing thermal stress of the material in Martensite transformation temperature range and this
eliminates the risk of cracking and deformation. Because of these properties, the product offers new
possibilities to harden high alloy steel workpieces (with high hardness). As well as tool steel. Extremely
sensitive details can and should be removed from the bath before complete cooling to bath temperature.
In this case, no smoke or unpleasant smell that may affect the staff.
FEROQUENCH 2000 solutions are usually prepared between 5 - 15%. In order to obtain the properties
of an ordinary hardener oil. For lower concentrations to achieve hardening properties closer to water,
there exist other water soluble hardening agent that have the advantage over FEROQUENCH 2000 like
AQUATENSID or AQUACOOL. These types of curing agents have found a wide range of replacement
for Hardened oil in large open hardened bath tanks for hardening of austenitized details like Steel
blocks, beams, steel sheets, tubes, profiles, tubes and shaped rings up to a weight of 100 tons [13].
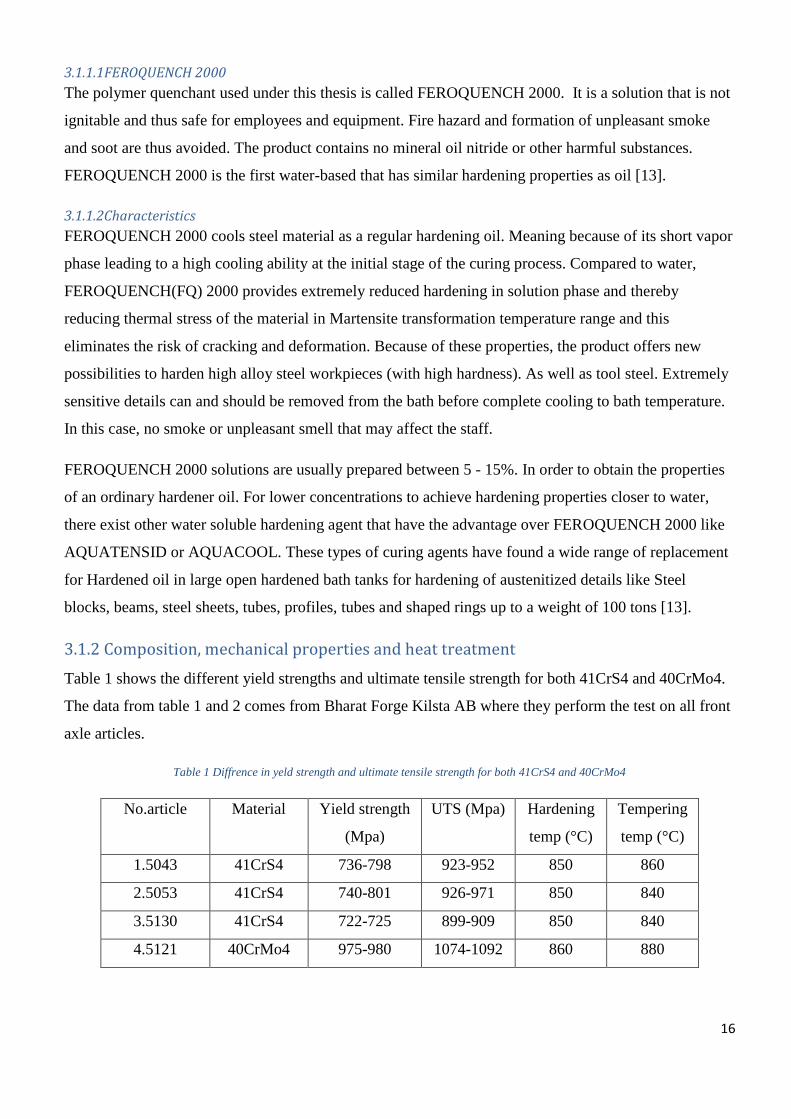
3.1.2 Composition, mechanical properties and heat treatment
Table 1 shows the different yield strengths and ultimate tensile strength for both 41CrS4 and 40CrMo4.
The data from table 1 and 2 comes from Bharat Forge Kilsta AB where they perform the test on all front
axle articles.
Table 1 Diffrence in yeld strength and ultimate tensile strength for both 41CrS4 and 40CrMo4
No.article Material Yield strength
(Mpa)
UTS (Mpa) Hardening
temp (°C)
Tempering
temp (°C)
1.5043 41CrS4 736-798 923-952 850 860
2.5053 41CrS4 740-801 926-971 850 840
3.5130 41CrS4 722-725 899-909 850 840
4.5121 40CrMo4 975-980 1074-1092 860 880
17
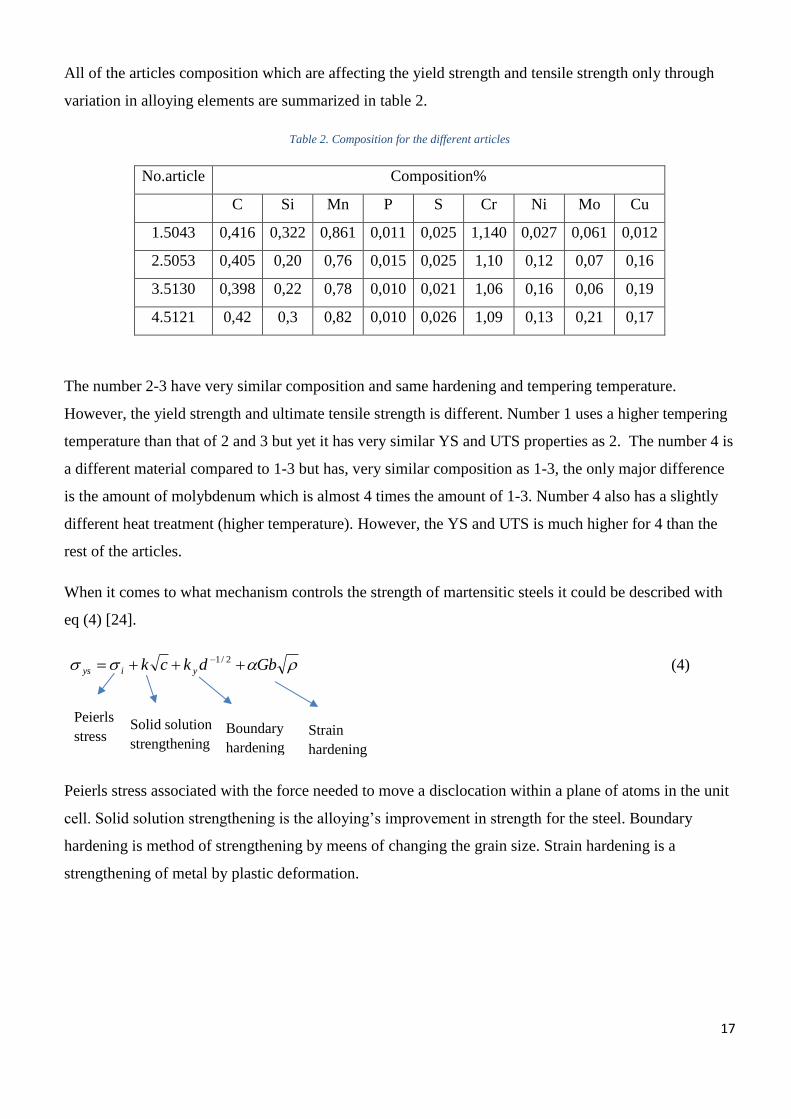
All of the articles composition which are affecting the yield strength and tensile strength only through
variation in alloying elements are summarized in table 2.
Table 2. Composition for the different articles
No.article Composition%
C Si Mn P S Cr Ni Mo Cu
1.5043 0,416 0,322 0,861 0,011 0,025 1,140 0,027 0,061 0,012
2.5053 0,405 0,20 0,76 0,015 0,025 1,10 0,12 0,07 0,16
3.5130 0,398 0,22 0,78 0,010 0,021 1,06 0,16 0,06 0,19
4.5121 0,42 0,3 0,82 0,010 0,026 1,09 0,13 0,21 0,17
The number 2-3 have very similar composition and same hardening and tempering temperature.
However, the yield strength and ultimate tensile strength is different. Number 1 uses a higher tempering
temperature than that of 2 and 3 but yet it has very similar YS and UTS properties as 2. The number 4 is
a different material compared to 1-3 but has, very similar composition as 1-3, the only major difference
is the amount of molybdenum which is almost 4 times the amount of 1-3. Number 4 also has a slightly
different heat treatment (higher temperature). However, the YS and UTS is much higher for 4 than the
rest of the articles.
When it comes to what mechanism controls the strength of martensitic steels it could be described with
eq (4) [24].
Gbdkck yiys 2/1 (4)
Peierls stress associated with the force needed to move a disclocation within a plane of atoms in the unit
cell. Solid solution strengthening is the alloying’s improvement in strength for the steel. Boundary
hardening is method of strengthening by meens of changing the grain size. Strain hardening is a
strengthening of metal by plastic deformation.
Peierls
stress Solid solution
strengthening Boundary
hardening
Strain
hardening
18
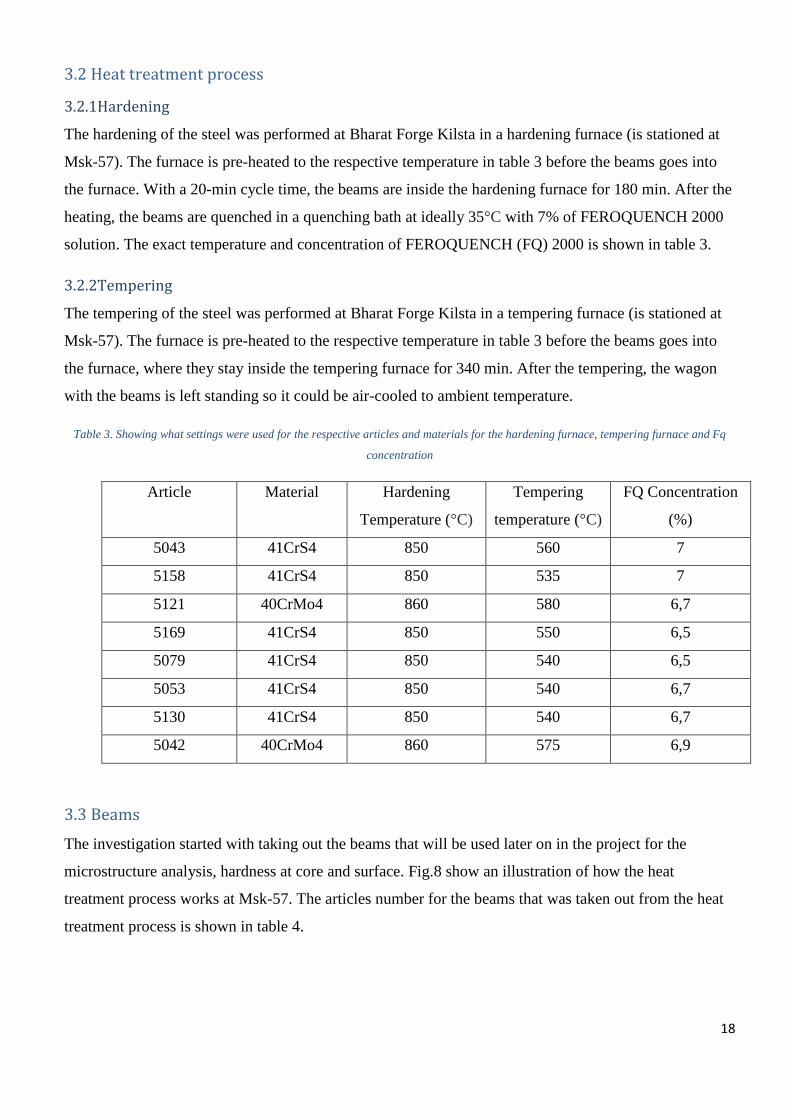
3.2 Heat treatment process
3.2.1Hardening
The hardening of the steel was performed at Bharat Forge Kilsta in a hardening furnace (is stationed at
Msk-57). The furnace is pre-heated to the respective temperature in table 3 before the beams goes into
the furnace. With a 20-min cycle time, the beams are inside the hardening furnace for 180 min. After the
heating, the beams are quenched in a quenching bath at ideally 35°C with 7% of FEROQUENCH 2000
solution. The exact temperature and concentration of FEROQUENCH (FQ) 2000 is shown in table 3.
3.2.2Tempering
The tempering of the steel was performed at Bharat Forge Kilsta in a tempering furnace (is stationed at
Msk-57). The furnace is pre-heated to the respective temperature in table 3 before the beams goes into
the furnace, where they stay inside the tempering furnace for 340 min. After the tempering, the wagon
with the beams is left standing so it could be air-cooled to ambient temperature.
Table 3. Showing what settings were used for the respective articles and materials for the hardening furnace, tempering furnace and Fq
concentration
Article Material Hardening
Temperature (°C)
Tempering
temperature (°C)
FQ Concentration
(%)
5043 41CrS4 850 560 7
5158 41CrS4 850 535 7
5121 40CrMo4 860 580 6,7
5169 41CrS4 850 550 6,5
5079 41CrS4 850 540 6,5
5053 41CrS4 850 540 6,7
5130 41CrS4 850 540 6,7
5042 40CrMo4 860 575 6,9
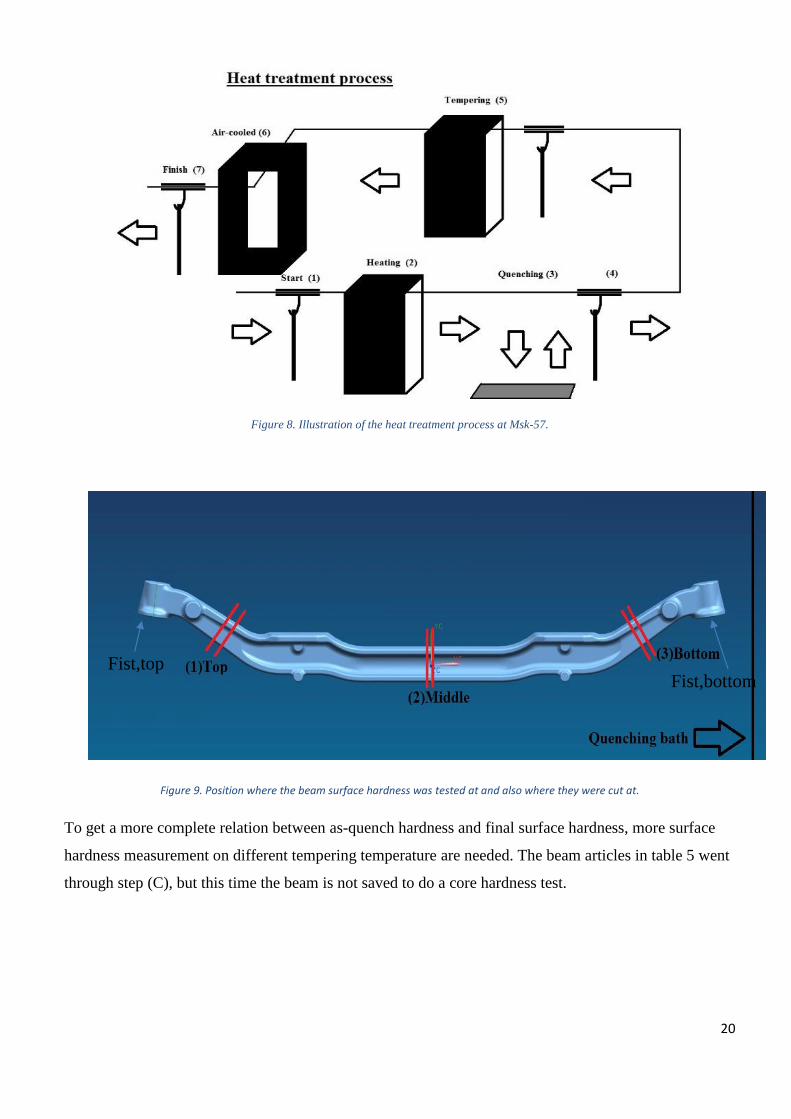
3.3 Beams
The investigation started with taking out the beams that will be used later on in the project for the
microstructure analysis, hardness at core and surface. Fig.8 show an illustration of how the heat
treatment process works at Msk-57. The articles number for the beams that was taken out from the heat
treatment process is shown in table 4.
19
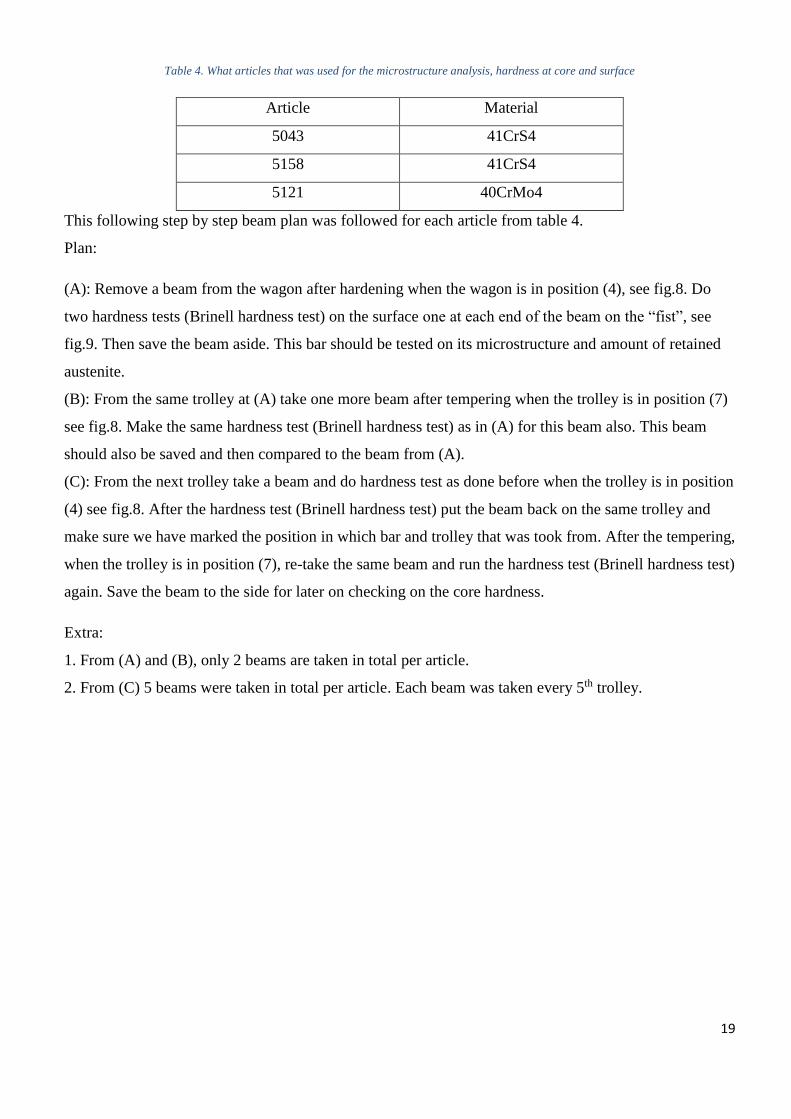
Table 4. What articles that was used for the microstructure analysis, hardness at core and surface
Article Material
5043 41CrS4
5158 41CrS4
5121 40CrMo4
This following step by step beam plan was followed for each article from table 4.
Plan:
(A): Remove a beam from the wagon after hardening when the wagon is in position (4), see fig.8. Do
two hardness tests (Brinell hardness test) on the surface one at each end of the beam on the “fist”, see
fig.9. Then save the beam aside. This bar should be tested on its microstructure and amount of retained
austenite.
(B): From the same trolley at (A) take one more beam after tempering when the trolley is in position (7)
see fig.8. Make the same hardness test (Brinell hardness test) as in (A) for this beam also. This beam
should also be saved and then compared to the beam from (A).
(C): From the next trolley take a beam and do hardness test as done before when the trolley is in position
(4) see fig.8. After the hardness test (Brinell hardness test) put the beam back on the same trolley and
make sure we have marked the position in which bar and trolley that was took from. After the tempering,
when the trolley is in position (7), re-take the same beam and run the hardness test (Brinell hardness test)
again. Save the beam to the side for later on checking on the core hardness.
Extra:
1. From (A) and (B), only 2 beams are taken in total per article.
2. From (C) 5 beams were taken in total per article. Each beam was taken every 5th trolley.
20
Figure 8. Illustration of the heat treatment process at Msk-57.
Figure 9. Position where the beam surface hardness was tested at and also where they were cut at.
To get a more complete relation between as-quench hardness and final surface hardness, more surface
hardness measurement on different tempering temperature are needed. The beam articles in table 5 went
through step (C), but this time the beam is not saved to do a core hardness test.
Fist,top
Fist,bottom
21
Table 5. Article used for more values of different hardness on different tempering temperature
Article Material
5169 41CrS4
5079 41CrS4
5053 41CrS4
5130 41CrS4
5042 40CrMo4
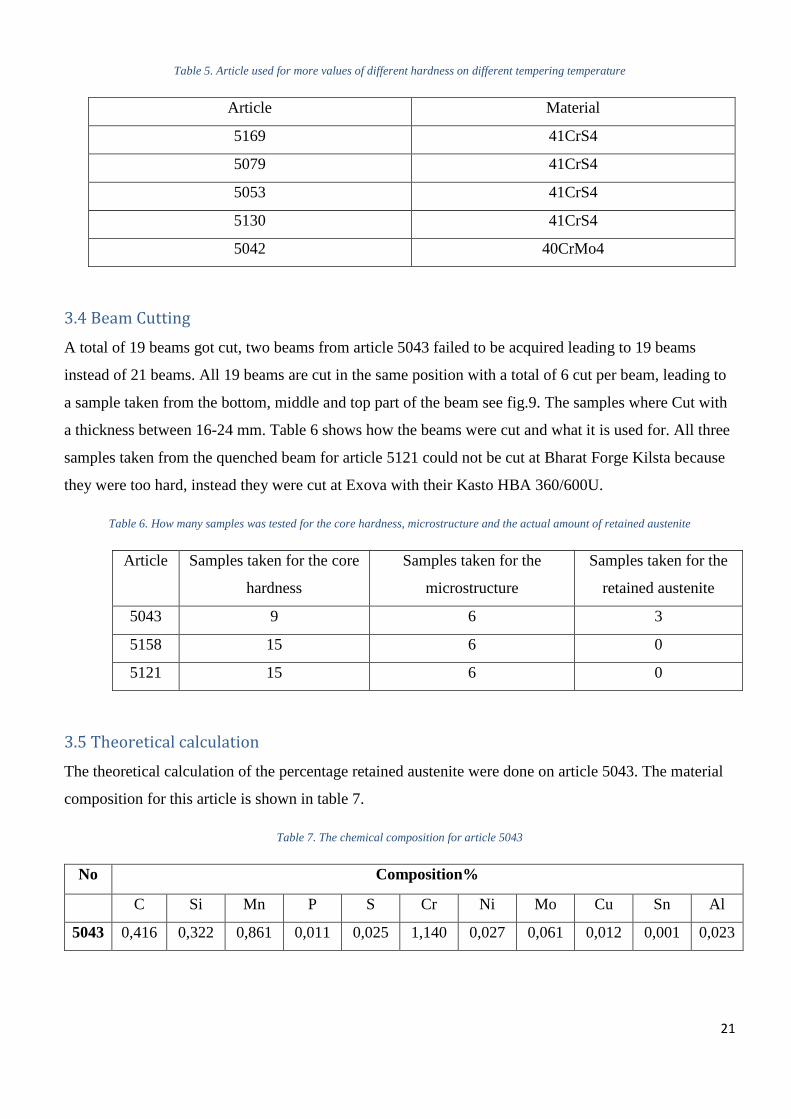
3.4 Beam Cutting
A total of 19 beams got cut, two beams from article 5043 failed to be acquired leading to 19 beams
instead of 21 beams. All 19 beams are cut in the same position with a total of 6 cut per beam, leading to
a sample taken from the bottom, middle and top part of the beam see fig.9. The samples where Cut with
a thickness between 16-24 mm. Table 6 shows how the beams were cut and what it is used for. All three
samples taken from the quenched beam for article 5121 could not be cut at Bharat Forge Kilsta because
they were too hard, instead they were cut at Exova with their Kasto HBA 360/600U.
Table 6. How many samples was tested for the core hardness, microstructure and the actual amount of retained austenite
Article Samples taken for the core
hardness
Samples taken for the
microstructure
Samples taken for the
retained austenite
5043 9 6 3
5158 15 6 0
5121 15 6 0
3.5 Theoretical calculation
The theoretical calculation of the percentage retained austenite were done on article 5043. The material
composition for this article is shown in table 7.
Table 7. The chemical composition for article 5043
No Composition%
C Si Mn P S Cr Ni Mo Cu Sn Al
5043 0,416 0,322 0,861 0,011 0,025 1,140 0,027 0,061 0,012 0,001 0,023
22
For the calculation of the retained austenite the Ms temperature needs to be known. Calculating the Ms
temperature is done with eq (1). To calculate the Ms put composition values from table 7 into the
equation at their designated spots.
From the eq (2) the amount of retained austenite can be calculated. Tq is the quenching temperature
which is 35°C, V being the volume fraction of retained austenite and Ms temperature is used from eq
(1).
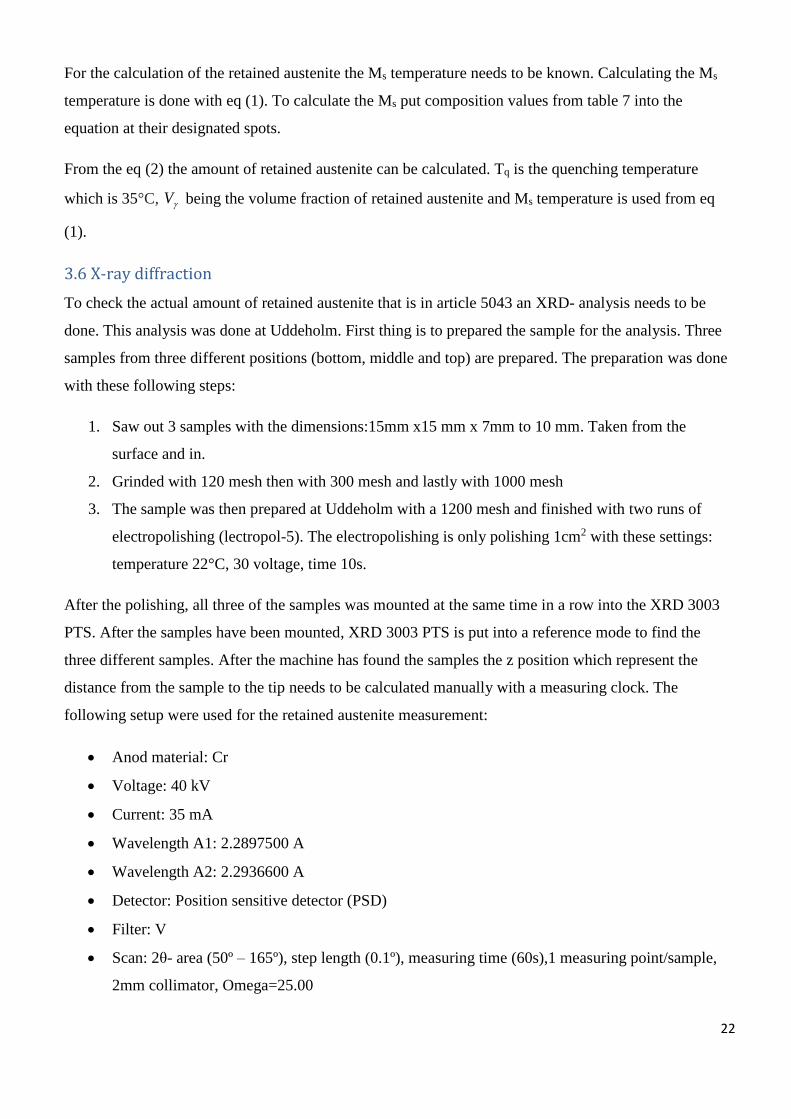
3.6 X-ray diffraction
To check the actual amount of retained austenite that is in article 5043 an XRD- analysis needs to be
done. This analysis was done at Uddeholm. First thing is to prepared the sample for the analysis. Three
samples from three different positions (bottom, middle and top) are prepared. The preparation was done
with these following steps:
1. Saw out 3 samples with the dimensions:15mm x15 mm x 7mm to 10 mm. Taken from the
surface and in.
2. Grinded with 120 mesh then with 300 mesh and lastly with 1000 mesh
3. The sample was then prepared at Uddeholm with a 1200 mesh and finished with two runs of
electropolishing (lectropol-5). The electropolishing is only polishing 1cm2 with these settings:
temperature 22°C, 30 voltage, time 10s.
After the polishing, all three of the samples was mounted at the same time in a row into the XRD 3003
PTS. After the samples have been mounted, XRD 3003 PTS is put into a reference mode to find the
three different samples. After the machine has found the samples the z position which represent the
distance from the sample to the tip needs to be calculated manually with a measuring clock. The
following setup were used for the retained austenite measurement:
• Anod material: Cr
• Voltage: 40 kV
• Current: 35 mA
• Wavelength A1: 2.2897500 A
• Wavelength A2: 2.2936600 A
• Detector: Position sensitive detector (PSD)
• Filter: V
• Scan: 2θ- area (50º – 165º), step length (0.1º), measuring time (60s),1 measuring point/sample,
2mm collimator, Omega=25.00
23
• PSD Ackumulation: 4
• Oscillation (Chi): Amplitude 130º, Speed 12º/s
• Rotation (Phi) Speed 12º/s
The analysis took 30 min before it was done. The result came as a curve that had to be adjusted and
corrected by the operator.
3.7 Microstructure
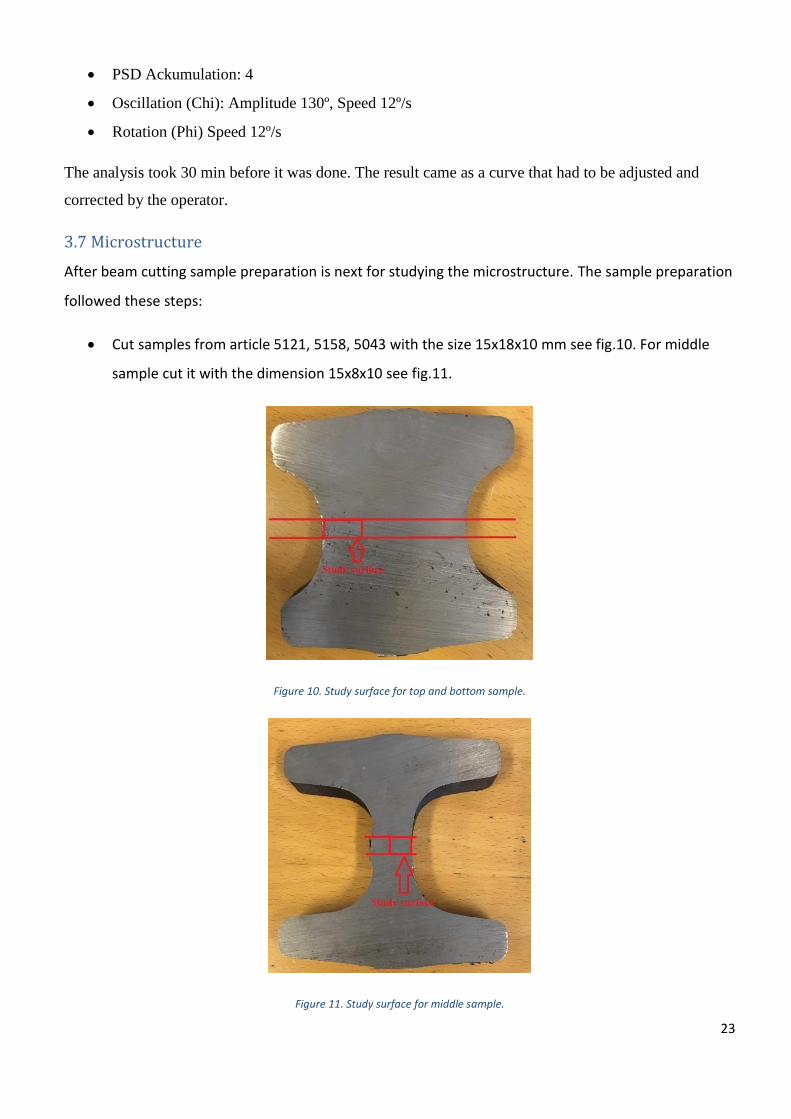
After beam cutting sample preparation is next for studying the microstructure. The sample preparation
followed these steps:
• Cut samples from article 5121, 5158, 5043 with the size 15x18x10 mm see fig.10. For middle
sample cut it with the dimension 15x8x10 see fig.11.
Figure 10. Study surface for top and bottom sample.
Figure 11. Study surface for middle sample.

24
• After cutting out 18 (9 samples from quenching 9 samples from quenching and tempering)
smaller samples mount them with the CitoPress-1 according to table 8.
Table 8. Citopress-1 setup for mounting samples
Cylinder
d/a
Resin Heating
30mm Type Quantity [ml] Time
[min]
Temperature[°
C]
Pressure [bar]
DuroFast 20 3,5 180 325
Cooling Time
Time [min] Rate Total time
[min]
2 High 5,5
• Grind the samples until fine surface without scratches by using the TegraPol-21. Grinding steps:
1. 300 rpm, clockwise
2. 120 mesh,25N, water, time 2 min
3. 320 mesh,25N, water, time 3 min
4. 500 piano,25N, water, time 3 min
5. Allegro mesh,25N, blue lubricant+6µm spray, time 3 min
6. MD Plus,25N, green lubricant+3µm pasta, time 3 min
Etch the to be studied surface, with 5% nital. Micro Vickers hardness test were performed on the
microstructure.
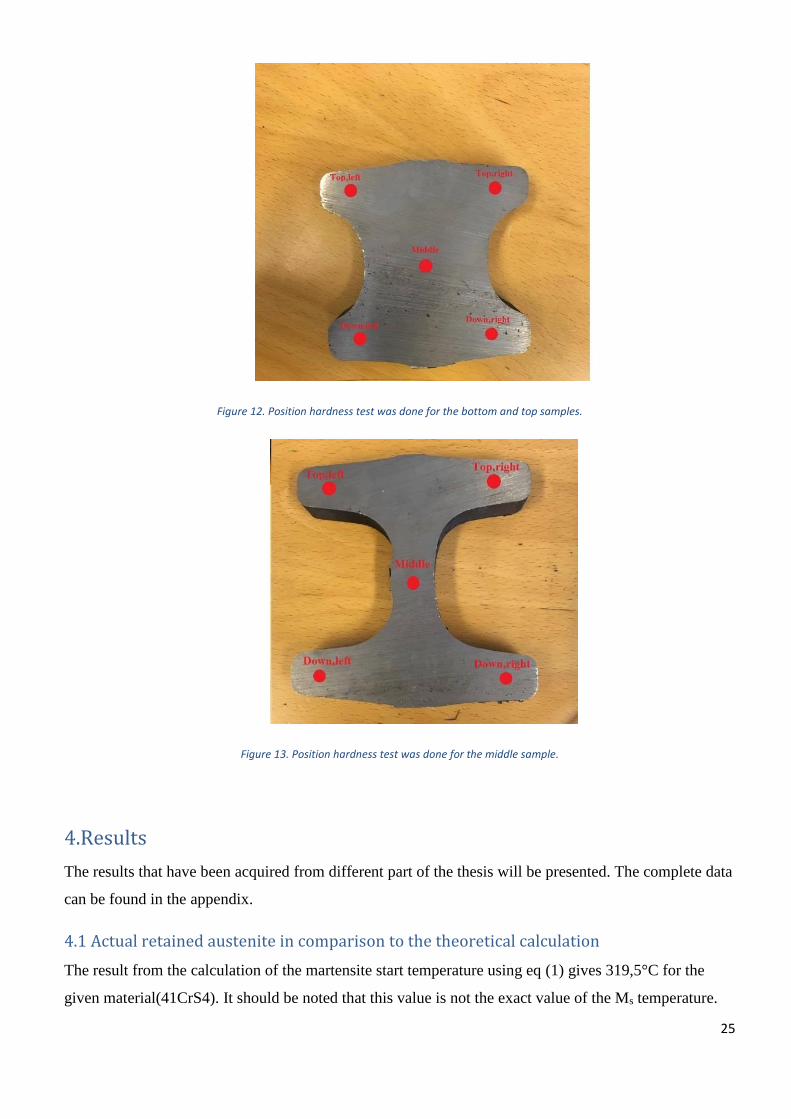
3.8 Hardness of core
After having cut out the samples from the beam for these respective articles 5043, 5158, 5121, 48
samples had their core hardness tested this include 9 samples that have only been quenched. The front
axle beam is symmetrical so the bottom and the top looks the same. The core hardness was taken on 5
different positions per sample. What is defined as core is 15 mm into the material, see fig.12-13 for the
top and bottom sample and for the middle part see fig 12-13. The Brinnell hardness was performed at
msk-50 at Bharat forge.
25
Figure 12. Position hardness test was done for the bottom and top samples.
Figure 13. Position hardness test was done for the middle sample.
4.Results
The results that have been acquired from different part of the thesis will be presented. The complete data
can be found in the appendix.
4.1 Actual retained austenite in comparison to the theoretical calculation
The result from the calculation of the martensite start temperature using eq (1) gives 319,5°C for the
given material(41CrS4). It should be noted that this value is not the exact value of the Ms temperature.
26
The calculated Ms is within the range of confidence (±25°C). With the use of eq (4) the total amount of
retained austenite is obtained. The result from using that equation gives a value of 4,4% retained
austenite when using eq (2).
%4.4374,4100))355.319(1010,1( 2
eV (3)
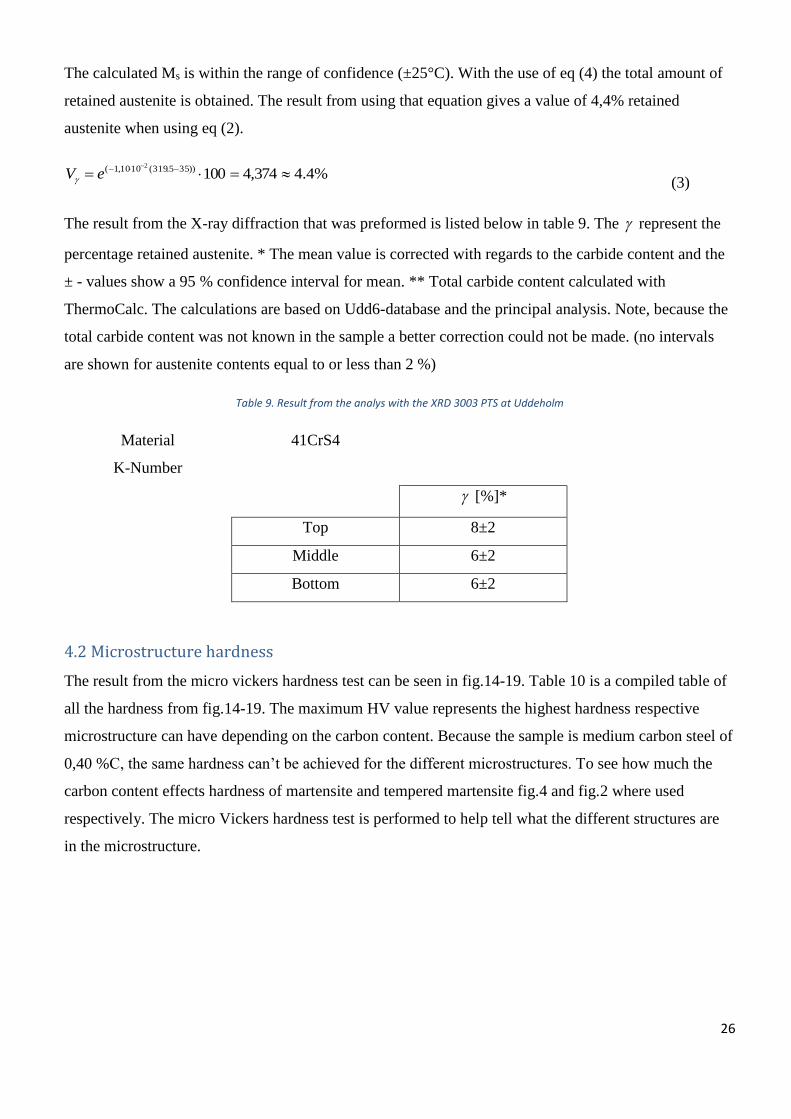
The result from the X-ray diffraction that was preformed is listed below in table 9. The represent the
percentage retained austenite. * The mean value is corrected with regards to the carbide content and the
± - values show a 95 % confidence interval for mean. ** Total carbide content calculated with
ThermoCalc. The calculations are based on Udd6-database and the principal analysis. Note, because the
total carbide content was not known in the sample a better correction could not be made. (no intervals
are shown for austenite contents equal to or less than 2 %)
Table 9. Result from the analys with the XRD 3003 PTS at Uddeholm
Material 41CrS4
K-Number
[%]*
Top 8±2
Middle 6±2
Bottom 6±2
4.2 Microstructure hardness
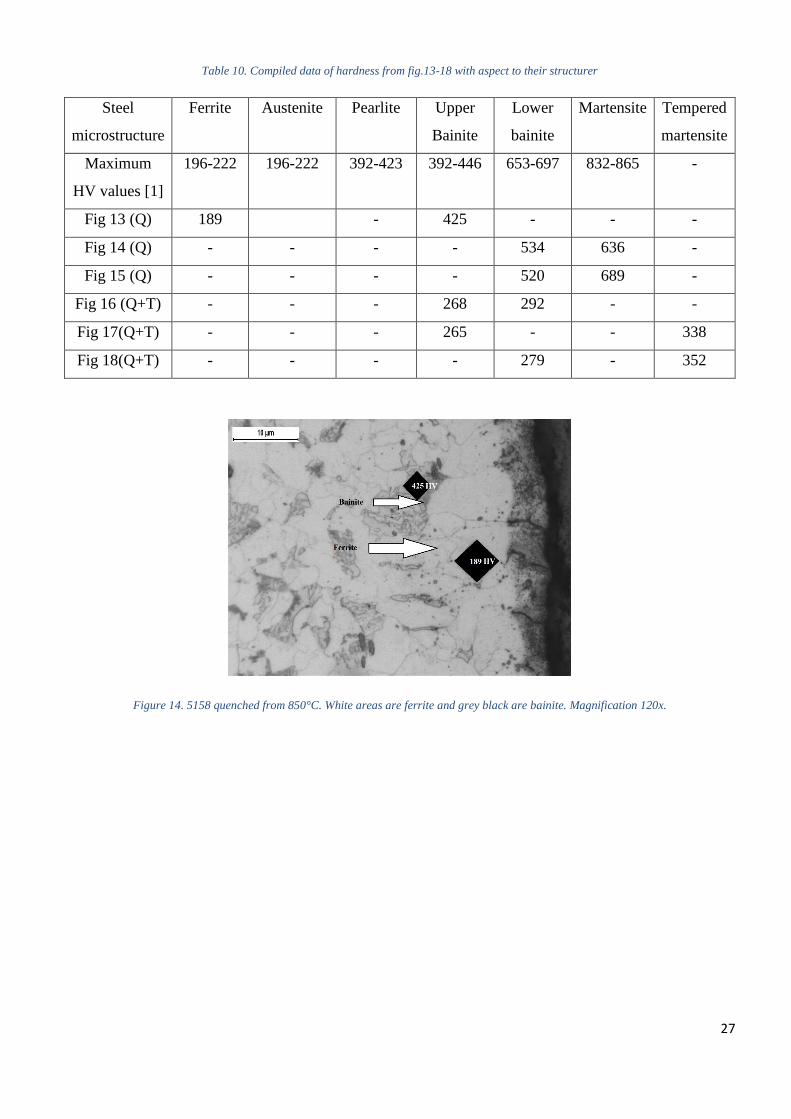
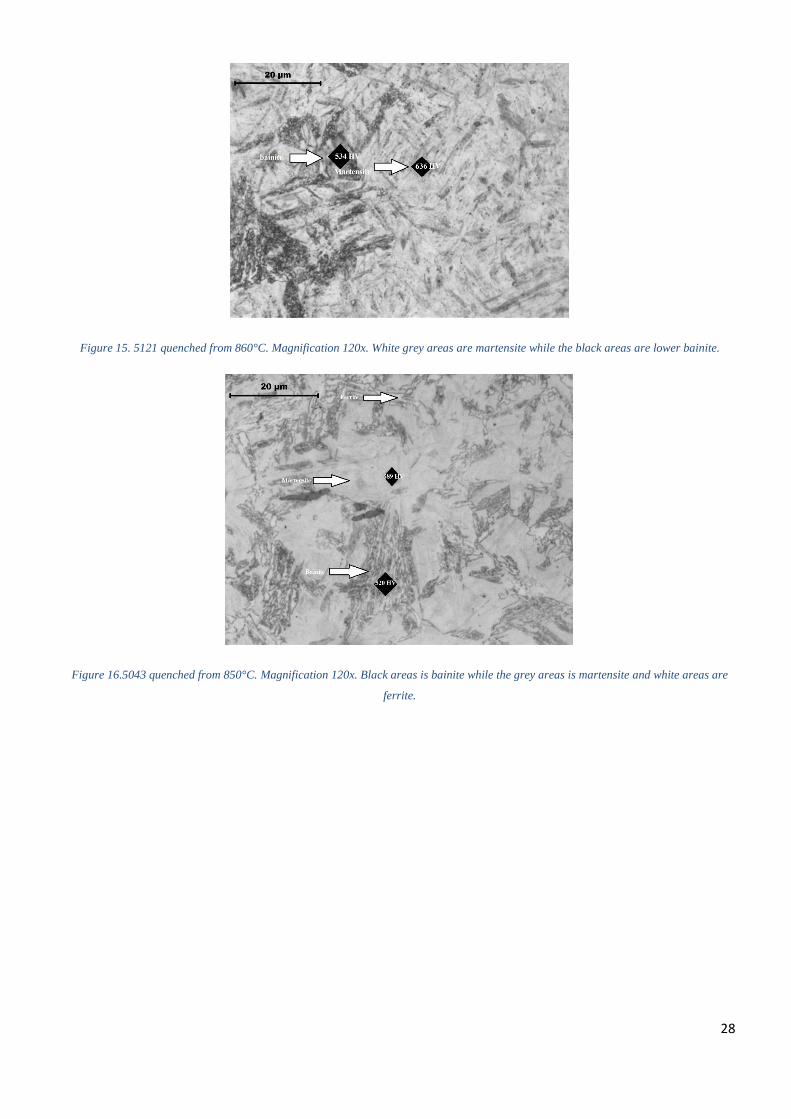
The result from the micro vickers hardness test can be seen in fig.14-19. Table 10 is a compiled table of
all the hardness from fig.14-19. The maximum HV value represents the highest hardness respective
microstructure can have depending on the carbon content. Because the sample is medium carbon steel of
0,40 %C, the same hardness can’t be achieved for the different microstructures. To see how much the
carbon content effects hardness of martensite and tempered martensite fig.4 and fig.2 where used
respectively. The micro Vickers hardness test is performed to help tell what the different structures are
in the microstructure.
27
Table 10. Compiled data of hardness from fig.13-18 with aspect to their structurer
Steel
microstructure
Ferrite Austenite Pearlite Upper
Bainite
Lower
bainite
Martensite Tempered
martensite
Maximum
HV values [1]
196-222 196-222 392-423 392-446 653-697 832-865 -
Fig 13 (Q) 189 - 425 - - -
Fig 14 (Q) - - - - 534 636 -
Fig 15 (Q) - - - - 520 689 -
Fig 16 (Q+T) - - - 268 292 - -
Fig 17(Q+T) - - - 265 - - 338
Fig 18(Q+T) - - - - 279 - 352
Figure 14. 5158 quenched from 850°C. White areas are ferrite and grey black are bainite. Magnification 120x.
28
Figure 15. 5121 quenched from 860°C. Magnification 120x. White grey areas are martensite while the black areas are lower bainite.
Figure 16.5043 quenched from 850°C. Magnification 120x. Black areas is bainite while the grey areas is martensite and white areas are
ferrite.
29
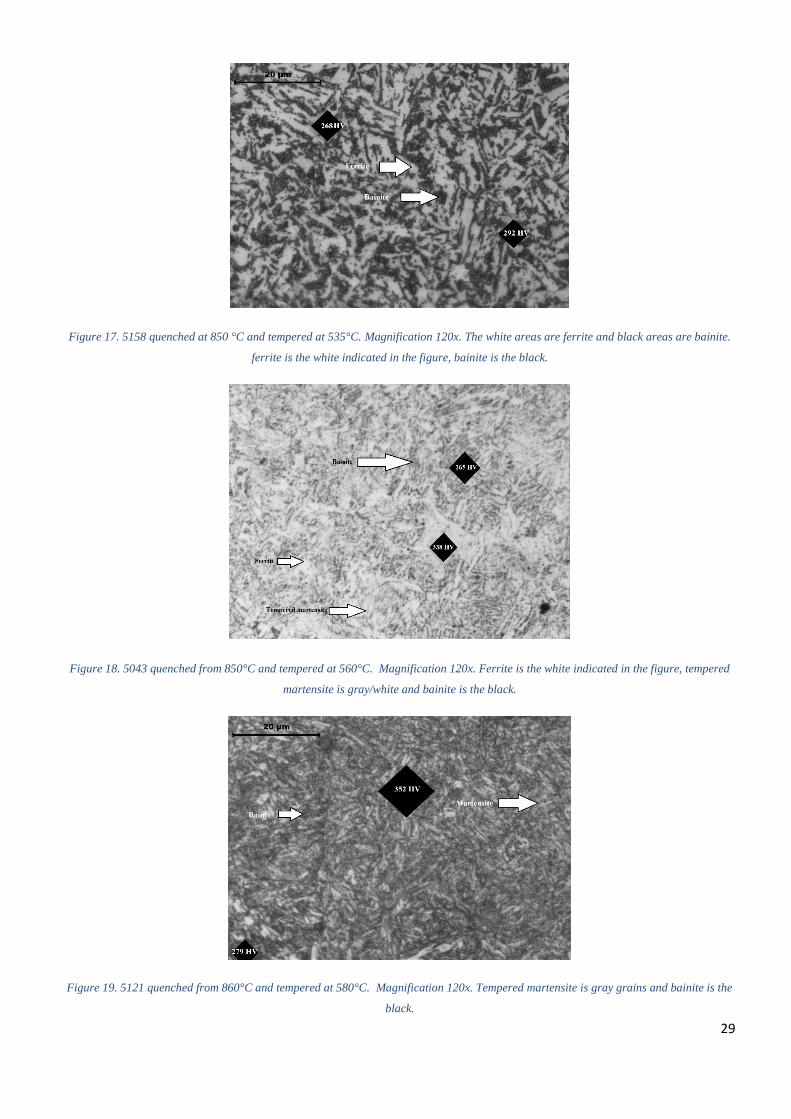
Figure 17. 5158 quenched at 850 °C and tempered at 535°C. Magnification 120x. The white areas are ferrite and black areas are bainite.
ferrite is the white indicated in the figure, bainite is the black.
Figure 18. 5043 quenched from 850°C and tempered at 560°C. Magnification 120x. Ferrite is the white indicated in the figure, tempered
martensite is gray/white and bainite is the black.
Figure 19. 5121 quenched from 860°C and tempered at 580°C. Magnification 120x. Tempered martensite is gray grains and bainite is the
black.
30
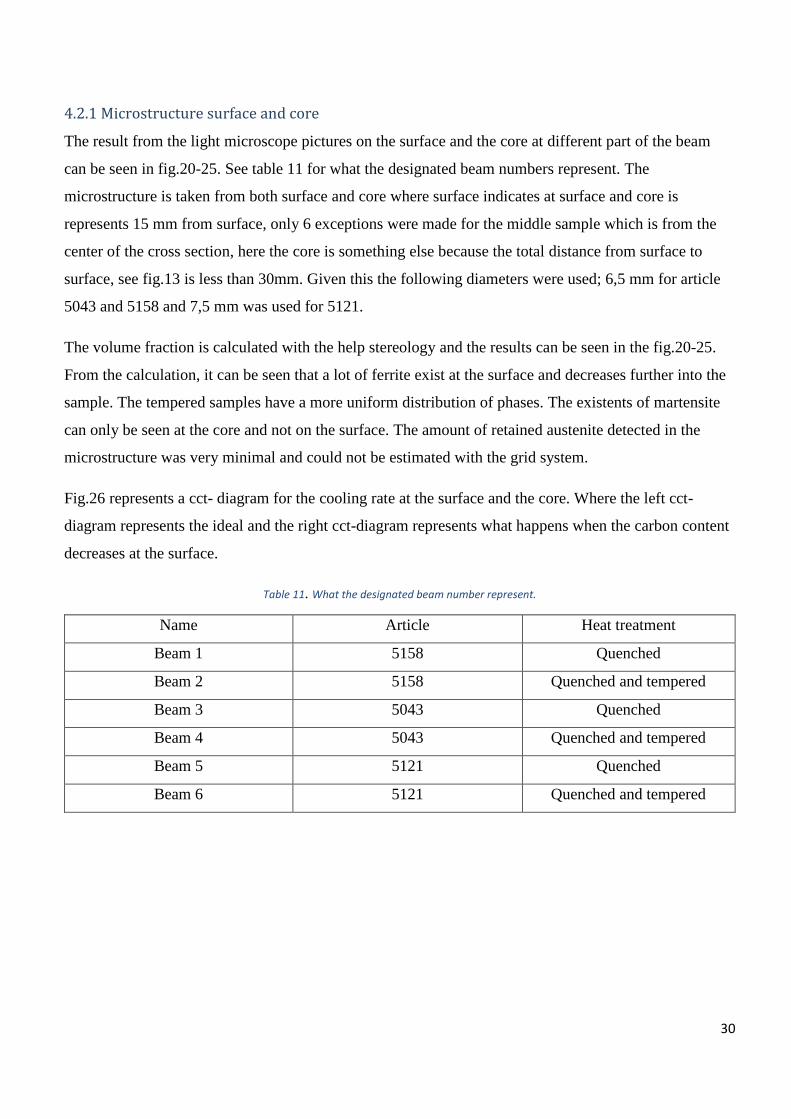
4.2.1 Microstructure surface and core
The result from the light microscope pictures on the surface and the core at different part of the beam
can be seen in fig.20-25. See table 11 for what the designated beam numbers represent. The
microstructure is taken from both surface and core where surface indicates at surface and core is
represents 15 mm from surface, only 6 exceptions were made for the middle sample which is from the
center of the cross section, here the core is something else because the total distance from surface to
surface, see fig.13 is less than 30mm. Given this the following diameters were used; 6,5 mm for article
5043 and 5158 and 7,5 mm was used for 5121.
The volume fraction is calculated with the help stereology and the results can be seen in the fig.20-25.
From the calculation, it can be seen that a lot of ferrite exist at the surface and decreases further into the
sample. The tempered samples have a more uniform distribution of phases. The existents of martensite
can only be seen at the core and not on the surface. The amount of retained austenite detected in the
microstructure was very minimal and could not be estimated with the grid system.
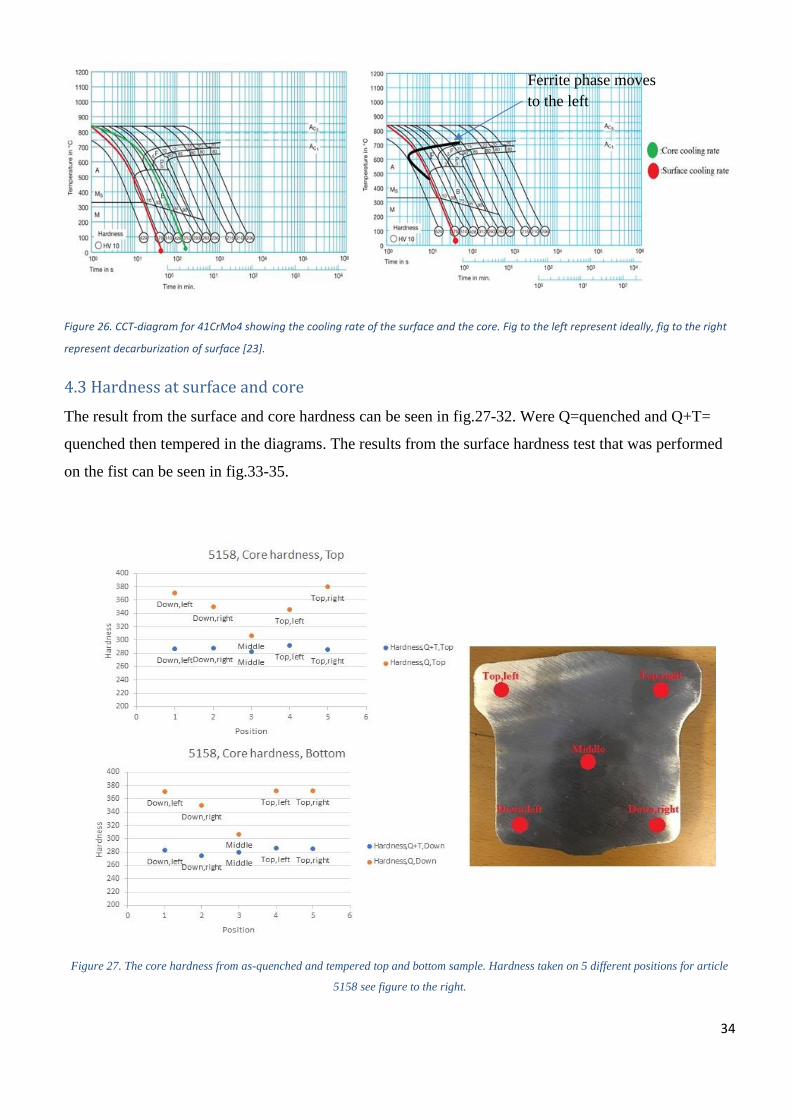
Fig.26 represents a cct- diagram for the cooling rate at the surface and the core. Where the left cct-
diagram represents the ideal and the right cct-diagram represents what happens when the carbon content
decreases at the surface.
Table 11. What the designated beam number represent.
Name Article Heat treatment
Beam 1 5158 Quenched
Beam 2 5158 Quenched and tempered
Beam 3 5043 Quenched
Beam 4 5043 Quenched and tempered
Beam 5 5121 Quenched
Beam 6 5121 Quenched and tempered
31
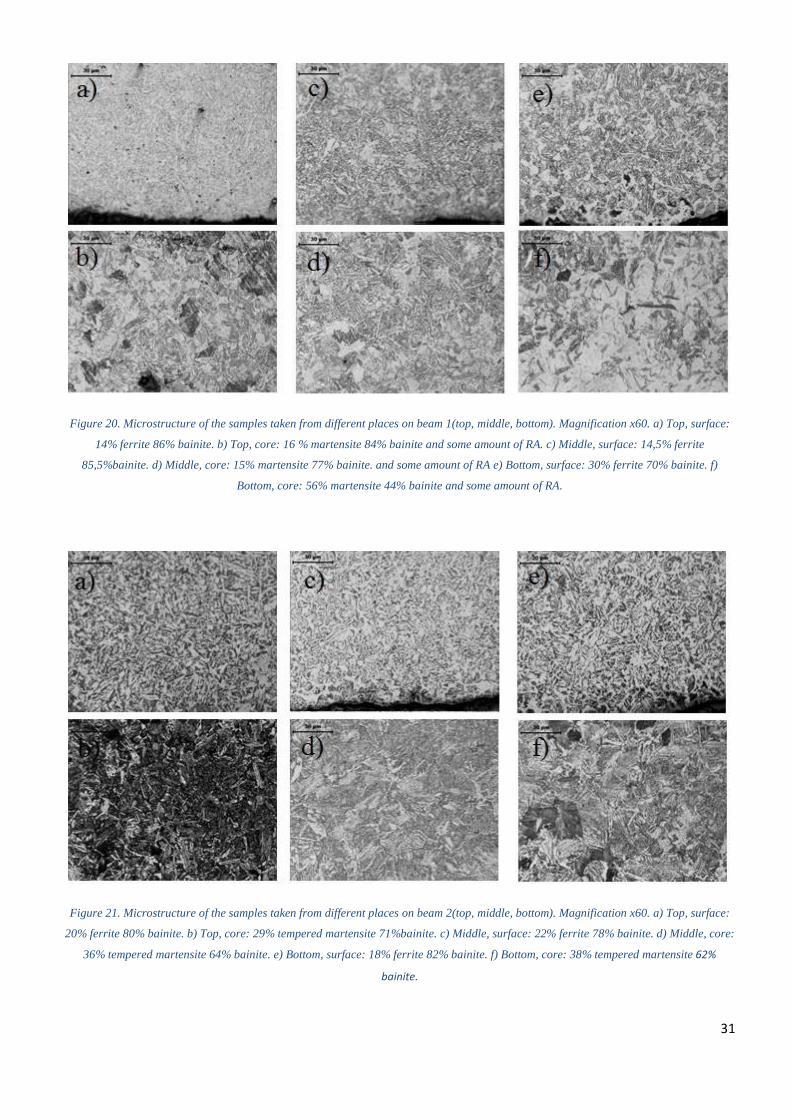
Figure 20. Microstructure of the samples taken from different places on beam 1(top, middle, bottom). Magnification x60. a) Top, surface:
14% ferrite 86% bainite. b) Top, core: 16 % martensite 84% bainite and some amount of RA. c) Middle, surface: 14,5% ferrite
85,5%bainite. d) Middle, core: 15% martensite 77% bainite. and some amount of RA e) Bottom, surface: 30% ferrite 70% bainite. f)
Bottom, core: 56% martensite 44% bainite and some amount of RA.
Figure 21. Microstructure of the samples taken from different places on beam 2(top, middle, bottom). Magnification x60. a) Top, surface:
20% ferrite 80% bainite. b) Top, core: 29% tempered martensite 71%bainite. c) Middle, surface: 22% ferrite 78% bainite. d) Middle, core:
36% tempered martensite 64% bainite. e) Bottom, surface: 18% ferrite 82% bainite. f) Bottom, core: 38% tempered martensite 62%
bainite.

32
Figure 22. Microstructure of the samples taken from different places on beam 3(top, middle, bottom). Magnification x60. a) Top, surface:
11,5% ferrite 88,5% bainite. b) Top, core 22% martensite/ hard to tell amount of RA 76% bainite. c) Middle, surface 10,5% ferrite 89,5%
bainite and some amount of RA. d) Middle, core: 24% martensite 76% bainite. e) Bottom, surface: 10% ferrite 90% bainite. f) Bottom,
core: 24% martensite 76% bainite and some amount of RA.
Figure 23. Microstructure of the samples taken from different places on beam 4(top, middle, bottom). Magnification x60. a) Top, surface:
31% ferrite 69% bainite. b) Top, core: 18% ferrite 12% tempered martensit 70%bainite. c) Middle, surface: 12% ferrite 79% bainite. d)
Middle, core: 32% tempered martensite 68% bainite. e) Bottom, surface: 19,5% ferrite 80,5%bainite. f) Bottom, core: 11% ferrite 38%
tempered martensite 51% bainite.
33
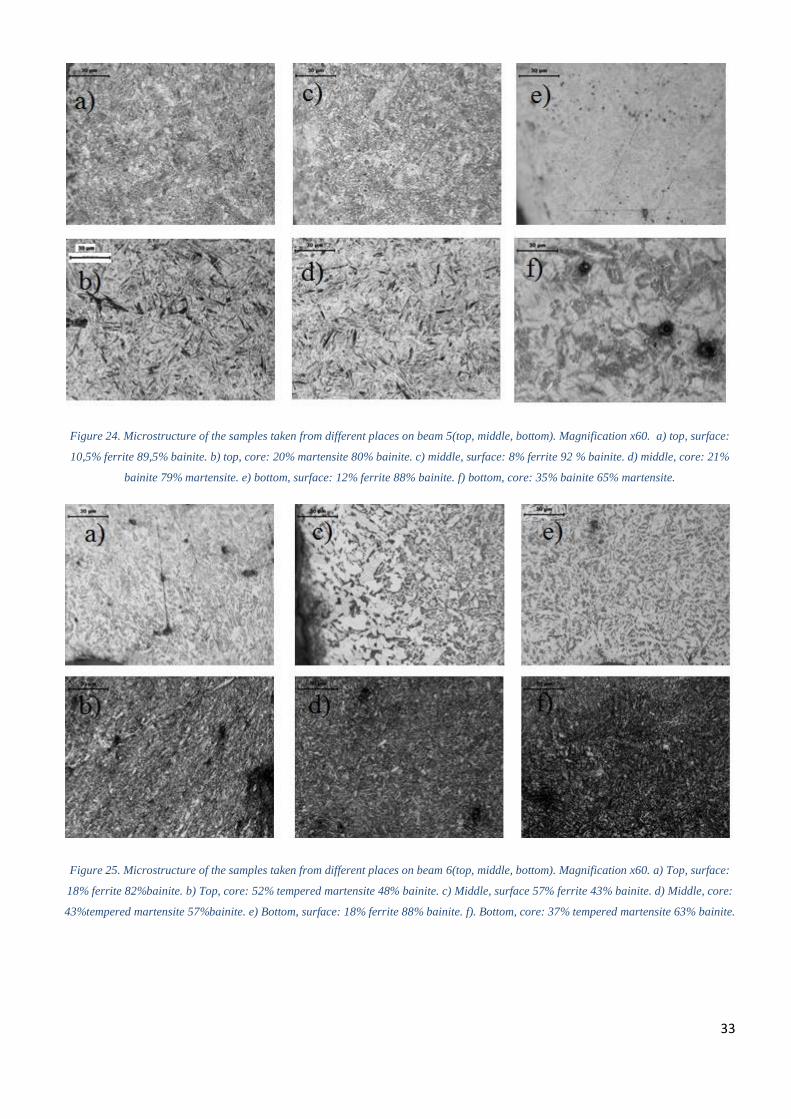
Figure 24. Microstructure of the samples taken from different places on beam 5(top, middle, bottom). Magnification x60. a) top, surface:
10,5% ferrite 89,5% bainite. b) top, core: 20% martensite 80% bainite. c) middle, surface: 8% ferrite 92 % bainite. d) middle, core: 21%
bainite 79% martensite. e) bottom, surface: 12% ferrite 88% bainite. f) bottom, core: 35% bainite 65% martensite.
Figure 25. Microstructure of the samples taken from different places on beam 6(top, middle, bottom). Magnification x60. a) Top, surface:
18% ferrite 82%bainite. b) Top, core: 52% tempered martensite 48% bainite. c) Middle, surface 57% ferrite 43% bainite. d) Middle, core:
43%tempered martensite 57%bainite. e) Bottom, surface: 18% ferrite 88% bainite. f). Bottom, core: 37% tempered martensite 63% bainite.
34
Figure 26. CCT-diagram for 41CrMo4 showing the cooling rate of the surface and the core. Fig to the left represent ideally, fig to the right
represent decarburization of surface [23].
4.3 Hardness at surface and core
The result from the surface and core hardness can be seen in fig.27-32. Were Q=quenched and Q+T=
quenched then tempered in the diagrams. The results from the surface hardness test that was performed
on the fist can be seen in fig.33-35.
Figure 27. The core hardness from as-quenched and tempered top and bottom sample. Hardness taken on 5 different positions for article
5158 see figure to the right.
Ferrite phase moves
to the left
35
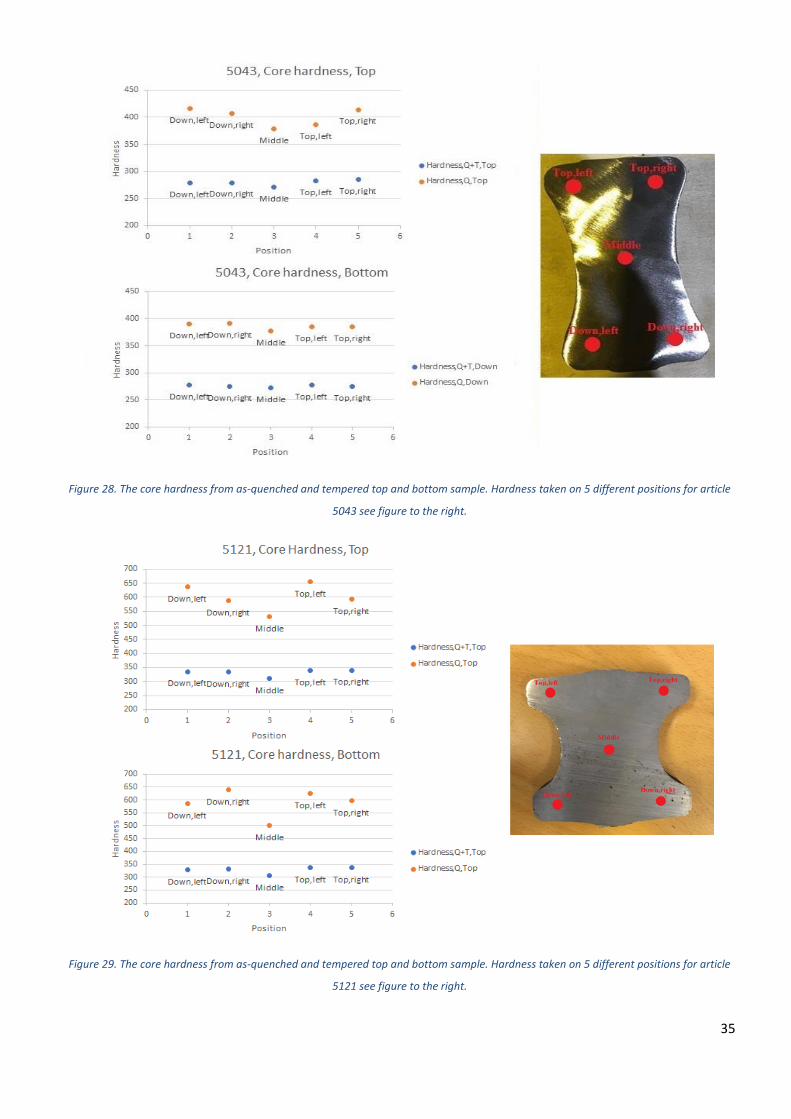
Figure 28. The core hardness from as-quenched and tempered top and bottom sample. Hardness taken on 5 different positions for article
5043 see figure to the right.
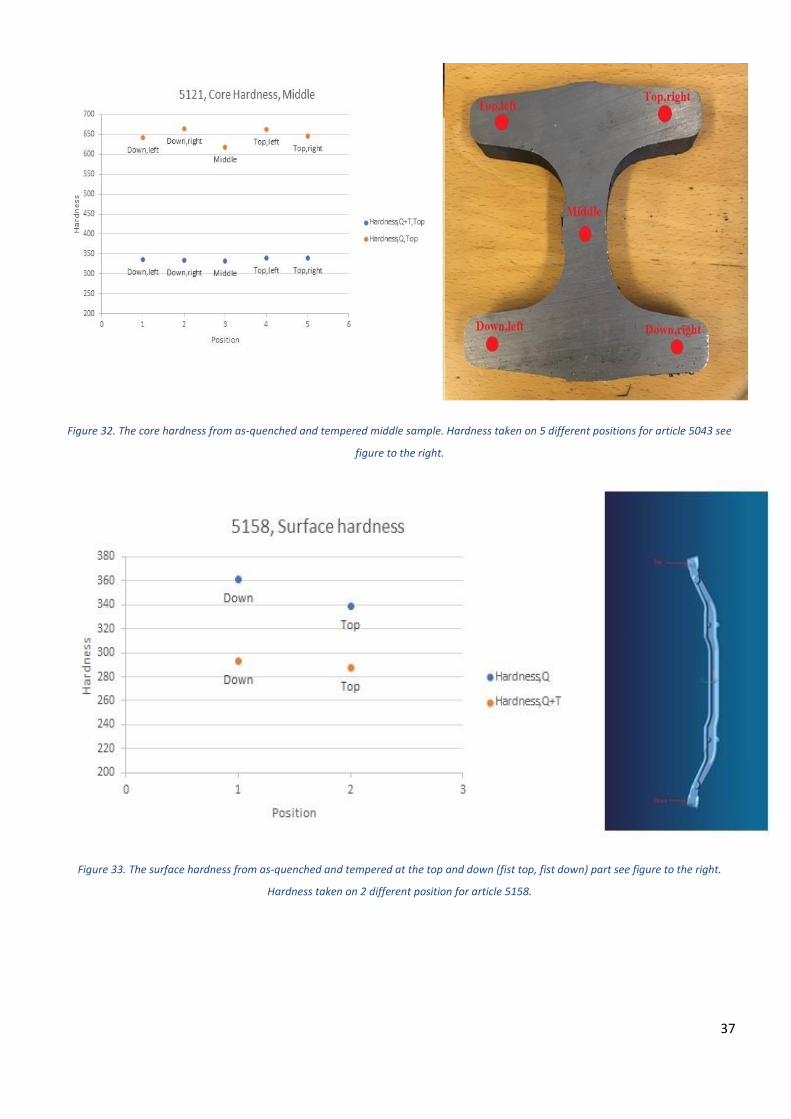
Figure 29. The core hardness from as-quenched and tempered top and bottom sample. Hardness taken on 5 different positions for article
5121 see figure to the right.
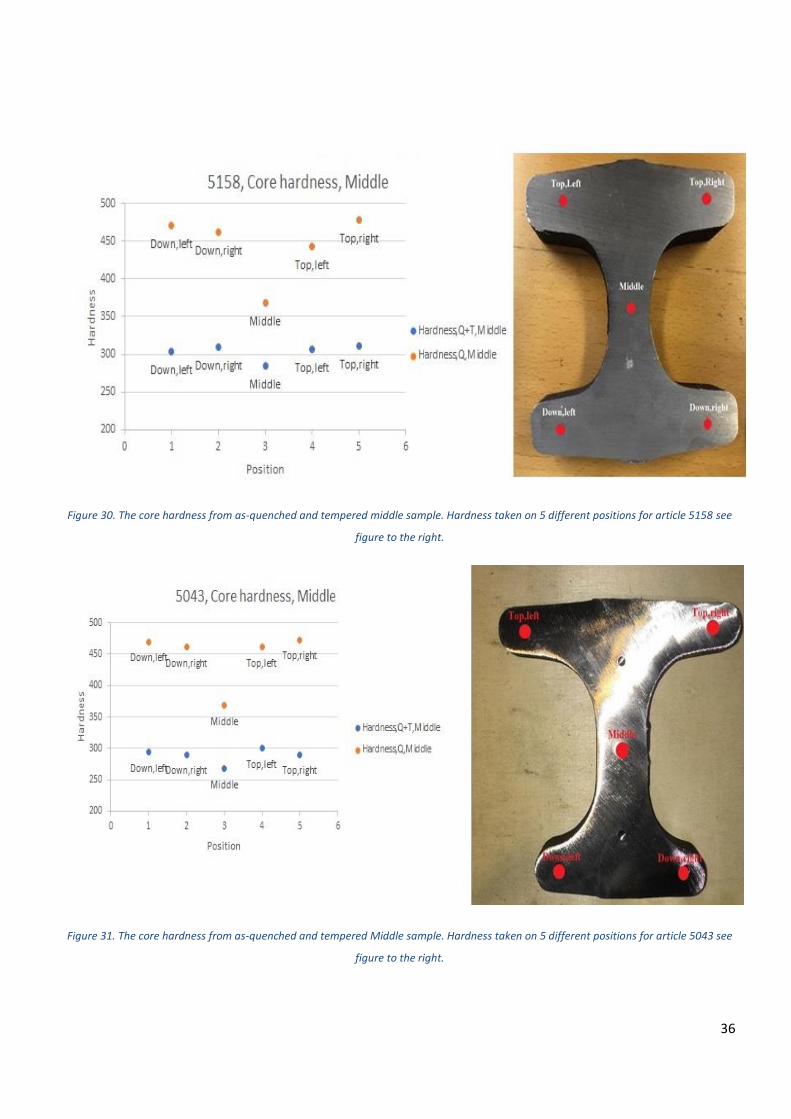
36
Figure 30. The core hardness from as-quenched and tempered middle sample. Hardness taken on 5 different positions for article 5158 see
figure to the right.
Figure 31. The core hardness from as-quenched and tempered Middle sample. Hardness taken on 5 different positions for article 5043 see
figure to the right.
37
Figure 32. The core hardness from as-quenched and tempered middle sample. Hardness taken on 5 different positions for article 5043 see
figure to the right.
Figure 33. The surface hardness from as-quenched and tempered at the top and down (fist top, fist down) part see figure to the right.
Hardness taken on 2 different position for article 5158.
38
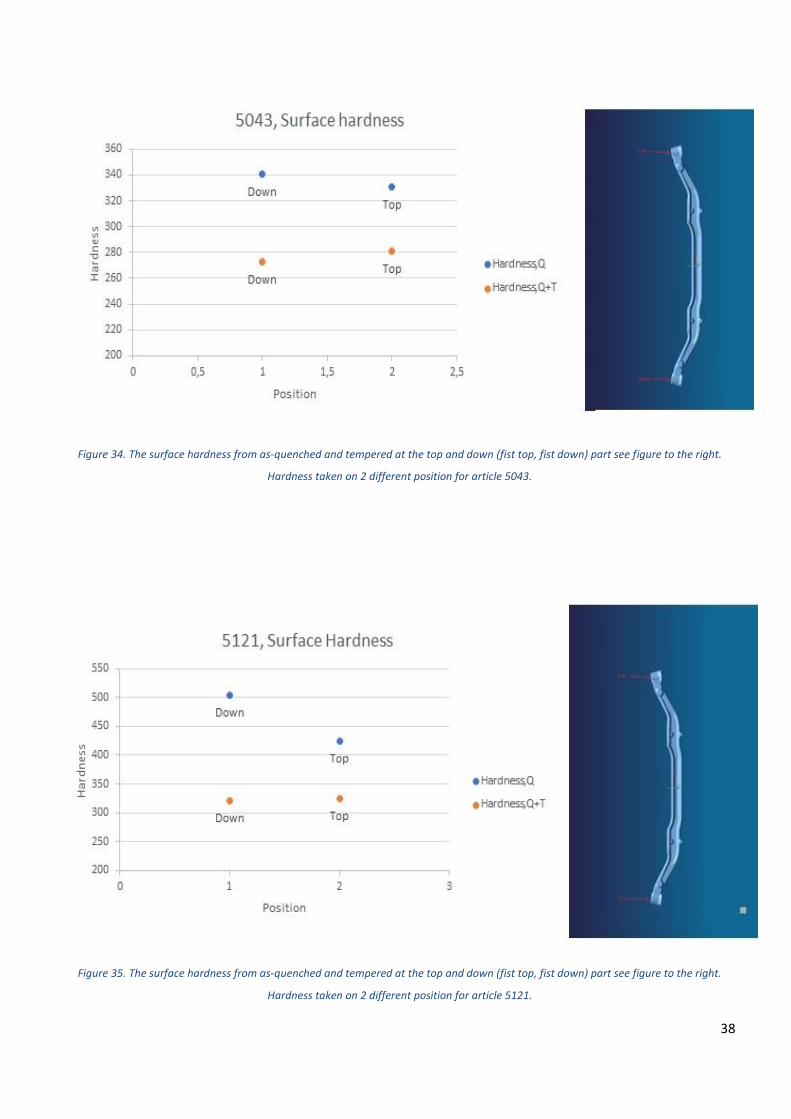
Figure 34. The surface hardness from as-quenched and tempered at the top and down (fist top, fist down) part see figure to the right.
Hardness taken on 2 different position for article 5043.
Figure 35. The surface hardness from as-quenched and tempered at the top and down (fist top, fist down) part see figure to the right.
Hardness taken on 2 different position for article 5121.

39
5.Discussion
The results that have been acquired from different part of the thesis will be discussed.
5.1 Actual retained austenite in comparison to the theoretical calculation
From the results of both theoretical and actual amount of retained austenite that’s in the sample, it can be
said that the theoretical value of RA is within range of the actual amount for both bottom and the middle
sample. Because from the theoretical calculations 4,4% retained austenite was acquired, and the XRD
analysis gave 6±2% retained austenite for both the bottom and middle sample. But, it deviates by a bit
for the top sample, because here the analysis gave 8±2% retained austenite. This deviation could be
because the top part of the beam has a slower cooling compared with the bottom sample. Slower cooling
leads to higher levels of retained austenite. The bottom sample cools down faster because it is the one
that goes down first into the quenching bath that has not been affected by any pre-heating, compared
with the top sample that goes down in a quenching bath that is not really at the 35°C because it has been
preheated by the previous parts of the front axle beam which leads to a slower cooling. This slower
cooling does not really affect the front axle beam that much most likely because the carbon content is
that of a medium steel and not a high carbon steel that can have a lot of retained austenite, so, the
difference between the bottom part and the top part would be greater than it is for medium steels. The
empirical eq (1) has a confidence interval of ±25 meaning that the Ms temperature is not the actual
starting temperature for the martensite transformation and is more of an estimation. Because this
calculation is an estimation and eq (2) is also an empirical equation the total amount of retained austenite
can have a big error source. To reduce this error and get closer to the results from table 9 a dilatometry
needs to be used for calculation of the Ms temperature. With the dilatometry, a steels martensite starting
temperature can be calculated exactly. The general idea of how the dilatometry works is by heating a
sample to the austenitization temperature then quenching it fast. From that the dilatometry can plot the
volume changes against temperature. When martensite forms the density changes which means that the
dilatometry is an excellent tool for calculating in what temperature martensite start to form in a material.
5.2 Microstructure surface and core
No martensite has been detected on the surface for all beams 1 to 6, its instead ferrite and bainite that
dominates the surface structure. There is no martensite in the surface because of decarburization which
removes the carbon that martensite needs to transform, which means that the surface is not the hardest
part of the beam. Overview pictures was done for beam 1, 3 and 5 with a magnification of x12 and can
be seen in appendix 2. Observation shows that there are some parts of the samples which have
decarbonized quite a bit, see fig 36. Because of carbon disappear from the surface, the cct-diagram
changes. This can be represented by fig.26 for the material 41CrMo4, where the left is roughly how the
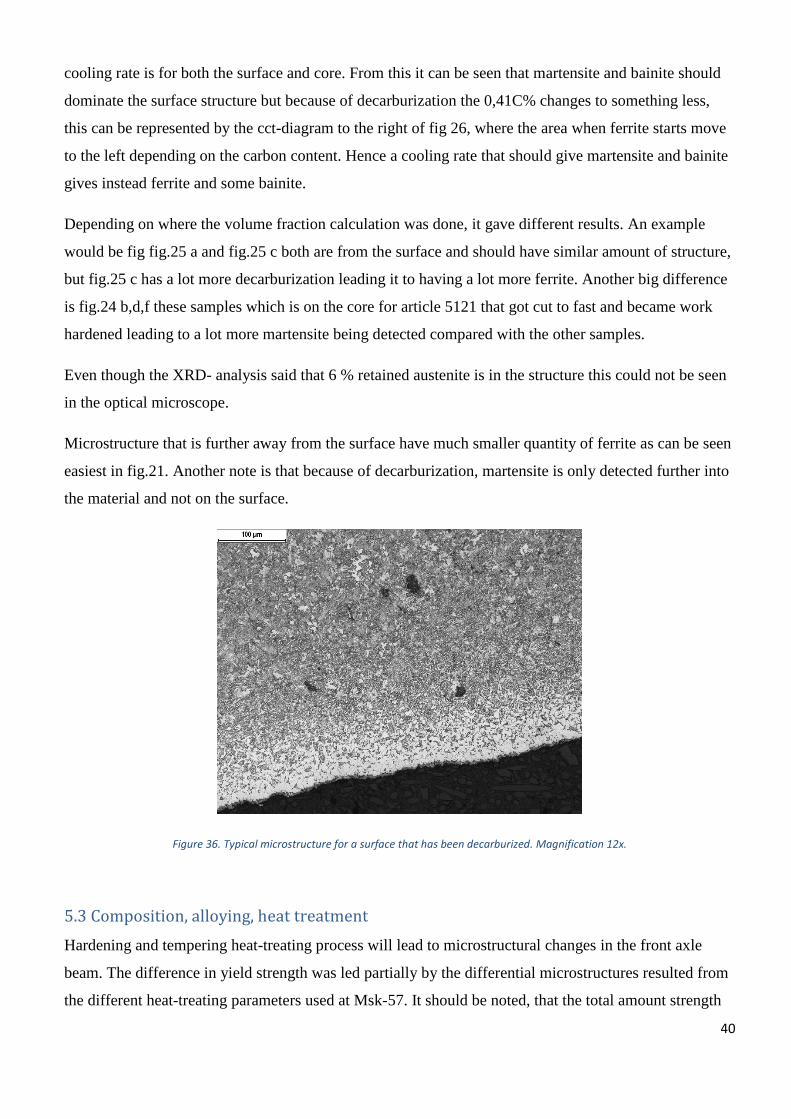
40
cooling rate is for both the surface and core. From this it can be seen that martensite and bainite should
dominate the surface structure but because of decarburization the 0,41C% changes to something less,
this can be represented by the cct-diagram to the right of fig 26, where the area when ferrite starts move
to the left depending on the carbon content. Hence a cooling rate that should give martensite and bainite
gives instead ferrite and some bainite.
Depending on where the volume fraction calculation was done, it gave different results. An example
would be fig fig.25 a and fig.25 c both are from the surface and should have similar amount of structure,
but fig.25 c has a lot more decarburization leading it to having a lot more ferrite. Another big difference
is fig.24 b,d,f these samples which is on the core for article 5121 that got cut to fast and became work
hardened leading to a lot more martensite being detected compared with the other samples.
Even though the XRD- analysis said that 6 % retained austenite is in the structure this could not be seen
in the optical microscope.
Microstructure that is further away from the surface have much smaller quantity of ferrite as can be seen
easiest in fig.21. Another note is that because of decarburization, martensite is only detected further into
the material and not on the surface.
Figure 36. Typical microstructure for a surface that has been decarburized. Magnification 12x.
5.3 Composition, alloying, heat treatment
Hardening and tempering heat-treating process will lead to microstructural changes in the front axle
beam. The difference in yield strength was led partially by the differential microstructures resulted from
the different heat-treating parameters used at Msk-57. It should be noted, that the total amount strength
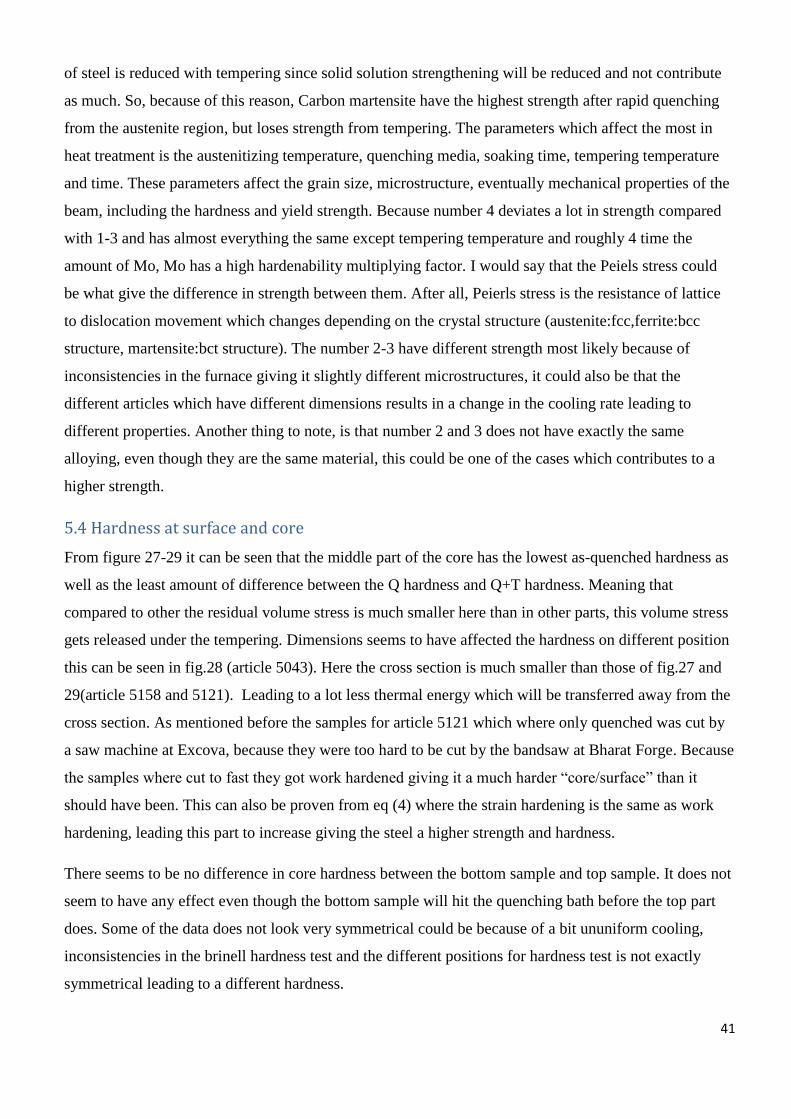
41
of steel is reduced with tempering since solid solution strengthening will be reduced and not contribute
as much. So, because of this reason, Carbon martensite have the highest strength after rapid quenching
from the austenite region, but loses strength from tempering. The parameters which affect the most in
heat treatment is the austenitizing temperature, quenching media, soaking time, tempering temperature
and time. These parameters affect the grain size, microstructure, eventually mechanical properties of the
beam, including the hardness and yield strength. Because number 4 deviates a lot in strength compared
with 1-3 and has almost everything the same except tempering temperature and roughly 4 time the
amount of Mo, Mo has a high hardenability multiplying factor. I would say that the Peiels stress could
be what give the difference in strength between them. After all, Peierls stress is the resistance of lattice
to dislocation movement which changes depending on the crystal structure (austenite:fcc,ferrite:bcc
structure, martensite:bct structure). The number 2-3 have different strength most likely because of
inconsistencies in the furnace giving it slightly different microstructures, it could also be that the
different articles which have different dimensions results in a change in the cooling rate leading to
different properties. Another thing to note, is that number 2 and 3 does not have exactly the same
alloying, even though they are the same material, this could be one of the cases which contributes to a
higher strength.
5.4 Hardness at surface and core
From figure 27-29 it can be seen that the middle part of the core has the lowest as-quenched hardness as
well as the least amount of difference between the Q hardness and Q+T hardness. Meaning that
compared to other the residual volume stress is much smaller here than in other parts, this volume stress
gets released under the tempering. Dimensions seems to have affected the hardness on different position
this can be seen in fig.28 (article 5043). Here the cross section is much smaller than those of fig.27 and
29(article 5158 and 5121). Leading to a lot less thermal energy which will be transferred away from the
cross section. As mentioned before the samples for article 5121 which where only quenched was cut by
a saw machine at Excova, because they were too hard to be cut by the bandsaw at Bharat Forge. Because
the samples where cut to fast they got work hardened giving it a much harder “core/surface” than it
should have been. This can also be proven from eq (4) where the strain hardening is the same as work
hardening, leading this part to increase giving the steel a higher strength and hardness.
There seems to be no difference in core hardness between the bottom sample and top sample. It does not
seem to have any effect even though the bottom sample will hit the quenching bath before the top part
does. Some of the data does not look very symmetrical could be because of a bit ununiform cooling,
inconsistencies in the brinell hardness test and the different positions for hardness test is not exactly
symmetrical leading to a different hardness.

42
For the middle sample (I section) the fig.30-32 looks very symmetrical in their looks, except for 5121
quenched sample because of the same reason as before that they got work hardened giving a higher
value than they would have been. Even though the middle part of the sample for fig.30-32 is the closest
to the surface and have a lot of surface area to transfer its heat to, yet it is almost the softest of all other
cores inclusive the middle part of the samples from fig.27-29. This Indicate that the middle part of the I
section could have one of the slowest cooling across the whole beam. Could be that the heat from other
sections of the beam transfers to the middle part of the I section, because of the first statement of the 2nd
law of thermodynamics [19]- “Heat flows spontaneously from a hot to a cold body”- meaning that the
middle part gets cold down fast but it gets continuously heated by the sounding area giving it a softer
core at the end.
The surface hardness from fig.33-35, indicates that the part of the beam that goes down first gets a faster
quench than the top part of the beam. This is because of when the beam goes down it heats up the part of
the quenching bath that surrounds it from 35°C to a much higher value, by the time the top part of the
beam hits the quenching bath the temperature of the quenchant at the surface is no longer the initial
temperature of 35°C, but a much higher one. Most of the hardness from the quenching as can be seen in
the fig.33-35, gets lowered from tempering and reaches some sort of equilibrium of hardness at the down
and top part of the beam. There exist some weird values like the tempering value for fig.34, where the
down fist has a lower hardness than the top fist, even though for the quenching values it is the opposite.
This can be explained by going back to the microstructure analysis. From the microstructure analysis the
reason for the weird values of hardness, could be because of decarburization. That the Brinell hardness
test was performed on a surface that had been more decarburized than the rest. Another thing is of
course the human factor in the whole process of acquiring the values.
5.5 Relation between as-quench hardness and final surface hardness.
The result from taking the difference in hardness from as-quenched against the final surface hardness at
different tempering temperatures can be seen in fig.37 for the material 41CrS4. DeltaHardness=
quenched surface hardness- tempered surface hardness. Thus, it is represented as a line that goes up
instead of the normal norm where with the increase of tempering temperature the line goes down similar
to fig.2. The equation in the fig.37 can be used to see what type of tempering is needed, for the hardness
which is desired outside the data points. The acquired data for tempering at 535 °C deviates a bit from
the linear line of the DeltaHardness. Because the data points were close to a linear line a trendline was
done so that the equation could be shown for it. This equation should make up for the inconsistencies in
the data to calculate the exact hardness at a certain tempering temperature, x is the tempering
temperature. This diagram is done with a starting hardness of 346,44 HB from a austenitization
43
temperature of 850°C. The starting hardness after quenching is a mean value from all articles with the
same material that was quenched from the same temperature. This quenched hardness has a lot of
deviations at most a deviation of 84HB. For the pure data go to appendix 4. This inconsistency in the
surface hardness after quenching proves that the relation diagram in fig.37 can only be counted as an
estimation a not an exact hardness you will get from using the diagram to help decide a tempering
temperature. The way to use the diagram is by: As quench hardness – Deltahardness= final hardness
after tempering. An example would be look as the following:
The costumer wants a final surface hardness of 280HB: 346,44HB-280HB=66,44HB. By using fig.37 it
can be seen that the tempering temperature which is needed is 553°C.
The result from taking the difference in hardness from as-quenched against the final surface hardness
after tempering can be seen in fig.38 for the material 40CrMo4. Fig.38 is not as extensive as fig.37
because of lack of data, which could not be acquired during the projects run. For fig.38 the diagram
shows no inconsistencies in the data because the diagram is done with only two different tempering
temperatures. But a linear equation of the data points makes up for the lacking data in the figure where x
is the tempering temperature. The as-quenched hardness was acquired from a quenching at 860 °C. but
when doing the relation diagram, the hardness used against the tempering hardness was the as-quenched
hardness from each article. So, no mean value for the as-quenched hardness was used because the
deviation was too great between the lowest hardness measured and the highest hardness measured. To be
able to use the as-quenched hardness like was done for fig.37 similar number of samples tested needed
to be performed to get a more reasonable mean value.
What is causing the inconstancies in these results can be of a few factors. When the surface hardness is
measured at Msk-57 there will naturally be inconstancies because the brinell hardness is measured with
an optical microscope. Which is done with different operators that measures differently from each
other’s. Other things like not a constant FQ concentration gives a different result same goes with the
quenching bath temperature. Even the hardening furnace and the tempering furnace can have some
effect on the value if they are not isolated properly.

44
Figure 37. Relation diagram between as-quench hardness and final surface hardness with different tempering temperature for the
material 41CrS4.
Figure 38. Relation diagram between as-quench hardness and final surface hardness with different tempering temperature for the
material 40CrMo4.
y = 0,6428x - 279,41
0
10
20
30
40
50
60
70
80
90
530 535 540 545 550 555 560 565
DeltaH
ard
ness in H
B
Tempering temperature (°C)
Hardness reduction for 41CrS4
DeltaHardness in HB
Linjär (DeltaHardness in HB)
y = 1,3x - 612,7
0
20
40
60
80
100
120
140
160
574 575 576 577 578 579 580 581
DeltaH
ard
ness in H
B
Tempering temperature (°C)
Hardness reduction for 40CrMo4
DeltaHardness in HB
Linjär (DeltaHardness in HB)
45
6.Conclusions
The main scope of this work was to determine what effect the heat treatment have on the final
properties. From the laboratory and hardness test the following conclusion could be drawn.
• For the theoretical calculation of the retained austenite vs the actual amount it could and could
not be a good representation of the amount of retained austenite. After all it diviates at the top
part of the beam, most likely because of a slower cooling rate.
• The surface of the beams decarbonizes leading to a higher amount of ferrite at the structure and
softer surface. Because of this 15 mm into the material is harder than at-surface. Seems that the
walking beam furnace is not completely preventing the decarburization of the steel surface.
• Even though the heat treatment parameters have a significant effect on the properties of the front
axle steel beam. From the results it can be concluded, that the major thing that affects the
strength of the beam is the alloying amount.
• Dimensions have a significant effect when it comes to cooling down the part and achieve as close
to uniform hardness as possible.
• Even though the Middle point of the middle sample is one of the closest cores to the surface, it is
the area that probably has one of the slowest cooling in the beam giving it a softer core.
• Core hardness is test on the top or bottom does not have any significant changes between them.
• While there exists hardness difference after quenching between different points in the core they
even out after tempering.
• No perlite was found at the surface and the core.
• The relation between as-quench hardness and final surface hardness was done. With the help of
the Relation diagram the final hardness which is desired can be achieved.
• The relation diagram only works for material 41CrS4 and 40CrMo4.
46
7.Future work
The research presented in this thesis have most likely answered most questions that has been received.
Some lines of research arising from this thesis could be pursued.
A more thorough investigation of the martensite starting temperature could be done with a dilatometry.
To acquire the real Ms temperature this to see if the empirical equation for the calculation of retained
austenite works better “closer to the actual amount”. Testing of retained austenite was done for the steel
material 41CrS4 and not for 40CrMo4. This could be interesting to see if they will have similar
deviation or not. Trying to decrease the step size in the X-ray diffraction analysis for a more precise
check of the amount of retained austenite in the sample.
For the core hardness, it would be interesting if one could measure temperature on different part of the
core in the I section, with a measuring devise. This could give a better understanding of how the cooling
rate is at different parts of the beam for different cross-sections.
Try to simulate how the fluid flows around the beam in the quenching bath, this will give a better
understanding of how to get a more uniform/better cooling.
Because there was deviation in strength for two articles with the same material and heat treatment it
would be interesting to do a heat detection test of the hardening furnace to see if there are some
inconsistences in the furnace or not.
It would be interesting to see what type of structure would be achieved in the beams if it was quenched
in 5% FEROQUENCH 2000 instead of 7% in this study.
When it comes to the relation between as-quench hardness and final surface hardness.for both 41CrS4
and 40CrMo4, further data of the surface hardness before tempering and after tempering could always be
of interest to increase the certainty of the predicted final surface hardness. Especially more data was
needed for the 40CrMo4 only data from two articles was acquired. Testing the hardness of the surface
could also be better, if a more automatic brinnell hardness measuring device was used like the brinell
hardness measuring machine at msk-50. By using that brinnell measuring machine the error the different
operators have would disappear or lessen by lot.
47
8. References
[1] http://bharatforge.com/, 2017-02-03
[2] Verhoeven, John D, Steel Metallurgy for the Non-metallurgist, Materials Park, Ohio: ASM
International. 2007.
[3] Serope Kalpakjian, Steven Schmid, Manufacturing engineering and technology, fifth ed., Singapore:
Prentice Hall, 2006.
[4] Reardon, Arthur C, Metallurgy for the Non-metallurgist, Materials Park, Ohio: ASM International.
2011
[5] http://www.imoa.info/molybdenum-uses/molybdenum-grade-alloy-steels-irons/hardening.php, 2017-
05-21
[6] Krauss, G., Steel-Processing, Structure, and Performance, second edition. Ohio: ASM International
2015
[7] Sourmail, T., Garcia Mateo, C., Critical assessment of models for predicting the Ms temperature of
steels, Computational Material Science, Vol. 34, pp. 323-334
[8] Smallman, R. E., Ngan, A. H. W., Modern Physical Metallurgy,Eigth ed, UK : Butterworth-
Heinemann. 2014
[9] http://www.twi-global.com/technical-knowledge/faqs/material-faqs/faq-what-are-the-
microstructural-constituents-austenite-martensite-bainite-pearlite-and-ferrite/, 2017-04-06
[10] Madeleine Durand-Charre, Microstructure of Steels and Cast Irons, Springer; 2004 edition
[11] G.E. totten, C.E. Bates, and N,A. Clinton, Handbook of quenchants and quenching technology,
ASM international, 1993.
[12] http://www.galindbergprocessteknik.se/ 2017-04-02
[13] D.P.Koistinen, R.E.Marburger,”A general equation prescribing the extent of the austenite-
martensite transformation in pure iron-carbon alloys and plain carbon steels”, ACTA Metallurgica 1959,
vol, pp. 59-60
[14] http://www.heat-treat-doctor.com/documents/RetainedAustenite.pdf, 2017-03-25
[15] William D. Callister Jr., Materials Science and Engineering an Introduction. York: Wiley, 2007
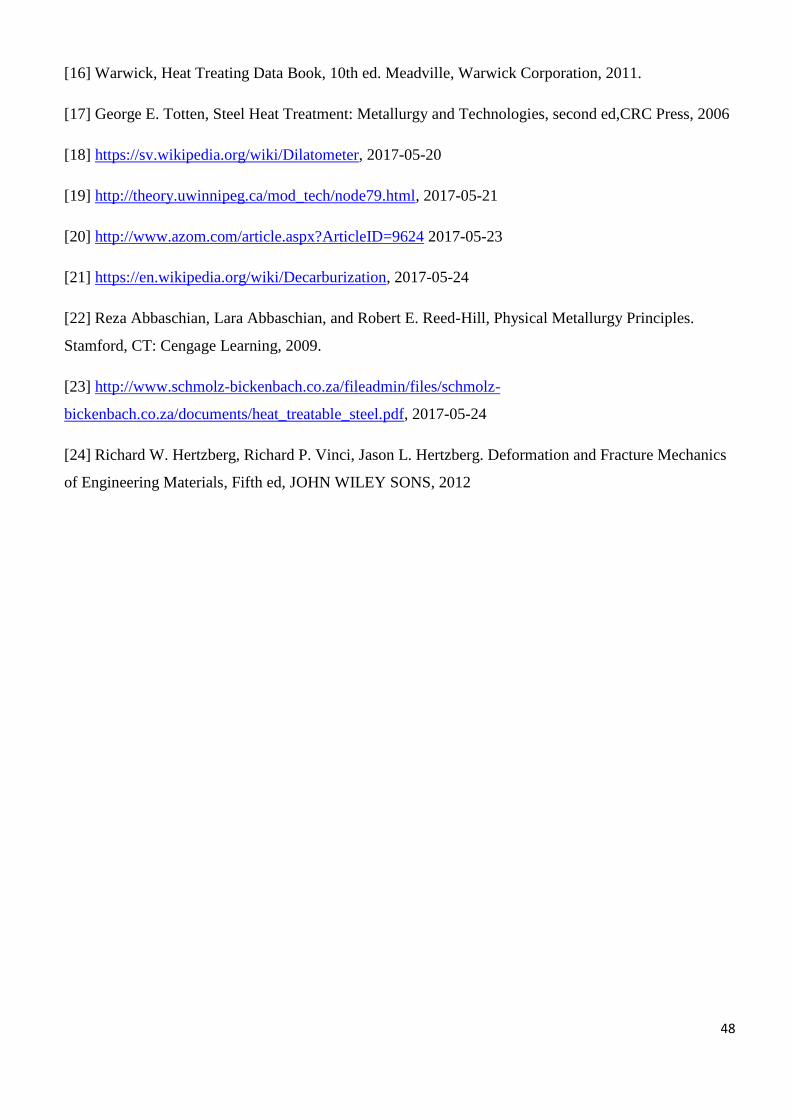
48
[16] Warwick, Heat Treating Data Book, 10th ed. Meadville, Warwick Corporation, 2011.
[17] George E. Totten, Steel Heat Treatment: Metallurgy and Technologies, second ed,CRC Press, 2006
[18] https://sv.wikipedia.org/wiki/Dilatometer, 2017-05-20
[19] http://theory.uwinnipeg.ca/mod_tech/node79.html, 2017-05-21
[20] http://www.azom.com/article.aspx?ArticleID=9624 2017-05-23
[21] https://en.wikipedia.org/wiki/Decarburization, 2017-05-24
[22] Reza Abbaschian, Lara Abbaschian, and Robert E. Reed-Hill, Physical Metallurgy Principles.
Stamford, CT: Cengage Learning, 2009.
[23] http://www.schmolz-bickenbach.co.za/fileadmin/files/schmolz-
bickenbach.co.za/documents/heat_treatable_steel.pdf, 2017-05-24
[24] Richard W. Hertzberg, Richard P. Vinci, Jason L. Hertzberg. Deformation and Fracture Mechanics
of Engineering Materials, Fifth ed, JOHN WILEY SONS, 2012
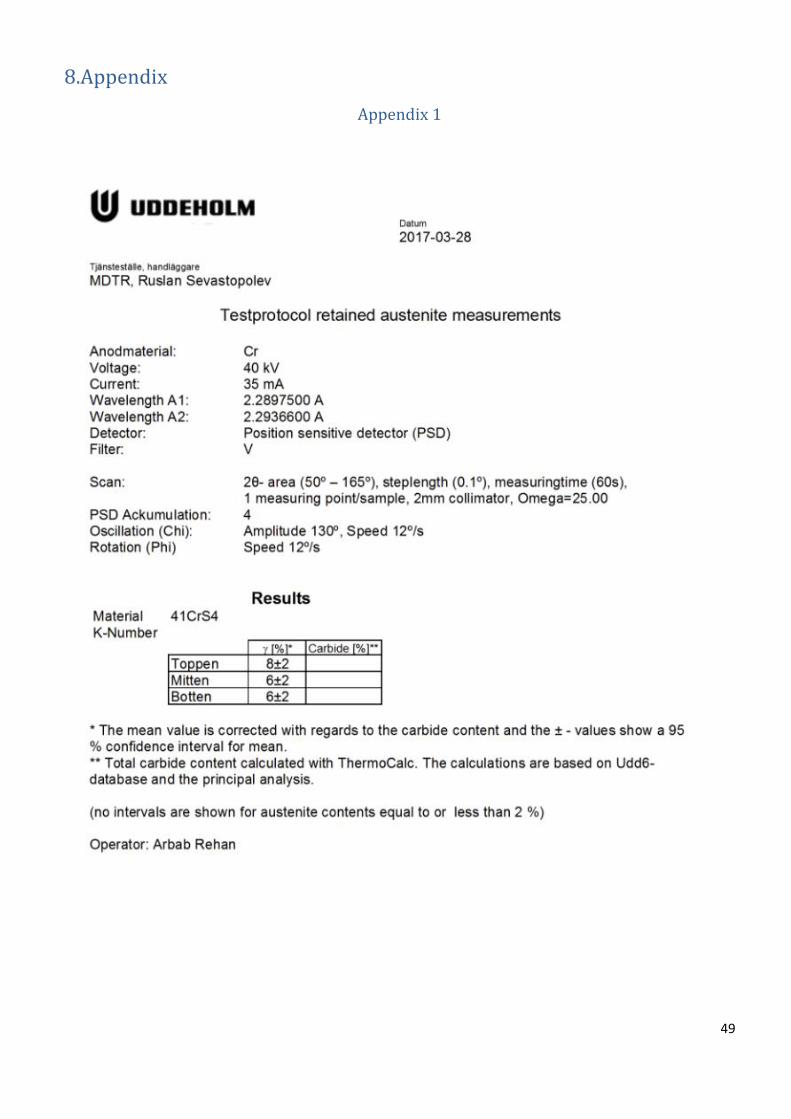
49
8.Appendix
Appendix 1
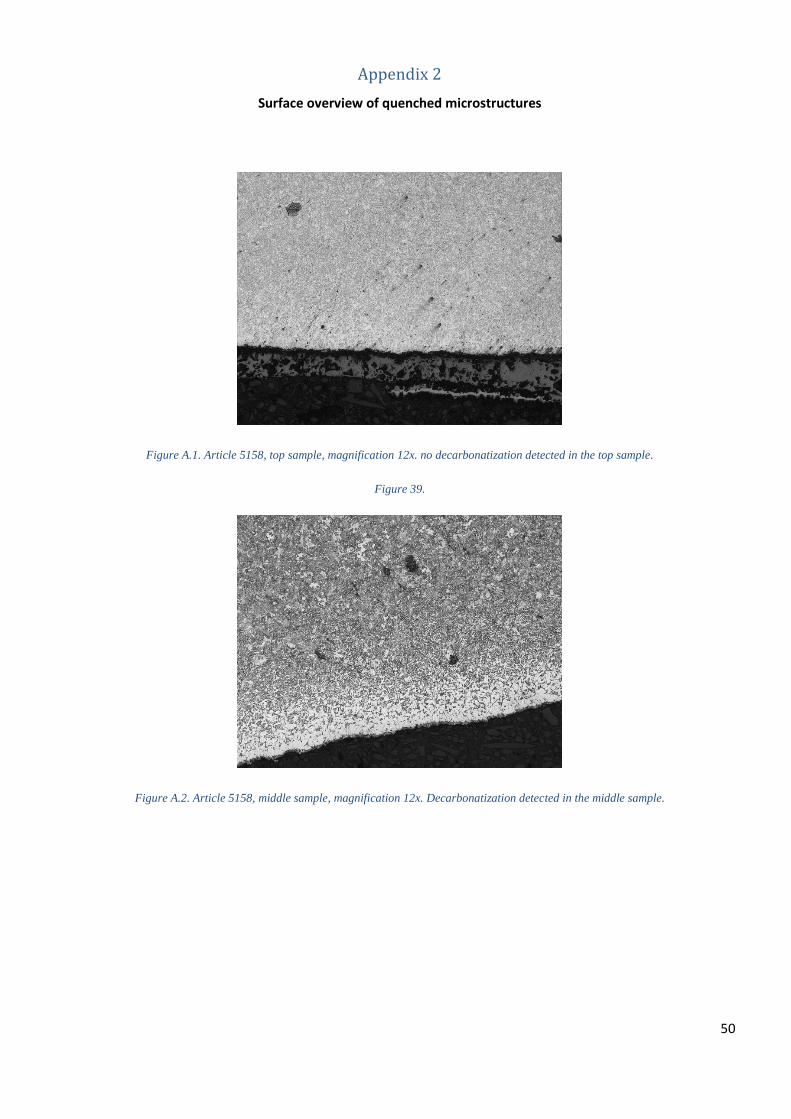
50
Appendix 2
Surface overview of quenched microstructures
Figure A.1. Article 5158, top sample, magnification 12x. no decarbonatization detected in the top sample.
Figure 39.
Figure A.2. Article 5158, middle sample, magnification 12x. Decarbonatization detected in the middle sample.

51
Figure A.3 Article 5158, bottom sample, magnification 12x. Decarbonatization detected in the bottom sample.
Figure A.4. Article 5043, top sample, magnification 12x. No decarbonatization detected in the top sample.
52
Figure A.5. Article 5043, middle sample, magnification 12x. Decarbonatization detected in the middle sample.
Figure A.6. Article 5043, bottom sample, magnification 12x. No decarbonatization detected in the bottom sample.

53
Figure A.7. Article 5121, top sample, magnification 12x. No decarbonatization detected in the top sample.
Figure A.8. Article 5121, middle sample, magnification 12x. Decarbonatization detected in the middle sample.
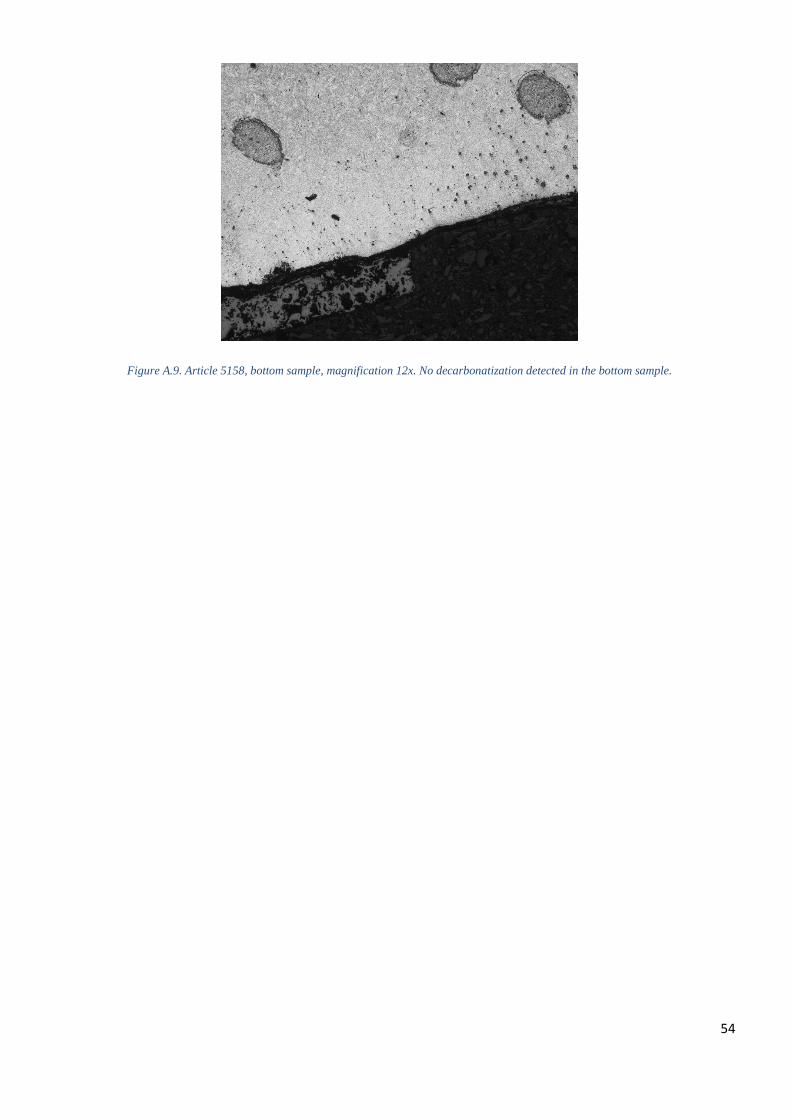
54
Figure A.9. Article 5158, bottom sample, magnification 12x. No decarbonatization detected in the bottom sample.

55
Appendix 3
Q =Quenched, T=Tempered
Figure A.10. Article 5158, top sample, Q, core, magnification 60x.
Figure A.11. Article 5158, top sample, Q, surface, magnification 60x.

56
Figure A.12. Article 5158, middle sample, Q, core, magnification 60x.
Figure A.13. Article 5158, middle sample, Q, surface, magnification 60x.
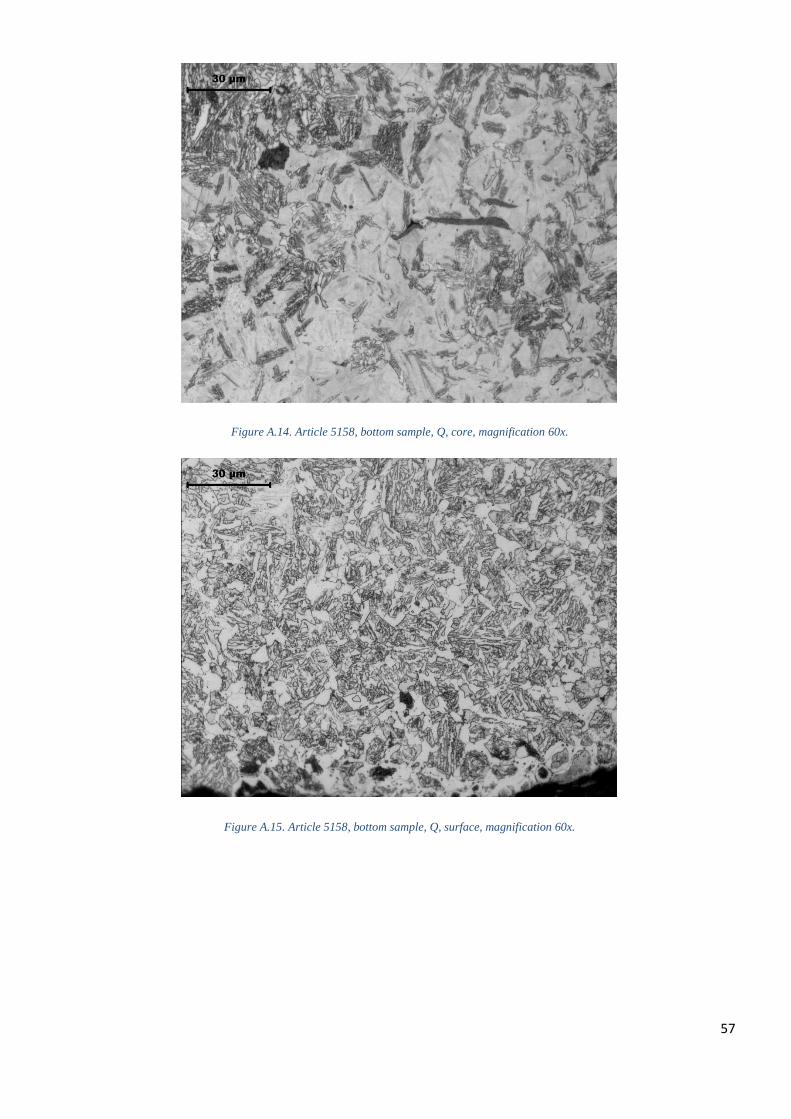
57
Figure A.14. Article 5158, bottom sample, Q, core, magnification 60x.
Figure A.15. Article 5158, bottom sample, Q, surface, magnification 60x.

58
Figure A.16. Article 5158, top sample, Q+T, core, magnification 60x.
Figure A.17. Article 5158, top sample, Q+T, surface, magnification 60x.
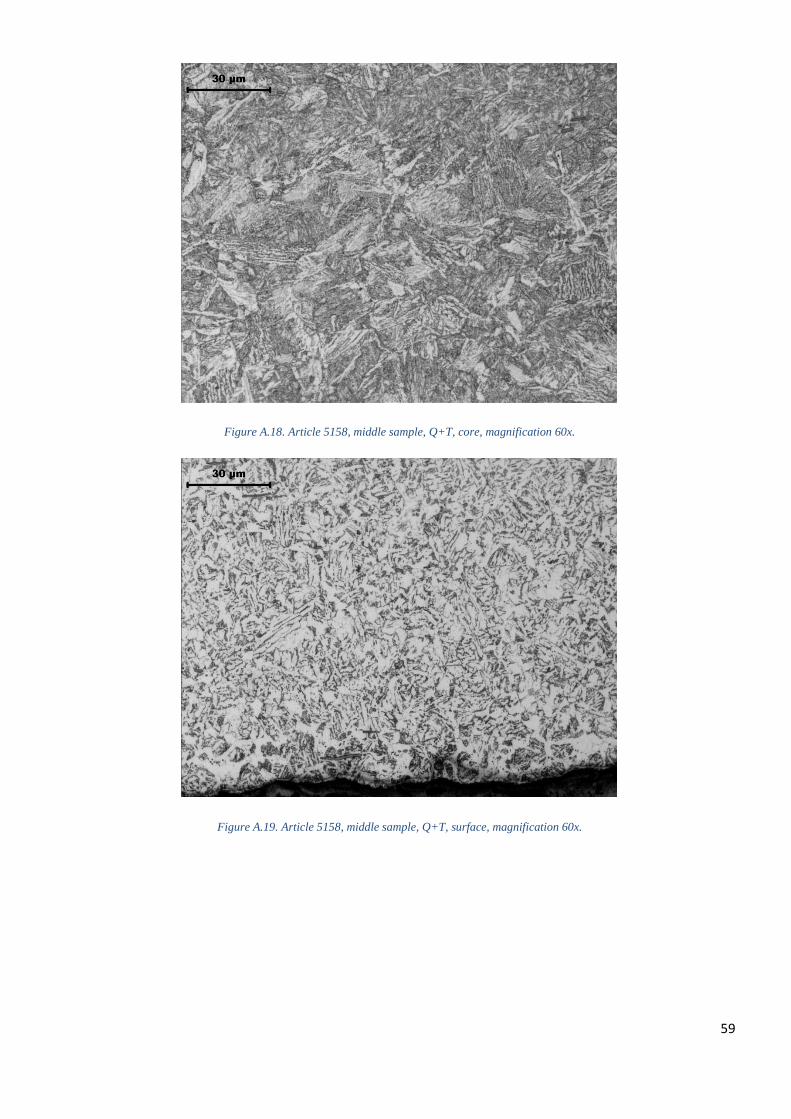
59
Figure A.18. Article 5158, middle sample, Q+T, core, magnification 60x.
Figure A.19. Article 5158, middle sample, Q+T, surface, magnification 60x.
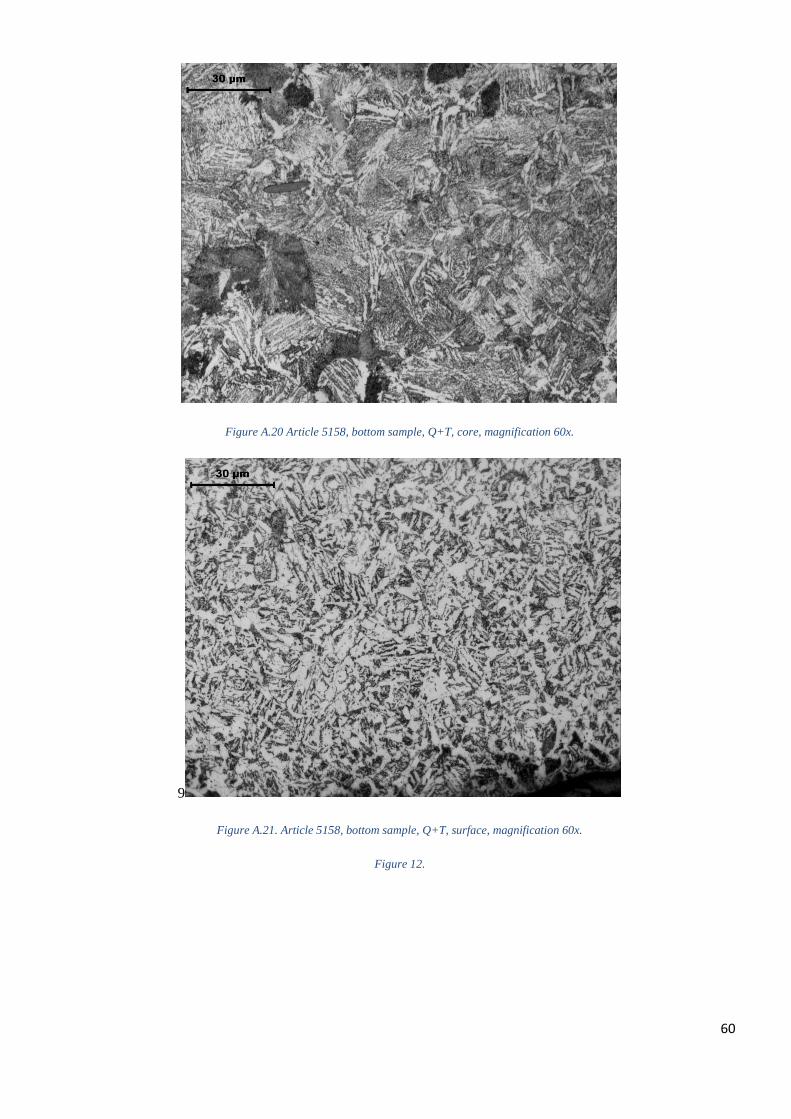
60
Figure A.20 Article 5158, bottom sample, Q+T, core, magnification 60x.
9
Figure A.21. Article 5158, bottom sample, Q+T, surface, magnification 60x.
Figure 12.

61
Figure 60. Article 5043, top sample, Q, core, magnification 60x.
Figure A.22. Article 5043, top sample, Q, surface, magnification 60x.
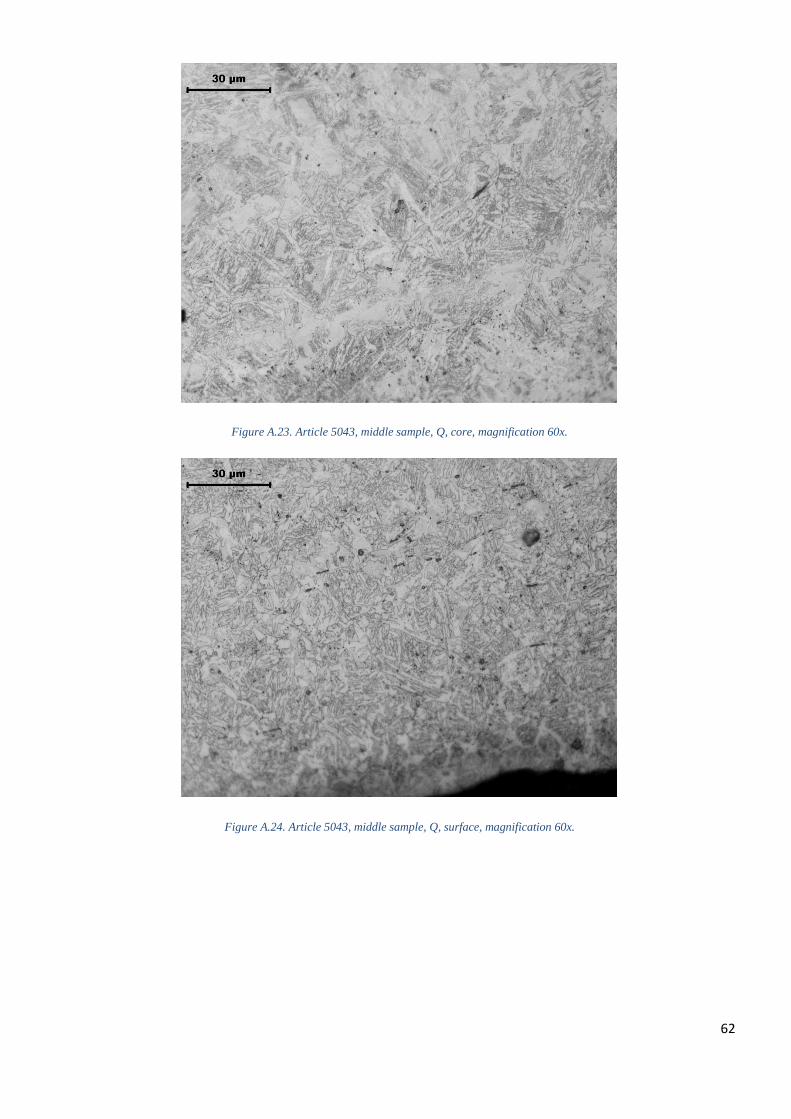
62
Figure A.23. Article 5043, middle sample, Q, core, magnification 60x.
Figure A.24. Article 5043, middle sample, Q, surface, magnification 60x.
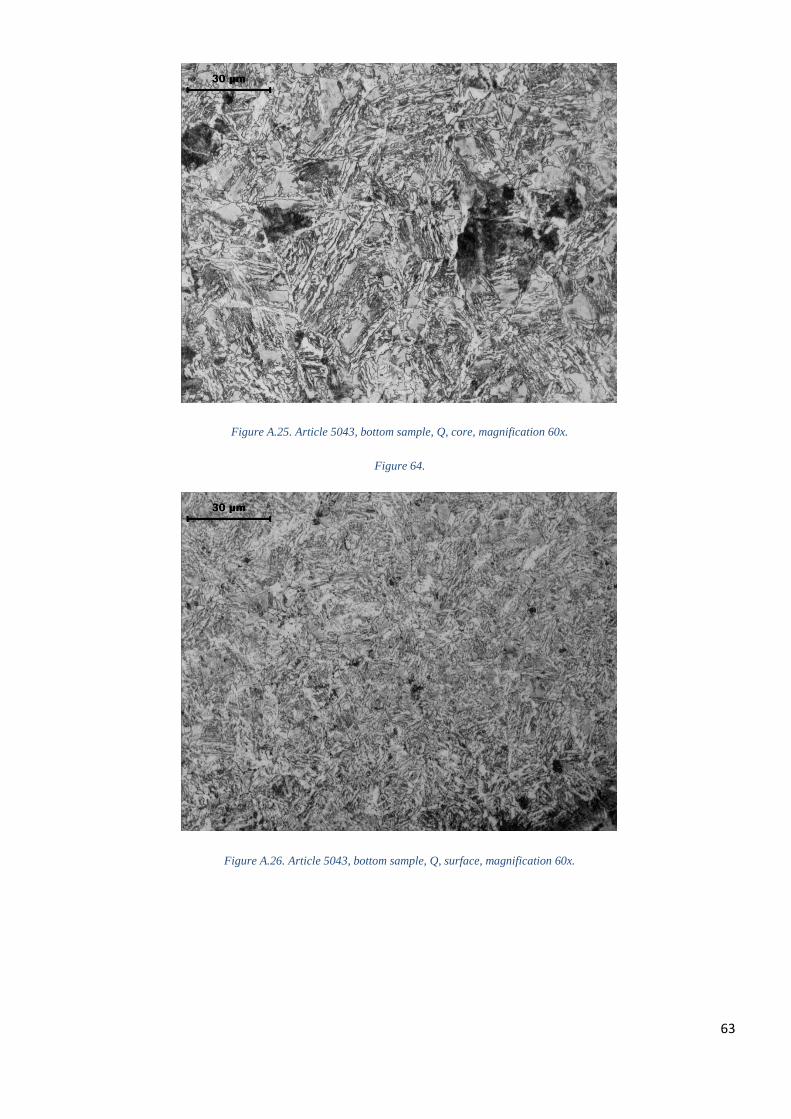
63
Figure A.25. Article 5043, bottom sample, Q, core, magnification 60x.
Figure 64.
Figure A.26. Article 5043, bottom sample, Q, surface, magnification 60x.
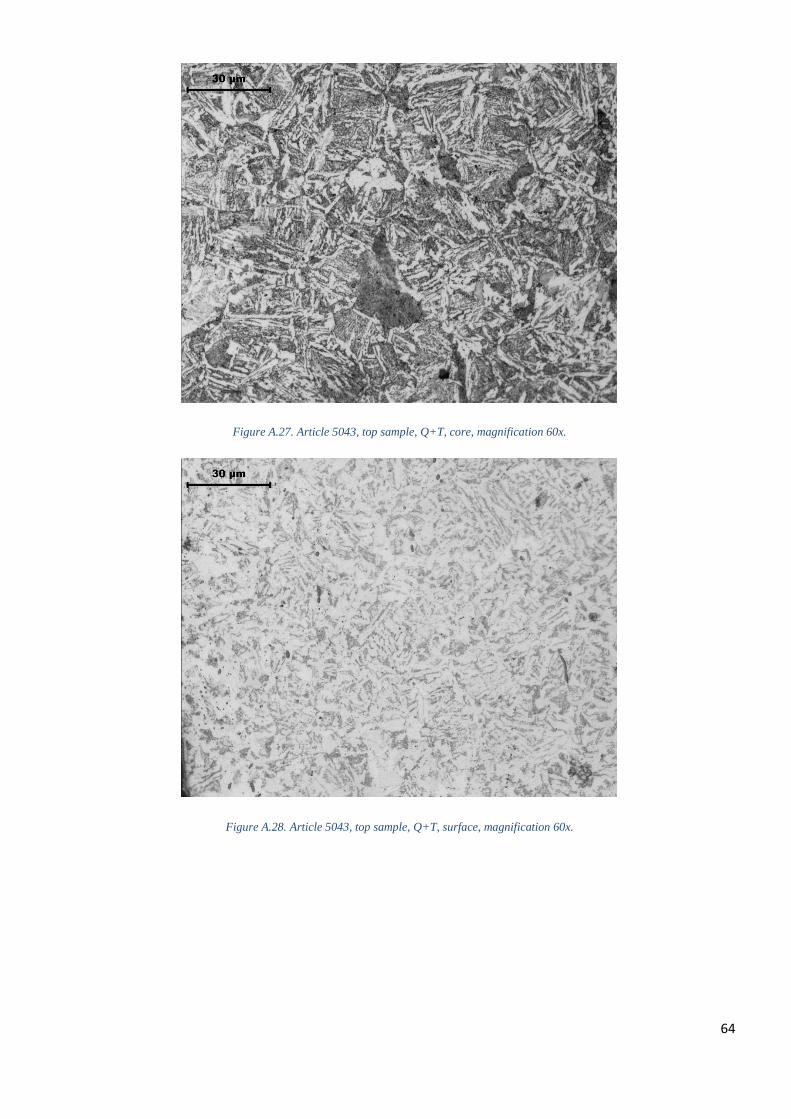
64
Figure A.27. Article 5043, top sample, Q+T, core, magnification 60x.
Figure A.28. Article 5043, top sample, Q+T, surface, magnification 60x.
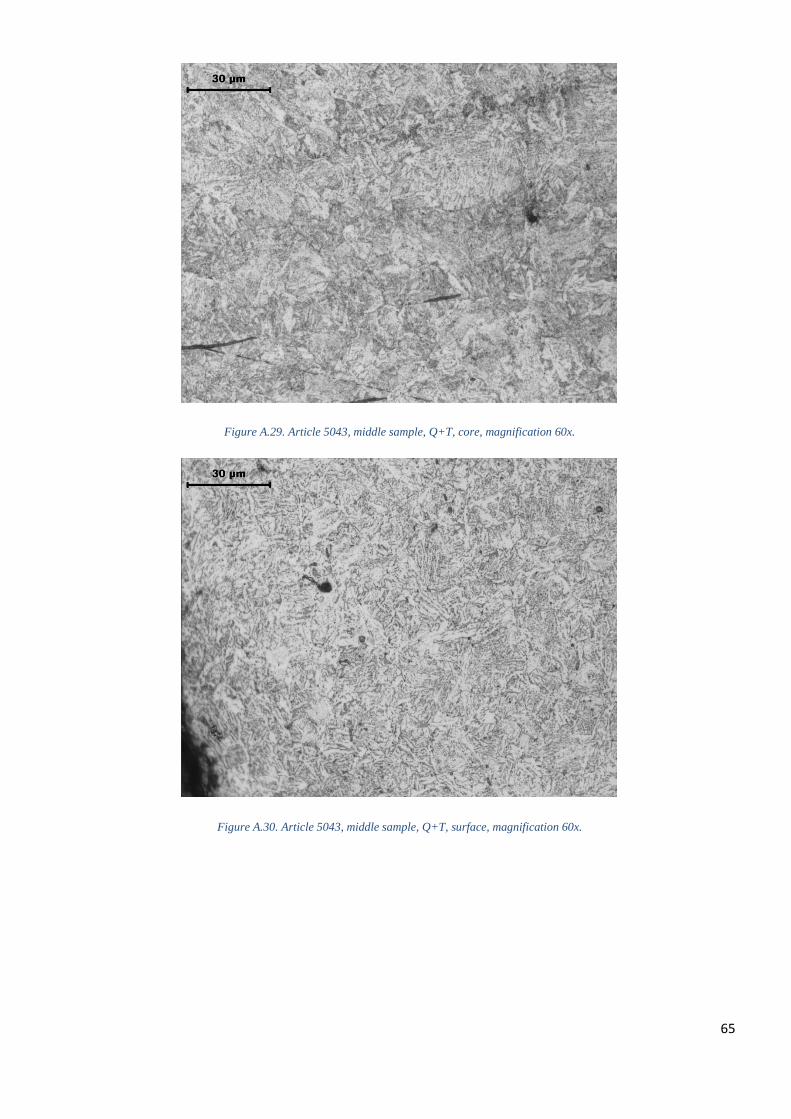
65
Figure A.29. Article 5043, middle sample, Q+T, core, magnification 60x.
Figure A.30. Article 5043, middle sample, Q+T, surface, magnification 60x.
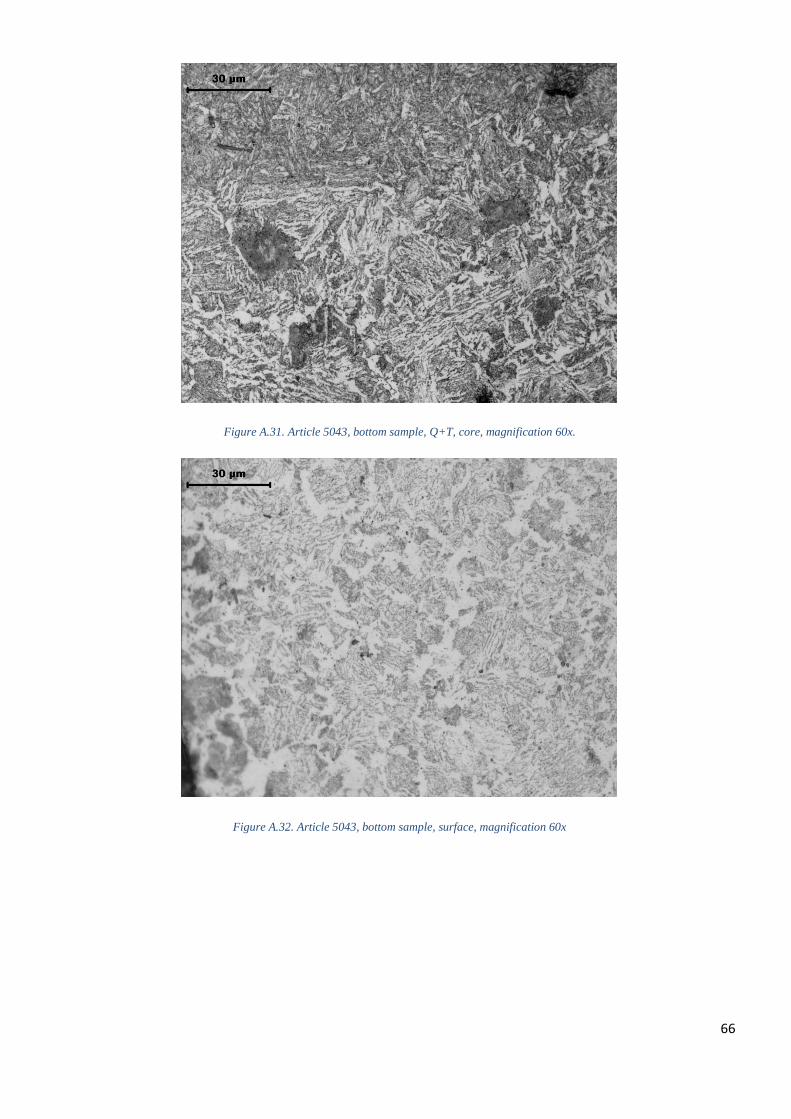
66
Figure A.31. Article 5043, bottom sample, Q+T, core, magnification 60x.
Figure A.32. Article 5043, bottom sample, surface, magnification 60x

67
Figure A.33. Article 5151, top sample, Q, core, magnification 60x.
Figure A.34. Article 5151, top sample, Q, surface, magnification 60x.
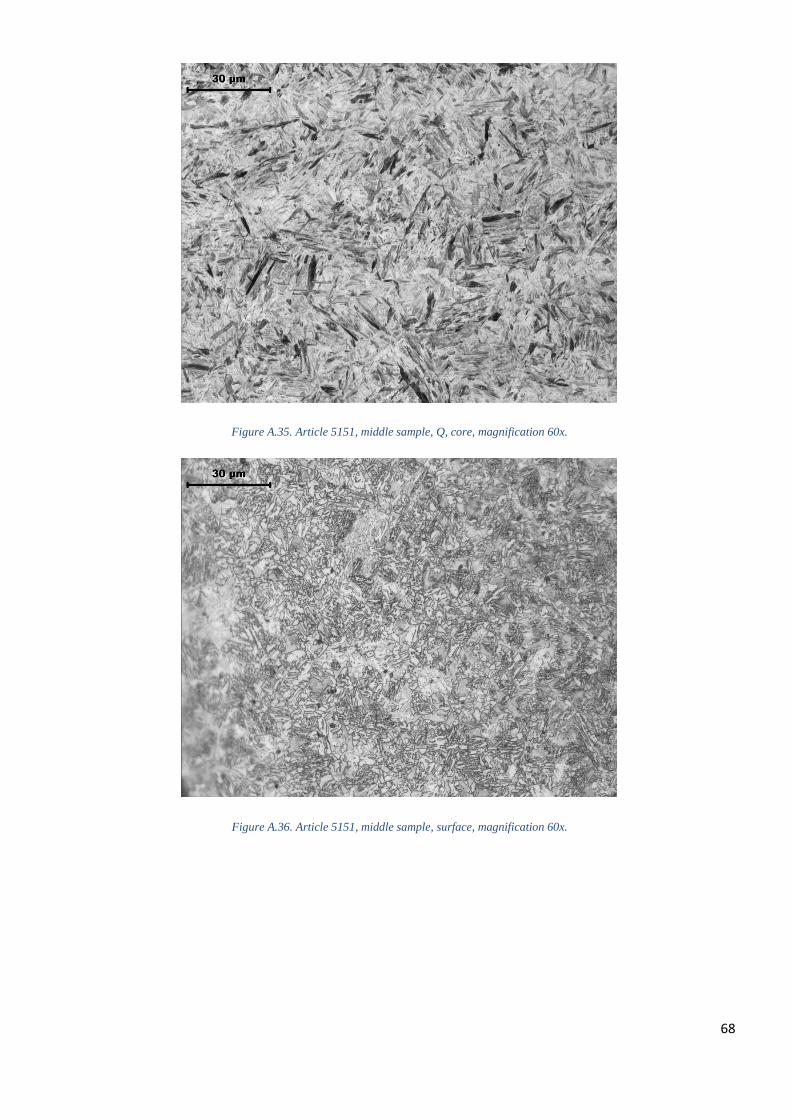
68
Figure A.35. Article 5151, middle sample, Q, core, magnification 60x.
Figure A.36. Article 5151, middle sample, surface, magnification 60x.
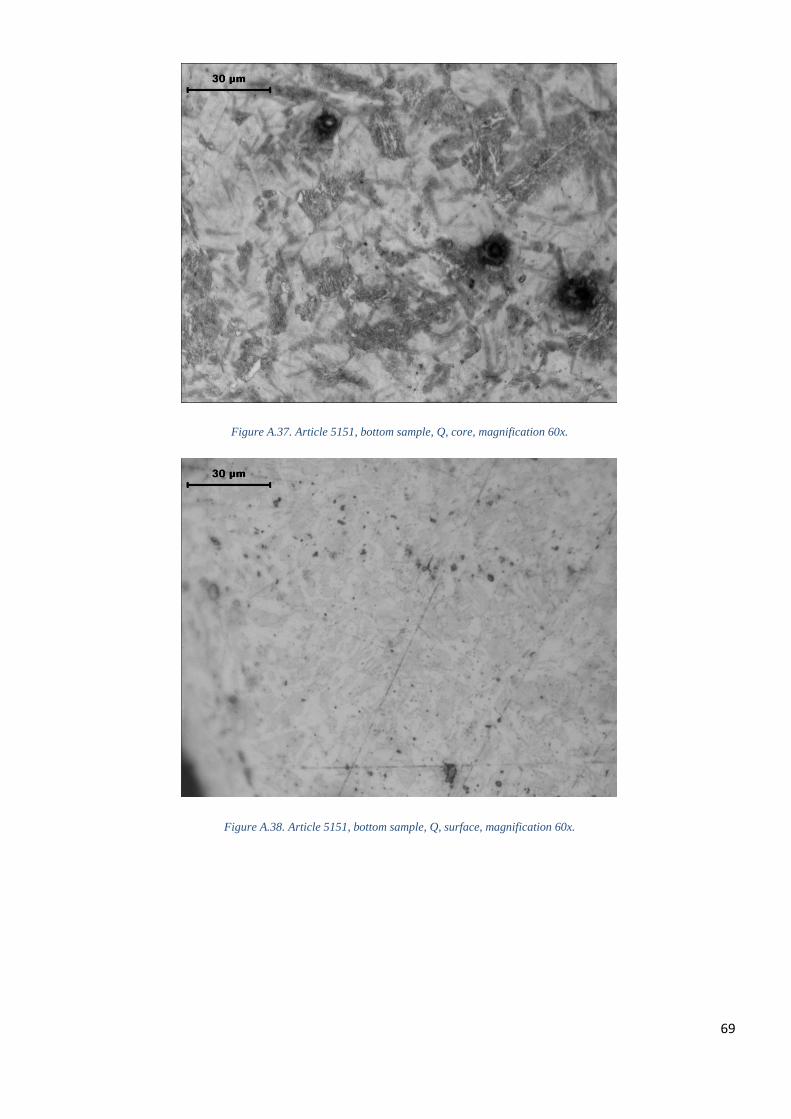
69
Figure A.37. Article 5151, bottom sample, Q, core, magnification 60x.
Figure A.38. Article 5151, bottom sample, Q, surface, magnification 60x.
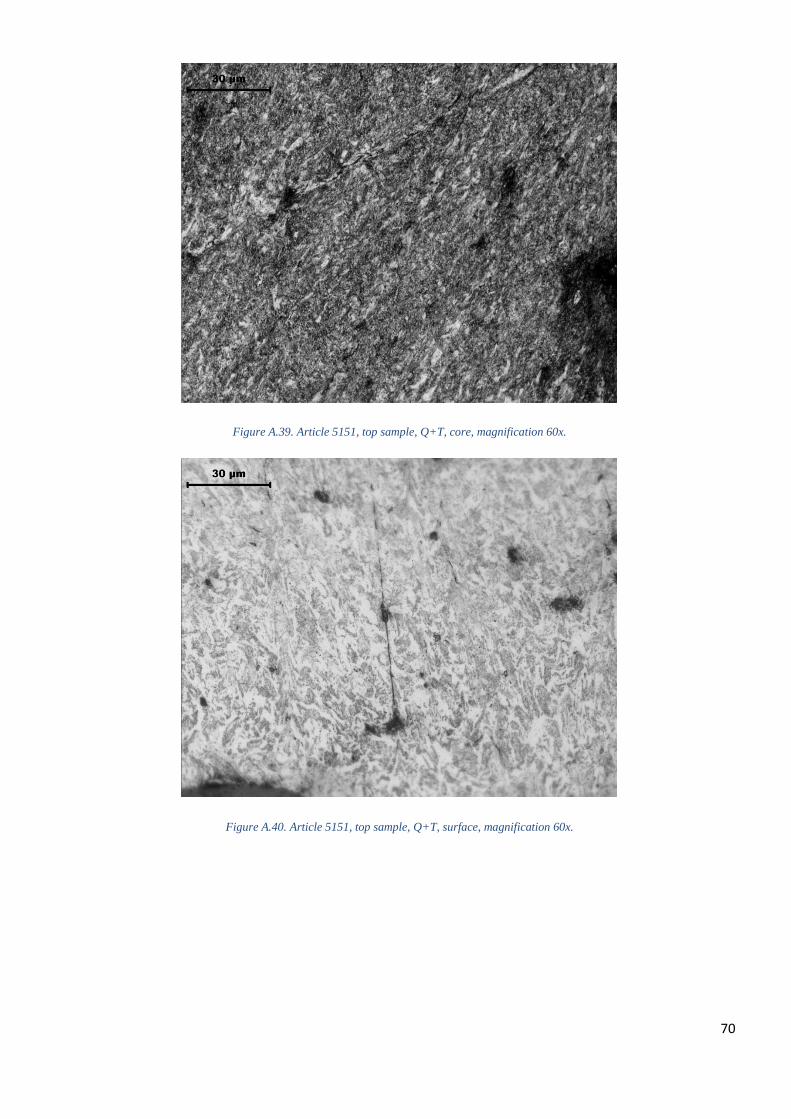
70
Figure A.39. Article 5151, top sample, Q+T, core, magnification 60x.
Figure A.40. Article 5151, top sample, Q+T, surface, magnification 60x.

71
Figure A.41. Article 5151, middle sample, Q+T, core, magnification 60x.
Figure A.42. Article 5151, middle sample, Q+T, surface, magnification 60x.
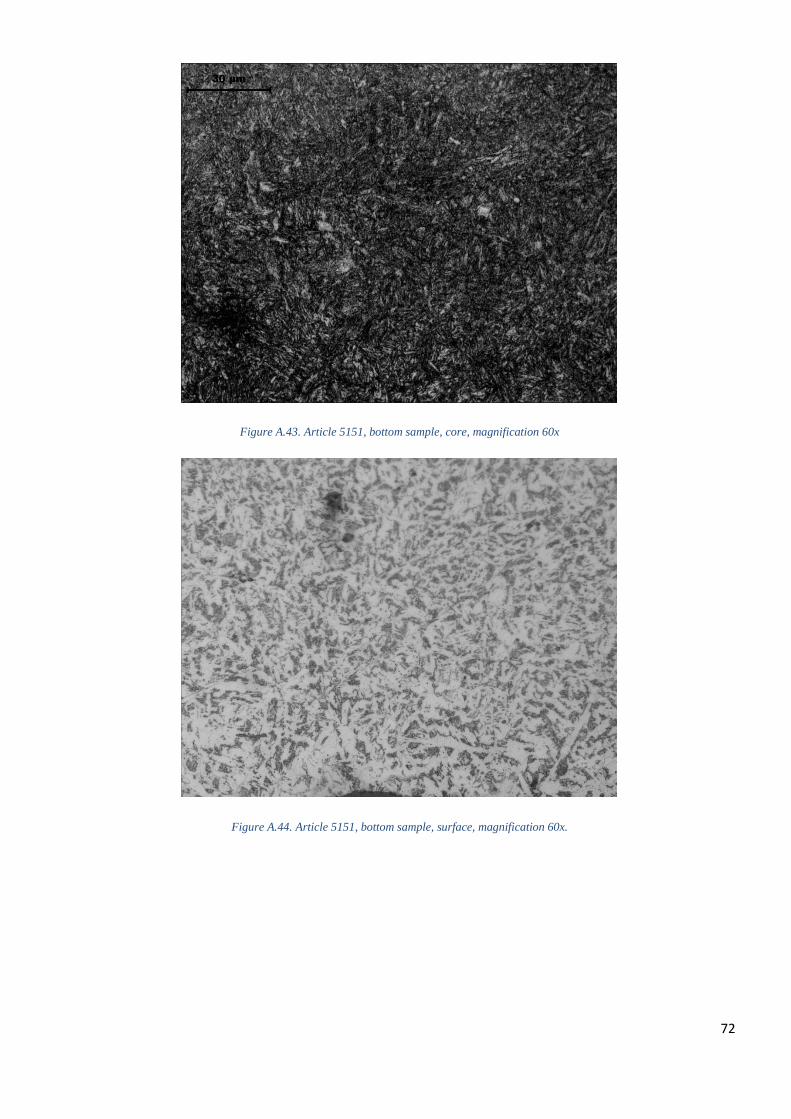
72
Figure A.43. Article 5151, bottom sample, core, magnification 60x
Figure A.44. Article 5151, bottom sample, surface, magnification 60x.
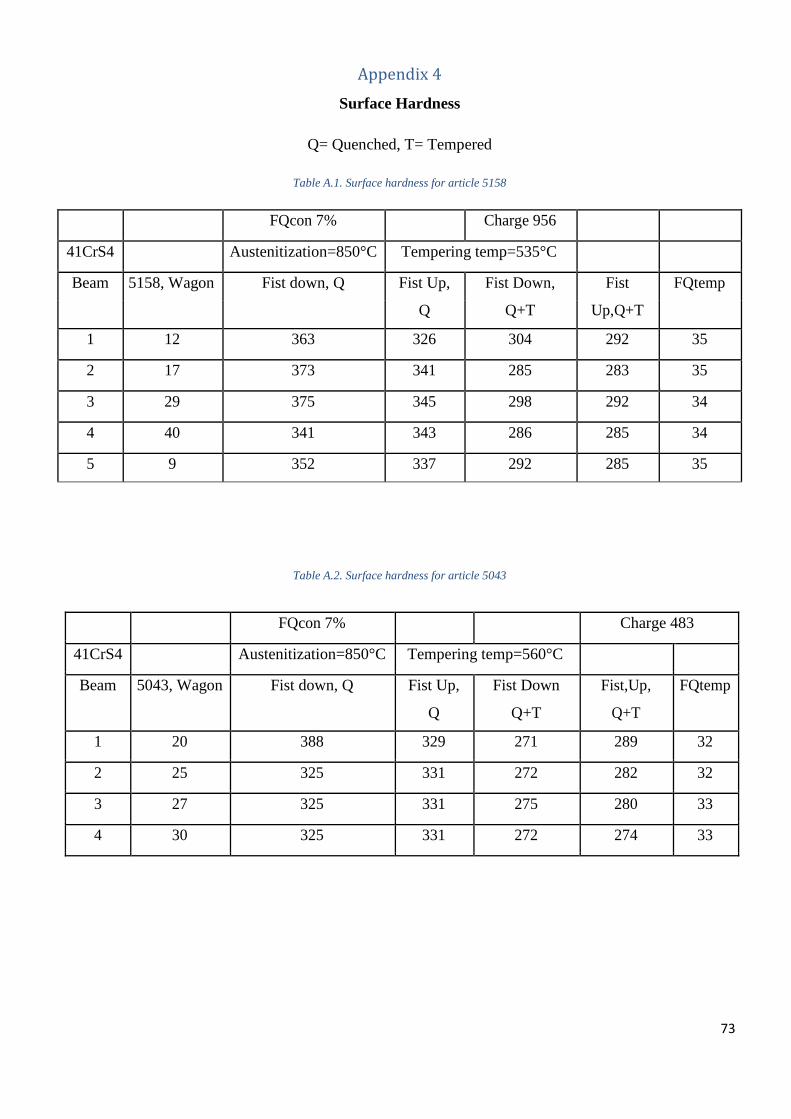
73
Appendix 4
Surface Hardness
Q= Quenched, T= Tempered
Table A.1. Surface hardness for article 5158
FQcon 7% Charge 956
41CrS4 Austenitization=850°C Tempering temp=535°C
Beam 5158, Wagon Fist down, Q Fist Up, Fist Down, Fist FQtemp
Q Q+T Up,Q+T
1 12 363 326 304 292 35
2 17 373 341 285 283 35 333
3 29 375 345 298 292 34
4 40 341 343 286 285 34
5 9 352 337 292 285 35
Table A.2. Surface hardness for article 5043
FQcon 7% Charge 483
41CrS4 Austenitization=850°C Tempering temp=560°C
Beam 5043, Wagon Fist down, Q Fist Up, Fist Down Fist,Up, FQtemp
Q Q+T Q+T
1 20 388 329 271 289 32
2 25 325 331 272 282 32
3 27 325 331 275 280 33
4 30 325 331 272 274 33
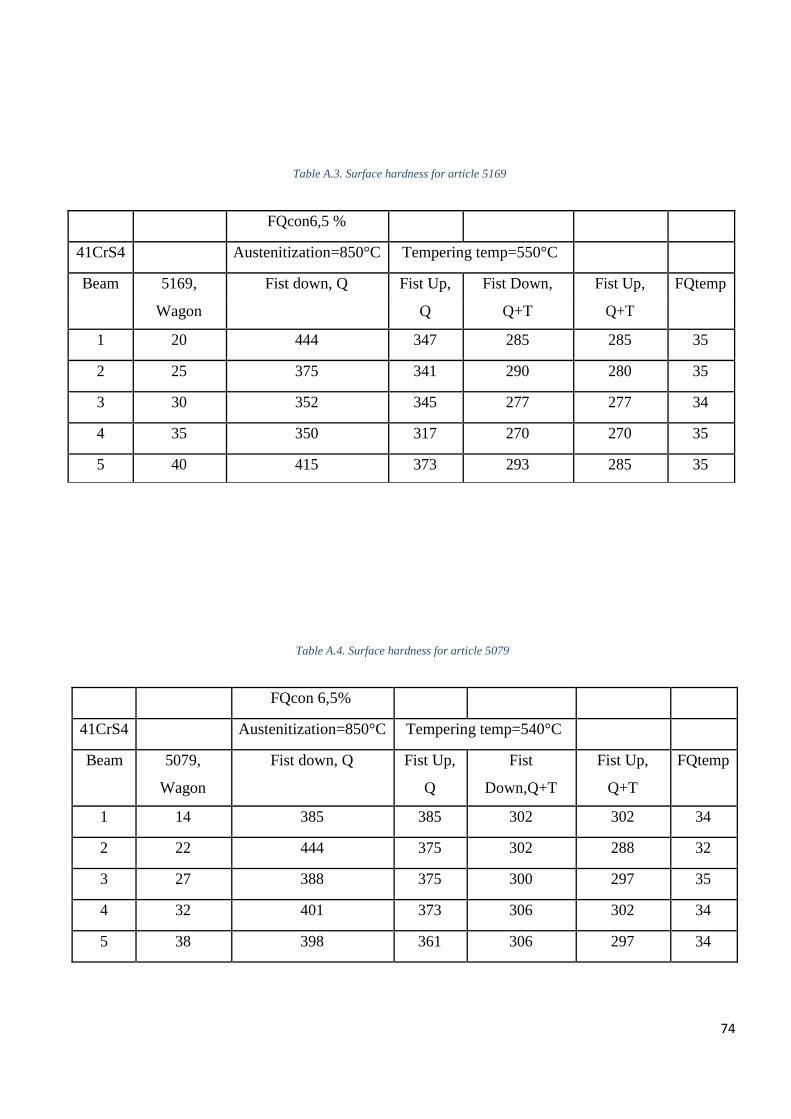
74
Table A.3. Surface hardness for article 5169
FQcon6,5 %
41CrS4 Austenitization=850°C Tempering temp=550°C
Beam 5169, Fist down, Q Fist Up, Fist Down, Fist Up, FQtemp
Wagon Q Q+T Q+T
1 20 444 347 285 285 35
2 25 375 341 290 280 35
3 30 352 345 277 277 34
4 35 350 317 270 270 35
5 40 415 373 293 285 35
Table A.4. Surface hardness for article 5079
FQcon 6,5%
41CrS4 Austenitization=850°C Tempering temp=540°C
Beam 5079, Fist down, Q Fist Up, Fist Fist Up, FQtemp
Wagon Q Down,Q+T Q+T
1 14 385 385 302 302 34
2 22 444 375 302 288 32
3 27 388 375 300 297 35
4 32 401 373 306 302 34
5 38 398 361 306 297 34
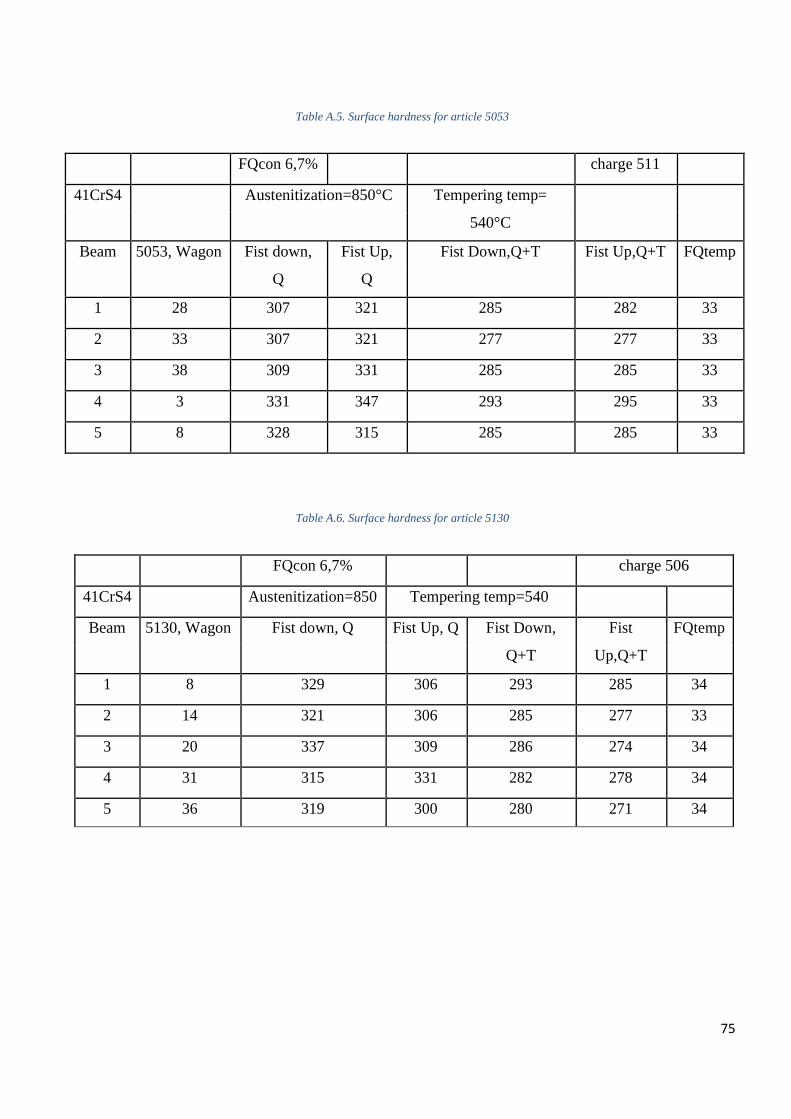
75
Table A.5. Surface hardness for article 5053
FQcon 6,7% charge 511
41CrS4 Austenitization=850°C Tempering temp=
540°C
Beam 5053, Wagon Fist down, Fist Up, Fist Down,Q+T Fist Up,Q+T FQtemp
Q Q
1 28 307 321 285 282 33
2 33 307 321 277 277 33
3 38 309 331 285 285 33
4 3 331 347 293 295 33
5 8 328 315 285 285 33
Table A.6. Surface hardness for article 5130
FQcon 6,7% charge 506
41CrS4 Austenitization=850 Tempering temp=540
Beam 5130, Wagon Fist down, Q Fist Up, Q Fist Down, Fist FQtemp
Q+T Up,Q+T
1 8 329 306 293 285 34
2 14 321 306 285 277 33
3 20 337 309 286 274 34
4 31 315 331 282 278 34
5 36 319 300 280 271 34
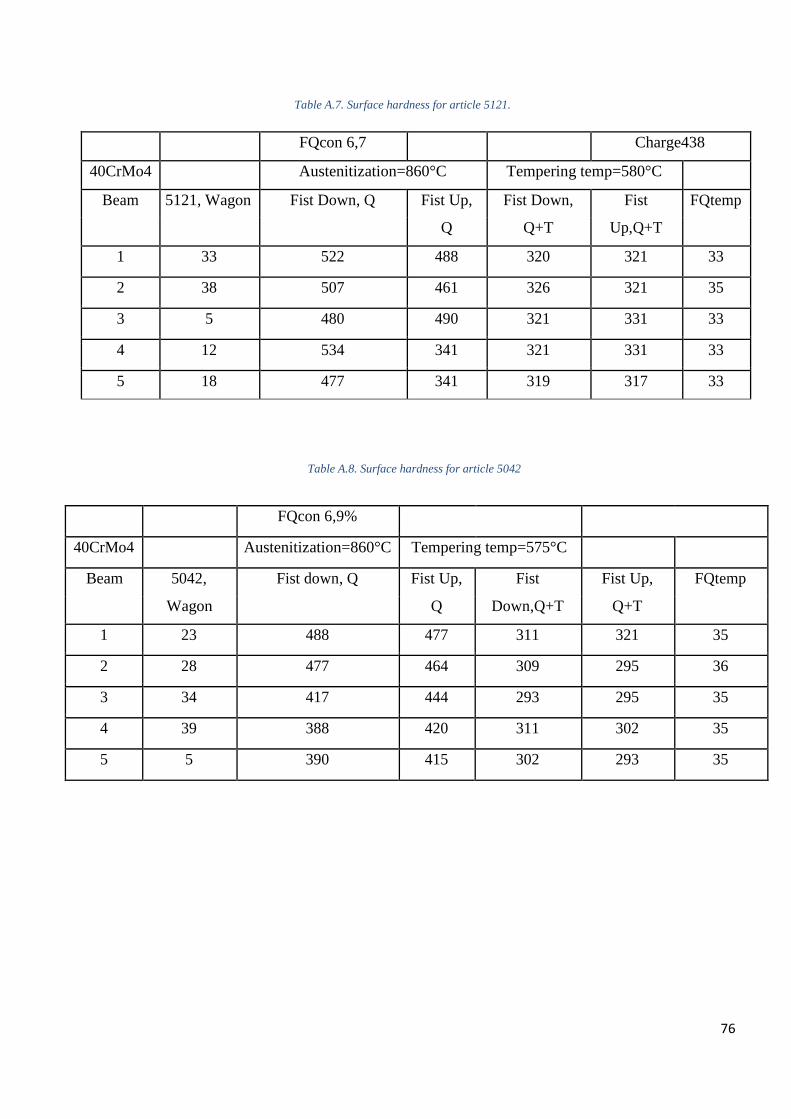
76
Table A.7. Surface hardness for article 5121.
FQcon 6,7 Charge438
40CrMo4 Austenitization=860°C Tempering temp=580°C
Beam 5121, Wagon Fist Down, Q Fist Up, Fist Down, Fist FQtemp
Q Q+T Up,Q+T
1 33 522 488 320 321 33
2 38 507 461 326 321 35
3 5 480 490 321 331 33
4 12 534 341 321 331 33
5 18 477 341 319 317 33
Table A.8. Surface hardness for article 5042
FQcon 6,9%
40CrMo4 Austenitization=860°C Tempering temp=575°C
Beam 5042, Fist down, Q Fist Up, Fist Fist Up, FQtemp
Wagon Q Down,Q+T Q+T
1 23 488 477 311 321 35
2 28 477 464 309 295 36
3 34 417 444 293 295 35
4 39 388 420 311 302 35
5 5 390 415 302 293 35
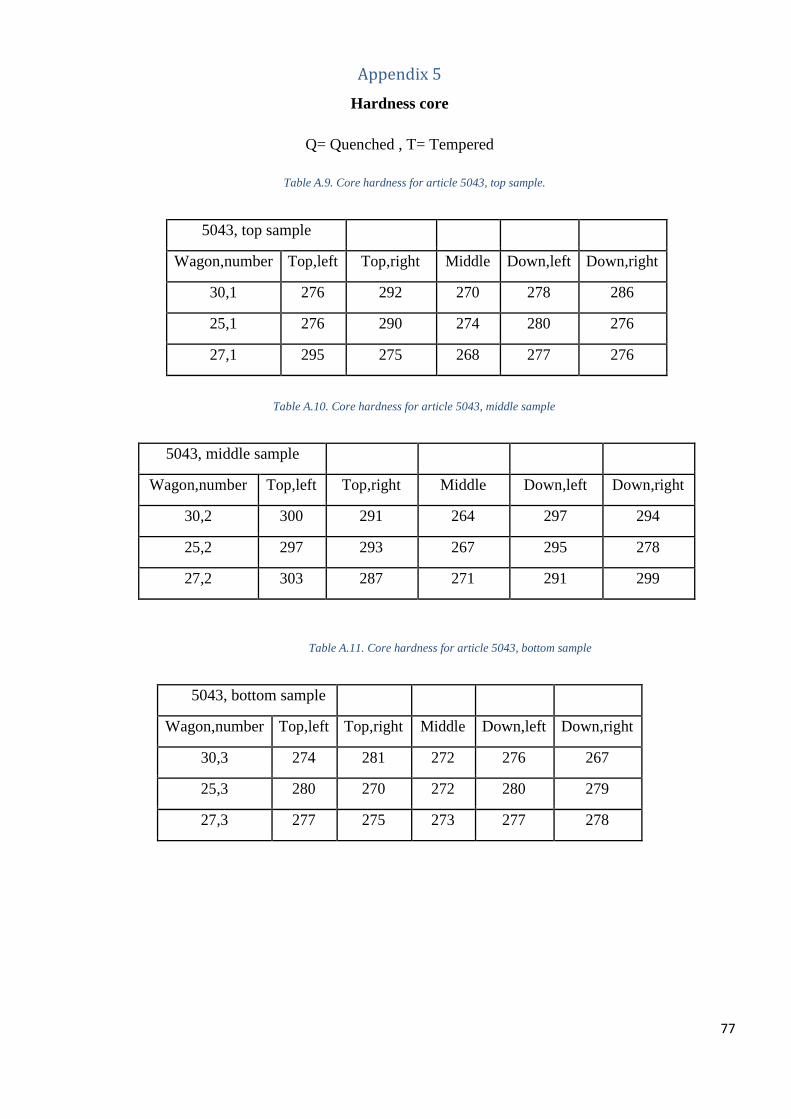
77
Appendix 5
Hardness core
Q= Quenched , T= Tempered
Table A.9. Core hardness for article 5043, top sample.
5043, top sample
Wagon,number Top,left Top,right Middle Down,left Down,right
30,1 276 292 270 278 286
25,1 276 290 274 280 276
27,1 295 275 268 277 276
Table A.10. Core hardness for article 5043, middle sample
5043, middle sample
Wagon,number Top,left Top,right Middle Down,left Down,right
30,2 300 291 264 297 294
25,2 297 293 267 295 278
27,2 303 287 271 291 299
Table A.11. Core hardness for article 5043, bottom sample
5043, bottom sample
Wagon,number Top,left Top,right Middle Down,left Down,right
30,3 274 281 272 276 267
25,3 280 270 272 280 279
27,3 277 275 273 277 278

78
Table A.12. Core hardness for article 5158, top sample
5158, Top sample
Wagon,number Top,left Top,right Middle Down,left Down,right
9,1 290 285 269 291 293
40,1 297 292 285 295 287
12,1 284 277 285 280 278
17,1 283 285 282 276 283
29,1 307 291 295 291 296
Table A.13. Core hardness for article 5158, middle sample
5158, middle sample
Wagon,number Top,left Top,right Middle Down,left Down,right
9,2 297 314 285 299 312
40,2 303 312 285 314 317
12,2 306 304 284 295 304
17,2 305 309 286 296 301
29,2 321 319 284 314 314
Table A.14. Core hardness for article 5158, bottom sample
5158, bottom sample
Wagon,number Top,left Top,right Middle Down,left Down,right
9,3 272 282 277 281 277
40,3 298 295 293 295 285
12,3 276 277 277 273 262
17,3 287 277 272 278 272
29,3 295 291 281 284 275

79
Table A.15. Core hardness for article 5121, Top sample
5121, Top sample
Wagon,number Top,left Top,right Middle Down,left Down,right
38, Q+T 339 340 308 326 330
18, Q+T 336 337 318 335 340
12, Q+T 338 343 307 339 336
33, Q+T 344 339 308 333 329
5, Q+T 340 343 312 344 338
27, Q 655 594 531 638 588
Table A.16. Core hardness for article 5121, middle sample
5121, Middle sample
Wagon number Top,left Top,right Middle Down,left Down,right
38, Q+T 344 340 333 333 331
18, Q+T 337 332 336 325 332
12, Q+T 339 341 323 340 339
33, Q+T 341 341 335 343 330
5, Q+T 332 341 334 337 334
27, Q 663 653 618 642 664

80
Table A.17. Core hardness for article 5121, bottom sample
5121, bottom sample
Wagon,number Top,left Top,right Middle Down,left Down,right
38, Q+T 338 336 297 332 332
18, Q+T 333 335 306 332 327
12, Q+T 331 332 303 317 333
33, Q+T 342 346 314 327 335
5, Q+T 340 334 312 333 335
27, Q 597 625 500 585 639