question item quality analysis in learning content...
TRANSCRIPT

AMSE JOURNALS-AMSE IIETA publication-2017-Series: Modelling D; Vol. 38; N°1; pp 89-101
Submitted April 2017; Revised July 30, 2017, Accepted Nov.15, 2017
Question Item Quality Analysis in Learning Content Management
Systems (LCMS): A Case Study Based Approach
*Nilay Kr. Nag, **Nabamita Majumder, ***Anjan Goswami
*Department of Master of Computer Application, MCKV Institute of Engineering, Howrah, India
**Department of Master of Computer Application, MCKV Institute of Engineering, Howrah,
India ([email protected])
***Department of Master of Computer Application, MCKV Institute of Engineering, Howrah,
India ([email protected])
Abstract
Nowadays Learning Content Management System (LCMS) has taken a major role in e-
Learning evolution.Along many proprietory LCMS , Moodle, as an Open Source Software(OSS)
based LCMS established itself as a major player in E-Learning deployment.Besides managing
many activities under LCMS, assessment module is very important and crucial component. Most
of the time we focus on performance issues of the Learners, implicitly ignoring the effectiveness
of the assessment questions. Question Item analysis encompasses the process of collecting,
summarizing the information from student’s responses to assess the quality of multiple-choice
questions (MCQs). This article focuses on available features in LCMS along with a case study
based approach towards assessing quality of MCQs in the light of few statistical parameters as
Facility index (Fp) and Discriminative Efficiency (DEp), Discrimination efficiency (Dp) etc. So
here we are to get interpretation of quality parameters to evaluate overall standard of multiple-
choice questions (MCQs). As in near future standardization of web based learning management
systems along with question item analysis will significantly influence assessment practices.
Key words
LCMS, E-learning, VLE, facility index, discriminative efficiency, discrimination index.
89

1. Introduction
Moodle platform is one of the most popular tools for Learning Content Management System,
that allows relatively easily to create and manage e-learning courses along with taking online
tests on the basis of MCQs. Moodle can be successfully used both in the educational system, and
in private or public institutions. Moodle can be used in universities in various purposes, both in
full-time and part-time learning, e-learning or blended learning, both in the initial and continuous
formation. [1] Students progress checking is one of the most important and crucial components of
this platform, i.e. Quiz, Assignments and Exercise. Questions that are created and stored in the
Moodle database Question Bank and may be used randomly during the examination. Immediate
evaluation of students’ answers after test completion added a special feature. Therefore, a student
may immediately or later on obtain information regarding the grade as well as detailed data
concerning mistakes what he or she has made, in the form called “Feedback” report. Moreover,
each test is scheduled for a time limit. In order to evaluate the quality of individual sets of
questions, simplicity of individual variations, frequency of the used questions in the whole
Question Bank were compared. Day by day new technologies provide teaching community with
many interesting and effective tools that can be used to improve the teaching–learning process.
The usefulness of these tools keeps a strong appeal for teachers and educator to have more
information about the advantages and possibilities of using technology in the classroom or
beyond classroom as well as about the results obtained from their application [2]. Though
Internet is great and readily available source of all kind of information, there are some specific
web-based applications considered to be used as a teaching resource. These LCMS applications
allow teachers and educators to provide the learners with study content of different varieties, as
well as to interact with them in real-time. They also allow teachers to follow the learning process
evolution and to know the performance of each student in specific activities or tasks. E-learning
platforms (also known as a virtual learning environment (VLE)) are especially useful when
teaching Science & Engineering. They allow usage and implementation of objects of many types
such as: videos, mp3s, text documents, scanned images, links to other web sites or animations
which can be used to show dynamically many physical situations and concepts are often critical
to apprehend by the students. [3]
A virtual learning environment is a software system designed for supporting and managing
teaching and learning. A VLE typically provides tools such as those for assessment,
communication, content uploading, submission of students’ work, administration of student
groups, questionnaires, tracking tools, wikis, blogs, chats, forums, etc. over internet. A VLE is a
computer program that facilitates the so-called e-learning (electronic learning). Such e-learning
90
systems are sometimes also called Learning Management System (LMS), Learning Content
Management System (LCMS), Course Management System (CMS), Managed Learning
environment (MLE), Learning Support System (LSS) or Learning Platform (LP); it is education
system via Computer-Mediated communication (CMC) or online education. [4]
Some of them are commercial software, whereas others are open-source software (OSS).
Among them are WebCT and blackboard http://www.blackboard.com (that merged in 2005).
Open-source platforms are Moodle (http://moodle.org), Atutor (http://www.atutor.ca), Ilias
(http://www.ilias.de) and Claroline (http://www.claroline.net/) All these applications have
common features, but some of them are more flexible and complete in specific aspects, such as
role assignments, chats management, assessment management etc.
Development of Moodle is undertaken by a globally diffused network of commercial and
non-commercial users, led by the Moodle Company based in Perth, Western Australia.
Interactivity and automatic assessment are keywords to keep the learners' motivation and
promote active learning [5][6][7]. And Moodle comprises of a bunch of interactive modules.
Moodle with i-Assign, an interactive deployment by Rodrigues, Brandão. [8] on their observation
all teachers that participated on the experiment agreed that using Moodle with i-Assign could
help them to promote and improve learning.
Among many features we have focused on assessment module on Moodle. Quiz is the
Moodle module associated with authoring and assessment [9]. By using Quiz, one can build
questionnaires (quizzes) with automatic assessment resources. The quizzes may adopt several
types of questions, including multiple choice, true-false, and short answer. Also, Quiz questions
can be stored in a “question bank” to be further reused. [10]
Our study was based on MCQ responses from students of different categories as MCQs are
very frequently used to assess students in different educational streams for objectivity and wide
coverage in less time. MCQs are used mostly for comprehensive assessment at the end of
academic sessions as well as provide feedback to the teachers on their educational activities. [11]
Question item analysis examines the student responses to individual test items (MCQ) for
assessing the quality of those items and as well as of overall test. [12] The aim of the study was to
analyze the quality of MCQ’s by some statistical parameters. To investigate the relationship of
items having good discriminative property as well as of standard facility index.
Though the fact that computer-based examination methods are well-established in academic
centers, continuous monitoring of their quality is still needed and essential. [13] The Quiz module
opens a possibility of analysis of individual MCQs considering their quality parameters, such as
range of difficulty or differentiating ability reflected here by Facility Index and Discrimination
91

Index, [14] which is very important in the light of evaluation of an exam question repository and
improvement of MCQs for the needs of further development.
2. Dataset Specification (Source)
The resulting data used for analyzing quality of questions were obtained from two different
test cases:
Case 1: Online Tests performed on a group of 21 students of BSc (Bachelor Degree) who
were the prospective candidates of MCA Entrance Test. The obtained results were generated
from 40 no, four-option MCQs of Aptitude and 50 no, four-option MCQs of Mathematics.
Case 2: Online Diagnostic Tests performed on 366 students of B. Tech (Bachelor Degree in
Engineering) 1st year students. The obtained results were generated from 10 no, four-option
MCQs for each subject as Physics A, Physics B, Physics C, Mathematics, Chemistry and English.
3. Method
In order to carry out the on-line test, a Quiz tool of Moodle was used. The entire process is
depicted as follows:
Fig.1. Flowchart for Entire Process of Online Test
4. Statistical Analysis of Question [15] [16]
4.1 Notations Used in the Calculations
We are considering here total number of eligible students for this online quiz is S.
Moreover, we have a lot of student s∈ 𝑆, who have completed at least one attempt on the
quiz.
The test has total number of positions P and we are considering number of positions 𝑝 ∈ 𝑃.
92

The test is assembled from a number of questions i ∈ 𝐼 .
(1) Because of random questions, different students may have received different
questions in different positions, so i(p,s) is the item student S received in position P for question i.
Let Is be the set of questions that a student S can see. Let Si be the set of students who
attempted question i.
Each position has a maximum and minimum possible contribution to the test
score, 𝑥𝑝(min) and 𝑥𝑝(max). In Moodle, 𝑥𝑝(min ) is always zero. 𝑥𝑝(max ) is the maximum
grade of the question in the database.
Then, each student achieved an actual score 𝑥𝑝 (S) on the item in position P.
So 𝑥𝑝(min ) ≤ 𝑥𝑝(𝑠) ≤ 𝑥𝑝(max ).
Intermediate calculations
To simplify the form of the formulas below, we need some intermediate calculated quantities
as mentioned below:
Each student has a total score
𝑇𝑠 = ∑ 𝑥𝑝(𝑠)𝑝∈𝑃 (1)
Similarly, there are the maximum and minimum possible test scores
𝑇𝑚𝑎𝑥 = ∑ 𝑥𝑝(𝑙 max )𝑝∈𝑃 And 𝑇𝑚𝑖𝑛 = ∑ 𝑥𝑝(min )𝑝∈𝑃 (2)
Student’s rest of test score for a position:
𝑋𝑝(𝑠) = 𝑇𝑠 − 𝑥𝑝(𝑠) (3)
For any quantity that depends on position (for example xp orXp), its average is denoted with
an over bar, and is an average over all students, so
𝑥𝑝= 1
𝑠∑ 𝑥𝑝(𝑠)𝑠∈𝑆 (4)
When a quantity is a property of a question, a bar denotes an average over all students who
attempted that question, so
93

𝑋𝑖= 1
𝑆𝑖∑ 𝑥𝑖(𝑠)𝑠∈𝑆𝑖
(5)
Similarly we have the variance of a quantity depending on position: 𝑉(𝑥𝑝) =
1
𝑠−1∑ (𝑥𝑝(𝑠) − 𝑥𝑝𝑠∈𝑆 ) 2 and for a quantity depending on items:
𝑉(𝑥𝑖) =1
𝑆𝑖−1∑ (𝑥𝑖(𝑠) − 𝑥𝑖𝑠∈𝑆𝑖
) 2 (6)
Finally, we need co-variances of two quantities, for example:
𝐶(𝑥𝑝 , 𝑋𝑝 ) =1
𝑆 −1∑ (𝑥𝑝(𝑠) − 𝑥𝑝𝑠∈𝑆
) ( 𝑋𝑝(𝑠) − 𝑋𝑝) (7)
where 𝑥𝑝 denotes marks of the question at position p and 𝑋𝑝 denotes marks of the question apart
from position p.
𝐶(𝑥𝑖, 𝑋𝑖 ) =1
𝑆𝑖−1∑ (𝑥𝑖(𝑠) − 𝑥𝑖𝑠∈𝑆𝑖
) ( 𝑋𝑖(𝑠) − 𝑋𝑖) (8)
where xi denotes marks of the question I and Xi denotes marks of the question i.
4.2 Position Statistics
Here we analyze the psychometric quality of the quizzes which can help us to test whether
there are appropriate questions, well chosen to demonstrate concepts and of an appropriate level
of difficulty and whether the questions discriminate between higher and lower abilities. Again
Moodle offers a range of resources to carry out a psychometric analysis of a particular quiz,
namely the Facility Index (FI), the Discrimination Index (DI) and the Discrimination Coefficient
(DC). [17]
4.2.1 Facility Index
This is the average score on the question, expressed as a percentage:
𝐹𝑝 = 100𝑥𝑝−𝑥𝑝(min )
𝑥𝑝(max )− 𝑥𝑝(min ) . (9)
94

The higher the facility index, the easier the question is.
Tab.1. Interpretation of Facility Index [2]
Facility
Index
Interpretation
5 or less Extremely difficult or something wrong with the
question.
6-10 Very difficult.
11-20 Difficult.
20-34 Moderately difficult.
35-64 About right for the average student.
66-80 Fairly easy.
81-89 Easy.
90-94 Very easy.
95-100 Extremely easy.
4.2.2 Standard Deviation
Again expressed on a percentage scale:
𝑆𝐷𝑝 = 100√𝑉(𝑥𝑝)
𝑥𝑝(max )− 𝑥𝑝(min ) (10)
4.2.3 Discrimination Index
This is the correlation between the weighted scores on the question and those on the rest of
the test. It indicates how effective the question is at sorting out able students from those who are
less able. This is the product moment correlation coefficient between and , expressed on a
percentage scale. That is,
𝐷𝑝 = 100𝑟(𝑥𝑝, 𝑋𝑝) = 100𝐶(𝑥𝑝,𝑋𝑝)
√𝑉(𝑥𝑝)𝑉(𝑋𝑝) (11)
95
The idea is that for a good question (or at least a question that fits in with the other questions
in the test), students who have scored highly on the other parts of the test should also have scored
highly on this question, so the score for the question and the score for the test as a whole should
be well correlated.
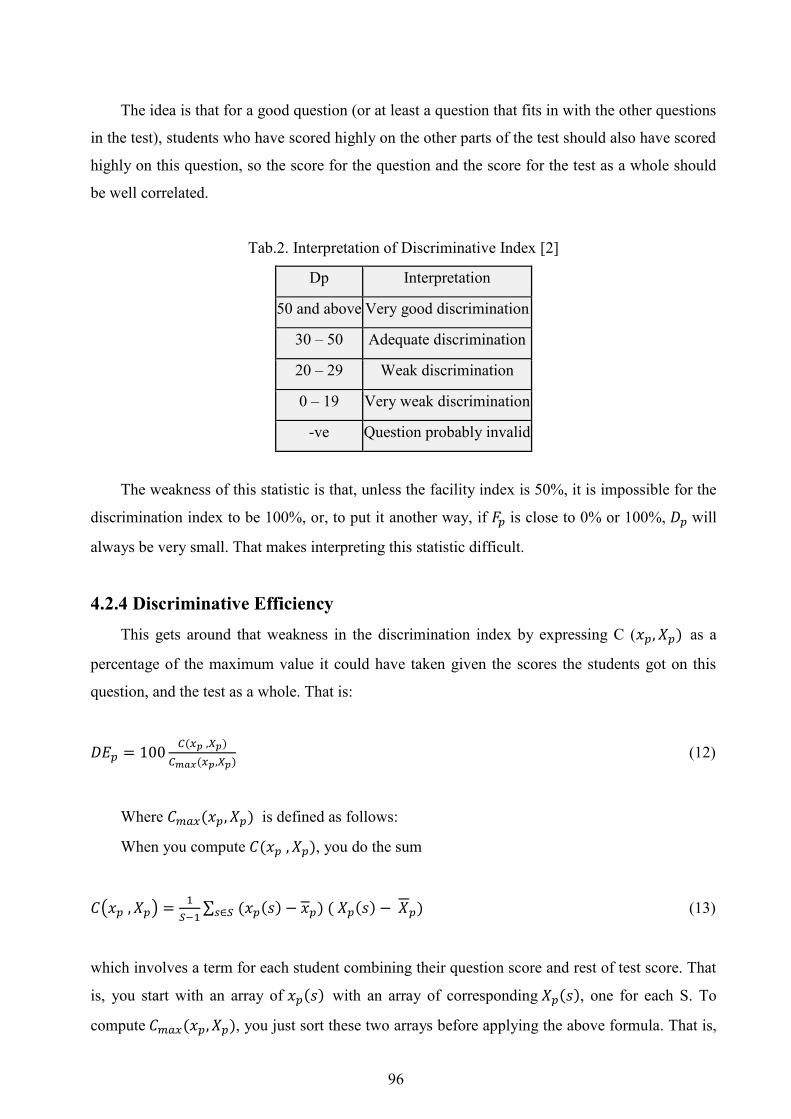
Tab.2. Interpretation of Discriminative Index [2]
Dp Interpretation
50 and above Very good discrimination
30 – 50 Adequate discrimination
20 – 29 Weak discrimination
0 – 19 Very weak discrimination
-ve Question probably invalid
The weakness of this statistic is that, unless the facility index is 50%, it is impossible for the
discrimination index to be 100%, or, to put it another way, if 𝐹𝑝 is close to 0% or 100%, 𝐷𝑝 will
always be very small. That makes interpreting this statistic difficult.
4.2.4 Discriminative Efficiency
This gets around that weakness in the discrimination index by expressing C (𝑥𝑝, 𝑋𝑝) as a
percentage of the maximum value it could have taken given the scores the students got on this
question, and the test as a whole. That is:
𝐷𝐸𝑝 = 100𝐶(𝑥𝑝 ,𝑋𝑝)
𝐶𝑚𝑎𝑥(𝑥𝑝,𝑋𝑝) (12)
Where 𝐶𝑚𝑎𝑥(𝑥𝑝, 𝑋𝑝) is defined as follows:
When you compute 𝐶(𝑥𝑝 , 𝑋𝑝), you do the sum
𝐶(𝑥𝑝 , 𝑋𝑝) =1
𝑆−1∑ (𝑥𝑝(𝑠) − 𝑥𝑝𝑠∈𝑆
) ( 𝑋𝑝(𝑠) − 𝑋𝑝) (13)
which involves a term for each student combining their question score and rest of test score. That
is, you start with an array of 𝑥𝑝(𝑠) with an array of corresponding 𝑋𝑝(𝑠), one for each S. To
compute 𝐶𝑚𝑎𝑥(𝑥𝑝, 𝑋𝑝), you just sort these two arrays before applying the above formula. That is,
96

for the purpose of computing 𝐶𝑚𝑎𝑥 , you pretend that the first student scored the lowest 𝑥𝑝 and
the lowest 𝑋𝑝, the second student scored the second lowest 𝑥𝑝 and the second lowest 𝑋𝑝, and so
on to the last student, who scored the highest 𝑥𝑝 and 𝑋𝑝.
This statistic attempts to estimate how good the discrimination index is relative to the
difficulty of the question.
An item which is very easy or very difficult cannot discriminate between students of
different ability, because most of them get the same score on that question. Maximum
discrimination requires a facility index in the range 30% - 70% (although such a value is no
guarantee of a high discrimination index).
The discrimination efficiency will very rarely approach 100%, but values in excess of 50%
should be achievable. Lower value of discriminative efficiency indicates that the question is not
nearly as effective at discriminating between students of different ability as it might be and
therefore is not a particularly good question.
4.2.5 Intended Question Weight
Intended weight is simply what we set up when editing quiz i.e, how much this question is
supposed to contribute to determining the overall test score.
𝐼𝑄𝑊𝑝 = 100𝑥𝑝(max )− 𝑥𝑝(min )
𝑇𝑚𝑎𝑥− 𝑇𝑚𝑖𝑛 (14)
4.2.6 Effective Question Weight
The effective weight is an attempt to estimate, from the result, how much of the actual
variation is due to this question. This is an estimate of what proportion of the variance in the
students' test scores is due this question.
𝐸𝑄𝑊𝑝 = 100√𝐶(𝑥𝑝,𝑇)
∑ √𝐶(𝑥𝑝,𝑇)𝑝∈𝑃 (15)
If the effective weight is greater than the intended weight it shows the question has a greater
impact in the spread of scores than may have been intended. If it is less than the intended weight
it shows that it is not having as much effect in spreading out the scores as was intended.
97

5. Result
Fig.2. Quiz Information for Online Diagnostic Test (Chemistry)
Tab.3. Quiz Structure Analysis
Q# Facility
Index
Standard
Deviation
Intended
Weight
Effective
Weight
Discrimination
Index
Discriminative
Efficiency
1 85.00% 36.63% 10.00% 10.17% 22.37% 33.33%
2 45.00% 51.04% 10.00% 10.94% 5.73% 7.56%
3 5.00% 22.36% 10.00% -17.48% -48.15%
4 20.00% 41.04% 10.00% 7.29% -4.54% -6.38%
5 65.00% 48.94% 10.00% 12.35% 20.00% 26.61%
6 15.00% 36.63% 10.00% 8.99% 12.25% 18.92%
7 10.00% 30.78% 10.00% 9.38% 26.42% 45.45%
8 50.00% 51.30% 10.00% 15.34% 46.82% 68.42%
9 55.00% 51.04% 10.00% 14.41% 36.41% 50.98%
10 85.00% 36.63% 10.00% 11.13% 31.97% 46.67%
98

Fig.3. Bar Chart Representation between Facility Index and Discriminative Efficiency
6. Observations
By comparing the discrimination efficiency with the facility index we can get the measure of
how effective the quiz is.
i) From Figure-3, we obtain a comparative analysis of Facility Index and Discriminative
Efficiency of 10 questions.
ii) In the above figure, Q1 and Q10 have a higher facility index which implies that these
questions are too easy considering the table-1.
iii) On the contrary, Q3 is Extremely Difficult, Q7 is Very Difficult and Q6 is Difficult as
there Facility Indexes are 5%, 10% and 15% respectively.
iv) Q5, Q8 and Q9 are comparatively standard questions for the average graded students.
v) Lower value of Discriminative efficiency of Q2 & Q6 indicates that these questions are
not nearly as effective at discriminating between students of different ability (grade
discrimination).
vi)Negative value of Discriminative efficiency of Q3 & Q4 indicates that these two
questions are probably invalid.
vii) Discriminative efficiency of Q8 indicates that this question is effective at discriminating
between students of different ability.
99

viii) If facility index is 100% or 0%, there is no scope of discriminating the students. 100%
means it is very easy question & 0% means it is very tough question, so effective weight is 0 and
discriminative efficiency & discrimination index is NULL (no value).
ix) The effective weight is a proportion of the square root of the covariance of the question
with overall performance. If the question’s scores vary in the opposite way to the overall score,
this would indicate that this is a very odd question. And for that the effective weight cannot be
calculated. This happens for Q3 which has no value for effective weight.
Conclusion
Question Item analysis is a simple yet valuable procedure performed after the examination
providing information regarding the quality and validity of an item/test by calculating Facility
index, Discrimination index, Discrimination efficiency, and their interrelationship. An ideal item
(MCQ) will be the one which has average Facility index between 50% and 70%, high
discrimination (Dp > 30%), and In this study, the majority of items fulfilled the criteria of
acceptable difficulty level and good discrimination. Easy items with poor discrimination index
will be reviewed and restructured. The results of this study should show a change in improving
quality of MCQ test items for any examination, and leading to development of proper assessment
strategy as part of the curriculum development. Much more of these kinds of analysis should be
carried out after each examination to identify the areas of potential weakness in the one best
answer type of MCQ tests to improve the standard of assessment [4]. Finally It should initiate and
motivate the use and study of this assessment component of LCMS in broader perspective
towards the standardization of question item selection strategy.
References
1. G.C. Oproiu, A Study about using E-learning platform (Moodle) in university teaching
process, 2015, Procedia-Social and Behavioral Sciences, vol. 180, pp. 426-432.
2. J. Kaminski, Editorial: Moodle – A user-friendly, open source course management system,
Online Journal of Nursing Informatics (OJNI), vol. 9, no. 1.
3. T. Martín-Blas, A. Serrano-Fernández, The role of new technologies in the learning process:
Moodle as a teaching tool in Physics, 2009, Computers & Education, vol. 52, pp. 35–44.
4. M. Weller, Virtual Learning Environments: Using, Choosing and Developing Your VLE,
2007, London: Routledge.
5. N. Hara, R. Kling, Student s frustrations with a web-based distance education course, 1999,
First Monday: Journal on the Internet, vol. 4, no. 12.
100

6. M. Hentea, M. Shea, L. Pennington, A perspective on fulfilling the expectations of distance
education, 2003, Proceedings of The Conference on Information Technology Education,
2003, pp. 160-167.
7. C. Meyers, T.B. Jones, Promoting Active Learning, Strategies for the College Classroom,
1993, Jossey-Bass.
8. P.A. Rodrigues, L.D.O. Brandão, A.A.F. Brandão. Interactive Assignment: a Moodle
component to enrich the learning process, 2010, Frontiers in Education Conference (FIE),
2010 IEEE.
9. Quiz: http://docs.moodle.org/24/en/Quiz_module.
10. J.R.A. Rodrigues, L.O. Brandão, et al. iQuiz: integrated assessment environment to improve
Moodle Quiz, 2013, Frontiers in Education Conference, 2013 IEEE.
11. C. Rao, H.K. Prasad, K. Sajitha H Permi, J. Shetty, Item analysis of multiple choice
questions: Assessing an assessment tool in medical students, 2016, Int J Educ Psychol Res no.
2, pp. 201-4.
12. G. Mehta, V. Mokhasi, Item analysis of multiple choice questions – An assessment of the
assessment tool, 2014, Int J Health Sci Res, no. 4, pp. 197-202.
13. M. Panczyk, J. Belowska, J. Gotlib, Computer-Aided Testing: Assessment of automatic item
generation to create multiple choice test items, Division of Teaching and Outcomes of
Education, Faculty of Health Sciences, Medical University of Warsaw (POLAND).
14. J. Cole, H. Foster. Using Moodle: Teaching with the Popular Open Source Course
Management System, 2007, Birmingham: O'Reilly Media, Inc.
15. https://docs.moodle.org/dev/Quiz_statistics_calculations.
16. https://docs.moodle.org/dev/Quiz_report_statistics.
17. B.A. Mónica, M.G. Gisbert, Creating Moodle quizzes for the subjects of mathematics and
statistics corresponding to the first years in engineering studies), 2009, Edulearn L. Gómez
Chova, D. Martí Belenguer, I. Candel Torres (eds.), International Association of Technology,
Education and Development (IATED. URL: http://hdl.handle.net/2117/3064 ISBN978-84-
612-9802-0.
101