questionnaire design considerations with ... - mjesec.ffzg.hr
TRANSCRIPT
Review of Psychology, 2009, Vol. 16, No. 2, 103-113 UDC 159.9
103
One of the unanswered questions that emerge from planned missing data designs is the appropriate distribution of the missing data we plan to introduce by design. All deci-sions concerning what data not to collect to decrease survey length have to be carefully considered. With the availabil-ity of computer-assisted survey techniques, it is relatively straightforward to tell the computer to leave some questions out based on randomization or other criteria.
Unfortunately, a computer-assisted design is not always available. Sometimes we are still forced to use the good old-fashioned paper and pencil. In these situations, it makes a dif-ference if we have to design, distribute and code 3 versions of a survey, 15 versions of a survey, or 225 versions of a survey. Conventional wisdom suggests that we should strive for the utmost uniformity of missing information. Unfortu-nately, for reasons described below in greater detail, this also means the use of many different questionnaire versions.
The analysis presented here suggests, counterintuitively, that there is no practical analytical advantage in striving for a great uniformity of missing information by maximizing
the number of questionnaire versions. Three versions of a paper and pencil questionnaire is just fine.
Following the principles laid out by King (1995), scripts used to conduct the analyses are provided in the online ap-pendix downloadable at:
http://levente.littvay.hu/reviewofpsychology/appendix.pdf
With these (and possibly through minor modifications of these when necessary), any researcher has the ability to replicate the results of the analysis presented. Providing all the information for replication is a norm that needs to gain more ground and acceptance in all of the sciences. This in-formation could also provide a foundation for running simi-lar tests for different analytical contexts.
Missing data
A planned missing data design is one where the missing data is purposely built into the research design by the re-searcher. Given that missing data poses a problem in almost every field of social science, it might be difficult to imagine circumstances where the researcher would like to do that on purpose. Thus far, missing data has been seen as a prob-lem. Only recently have researchers begun to think about missing data as a means to an end, a tool they can utilize to improve data quality (Graham, Hofer, & MacKinnon, 1996; Graham, Taylor, Olchowski, & Cumsille, 2006). The key to recognizing that planned missing data can be a blessing, not only a curse, is the missing data problem’s foundations. The reason missing data is unwanted is that it rarely follows a mechanism that makes it quantitatively manageable.
Levente Littvay; Central European University, CEU Faculty Tower 901, Budapest Nador u. 9, H-1051, Hungary. E-mail: [email protected] (the address for correspondence).
AcknowledgementsThe author would like to thank Allan McCutcheon, participants of the 2nd Psychometric Symposium in honour of Professor Alija Kulenovic and the anonymous reviewer for their helpful comments. I am indebted to Brennen Bearnes and Megan Thornton for the editing help. This study was supported in part by the Central European University Foun-dation, Budapest Post-Doctoral Grant.
Questionnaire design considerations with planned missing data
LEVENTE LITTVAY
This article explores considerations that emerge when using a planned missing data design (PMDD). It describes scenarios where a PMDD can be useful and reveals implications of a PMDD for questionnaire design in terms of the optimal number of questionnaire versions. It takes a confirmatory factor model to explore the PMDD performance. Findings suggest that increasing the number of versions to maximize uniformity of missing data yields no advantage over minimizing data collection cost and complexity. The paper makes recommendations concerning different miss-ing data patterns that can be used. And finally, this article points out how certain fit statistics could be misleading with PMDD. The one fit statistics that consistently performed well with the PMDD is the SRMR.
Keywords: planned missing data, pattern of missing data, confirmatory factor analysis, fit statistic, Monte Carlo
104
LITTVAY, Questionnaire design with planned missing data, Review of Psychology, 2009, Vol. 16, No. 2, 103-113
Rubin has defined possible mechanisms for missing data. He categorized missingness into three groups (Rubin, 1976). Missing Completely at Random (MCAR), Missing at Random (MAR), and Missing Not at Random (also re-ferred to as Not Missing at Random, MNAR, or NMAR). MCAR, as its name suggests, assumes that missing data is completely random and incidental. MAR, contrary to what its name suggests, does not assume that data is missing at random. It assumes that the pattern of missingness (i.e. if a value is missing or observed) can be predicted by other ob-served values in the dataset. To illustrate this with an exam-ple, survey respondents often refuse to reveal private infor-mation about the number of sexual partners they have had (Tourangeau & Smith, 1996). They do not do this randomly; level of privacy during the survey, alcohol consumption, and certain attitudes can all correlate with this behavior. If such information is available in the dataset these could be strong predictors of missingness, making the missingness MAR. NMAR assumes that the pattern of missingness is predict-ed only by the information that is missing. For example, if the researcher failed to collect correlates that could predict missingness for the number of sexual partners variable, that researcher would have NMAR missing data.
The literature makes a distinction between ignor-able (MCAR and MAR) mechanisms and non-ignorable (NMAR) mechanisms of missing data. This, of course, does not mean that missing data can be ignored if its mechanism is assumed to be MAR or MCAR, it just means that appro-priate estimation approaches exist which produce unbiased results under these patterns. As an added complication, the MAR assumption is not testable (Potthoff, Tudor, Pieper, & Hasselblad, 2006) but MCAR missingness is both testable (Little, 1988) and can also emerge by design.1
MCAR (and MAR) missing data is relatively easy to correct analytically at the expense of power, but it is of-ten an unrealistic assumption in the social sciences. In the case of a planned missing data design, where the data not collected (missing) are randomized by design, MCAR is a realistic assumption. There are analytical methods, such as full information maximum likelihood estimation, multiple imputation, and Bayesian estimation through Markov Chain Monte Carlo (MCMC) simulation, which can produce un-biased estimates when analyzing such data (Graham et al., 1996). Listwise deletion is also an appropriate method when the missing data mechanism is MCAR, though it is less powerful than the methods listed above. With a planned
missing data design, the researcher has to pay extra atten-tion to the lost power that stems from deleting cases (Al-lison, 2001). Every survey participant would have at least some missing data discarding every case from the analysis in most planned missing data situations.
In structural equation models with continuous variables, full information maximum likelihood is most commonly es-timated using the covariance matrix. The estimation is done separately for each pattern of missing data. Separate esti-mation’s contribution to the likelihood function is summed across the patterns. So, if we have three variables: F, G, and H, and for some cases all are observed, while for others G or H are missing, we are left with three patterns: FGH, FH, and FG. The estimation is then conducted separately for each pattern, and no information is discarded or imputed. For pat-terns where some data is not available, the information is “borrowed” from the other patterns where it is available.
The amount of information available for estimating the covariance between two variables is described by the cov-ariance coverage. Let’s take another example, again with 3 variables: A, B, and C. If A, B, and C are missing 33% of the time, the covariance coverage will be 33%. This is because only 33% of the sample will contain cases where the covari-ance can be calculated between any two of the variables. If we take another example with variables D and E and 50% of the cases get question D and the other 50% get question E, the covariance coverage between D and E is 0 as there is not a single case in the sample where both D and E are collected. Thus far, solutions exist for the first scenario but no studies have looked in depth to see how important the uniformity of the covariance coverage is. How much effort should be spent on having uniform covariance coverage be-tween all pairs of variables when utilizing full information maximum likelihood estimation? Practically speaking, how many questionnaire versions should the researcher use when designing a questionnaire with planned missing data?
Monte Carlo Simulations
The methodology utilized is called Monte Carlo simula-tion (Mooney, 1997; Paxton, Curran, Bollen, Kirby, & Chen, 2001; Muthén & Muthén, 2002). Monte Carlo is named af-ter the casino town as it draws heavily on chance to test hypotheses. Monte Carlo methods have become popular as the computational speed of computers has increased and es-timated models have become more and more complex. They present an excellent tool to get answers to questions that are too difficult to derive mathematically. They have been used to test estimators, check the impact of modeling assumption violations, and are an excellent and intuitive tool for power analysis.
A Monte Carlo simulation begins with the definition (and usually the artificial production, simulation) of a pseudo-population. Since this population is known, the researcher has complete control and knowledge of its properties. A
1 MAR missing data can also emerge by design, but so far this approach is rare in the literature. An example of MAR missing data by design would be the use of a cheap measurement on everyone, followed by a more expensive, more precise measurement of an at-risk group based on the less expensive measure. Graham et al. (2006) have shown that data quality can be improved using such a design while decreasing cost of acquisition.

105
LITTVAY, Questionnaire design with planned missing data, Review of Psychology, 2009, Vol. 16, No. 2, 103-113
sample can be taken from this pseudo-population, and when analyzed, the results should reflect the population as well as any real life sample that we draw to infer from a population. The process can be repeated many times, which allows the researcher to ask certain questions about the properties and quality of inference. For example, in a power analysis, given that a sample size of n is taken, we can ask the probability that we will detect a significant effect for a certain effect size.
At its core, the Monte Carlo method can also be an ex-perimental method that allows comparisons between a treat-ment and a control condition. For instance, after sampling we could introduce a treatment to the sample such as the in-troduction of missing data. Then we can analyze the results with the missing data and compare it to the results without missing data, or to the population, to check the bias of the estimates and the loss of power.
Mplus, one of the leading structural equation modeling programs, has implemented a Monte Carlo simulation en-gine which can produce samples from a pre-specified pseu-do-population, analyze these multiple samples, and auto-matically provide summary statistics and power estimates using the results (Muthén & Muthén, 2006). The simulated datasets were all produced with Mplus. Missing data, the experimental treatment, was produced in R and analysis was done with Mplus.
Missing by design
One of the intuitive reasons to leave questions out by design is to decrease the length of the questionnaire. A shorter questionnaire decreases the burden on the respond-ent, which leads to a higher probability of participation in
the survey (Groves et al., 2004, p. 176). Shorter surveys can also alleviate survey fatigue, and decrease satisficing (Crawford, Couper, & Lamias, 2001; McCarty, House, Har-man, & Richards, 2006; Hansen, 2006; Heerwegh & Loos-veldt, 2006).
If analytical strategies are available to handle the miss-ing data created by design, the loss of power associated with the missing data can be offset by an increased sample size. Increased response rate due to a shorter survey can decrease bias associated with unit non-response, while data quality is also increased due to less survey fatigue and satisficing. The outcome is more unbiased results.
Researchers wishing to utilize such designs will have to produce multiple versions of a questionnaire and leave some questions off of each. Close attention has to be paid to en-sure that covariance coverage does not dip to 0 for any pair of questions. Additionally, survey participants have to be as-signed to the different questionnaire versions randomly.
The model
But what is the optimal number of questionnaire ver-sions? This article explores this exact question for both ideal and less than ideal analytical conditions. The model used to answer the question is the confirmatory factor model seen in Figure 1. It has two factors with six indicators each. The fac-tors are identified by setting the factor variances to 1. The re-lationship of interest is the correlation between the two fac-tors. The simulation presented assesses the power to detect a relatively low (r=.1) correlation between these two factors.
This design was selected because all observed variables are dependent (endogenous) variables in a confirmatory
Figure 1. The two factor, six indicator confirmatory factor model

106
LITTVAY, Questionnaire design with planned missing data, Review of Psychology, 2009, Vol. 16, No. 2, 103-113
factor model. Models with independent (exogenous) vari-ables need additional treatment of missing data using full information maximum likelihood estimation. Findings are limited by the test model selection, but are probably gener-alizable to all other structural models of interest (including a multiple regression). However, such an assumption should not be made without careful testing using the methods pre-sented here. The scripts in the online appendix are presented to help the reader to conduct a similar test with different models.
The simulation will test two different rates of missing data. In one, two of the six indicators for each factor are not collected (missing), cutting the length of the questionnaire by a third. In the second scenario, four of the six are missing cutting the length of the questionnaire by two-thirds.
To achieve positive covariance coverage, multiple ques-tionnaire versions are needed. For the first scenario, where two of the six questions are deleted, a minimum of three versions is necessary. For example, version A asks Q1-Q4 for each of the factors, version B asks Q3-Q6, and version C asks Q1, Q2, Q5 and Q6. In this example the covariance coverage between Q1 and Q2 is 67% since both version A and version C ask Q1 and Q2. The variance coverage is also 67%. But the covariance coverage between Q1 and Q3 is only 33% as Q1 and Q3 are only asked together in version A. Three versions lead to low uniformity of the covariance coverage, as it ranges from 0.33% to 67%.
To see the impact of the number of questionnaire ver-sions, a Monte Carlo simulation was conducted, simulating 1000 complete datasets of 12 variables with a sample size of n=1350. For each case, a random questionnaire version was selected, and data for the questions not asked was de-leted. Again, the advantage of this type of analysis is that population parameters and true values for each simulated individual are known, and it is possible to analyze the in-complete datasets as if certain questions were not asked and certain data was not collected by design. The possibility of 3, 15 (all possible combinations for 6 questions with 2 ques-tions deleted), and 225 questionnaire versions (all possible combinations for 2 × 6=12 questions with two questions de-leted for each of the 6, while ensuring that equal numbers of indicators were collected from both factors) were tested. Figure 2 describes the questionnaire versions visually.2
The simulated datasets with the missing data were ana-lyzed and compared to the population values to see if the results were unbiased, and to see which approach is the most powerful for detecting correlation between the two factors.
As an added test condition, the indicator reliabilities for each factor were varied. With equal indicator reliabilities, it is not unreasonable to expect the number of questionnaire versions (missing data patterns) will not matter. For this rea-
son, one condition was tested where all the indicators had equal reliabilities, and one where the indicators had differ-ent reliabilities. Q1 was the most and Q6 the least reliable (see Figure 3).
The author also tested what happens if more reliable indicators are collected for one factor and the less reliable indicators for the other. For the purposes of this study, this pattern will be called the mirror pattern as it visually looks like a mirror image (see top and bottom pattern of Figure 2). This is compared to the opposite, symmetric, pattern in which if more reliable indicators were deleted for one fac-tor, the more reliable indicators are also deleted for the other factor (and vice versa, see top and middle pattern of Figure 2). From a practical point of view, the indicator reliability could be incorporated into the planned missing data design in the rare instances when it is known before the question-naires are put together. When all 225 patterns are used in the model, symmetry and mirroring ceases to be an issue, as all possible patterns are included.
The population models are presented in Figure 3. In the first condition, the factor loadings are equal for all the indi-cators. In the second condition, the loadings decrease from indicator 1 to 6.
Earlier paragraphs have discussed the impact of using only three questionnaire versions on covariance coverage. When 15 questionnaire versions are used, the covariance coverage is uniform at 40%; the variance coverage and the covariance with the same position indicator of the other fac-tor is fixed at 67%.3 With 225 questionnaire versions, the variance coverage is 67%, covariance coverage for the in-dicators of the same factor is 40% and covariance coverage with the indicators of the other factors is 0.44% making this the most uniform distribution of covariance coverage. The full covariance matrices are presented in appendix A.
For the condition when 67% of the data is deleted, the minimum number of questionnaires to insure no zero cov-ariance coverage is 15, therefore the 15 and 225 versions tests were run as described above, leaving out the three ver-sions test. Covariance coverage for the 15 versions is 7% with variance and equal position other factor covariance coverage at 33%. For the 225 questionnaire version condi-tion, variance coverage is 33%, covariance coverage within the factor is 7%, and with indicators of the other factor it is 11%, again making this a more uniform distribution of covariance coverage. Once again, the matrices are available in appendix A.
2 The 225 versions are not described visually due to its size.
3 Same position for first indicator of the first factor means the first indi-cator of the second factor in the symmetric treatment (eg. a1 and b1 on Figure 3), and the last indicator of the second factor in the mirror treatment (a1 and b6).

107
LITTVAY, Questionnaire design with planned missing data, Review of Psychology, 2009, Vol. 16, No. 2, 103-113
Figure 2. Planned missing data for three patterns and 15 patterns with symmetric and asymmetric designs

108
LITTVAY, Questionnaire design with planned missing data, Review of Psychology, 2009, Vol. 16, No. 2, 103-113
RESULTS
Results are presented in Table 1 with an emphasis on the power4 to detect the correlation of interest and the average fit statistics (averaged across replications), with their cor-responding standard deviations. As expected, the simulation produced unbiased estimates when averaged across the 1000 replications. With no missing data, the model detected the correlation of 0.1 between the factors. Across replications this result was within the 95% confidence interval 93.4% of the time (power = .934). When 33% of the data was delet-ed, power to detect this correlation was between 0.922 and 0.911; when 67% of the data was deleted, power dropped to between 0.86 and 0.847 and remained within acceptable power levels for the social sciences (>.80). As expected, the more missing data was present, the less power the model had to detect the significant correlation of 0.1.
There is practically no advantage to increased question-naire versions but there appears to be a very slight power advantage for the symmetric patterns. This might just be a simulation artifact, which disappears with increased replica-tion. From a practical point of view, this is only of concern when we have clear expectations about the quality of our in-dicators and can incorporate these into the planned missing data design. In general, fit statistics seem to be unaffected by missing data. TLI seems to diminish very slightly as the per-cent of missing indicators increases, and in these cases more questionnaire versions produce a slightly lower fit. There is one fit statistic which does diminish with the introduction of more missing data, and this is the SRMR. This suggests that the SRMR is more sensitive to the existence of missing data and does discriminate model fit as more missing data is present.
A more realistic analysis
A possible threat to the reliability of simulation findings is the artificiality of the data. Maybe these estimations only work when the data is perfectly multivariate normally dis-tributed. To overcome this problem, real data was utilized
Figure 3. Population models
4 Power is defined as the percent of times the false null hypothesis of r=0 is rejected through repeated sampling from the true population using 95% confidence.

109
LITTVAY, Questionnaire design with planned missing data, Review of Psychology, 2009, Vol. 16, No. 2, 103-113
in addition to the simulated data. A number of datasets were reviewed in order to find one with a relatively large sample size that could serve as a pseudo-population and offer sub-samples of 1350 for the purposes of the simulation. A data-set was required which contained two constructs with six indicators with a low but considerable correlation of about 0.1. The 2002 New Zealand Election Study was chosen; it is freely available and offers a sample size of n=4761 (NZES, 2002). Question set C18 asked: Generally, do you think it should be or should not be the government’s responsibility to provide or ensure: • A job for everyone who wants one • A decent living standard for all old people • A decent living standard for the unemployed • Decent housing for those who can’t afford it • Free health care for everyone • Free education from pre-school through to tertiary and
university levels Answer categories were: Definitely should, Should,
Shouldn’t and Definitely shouldn’t.
Second, the questionnaire contained the following ques-tion set: There are various forms of political action that peo-ple take to express their views about something the govern-ment should or should not be doing. For each one, have you actually done it during the last five years, or more than five years ago, might you do it, or would you never? • Sign a petition • Write to a newspaper • Go on a protest, march or demonstration • Boycott a product or service • Worked together with people who shared the sane con-
cern5 • Contacted a politician or government official in person,
or in writing, or other way6
Table 1Results for multivariate normal simulated data - hypothetical model
Even data generation Cor Power χ2 SD p, df=53 CFI TLI RMSEA SRMRNo missing data .934 53.234 10.661 .465 .005 (.006) .012 (.002)66% observed3 Patterns - Symmetric .917 53.52 10.776 .454 .999 (.001) 1 (.002) .005 (.006) .019 (.003)3 Patterns - Mirror .922 53.413 10.398 .458 .999 (.001) 1 (.002) .005 (.006) .019 (.003)15 Patterns - Symmetric .913 53.26 10.3 .464 .999 (.001) 1 (.002) .005 (.006) .018 (.002)15 Patterns - Mirror .911 53.905 10.904 .44 .999 (.001) 1 (.002) .005 (.006) .018 (.003)225 Patterns .915 53.484 9.835 .456 .999 (.001) 1 (.002) .005 (.006) .018 (.002)33% Observed15 Patterns - Symmetric .847 55.765 10.836 .371 .997 (.005) .998 (.008) .006 (.006) .044 (.005)15 Patterns - Mirror .849 55.105 10.92 .395 .997 (.005) .998 (.008) .006 (.006) .044 (.005)225 Patterns .86 56.925 11.45 .331 .996 (.005) .997 (.009) .007 (.007) .039 (.004)
Uneven data generation Cor Power χ2 SD p, df=53 CFI TLI RMSEA SRMRNo missing data .924 53.273 10.75 .464 .005 (.006) .017 (.002)66% observed3 Patterns - Symmetric .869 53.662 10.983 .449 .998 (.002) 1 (.005) .005 (.006) .028 (.004)3 Patterns - Mirror .833 53.497 10.477 .455 .998 (.002) 1 (.004) .005 (.006) .028 (.004)15 Patterns - Symmetric .885 53.492 9.866 .455 .998 (.002) 1 (.005) .005 (.006) .025 (.003)15 Patterns - Mirror .891 54.117 10.525 .432 .998 (.003) .999 (.005) .005 (.006) .025 (.003)225 Patterns .89 53.555 10.095 .453 .998 (.002) 1 (.005) .005 (.006) .025 (.003)33% Observed15 Patterns - Symmetric .72 55.642 10.485 .376 .99 (.013) .995 (.023) .006 (.006) .067 (.007)15 Patterns - Mirror .648 54.773 11.155 .407 .991 (.013) .997 (.025) .006 (.006) .065 (.007)225 Patterns .679 56.38 11.025 .35 .989 (.014) .993 (.024) .007 (.007) .06 (.006)
Note. Standard deviations are in parentheses.
5 question probably contains a typo.6 Question also included: Phone a talkback radio show, and Occupying
buildings, factories or other property but since only six indicators were needed, these two were selected to be removed
110
LITTVAY, Questionnaire design with planned missing data, Review of Psychology, 2009, Vol. 16, No. 2, 103-113
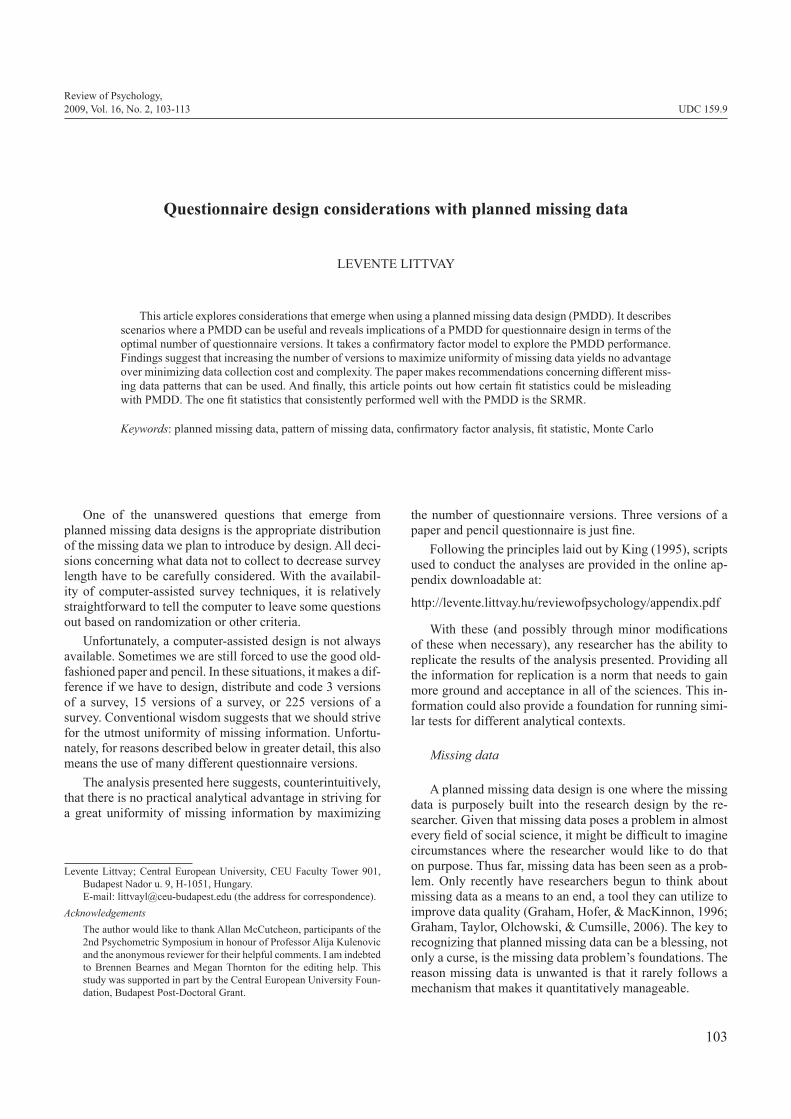
Figure 4. 2002 New Zealand election study pseudo-population results
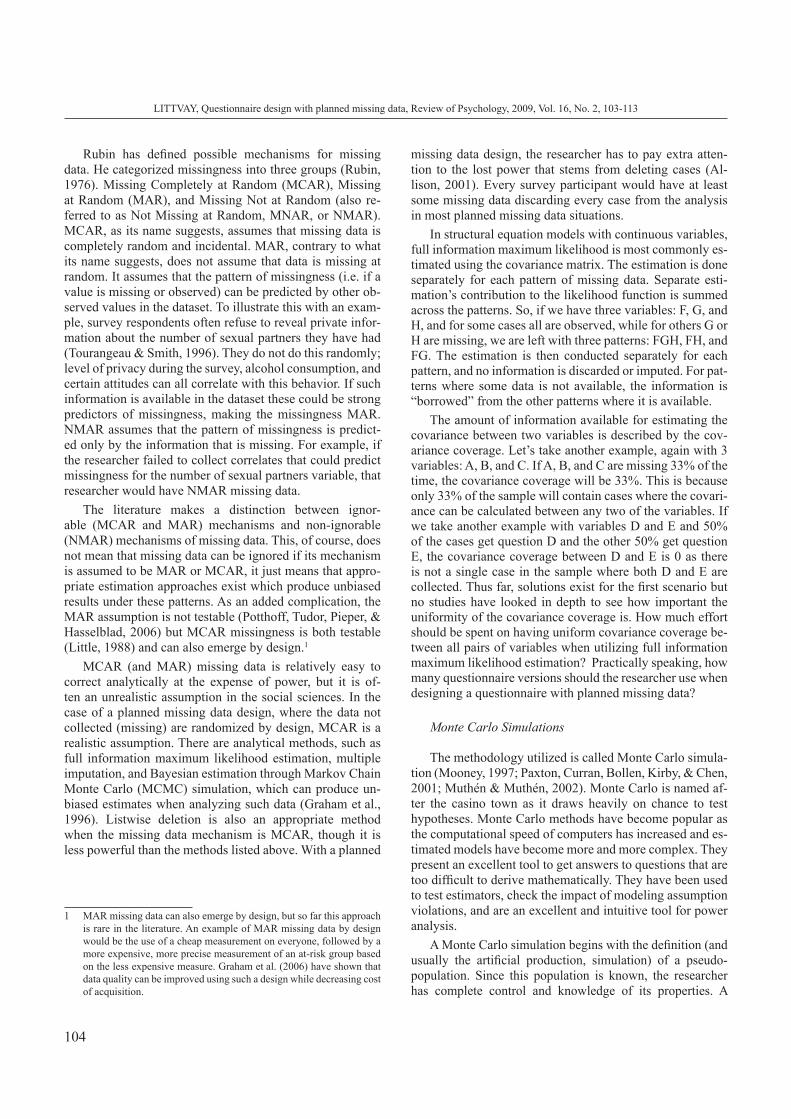
Table 2Results for multivariate normal simulated data - NZES 2002 Model
NZES02 Multivar Normal Cor Power χ2 SD p, df=53 CFI TLI RMSEA SRMR
No missing data .832 53.469 10.45 .456 .005 (.006) .017 (.002)66% observed3 Patterns - Symmetric .75 53.499 10.246 .455 .997 (.004) 1 (.008) .005 (.006) .028 (.003)3 Patterns - Mirror .746 53.616 10.547 .451 .997 (.004) 1 (.008) .005 (.006) .028 (.003)15 Patterns - Symmetric .763 53.966 10.135 .437 .997 (.004) .999 (.008) .005 (.006) .026 (.003)15 Patterns - Mirror .761 53.949 10.198 .438 .997 (.004) .999 (.008) .005 (.006) .026 (.003)225 Patterns .771 53.473 10.325 .456 .997 (.004) 1 (.008) .005 (.006) .026 (.003)33% Observed15 Patterns - Symmetric .508 56.178 11.489 .357 .984 (.022) .991 (.038) .007 (.007) .067 (.007)15 Patterns - Mirror .486 56.15 11.399 .358 .984 (.021) .991 (.038) .007 (.007) .067 (.007)225 Patterns .518 56.892 10.784 .332 .983 (.021) .988 (.036) .007 (.006) .061 (.006)
NZES02 Sampled Cor Power χ2 SD p, df=53 CFI TLI RMSEA SRMR
Population -- 1772.292 -- 0 .847 .809 .083 .053No additional missing data .753 561.814 63.54 4E-86 .842 (.019) .803 (.023) .084 (.005) .056 (.004)
66% observed3 Patterns - Symmetric .654 298.178 43.98 7E-36 .86 (.023) .826 (.029) .058 (.005) .063 (.005)3 Patterns - Mirror .54 299.333 43.9 4E-36 .859 (.024) .825 (.029) .058 (.005) .062 (.005)15 Patterns - Symmetric .62 249.725 36.794 2E-27 .874 (.022) .843 (.027) .052 (.005) .059 (.004)15 Patterns - Mirror .586 250.617 37.391 2E-27 .874 (.022) .842 (.028) .052 (.005) .059 (.004)225 Patterns .633 250.778 37.617 2E-27 .873 (.023) .842 (.028) .052 (.005) .059 (.004)33% Observed15 Patterns - Symmetric .361 86.812 17.83 .002 .903 (.048) .879 (.06) .021 (.006) .088 (.008)15 Patterns - Mirror .239 88.274 18.059 .002 .899 (.048) .874 (.061) .021 (.006) .088 (.008)
225 Patterns .331 88.93 18.684 .001 .897 (.05) .872 (.063) .022 (.006) .083 (.008)
Note. Standard deviations are in parentheses.

111
LITTVAY, Questionnaire design with planned missing data, Review of Psychology, 2009, Vol. 16, No. 2, 103-113
Answer categories were: Actually done it during the last 5 years, Actually done it more than 5 years ago, Might do it, Would never.
Both questions contained a “don’t know” response op-tion, which was treated as missing data (beyond the planned missing that was erased for the purposes of the analysis)7. The two constructs had a correlation of .102 when the entire pseudo-population of 4761 cases with complete data was analyzed. Population loadings are presented in Figure 4.
It is fair to note that treating such answer categories as continuous, metric data is also unreasonable, though defi-nitely done. The goal here was specifically to stretch the as-sumption of artificial (clean, perfect without any assumption violations) continuous multivariate normal data and repli-cate the simulation test on a very messy, realistic dataset, under extreme modeling conditions, to see if the results hold or not.
The 4761 cases were used as the pseudo-population and samples of 1350 were drawn. Planned missing data was in-troduced just like it was done with the simulated datasets. The data were analyzed and the process repeated. R script to produce the subsamples with the missing data can be found in appendix C, the Mplus script to conduct the analysis in appendix D. The results of these analyses can be compared to the known pseudo-population parameters as seen in Table 1. Additionally, artificial multivariate normal data with the estimated parameters of the pseudo-population were pro-duced for additional comparisons between real life and ideal modeling situations, comparisons between artificial and re-alistic data. The Mplus script to produce the multivariate normal artificial datasets can be found in appendix B, the R script to introduce the planned missing data is in appendix C. The analysis presented earlier can be reproduced with minor modifications to these scripts.
Results are presented in Table 2 in the format already familiar from Table 1. Once again, point estimates are unbi-ased on average and comparable to the findings of the pre-vious simulations. Without missing values, the simulated data showed a .832 power to detect the correlation of .102, while the data sampled from the real-life pseudo-population had a power of .753. With the artificial data, power dropped to between .746 and .771 with 33% missing data, and to between .486 and .518 with 67% missing data. With the realistic data, power was between .54 and .654 with 33% missing data, and between .239 and .361 with 67% missing data. The symmetric patterns are more clearly preferable to mirror patterns in this second simulation. This preference
7 If the testing of the relationship was of substantive interest, it would be worthwhile to consider treating the Don’t Know answers differently because treating them as missing data assumes that these respondents actually do have a non-revealed true value for the question, when, in reality, they might just not know.
becomes even more highlighted by the real life, realistic data. Once again, there is little to no advantage in increasing questionnaire versions.
The power loss with the messy data is more substantial. Power can always be increased by increasing the sample size. While the example here suggests that a lot of miss-ing data does lead to estimates that are not trustworthy, higher power can be achieved by an increased sample size. Decreasing the size of a questionnaire through a planned missing data design comes at the cost of having to increase the sample size. Hence, careful pre-testing should be done to assess the appropriateness and power loss of a planned missing design. The scripts presented in the appendix can help researchers conduct such a pre-test appropriate for their own research scenario.
Interestingly, the fit statistics behave very differently with the realistic real life data than they do with the artificial simulated data. For the simulated data, the results are com-parable to the earlier simulations. The real life subsamples show better fit as the missing data increases. This is counter-intuitive, but with additional exploration of our understand-ing of fit, the results may be explainable. We started with a messy dataset where each individual case that deviates from the expectation contributes additively to the overall model misfit. If we delete data-points from such cases randomly, on average we still get the same estimated parameters (with-in a certain confidence level) but we also delete data that contribute additively to the misfit. For this reason, model fit increases as we introduce missing data.
Obviously, from a practical point of view, this is not a desired property of a fit statistic. Once again, the SRMR was the only statistic that behaved the way we would expect and showed a worse fit as more missing data was introduced. Mainstream practice in the structural equation modeling lit-erature is to rely on multiple fit statistics when assessing model fit. In light of these findings, it appears that it may be advantageous to put a lot of weight on the SRMR when assessing model fit with missing data present (planned or unplanned).
DISCUSSION
From the perspective of survey research and question-naire design, the results of this Monte Carlo experiment are favorable as it appears that increasing the number of questionnaire versions does not have a substantial impact. These findings will come as a relief to researchers hoping to utilize a planned missing data design in a non-compu-ter-assisted form (where randomization cannot be pre-pro-grammed). Design, management and recording of a large number of questionnaire versions is likely to increase sur-vey costs, but these findings suggest that three versions are enough, at least in the analytical situations presented here. The author is confident the results would generalize to oth-er models where ignorable missing data can be corrected
112
LITTVAY, Questionnaire design with planned missing data, Review of Psychology, 2009, Vol. 16, No. 2, 103-113
computationally (such as regression with full information maximum likelihood estimation). Researchers are urged to test this assumption in their own scenario using the methods and scripts presented here before utilizing such a design for another modeling scenario.
Additionally, the most interesting finding is the coun-terintuitive behavior of model fit statistics. With idealized modeling scenarios, fit was not influenced by missing data. In the messy scenario resembling real life research situa-tions, missing data increased fit. The one fit statistic that be-haved in accordance with expectations was the SRMR, and therefore heavy emphasis should be placed on the SRMR when assessing model fit with missing data present (planned or unplanned).
One of the primary purposes of a planned missing data design is the shortening of the questionnaire. Shorter ques-tionnaires lead to better response rates and less survey fatigue near the end of the questionnaire, increasing data quality. The trade off is loss of power and the necessity of an appropri-ate missing data treatment in the analysis. The disadvantages can be offset easily (and often economically) by an increased sample size and proper analytical sophistication.
One of the unanswered questions for the application of planned missing data is the optimal distribution of the miss-ingness introduced in the research design. To achieve the greatest uniformity in the information matrix, the number of questionnaires should be maximized. This means additional time, effort, and money must be spent on data collection. This article has explored the question in multiple contexts and concluded that the time, effort, and money can be saved, as maximizing the uniformity of available information has no impact on statistical power.
As a final word of caution, the author notes that one of the main limitations of the Monte Carlo method utilized throughout the article is the unknown generalizability of the findings. The first simulation managed to overcome the prob-lem that stems from testing the experiments with perfectly artificial multivariate normal data. Note that some aspects of the findings did change when a more realistic research sce-nario was simulated. Second, these results only apply to the models tested. The author tested confirmatory factor models, but there is no reason why someone would not want to uti-lize a planned missing data design to decrease questionnaire length and plan to run a multiple regression using full infor-mation maximum likelihood estimation. In such a design, special attention has to be paid to the differential treatment of endogenous (dependent) and exogenous (independent) variables by the missing data procedure. Exogenous vari-ables with missing data have to be endogenized by giving them a distributional assumption, otherwise the procedure is the same as it was for the confirmatory factor model.
Fortunately, every tool needed to rerun these tests in dif-ferent scenarios is available, and the appendix is designed to help researchers with such endeavors. The scripts presented
in the appendix can be rewritten for other research scenar-ios. The author would caution anyone against applying the findings to different scenarios without testing if they work. Pre-testing research ideas through simulations can also help researchers avoid mistakes that would be extremely expen-sive, maybe impossible, to correct once the data is collected and not sufficient. (For example, an accidental zero covari-ance coverage.) These procedures also provide an excellent power analysis tool, an analysis that should be conducted before the finalization of a research design in all research scenarios.
REFERENCES
Allison, P.D. (2001). Missing Data. Quantitative Applica-tions in the Social Sciences. Sage Publications, Inc.
Crawford, S., Couper, M., & Lamias, M. (2001). Web sur-veys. perceptions of burden. Social Science Computer Review, 19, 146—162.
Graham, J.W., Hofer, S.M., & MacKinnon, D.P. (1996). Maximizing the usefulness of data obtained with planned missing value patterns: An application of max-imum likelihood procedures. Multivariate Behavioral Research, 31, 197–218.
Graham, J.W., Taylor, B.J., Olchowski, A.E., & Cumsille, P.E. (2006). Planned missing data designs in psycholog-ical research. Psychological Methods, 11(4), 323–343.
Groves, R.M., Fowler, F.J., Cooper, M.P., Lepkowski, J.M., Singer, E., & Tourangeau, R. (2004). Survey Method-ology. Wiley Series in Survey Methodology. Wiley and Sons.
Hansen, K.M. (2006). The effects of incentives, interview length, and interviewer characteristics on response rates in a cati-study. International Journal of Public Opinion Research, 19(1), 112–121.
Heerwegh, D., & Loosveldt, G. (2006). An experimental study on the effects of personalization, survey length statements, progress indicators, and survey sponsor lo-gos in web surveys. Journal of Official Statistics, 22(2), 191–210.
King, G. (1995). Replication, replication. PS: Political Sci-ence and Politics, 28(3), 444–452.
Little, R. J.A. (1988). A test of missing completely at random for multivariate data with missing values. Journal of the American Statistical Association, 83(404), 1198–1202.
McCarty, C., House, M., Harman, J., & Richards, S. (2006). Effort in phone survey response rates: The effects of vendor and client-controlled factors. Field Methods, 18, 172–188.
Mooney, C.Z. (1997). Monte Carlo Simulation. Quantita-tive Applications in the Social Sciences. Sage Publica-tions, Inc.

113
LITTVAY, Questionnaire design with planned missing data, Review of Psychology, 2009, Vol. 16, No. 2, 103-113
Muthén, L.K., & Muthén, B.O. (2002). How to use a mon-te carlo study to decide on sample size and determine power. Structural Equation Modeling: A Multidisci-plinary Journal, 7, 262–280.
Muthén, L. K., & Muthén, B. O. (2006). Mplus User’s Guide. Forth Edition. Los Angeles, CA: Muthén & Muthén.
NZES (2002). New Zealand election study. www.nzes.orgPaxton, P., Curran, P.J., Bollen, K.A., Kirby, J., & Chen,
F. (2001). Monte carlo experiments: Design and imple-mentation. Structural Equation Modeling: A Multidisci-plinary Journal, 8(2), 287-313.
Potthoff, R.F., Tudor, G.E., Pieper, K.S., & Hasselblad, V. (2006). Can one assess whether missing data are miss-ing at random in medical studies? Statistical Methods in Medical Research, 15(3), 213–234.
Rubin, D.B. (1976). Inference and missing data. Biometrika, 63(3), 581–592.
Tourangeau, R., & Smith, T. (1996). Asking sensitive ques-tions: The impact of data collection, question format, and question context. Public Opinion Quarterly, 60, 275–304.
