quick guide analysis report - defgo.net
TRANSCRIPT

Quick guide Analysis report
Distributed by Interresearch a|s
July 2021

2
Contents Quick report .......................................................................................................................................................................... 3
Advanced report ................................................................................................................................................................... 4
Update report ...................................................................................................................................................................... 19
Share report ........................................................................................................................................................................ 22
3
Quick report
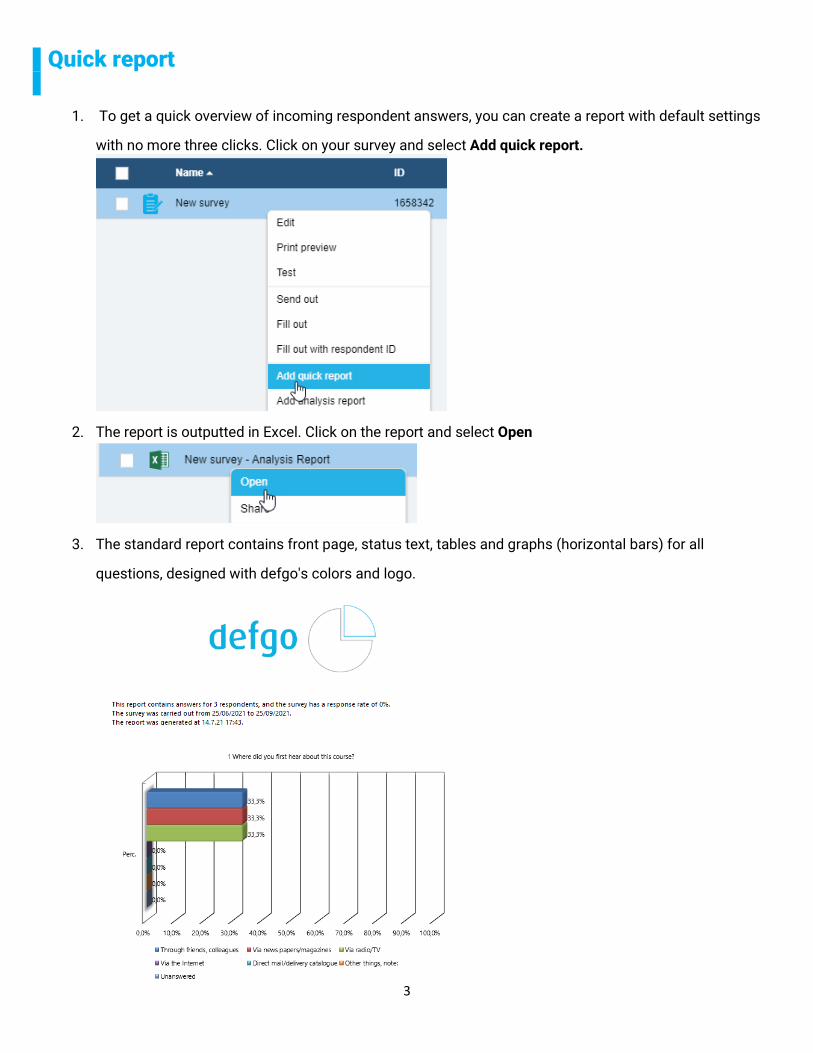
1. To get a quick overview of incoming respondent answers, you can create a report with default settings
with no more three clicks. Click on your survey and select Add quick report.
2. The report is outputted in Excel. Click on the report and select Open
3. The standard report contains front page, status text, tables and graphs (horizontal bars) for all
questions, designed with defgo's colors and logo.
4
Advanced report
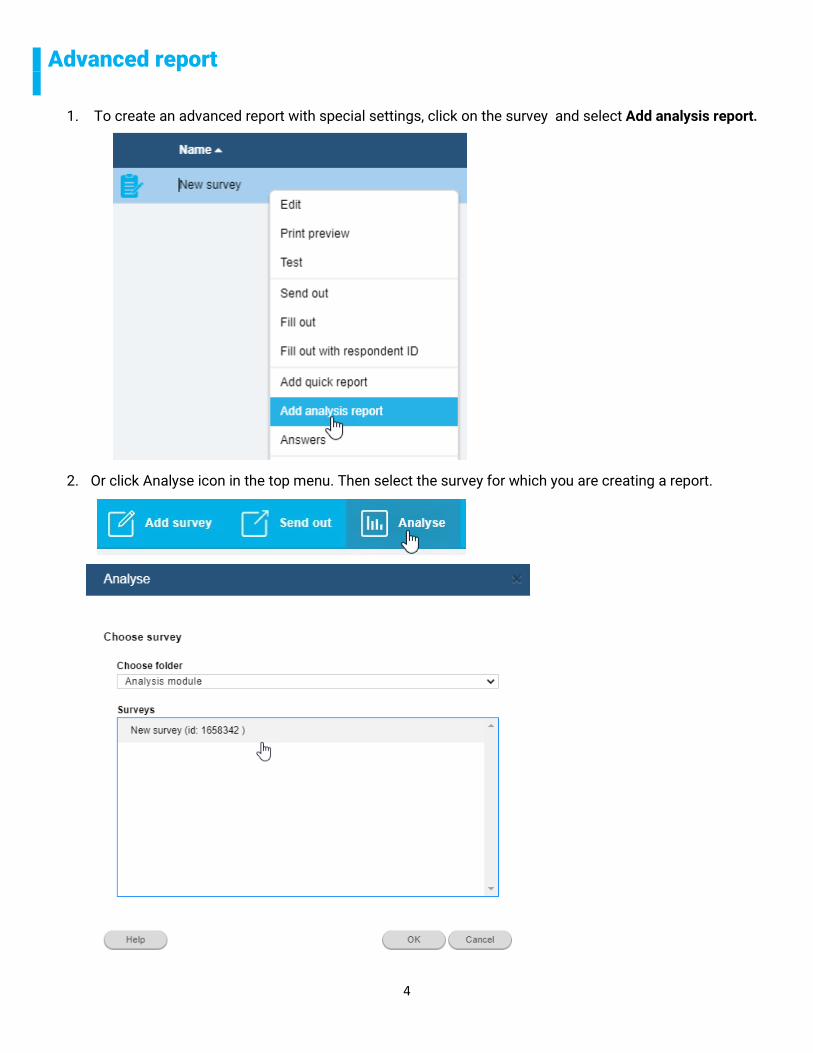
1. To create an advanced report with special settings, click on the survey and select Add analysis report.
2. Or click Analyse icon in the top menu. Then select the survey for which you are creating a report.

5
3. You will then come to analysis wizard with 5 tabs.
4. a. In the first tab Content you decide which questions you want to include in the report, how the questions
should be displayed and the order of them. When you open Content for the first time, the list is filled in by default with tables and graphs for each question, as well as introduction text with background data.
b. In the top you can add elements by clicking the plus icon.
You can edit multiple elements simultaneously, use the editing menu below the elements.
6
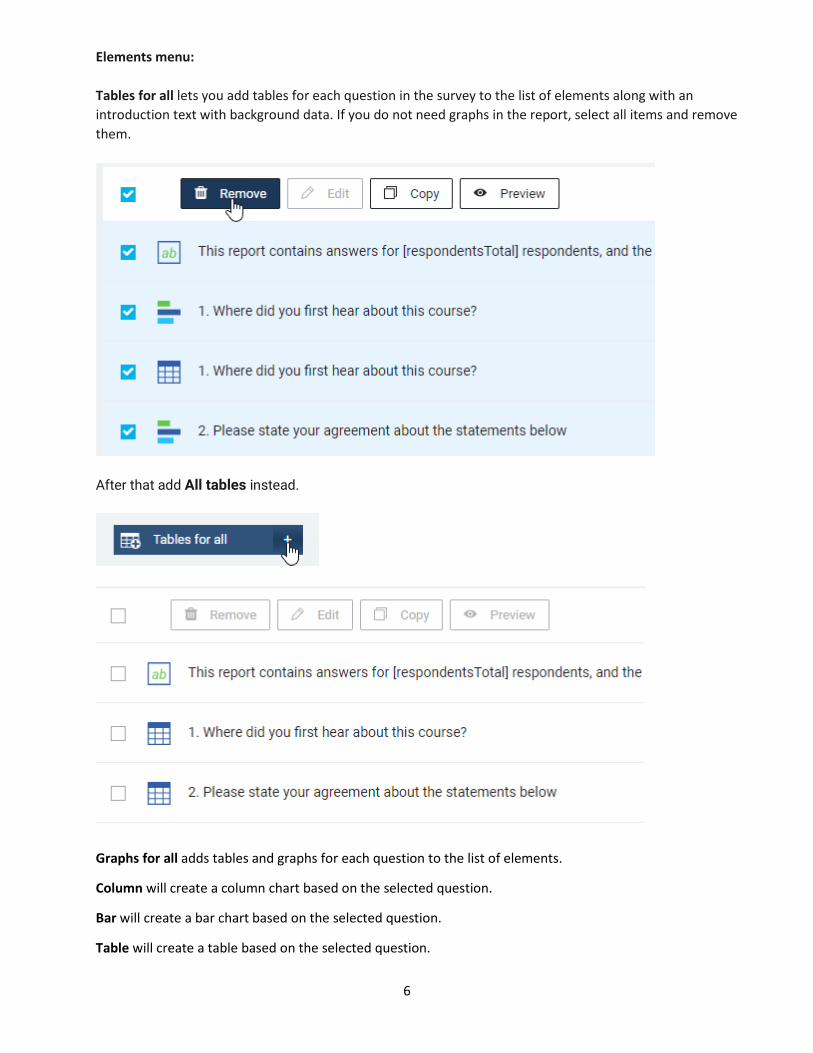
Elements menu: Tables for all lets you add tables for each question in the survey to the list of elements along with an introduction text with background data. If you do not need graphs in the report, select all items and remove them.
After that add All tables instead.
Graphs for all adds tables and graphs for each question to the list of elements.
Column will create a column chart based on the selected question.
Bar will create a bar chart based on the selected question.
Table will create a table based on the selected question.

7
Add one question will add a single element to the list. Click on it and choose the question for which should be created an element in the Data tab. As default the element is added as Bar. In the tab Choose type you can change to other type of element.
Pie will create a circle diagram based on the selected question.
Introduction text is used for adding information about the survey in the report. The text created by default can be changed. You can use short codes as:
[respondentsTotal] - the total number of respondents, participating in the survey; [responseRateTotal] – response percent for the respondents; [surveyStartDate] and [surveyEndDate] – date for survey start and ending; [filter] – filter, used for creating the report; [respondentsFilter] - number of answers fulfilling the filter settings; [reportCreationTime] – time of report creation.
Text lets you add your own text in the report. This can be an introduction text or an explanation of the report or graphs.
Picture will add a picture in the report. In the tab Picture settings you can edit settings for the picture. To add the picture saved on your computer, copy the Image URL and insert in Image URL. To add an image uploaded to your folder, select the image from the drop-down menu.
c. Right next to each element are buttons - edit, copy, preview and remove.
d. By clicking Edit, you can change the element type in Choose type.
You can change the question in Data:

8
You can add Cross Tab the selected question. The function Is used to clarify linear relationships in the data material. Two questions can be crossed. One question is often a background questions, and the other is a superior question (e.g. ‘overall satisfaction’). By combining filters, you can obtain a more in-depth analysis. Go to the Cross Tab and tick the check box Cross-tabulate question. The field for selecting additional questions will be available. Select available questions, for example, it will be question number 4.
Click on OK and save the report. As a result, the table is added:
As you can see in the picture above, the cross-table shows the number of respondents who have chosen the same answer alternatives to the questions.

9
You can add Filter. Go to Filters and tick the check box Local filter.
Each tab in the left navigation menu corresponds to the one type of filters. You can configure the filtering options at each tab - they will all be saved and used in the report.
When all filter settings are specified, click OK.
e. You can also just click an element and use the functions: Change type, Select data and Filters. Select function and you go directly to a specific tab in pop up.
10
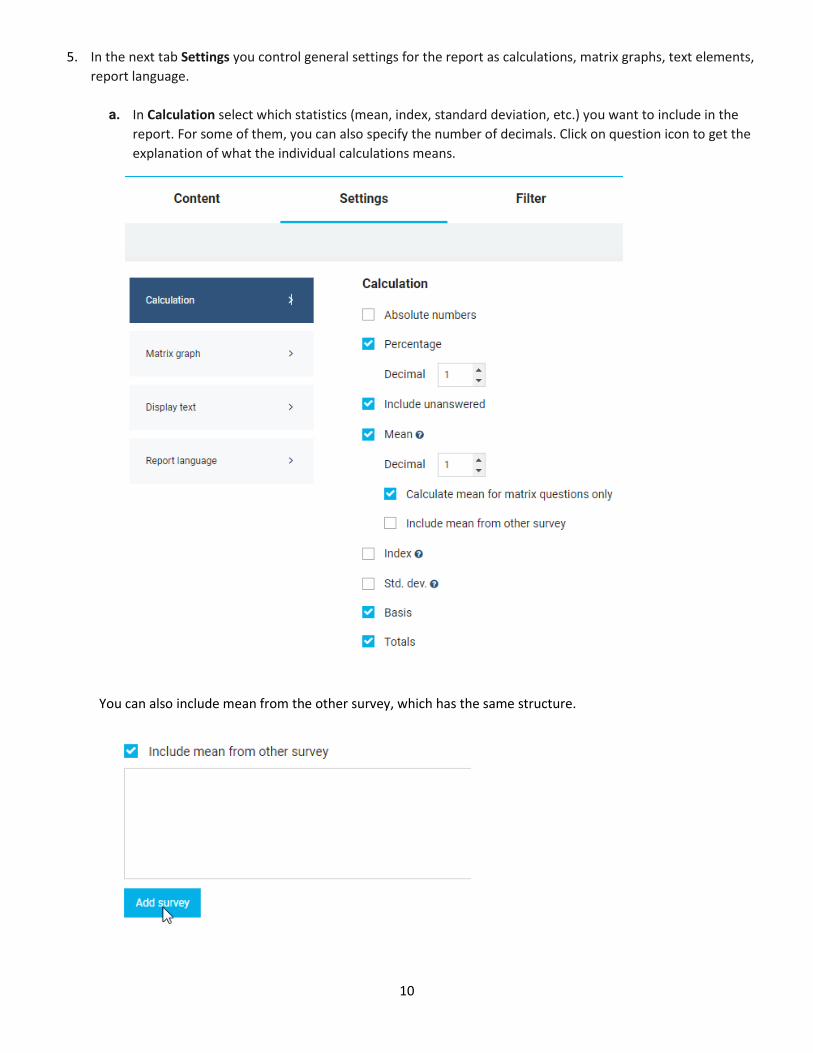
5. In the next tab Settings you control general settings for the report as calculations, matrix graphs, text elements, report language.
a. In Calculation select which statistics (mean, index, standard deviation, etc.) you want to include in the report. For some of them, you can also specify the number of decimals. Click on question icon to get the explanation of what the individual calculations means.
You can also include mean from the other survey, which has the same structure.

11
b. In the next tab select how graphs of Matrix questions are generated.
с. In Display text select which elements will be included in the report.
d. In Report language you can change language version and system language, if it’s necessary.

12
6. In the next tab Filter you can add and edit filters like in the Content tab, plus in this tab you can use Auto-filter.
With Auto-filter you can choose all answer combinations for one question, and create, for example, 200 reports in one click. You can create 1 report per respondent, or 1 report per answer option and combination.
If 1 report per answer option and combination is selected, you can choose one of the following possibilities:
- «create reports for all combinations of questions and answer options » allows to create full set of reports, even if some of the them will remain empty (i.e. survey doesn’t contain answers that meets the criteria)
- «create reports for all combinations containing answers (no empty reports) » allows to create a set of reports, which at least include one answer
13
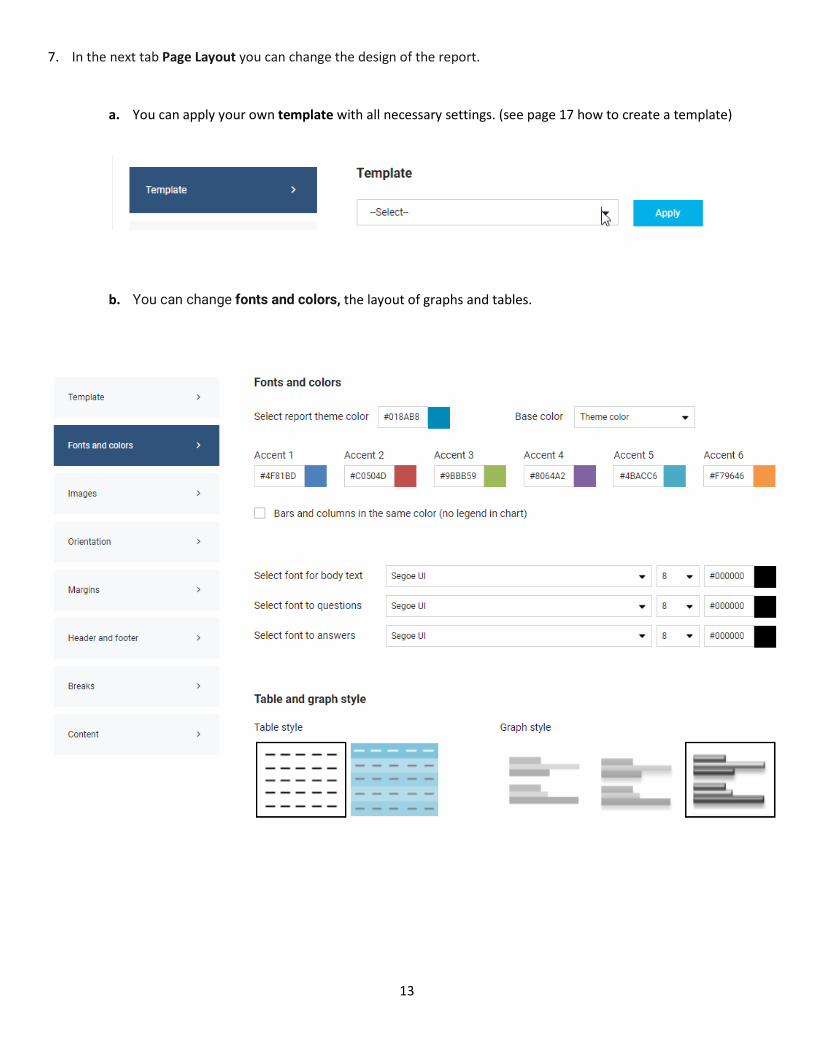
7. In the next tab Page Layout you can change the design of the report.
a. You can apply your own template with all necessary settings. (see page 17 how to create a template)
b. You can change fonts and colors, the layout of graphs and tables.

14
c. You can add logo and the image that will be used for the creation of the front page.
d. You can change page direction in the tab Orientation.
e. You can edit margins.

15
f. Header and footer are filled in with information about the name of the report and defgo's contact information by default. You can change text for header and footer and include page numbers in the report.
g. In Breaks you can specify grouping of items (tables and graphs) in the report.
16
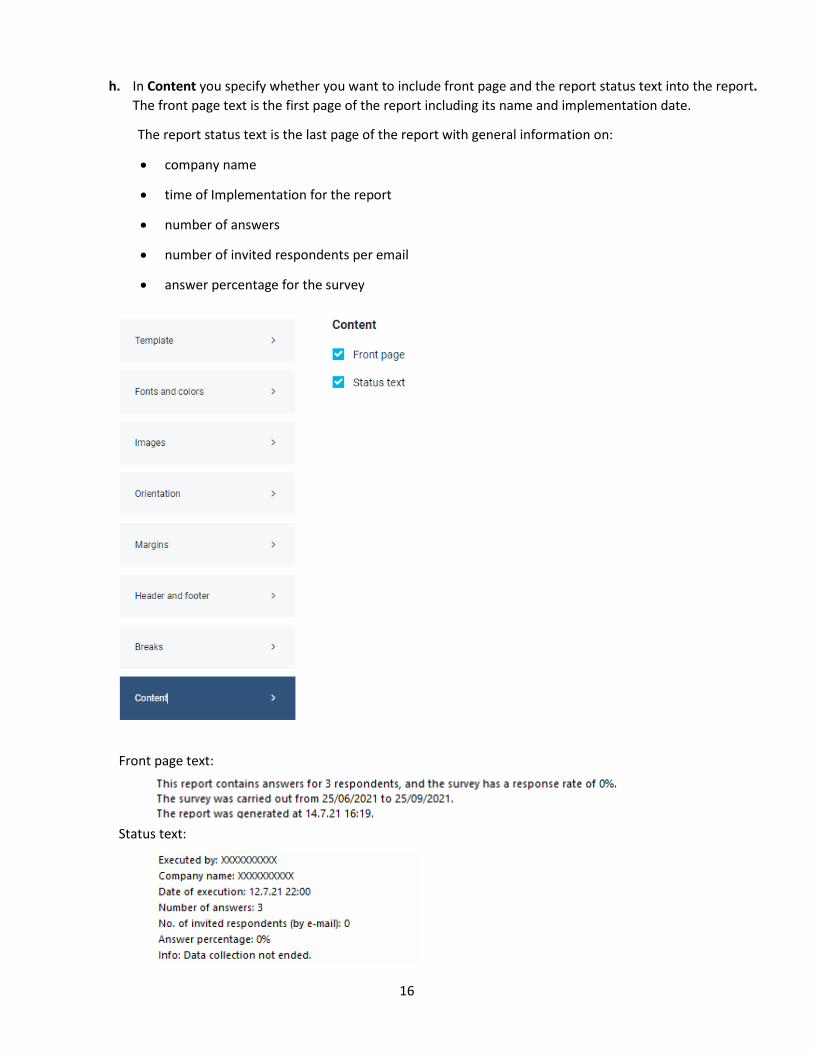
h. In Content you specify whether you want to include front page and the report status text into the report. The front page text is the first page of the report including its name and implementation date.
The report status text is the last page of the report with general information on:
• company name
• time of Implementation for the report
• number of answers
• number of invited respondents per email
• answer percentage for the survey
Front page text:
Status text:

17
8. In the next tab Output you choose report format: Excel, Word, PDF, PowerPoint, HTML or HTML Dashboard.
Check the field Template if you would like to save the report as a template.
Then you can load the template in the tab Page layout.
9. You can preview the report by clicking Preview in the top menu.
18
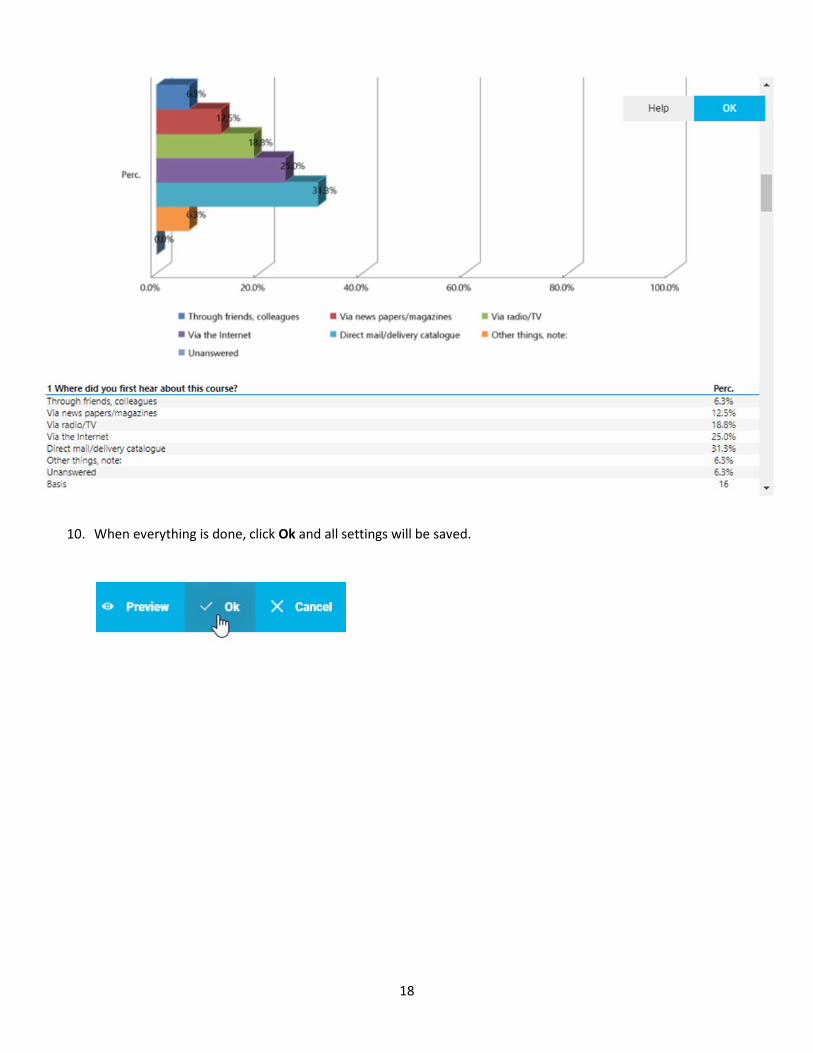
10. When everything is done, click Ok and all settings will be saved.

19
Update report
The report can be updated in two ways: by a manual update or an automatic update.
1. For a manual update click on the report and choose Update, and the report is updated.
2. For an automatic update – e.g. once a day – use the tool Add schedule. First open the folder with the report and then click Add schedule in the Menu.

20
3. In the first tab Task in Object type choose Report and select the needed report from the list.
4. Go to the tab Schedule. Set Start date and End date, as default setting "today" is selected as start date, and end
date is automatically set one month forward. Set the time. Then select how often the report should be updated in the dropdown menu Schedule task.

21
5. In the tab Notification you can define mail text and recipients of the notification, when the report is updated.
Note, if you don’t change data in Notification, a default email will be sent to the account owner each time the report is updated.

22
Share report
You can create a link to a report and send it to those who need access to the report. This is practical in terms of following the response process via the report, which is updated automatically.
It means that with a click on the link you can go directly to a current report, which shows the updated answers. Therefore you don’t need to log in defgo account each time, when you need to see the last version of the report.
1. Click the report and choose Share.
2. Type in start- and end date for report availability and enter the password if it’s needed. Copy the link or just send it via email.