quick quiz on 2 separate diagrams for a firm facing a downward sloping demand curve: illustrate...
TRANSCRIPT

Quick Quiz
• On 2 separate diagrams• For a firm facing a downward sloping
demand curve:• Illustrate normal profit• Illustrate abnormal profit

Market Structures

PerfectCompetition Oligopoly Monopoly
MonopolisticCompetition
The theory of the firm examines how prices and output vary under these different market structures
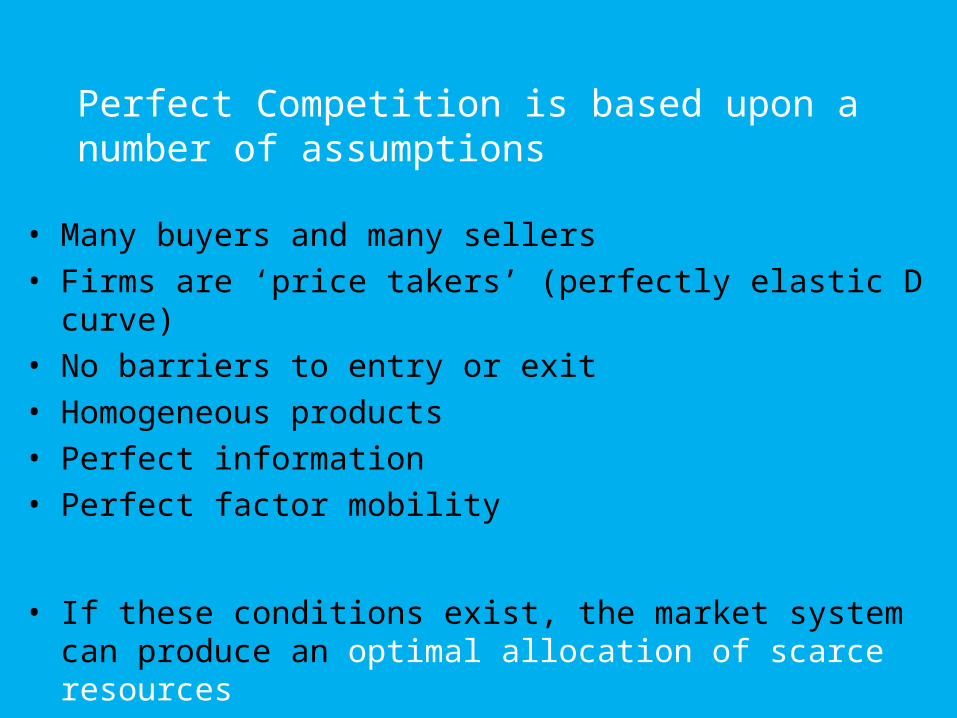
Perfect Competition is based upon a number of assumptions
• Many buyers and many sellers• Firms are ‘price takers’ (perfectly elastic D curve)• No barriers to entry or exit• Homogeneous products• Perfect information• Perfect factor mobility
• If these conditions exist, the market system can produce an optimal allocation of scarce resources

What markets have features of perfect competition?

• When perfect competition exists, resources are allocated through price signals
• Fierce competition ensures that costs are minimised and that resources are used sparingly (firms will produce at their lowest average total cost hence will be productively efficient)
• Inefficient firms will be driven out of the market; only those with the lowest costs will survive
• Prices will be pushed downwards • It ensures that consumer sovereignty prevails – firms
become price takers• Normal profit is made in the long- run (normal profit is the
minimum level of profit required to keep the factors of production in their current use in the long run)
• Note: Despite the lack of real- world examples, the model plays a very important part in economic analysis and policy.
• Many economists would argue that achieving perfect competition (or moving towards it) would bring a number of advantages and is therefore used as a standard to judge the shortcomings of real world industries and can help form policies towards industries.
Possible short-run profit and loss situations in perfect competition

Recall...
• The output level for a firm with a perfectly inelastic demand curve using MC and D=AR=MR

£
Output
MC
D= AR= MR
P
q
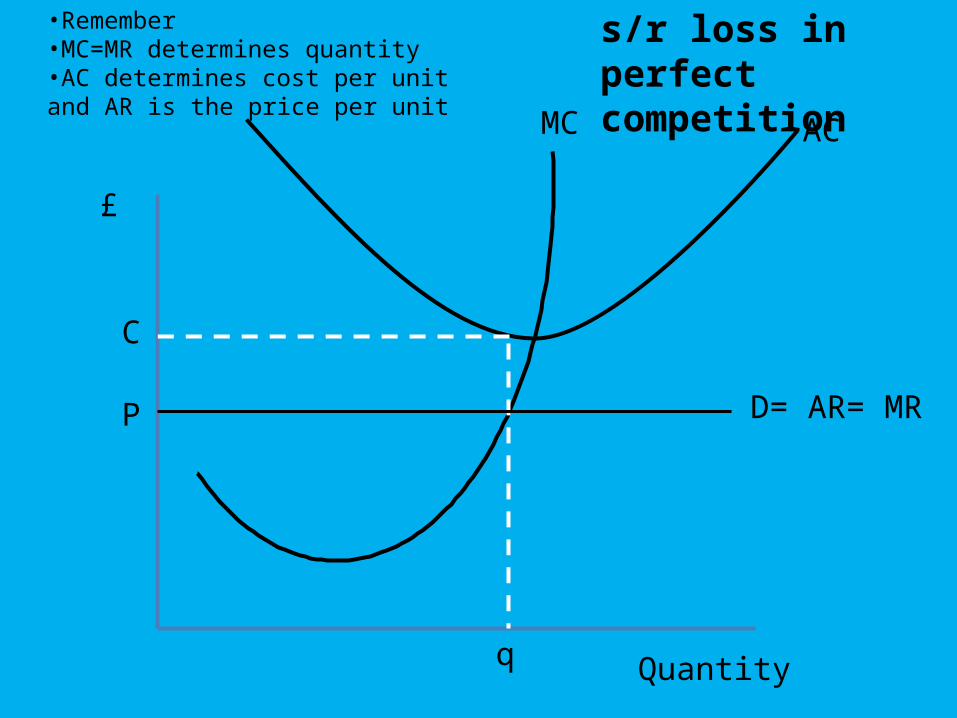
•Remember •MC=MR determines quantity•AC determines cost per unit and AR is the price per unit
s/r abnormal profits in perfect competitionAC
C
£
Quantity
MC
D= AR= MR
P
q
•Remember •MC=MR determines quantity•AC determines cost per unit and AR is the price per unit
s/r loss in perfect competitionAC
C

The movement from short- run to long- run in perfect
competition• If firms are making either short- run
abnormal profits or short- run losses, other firms react and the situation starts to change until an equilibrium point is reached in the long run
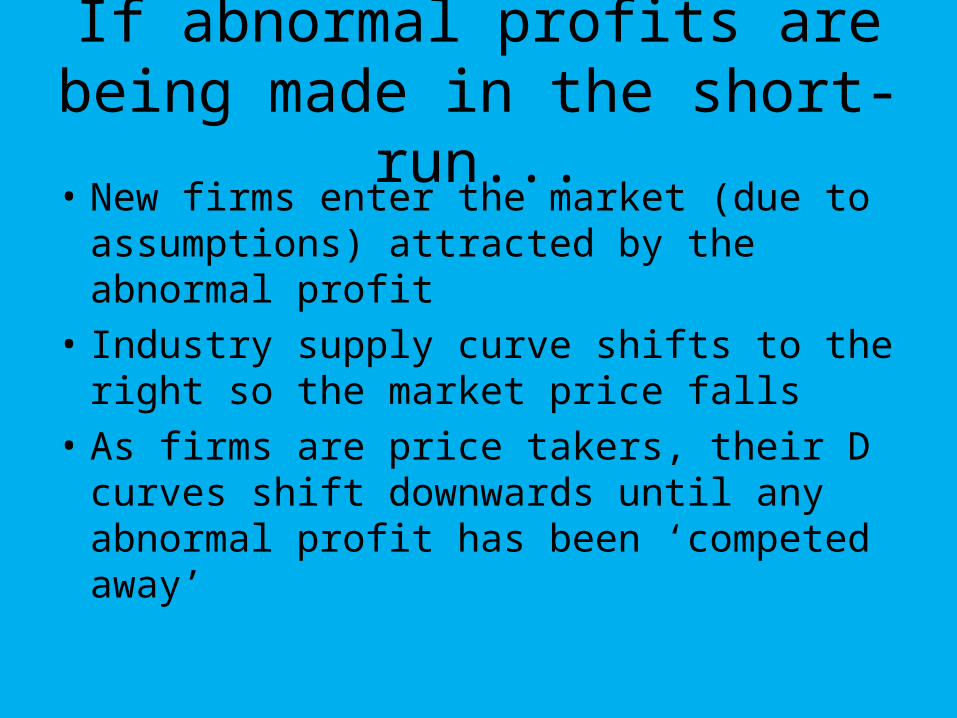
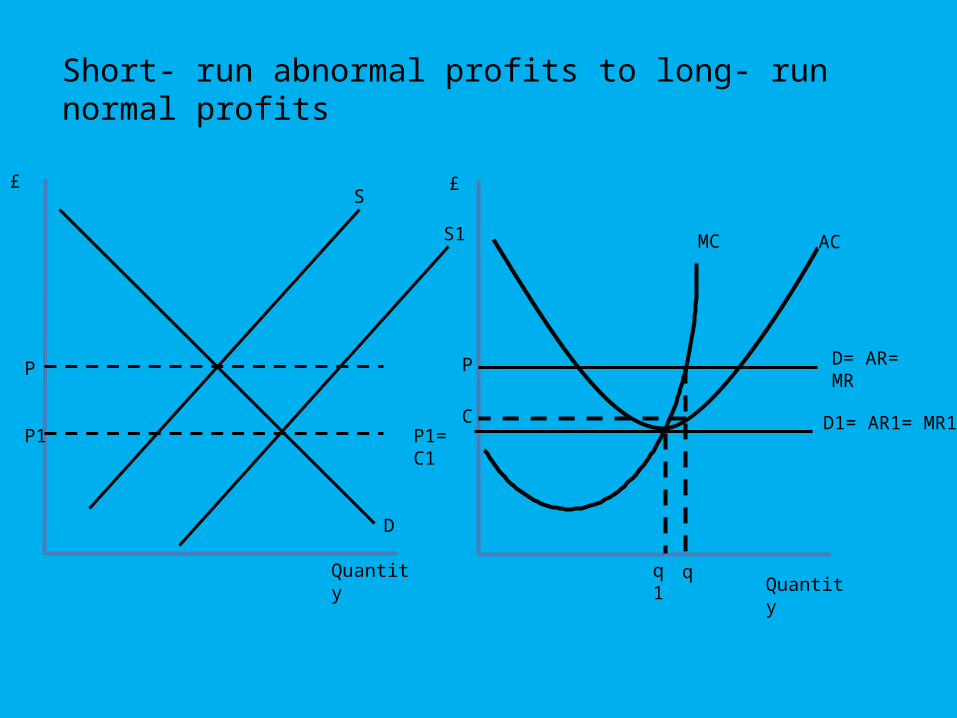
If abnormal profits are being made in the short- run...
• New firms enter the market (due to assumptions) attracted by the abnormal profit
• Industry supply curve shifts to the right so the market price falls
• As firms are price takers, their D curves shift downwards until any abnormal profit has been ‘competed away’
£
Quantity
MC
D= AR= MR
P
q
AC
C D1= AR1= MR1P1=
C1
S
S1
P
P1
q1
£
Quantity
D
Short- run abnormal profits to long- run normal profits
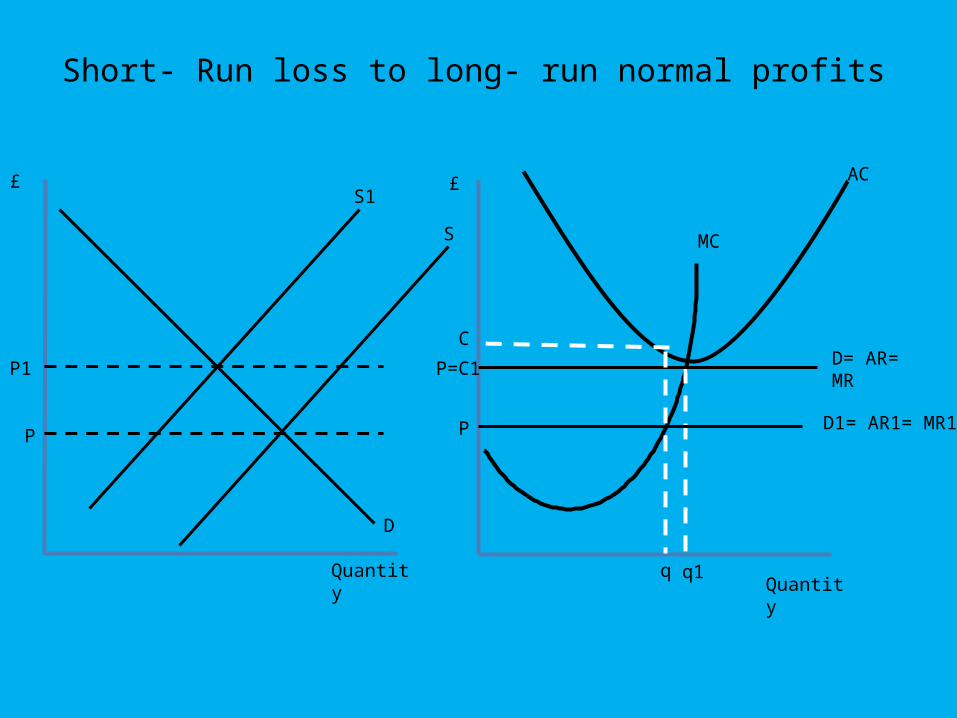
If subnormal profits are being made in the short-
run…• When AC>AR • Can occur if demand falls or costs rise• Some firms will leave the industry, some will
remain• Recall the shut down price…• Those who are receiving a price equal to or above
their AVC will remain open, those who are not will shut down
• Note: It is usually assumed that firms have identical cost curves, however this is not very realistic…

Marginal Firms
• Those with the highest costs• The firms who are first to leave an
industry when subnormal profit is being made and the last to enter when supernormal profits are made

Activity
• Illustrate the movement from short- run loss to long run normal profits in perfect competition
£
Quantity
MC
D= AR= MR
P=C1
q1
AC
C
D1= AR1= MR1
P
S1
S
P1
P
q
£
Quantity
D
Short- Run loss to long- run normal profits
£
Quantity
MC AC
D= AR= MRP
S
P
q
£
Quantity
D
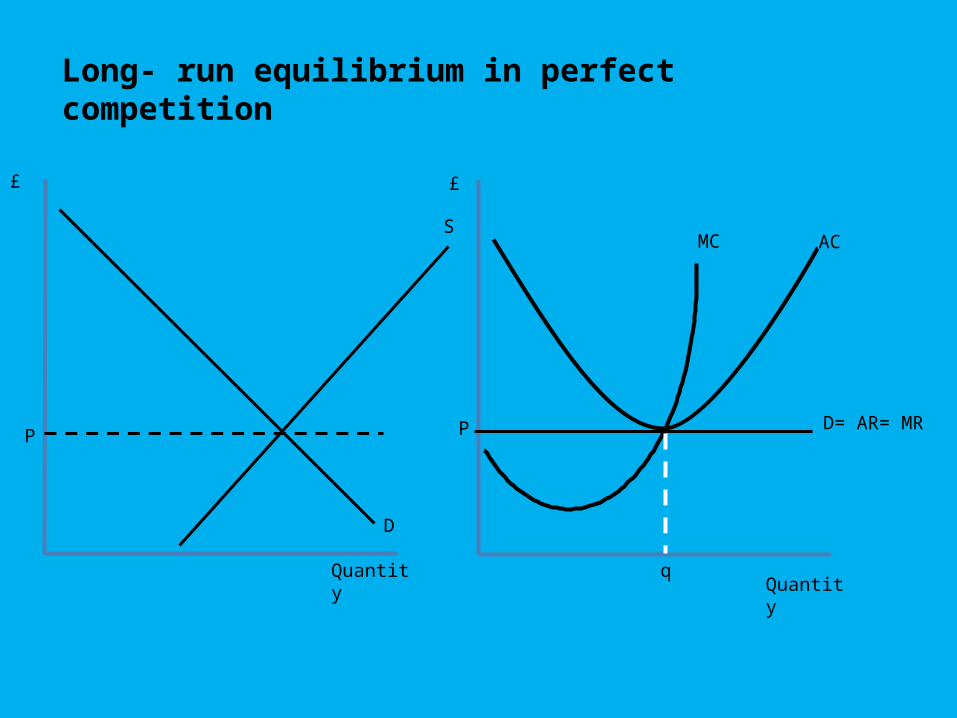
Long- run equilibrium in perfect competition
• In theory, perfect competition produces a long- run equilibrium where all firms earn only normal profits and produce at minimum cost

Productive Efficiency in Perfect Competition
• A firm is productively efficient if it produces at it lowest possible average cost (the lowest point on its lowest possible AC curve)
• As MC always cuts AC at its lowest we can say that where MC=AC is the productively efficient output level

Allocative Efficiency in Perfect Competition
• Socially optimum level of output• When there is no excess supply or
demand• What is demanded is being produced• Note. Does not necessarily mean that
there is a ‘fair’/ equal distribution of income.

• Allocative Efficiency occurs where MC= AR i.e. The cost of producing an extra unit is
equal to the value placed on a unit
• P reflects the value consumers place on a good shown by D (AR) curve.
• MC reflects the cost to society of all the resources used in producing an extra unit of the good, incl. the normal profit.
• Recall: Assumption of perfect information
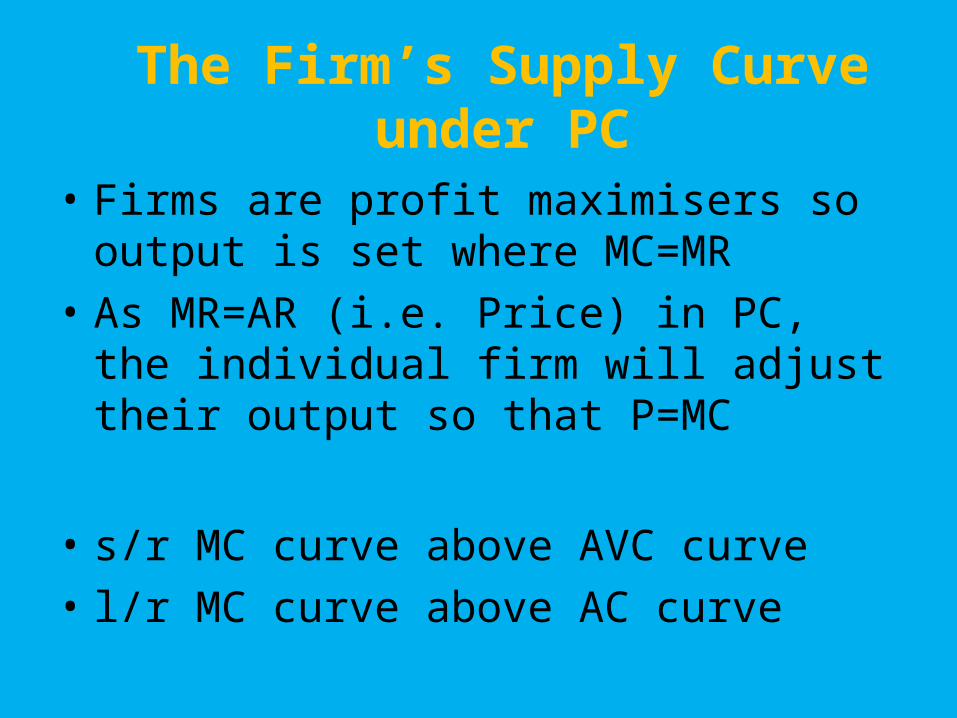
The Firm’s Supply Curve under PC
• Firms are profit maximisers so output is set where MC=MR
• As MR=AR (i.e. Price) in PC, the individual firm will adjust their output so that P=MC
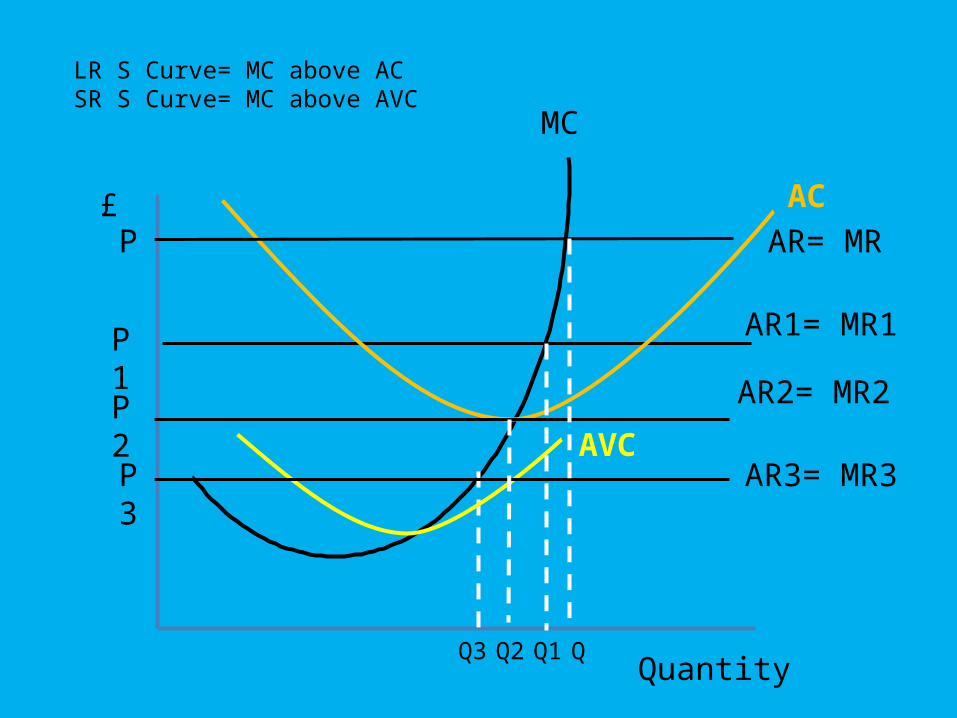
• s/r MC curve above AVC curve• l/r MC curve above AC curve
£
Quantity
MC
AR= MR
P3
AC
AVC
AR1= MR1
AR2= MR2
AR3= MR3
P1P2
P
Q3Q2Q1Q
LR S Curve= MC above ACSR S Curve= MC above AVC

When there is perfect competition…
• Fierce competition ensures that costs are minimised and that resources are used sparingly
• Inefficient firms will be driven out of the market; only those with the lowest costs will survive
• Prices will be pushed downwards
• It ensures that consumer sovereignty prevails – firms become price takers

Activities on Perfect Competition
• WS7• Data Response