quiz nader vs. political science “ on five key votes, the top five recipients of banking money...
TRANSCRIPT

Quiz• Nader vs. Political Science• “ On five key votes, the top five recipients of banking money
received over $190,000 in contributions and voted against banking interests only 24% of the time…the five lawmakers who received the least banking PAC money received on average $34,000 and voted against banking interests 76% of the time.” (Paraphrase, Sorauf)
• Mobilization of bias—interest group efforts, campaign contributions increase EFFORT by those who already agree with them
• Free votes—interest groups more likely to be influential when constituents don’t care about a vote.

Interest Group Coalitions

If you were the leader of an interest group, would you work with other
groups?
• With whom?
• Under what circumstances?
• Why?
• Would your coalitional strategy differ when you are trying to get a bill passed vs. when you are trying to get sympathetic officials elected? Why or why not?

Interest Group Coalitions
• Broadly defined advocacy coalitions—those that work together across institutional contexts
• Active coalitions—high costs; those that require affirmative action of each group that is a member of the coalition
• Passive coalitions—low costs; those that only require groups to be on the same side of an issue

Research on issue coalitions
• Groups will work in coalitions if – it improves their reputation– It is low cost
• Coalitions can impose diverse workload burdens on members– Just contribute name– Form close associations of interlocking boards– Core members supply bulk of lobbying and
coordination efforts
• Generally in any given policy area, a “hollow core”

Electoral networks
• Primary endorsements come from groups that:– Choose to be involved in elections– Take sides between the parties– Want to gain influence over partisan elected
officials

All National Interest Group Endorsements
0%
10%
20%
30%
40%
50%
60%
70%
80%
90%
100%
Democrats Republicans
Identity
Issue
Prof. Assn.
Union
Corporate
Distribution of Endorsements

Electoral networks
• Primary endorsements
• Republican issue groups: ideological and abortion groups
• Democratic issue groups: environmentalists, women’s groups

Network analysis
• How often does each group endorse the same candidate as each other group?
• How often are they on the same team?
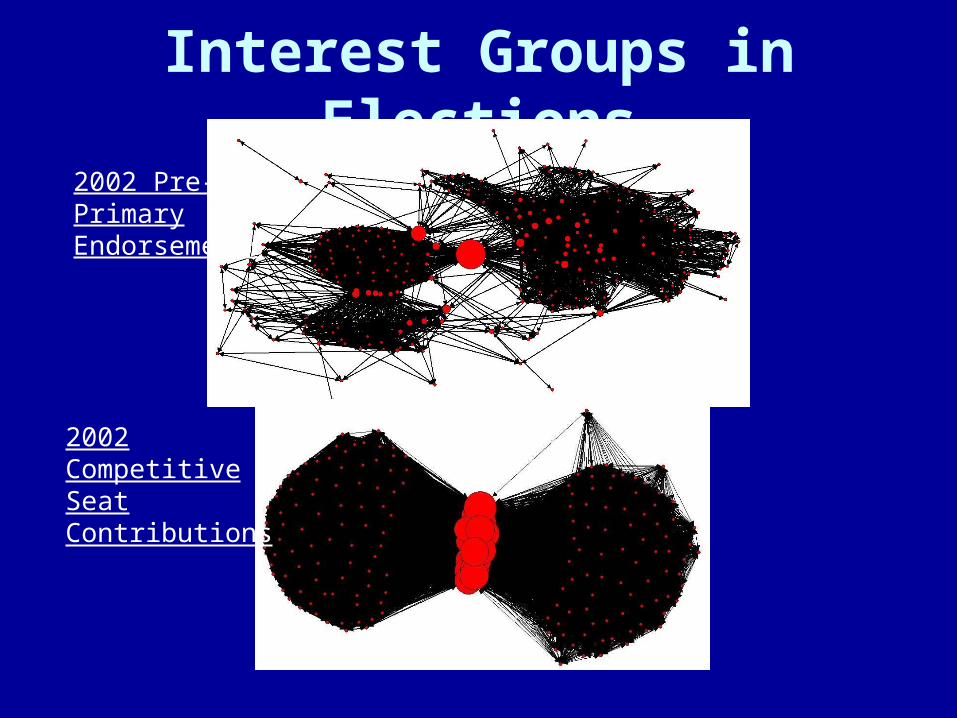
Interest Groups in Elections
2002 Pre-Primary Endorsements
2002 Competitive Seat Contributions

Width=# of ties, Size=betweenness centrality, Layout=spring embedding, Red=Republican, Blue=Democrat
Core of Electoral Network

Campaign Endorsements
Size Density Degree centrality
Between-ness
centrality
Central actors
Structure
Overall network
239 .19 7.3% 19.3% TeamstersPartisan divide
Democratic network
121 .21 14.10% 6.4% UnionsCore-
periphery
Republican network
118 .17 14.3% 13.1%Business, ideological
Core with conservative
faction

Electoral Networks: general election PAC contributions
• How often do different groups contribute to the same candidates?
• How often are they on the same team?

PAC network
Size Density Degree centrality
Between-ness
centrality
Central actors
Structure
Overall network
3,504 1.5 5.6% .9%Single issue
Partisan divide with
central actors
Democratic network
2,683 1.1 5.4% 1% UnionsCore-
periphery
Republican network
2,779 1.4 6.7% .5% BusinessCore-
periphery

Core of PAC Contribution Network
Width=# of ties, Size=betweenness centrality, Layout=spring embedding; Dichotomous links established with 85 shared ties or more

Legislative network
• Members get up to announce thank yous to groups that have helped to work on a piece of legislation.
• How often are groups mentioned as being part of the same legislative effort?
• How often are they on the same team?

Legislative Data
• 319 legislative coalitions of national interest
groups announced in the Congressional Record,
1999-2002
• From initial list of organizations that endorse
legislation; snowball sample for organizational
names
• Affiliation networks, with ties based on number
of shared legislative coalitions

Coalitions & Bill Success
0
10
20
30
40
50
60
70
80
Passed 1 Chamber No Vote Failed
Pro
Con

Legislative Coalitions by Topic
0
10
20
30
40
50
60
Health
Civil Rig
hts & L
iber
ties
Gover
nmen
t Ope
ratio
ns
Banking
and
Com
mer
ce
Law, C
rime, &
Fam
ily
Educ
ation
Enviro
nmen
t
Labo
r & Im
mig
ratio
n
Social W
elfa
re
Mac
roec
onom
ics
Defen
se
Agricul
ture
Intn
'l Affai
rs &
Trad
e
Other

Groups in Legislative DebateLegislative Coalitions Announced in Congress: 1999-2002

Core of Legislative Network

Legislative coalitions
Size Density Degree centrality
Between-ness
centrality
Central actors
Structure
Overall network
2,562 .08 6.2% 1.9%
Business, unions, health,
religious
Core-periphery, bipartisan
Democratic network
1,738 .12 4.7% 3.7%
Unions, women’s,
single-issue
Core-periphery
Republican network
1,621 .06 10.4% 2.8%Business,
healthCore-
periphery

Combined networks

Electoral & Legislative Network
Green Ties = Legislative Ties, Blue Ties = Electoral Ties, Blue Nodes = Democratic, Red Nodes = Republican

Conclusions• The Extended Party Organization:
Different in Elections and Legislative
Debate
Party Differences - No Match to
Stereotypes
• Signaling in Interest Group Coalitions:
Many Large Coalitions; Some Bipartisan
• Legislative Polarization:
Interest Groups - Not Polarized
Most central actors are partisan—what
does that mean?