"grad school disstheses" - louisiana state university research
TRANSCRIPT

Louisiana State UniversityLSU Digital Commons
LSU Historical Dissertations and Theses Graduate School
1971
Some Factors Associated With the Homemaker'sComprehension, Eating Practices and AttitudesToward Foods and Nutrition.Samira Ahmed youssef KandilLouisiana State University and Agricultural & Mechanical College
Follow this and additional works at: https://digitalcommons.lsu.edu/gradschool_disstheses
This Dissertation is brought to you for free and open access by the Graduate School at LSU Digital Commons. It has been accepted for inclusion inLSU Historical Dissertations and Theses by an authorized administrator of LSU Digital Commons. For more information, please [email protected].
Recommended CitationKandil, Samira Ahmed youssef, "Some Factors Associated With the Homemaker's Comprehension, Eating Practices and AttitudesToward Foods and Nutrition." (1971). LSU Historical Dissertations and Theses. 2136.https://digitalcommons.lsu.edu/gradschool_disstheses/2136

SOME FACTORS ASSOCIATED WITH THE HOMEMAKER'S COMPREHENSION, EATING PRACTICES AND ATTITUDES TOWARD
FOODS AND NUTRITION
A Dissertation
Submitted to the Graduate Faculty of the Louisiana State University and
Agricultural and Mechanical College in partial fulfillment of the
requirements for the degree of Doctor of Education
in
The Department of Extension Education
bySamira Aluned Youssef Kandil B.S., Cairo University, 1963
Postgraduate Diploma in Home Economics Related to Conmuui.ty Development
London University, 1966 M.Pbil., London University, 1969
December, .1.971

PLEASE NOTE:f
Some pages may have indistinct print.Filmed as received.
U ni ve r si t y Microfilms, A Xerox Education Company
ACKNOWLEDGEMENT
The author wishes to express her sincere gratitude to
Dr. Edward W. Gassie, Specialist (Training) and Professor of
Extension Education, and Chairman of her graduate committee, for
his counsel, guidance and encouragement in all phases of this
study.
The author would like tp express her deep appreciation to
Dr. J. H. Jones, Jr., Program Analyst and Professor of Sociology;
Dr. Lynn L. Pesson, Specialist (Extension Education) and Professor
and Head, Department of Extension and International Education;
Dr. Bruce Flint, Specialist (Extension Education) and Professor of
Extension Education; Dr. Alma B. Clark, Director, School of Home
Economics; and Dr. Betty Jane Hodgkins, Assistant State Agent,
Home Economics, Cooperative Extension Service, for their helpful
suggestions and comments.
The author is grateful to Dr. Barton Farthing, Professor and
Head of the Department of Experimental Statistics, for his statis
tical help and advice in analyzing the data.
The author is also grateful to Mrs. Irene Turner, Nutrition
Specialist, Cooperative Extension Service, for her helpful suggestions,
Mr. Kingston E. Eversull, Assistant Director, Married Student Housing,
for his effort in making the interviews easier, and to the homemakers who
participated in this study for their warm reception, cooperation, and hospitality.
ii

Deep appreciation is expressed to Mrs. Alice S. Murphy for
editing this dissertation and to Miss Rita Marcliand for typing it.
The author is grateful to the Food and Agriculture Organ
ization of the United Nations, the United Nations Children's Fund,
and the P.E.O. International Peace Scholarship Funds for grants
which enabled this work to be done, and to Cairo University for
the granting of her study leave.
The author wishes to express her deep appreciation to her
husband, Adel A.S.M. llassan, for his encouragement, understanding,
cooperation and support, and also for his help in the statistical
analysis of the data through the computer.
i'ii

TABLE OF CONTENTS
CHAPTER PAGE
Acknowledgement ............................... ii
List of Tables ......................... vi
Abstract ...................... x
I. Introduction , ........ 1
Statement of the Problem ............................ 2Purpose of the Study . ...... 3Delimitation of the Study .................. '........ 3Major Concepts and Definitions ..................... <.. 3
II. Review of Related Literature ..................... 5
Knowledge and Eating Practices ..................... 5Attitudes .......................................... . 11The Interrelationship Between Comprehension, Eating
Practices and Attitudes .................... 16
III. Research Design ................ 19
Objectives of the Study ............................. 19Null Hypotheses ..... 20Selection of the Sample ............................. 21Design of Interview Schedule ........................ 22Collection of Data ...................... 23Methods of Processing and Data Analysis ............. 24
IV. Analysis and Interpretation of Data ..................... 27
Comprehension ....................................... 30Eating Practices ............... •.................... 53Attitudes .................................... 69The Correlation Between Comprehension, Eating
Practices, and Attitudes ..... 91Sources of Nutritional Knowledge, the Homemakers'
Interests, and the Practical Methods for Nutrition Education ......................................... 98
iv

CHAPTER PAGE
V. Summary ................................. ............... 110
Conclusions ......................................... 129
Implications . ........ 131
Preferences ............................................. 132
Appendix ....... 135
Vita ............................. 141
v

lGE
29
33
34
36
37
39
41
42
43
44
45
LIST OF TABLES
Model and Table of Least-Squares Analysis of Variance Used in the Experimental Analysis ........... ...........
A Comparison of Homemakers By Level of Comprehension of Some Basic Elements in Human Nutrition According to Their Scorc-s in the Different Food Groups, Louisiana,1971 ............... ....................................
A Comparison of Homemakers According to the Ability to State the Daily Servings of Each of the Four Food Groups, Louisiana, 1971 ...........................
A Comparison of Homemakers By Level of Comprehension of Some Basic Elements in Human Nutrition According to' Number of Children, Louisiana, 197]......................
Least-Squares Analysis of Variance, with Unequal Subclasses: Comprehension of Some Basic Elements inHuman Nutrition and the Daily Recommended Servings of Foods ..............................................
A Comparison of Homemakers By Level of Comprehension of Some Basic Elements in Human Nutrition According to Age of Children, Louisiana, 1971 .......................
A Comparison of Homemakers By Level of Comprehension of Some Basic Elements in Human Nutrition According to Annual Family Income, Louisiana, 1971 ..................
Correlation Coefficient Between Homemaker's Comprehension and Thirteen Independent Variables .....................
A Comparison of Homemakers By Level' of Comprehension of Some Basic Elements in Human Nutrition According to Monthly Food Expenses, Louisiana, 1971 .................
A Comparison of Homemakers By Level of Comprehension of Some Basic Elements in Human Nutrition According to Their Age, Louisiana, 1971 ...........................
A Comparison of Homemakers By Level of Comprehension of Some Basic Elements in Human Nutrition According to Level of Education, Louisiana, 1971 ....................
vi

TABLE PAGE
XIX. A Comparison of Homemakers By Level of Comprehension of Some Basic Elements in Human Nutrition According to School Attendance, Louisiana, 1971 ................... 47
XIII. A Comparison of Homemakers By Level of Comprehension of Some Basic Elements in Human Nutrition, According to Formal Home Economic Education, Louisiana, 1971 ....... 48
XIV. A Comparison of Homemakers By Level of Comprehension of Some Basic Elements in Human Nutrition According to Employment Status, Louisiana, 1971 ..... 49
XV. A Comparison of Homemakers By Level of Comprehension of Some Basic Elements in Human Nutrition According to Former Participation in 4-11 and Home Demonstration Clubs, Louisiana, 1971 ............... 51
XVI. A Comparison of Homemakers By Level of Comprehension of Some Basic Elements in Human Nutrition According to Original Place of Residence, Louisiana, 1971 ..... 53
XVII. A Comparison of Homemakers By Level of Comprehension of Some Basic Elements in Human Nutrition According to Eating Practices, Louisiana, 1971 .................... 55
XVIII. Least-Squares Analysis of Variance, with Unequal Subclasses: Milk Consuming Practices .................... 57
XIX. Correlation Coefficient Between Homemaker's EatingPractices and Thirteen Independent Variables ......... 58
XX. Least-Squares Analysis of Variance, with Unequal Subclasses: Meat Eating Practices ...................... 60
XXI. Least-Squares Analysis of Variance, with Unequal Subclasses: Vegetable-Fruit Eating Practices ........... 64
XXII. Least-Squares Analysis of Variance, with Unequal Subclasses: Bread-Cereal Eating Practices ............... 67
XXIII. A Comparison of Homemakers By Level of Comprehension of Some Basic Elements in Human Nutrition According to Food Avoidance, Louisiana, 1971 ...................... 68
XXIV. A Comparison of Homemakers By Level of Comparison of Some Basic Elements in Human Nutrition According to Reasons for Food Avoidance, Louisiana, 1971 ......... 71
vii

TABLE PAGE
XXV. A Comparison of Homemakers By Level of Comprehension of Some Basic Elements in Human Nutrition According to Intensity of Attitudes Toward Foods, Louisiana,1971 ....... 74
XXVI. Least-Squares Analysis of Variance, with UnequalSubclasses: Attitudes: Personal Preference, FamilyPreference, Convenience, Economic, and Health ........ 78
XXVII. Correlation Coefficient Between Homemaker's AttitudesToward Foods and Thirteen Independeitt Variables ..... 80
XXVIII. Least-Squares Analysis of Variance, with Unequal Subclasses: Attitudes: Special Occasion, Habit andHappen to Have the Food ........ 86
XXIX. Least-Squares Analysis of Variance, with Unequal Subclasses: Attitudes: Weight Control, Dieting, and•Weather ....... 90
XXX. Correlation Coefficient Between Homemaker's Comprehension and Eating Practices ................. 93
XXXI. Correlation Coefficient Between Homemaker's Comprehension and Attitudes ........ 94
XXXII. Correlation Coefficient Between Homemaker's EatingPractices and Attitudes... ... 96
XXXIII. A Comparison of Homemakers By Level of Comprehension of Some Basic Elements in Human Nutrition According to Source of Learned Nutritional Knowledge,Louisiana, 1973....................................... 102
XXXIV. A Comparison of Homemakers By Level of Comprehension of Some Basic Elements in Human Nutrition According to Participation in Nutrition Program and the Best Time for Conducting It, Louisiana, 1971 ........ 104
XXXV. A Comparison of Homemakers By Level of Comprehension of Some Basic Elements in Human Nutrition According to Degree of Interest of: Gaining More Knowledge About Nutritional Problems, Louisiana, 1971 .......... 105
viii

TABLE PAGE
XXXVI. A Comparison of Homemakers By Level of Comprehension.of Some Basic Elements in Human Nutrition According to Degree of Interest in Ten Nutritional and Food Problems , Louisiana, 1971 . .................. 106
XXXVII. A Comparison of the Practicality of Giving Information to the Homemakers, Louisiana, 1971 ...... 108
XXXVIII. Homemaker's Contact with Cooperative ExtensionService, Louisiana, 1971 .......................... 109
ix
ABSTRACT
The purpose of this study was to assess the homemakers1
comprehension of some basic elements in human nutrition, to determine
their eating practices, and to measure the intensity of attitudes
toward foods. These variables were further examined to see the
interrelationship between them and the factors that affect and associate
' with each of the independent variables.>t" *
A hundred homemakers, selected at random from the list of
American students residing at the married students* quarters at
Louisiana State University campus, were interviewed.
The answers to comprehension questions were graded; the scores
were placed on a scale of three levels. A twenty-four hour food
recall was used concerning their eating practices. The recommended
minimum daily servings was used to determine the diet adequacy. A
scale of three .points was used to determine the intensity of eleven
attitudes.
These scores, as well as numerical codes for thirteen independent
variables, were punched into cards and fed to the computer for
statistical analysis. Frequency distributions were run, and an
analysis of variance was made to determine the affect of the thirteen
independent variables on each of the dependent variables. Correlation
coefficients were determined to see the factors that are associated
x

with the three dependent variables.
On the whole, the homemakers had low comprehension of basic
elements in- human nutrition. Their diets were not adequate with
regard to meeting the minimum daily servings of foods. The strong
attitudes that influenced them in choosing the foods were personal
and family preference, health, convenience, and economic reasons.
Formal or informal education, income per year and food expense
per month, age of the homemaker and employment status, as well as
the homemakers' backgrounds were found to affect and associate
with the three dependent variables at different levels of signifi
cance.
A strong interrelationship was found between comprehension,
eating practices, and attitudes.
It was concluded from the results of the study that nutrition
education programs can help the homemakers establish sound
nutritional practices through upper cognitive and affective goals.
xi

CHAPTER I
INTRODUCTION
The United States of America has an agricultural system which
produces more food than the population needs. The private food market
system is well developed and effective in distributing food products
throughout the nation, and this facilitates the people's consumption
and enjoyment of a better diet than the people of many other countries
( 16) .
In the past few years, a malnutrition problem has been recognised
among many Americans. Various food assistance programs have been
offered to the people. Research results show that the problem is not
always lack of money (12). People's knowledge, attitude, and culture
affect their choice of food and eating practices (23).
The malnutrition problem is a product of lack of knowledge of foods
and nutrition which might be affected by people's culture and attitudc-.s
toward foods. Since food habits are acquired during childhood and the
family establishes its food patterns in the early years of marriage,
the homemaker plays an important role in feeding, teaching and forming
sound nutritional practices among the family members, Goble (20) stated
that:
"Young homemakers need help in making connections between available knowledge and the problems of everyday living.Such connections can he made more effective through programs designed to deal with specific problems of young families, rather than general approaches from which the learner must adapt information."
1

Malnutrition, due to lack of basic information as to what foods
are needed for good growth, development, and health, occurs to a
significant extent in all segments and at all socio-economic levels
in America (16).
Despite many attempts, success has been limited in informing the
public about foods and nutrition in terms they can understand, accept
and use in their daily lives. The White House Conference on Food,
Nutrition and Health recommended that "an expanded and intensified•r '
public education campaign in nutrition be mounted by government and the
private sector." *
An effective nutrition education program should be based on meeting
the needs of the people who are to participate. It should also start
within the existing food practices and knowledge of the group, then
progress toward, action for improvements (11).
Statement of the Problem
Despite the abundance of food and agricultural wealth of the United
States of America, there is a malnutrition problem at all ages and at
all socio-economic levels in the nation. Lack of knowledge, culture and
attitudes toward food might contribute, to a great extent, to the pro
blem of malnutrition. Since food patterns are acquired during childhood,
the homemaker influences greatly the nutritional practices among the
family members, especially the youngsters. Teaching nutrition to young
homemakers should improve the diet, and health of all family members (7).
All studies reviewed dealt with level of knowledge and practices of
the homemakers. In this study, it is intended to go beyond the level of

3
knowledge or recall to the comprehension level. Are the homemakers
fully aware and do they understand the basic concepts in human nutrition?
What are their attitudes toward the food they eat? What are their
eating practices? The literature indicated strong interrelationship
between the attitude, knowledge, and application. It is planned in
this study to investigate the relationship between these three factors.
Purpose of the Study
The purpose of this study was to assess the homemaker's compre
hension of some elements in human nutrition, to determine her eating■f
practices, and the strength or intensity of her attitudes toward foods.
The study was planned to investigate the factors that are associated
with comprehension, attitudes, and eating practices and the interrelation
ship between them.
Delimitation of the Study
This study was limited to the American homemakers who were living
in the Louisiana State University Married Student Housing apartments
on Nicholson Drive during the summer of 1971.
Major Concepts and Definitions
Comprehension - "Comprehension represents the lowest level of understanding. It refers to a type of understanding or apprehension such that the individual knows what is being communicated and can make use of the material or idea being communicated without necessarily relating it to other material or seeing its fullest implications (2)."
Attitudes - For the purpose of this study, attitudes are defined
as learned predispositions which influence or govern the way the person
feels, thinks, reacts, and behaves towards things, issues, and people

in his environment.
Strength or Intensity of Attitudes - Refers to the degree of
conviction with which an attitude is held by an individual. It indicates
the extent to which attitude can become basis for action (9).
Eating Practices - For the purpose of this study, Eating
Practices is defined as the eating pattern of the individual.
CHAPTER IX
REVIEW OF RELATED LITERATURE
Knowledge and Eating Practices
Research findings on nutrition, health, and learning indicate that
hunger and malnutrition can hinder the physical growth and impair the
mental development of children. The period during which a child's
brain grows most rapidly is from three months before birth to about
three years of age. Nutrition's most crucial influence on potentiali*
mental development is during this period (15).
The 1965 Household Food Consumption Survey of food intake and
nutritive value of family diets in the United States showed a drop in
the quality of diets compared with the 1955 survey. There was an in
crease in the consumption of snack foods, including bakery products,
beverages, soup, and nuts. There was a drop in the consumption of
milk and its products, vegetables and fruits, and carbohydrate foods
(13, 14). It also showed"that a large percentage of families failed
to meet the Recommended Allowances, as well as decreasing nutrient
intake in 1965 as compared with 1955.
The final report of the White House Conference on Food, Nutrition
and Health indicates that two characteristics have been developed in
the American society:
1. "Over-consumption of calories with food choices that are
not necessarily the wisest on the basis of available
nutritional information."
5
2. "Underexercising and failure to develop life-long habits to
combat the ills of a sedentary life."
It was recommended that "an expanded and intensified public education
campaign in nutrition be mounted by government and the private sector
(16) ."
Although the first requirement for good nutrition is an adequate in
come, .the lack of knowledge, cultural practices, and attitudes toward
foods prevent many from achieving sound nutrition. One of the re
sponsibilities of every homemaker is to see that her family members
: have enough knowledge that will make it easy for them to make wise
decisions about their food choices wherever they may be. Nutrition
education for the homemaker should result in better diets for the
family and the establishment of sound nutritional practices and attitudes
toward foods and nutrition for the children (22).
Findings from the Louisiana Nutrition Survey of 1968-70 indicate
that those inte'rviewed frequently followed rather haphazard meal patterns.
In general, they had no breakfast, inconsistent lunches and high starch
dinners. Results also showed that about 45 percent of the children
under 17 years old did not have enough vitamin A in their diets. In
adequate vitamin C intake was common in persons over age 17. There was
also evidence of poor dental health, and growth retardation in children.
Results indicated that the adolescents in Louisiana have inadequate dietary
intake and that iron deficiency anemia is a major problem in most segments
of the population surveyed (17, 21).

In 1956, Young et. al. (25) dicl a four-part study on the nutritional
knowledge and needs of the homemakers. Knowledge was determined by the
number of food groups for which the homemaker could give a nutritionally
correct reason for including in the diet of her family, as well as the
ability to name satisfactory substitutes for some foods. Results of
the first part of the study showed that only 20 to 30 percent of the
sample planned their meals on. the basis of some nutritional knowledge.
The second part of the same study was done on the level of nutritional
knowledge in the sample. Lack of knowledge was found relative to the
fruits and vegetable group in general, and vitamin C and A rich foods
in particular. Adults did not get enough milk, and they also had low
knowledge about bread and cereal groups, as well as butter and fortified
margarine (26).
The most important factor that affected nutritional knowledge was
formal education. As expected, homemakers who had had studies related
to foods and nutrition had a better level of knowledge than those who
did not. Age and income were related to level of knowledge. The young
homemakers and higher income groups had a better understanding of nutrition.
It should be noted that in this study 40 years and under referred to
young homemakers (27).
The homemaker's food practices were better than her knowledge of
nutrition. They included foods in their diets which they were not able
to give reasons for choosing. The least well-known foods were green,
leafy or yellow vegetables, citrus fruits, tomatoes and cabbage group,
and milk group. The higher educational level of the homemaker was

related to adequate diet and level of knowledge (27).
The last part of this study dealt with the homemaker's problems,
shopping habits, and sources of information. The most common food
problems which homemakers wanted help were meal-planning and budgeting.
Magazines and newspapers were common sources of nutritional infor
mation (28).
A study was done on 80 young homemakers, wives of students residing
on the southwest Louisiana State University campus in Baton Rouge. The./•
purpose of the study was to compare, by knowledge of nutrition, the
extent to which the homemaker carried out good nutrition practices in
the daily consumption of foods in six food groups. The study also in
vestigated the problems and needs of the homemaker in feeding her family.
Results of this study showed that many of the homemakers did not put
into practice as much as they already knew. However, there was a positive
association between better food habits and more knowledge of nutrition.
Diets consumed were below the Recommended Daily Allowances of all foods, and
were generally below the levels which the homemaker had indicated as
daily food requirements for the individual. Consumption of milk, vitamin A,
and vitamin C rich foods was low. Lack of time was indicated as a limiting
factor of the homemaker in the better feeding of the family. Information
on menu planning, stretching the food dollar, wise shopping for food, and
planning time saving meals was desired by the homemakers. The study showed
that there was no one method that seemed to be most practical for reaching
this audience (30).
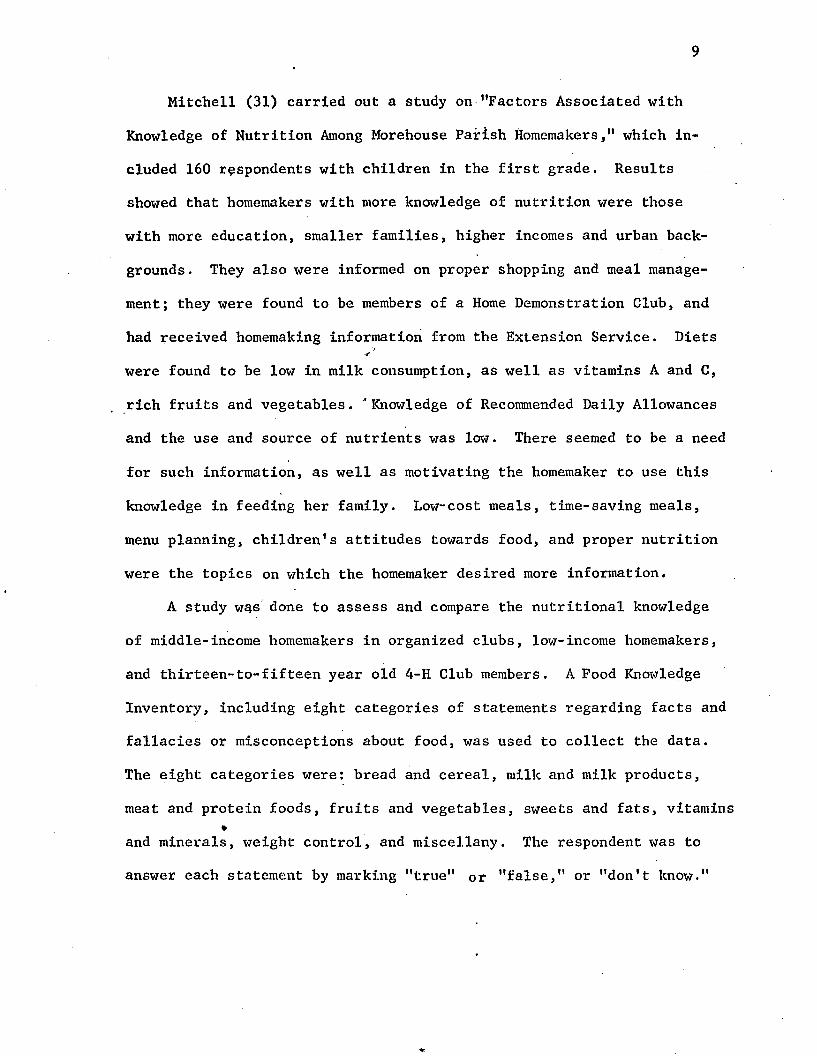
Mitchell (31) carried out a study on "Factors Associated with
Knowledge of Nutrition Among Morehouse Parish Homemakers," which in
cluded 160 respondents with children in the first, grade. Results
showed that homemakers with more knowledge of nutrition were those
with more education, smaller families, higher incomes and urban back
grounds. They also were informed on proper shopping and meal manage
ment; they were found to be members of a Home Demonstration Club, and
had received homemaking information from the Extension Service. Diets
were found to be low in milk consumption, as well as vitamins A and C,
rich fruits and vegetables. ‘ Knowledge of Recommended Daily Allowances
and the use and source of nutrients was low. There seemed to be a need
for such information, as well as motivating the homemaker to use this
knowledge in feeding her family. Low-cost meals, time-saving meals,
menu planning, children's attitudes towards food, and proper nutrition
were the topics on which the homemaker desired more information.
A study w$s done to assess and compare the nutritional knowledge
of middle-income homemakers in organized clubs, low-income homemakers,
and thirteen-to-fifteen year old 4-H Club members. A Food Knowledge
Inventory, including eight categories of statements regarding facts and
fallacies or misconceptions about food, was used to collect the data.
The eight categories were: bread and cereal, milk and milk products,
meat and protein foods, fruits and vegetables, sweets and fats, vitamins *
and minerals, weight control, and miscellany. The respondent was to
answer each statement by marking "true" or "false," or "don't know."

10
Results showed that middle-income homemakers were better able to
differentiate between food facts and fallacies than the low-income
homemakers and youth. The level of knowledge of the 4-H youths with
regard to nutrition information was similar to that of the low-income
homemaker. The author of this study recommended that nutrition educ
ation should be improved to provide understanding of the basics of
nutrition and the formation of food habits (24).
A study was done to determine the changes in nutrition knowledge
and food habits of a selected group of homemakers who participated in■J*
■ an Expanded Nutrition Educational Program in three Northeast Louisiana
parishes. The changes were measured through interviewing the homemakers
at three intervals; before she had received any training in nutrition,
immediately after completion of the eight weeks of training, and four
months later. Information was obtained on a 24-hour period food recall
and named certain foods as necessary for good health. Seventy-one
homemakers were included in each of the first and second interviews,
and 120 for the third. Results indicated significant changes in the
homemakers' knowledge of nutrition and their increased consumption of
various foods. There was a great change immediately after completion
of the eight-weeks' training; increased consumption of foods from the
four food groups, consuming an adequate diet, and better knowledge of
foods needed for good health. In general, regression in knowledge of
nutrition and food consumption was noticed four months after the com
pletion of the program (32).

Brew (29) conducted a study to determine the relationship between
income and the homemaker's knowledge and practice of good nutrition
in two parishes in Louisiana. Significant differences were found in
the food and nutrition practices of the two groups included in the
study, upper and lower income homemakers. The greatest difference was
found in the consumption of fruits and vegetables. The upper income
group had more servings of this food group than did the lower income
group. There were slight differences between the two groups with regard•r '
to milk and meat consumption. The lower income group consumed more
, servings of bread and cereal than the upper income group. There was
lack of knowledge of the recommended servings of the vegetables and
fruits, bread and cereal, and milk groups. The percentage
of homemakers knowing what to eat was greater than the percentage of
those who put into practice this knowledge. However, the homemakers
in the upper income were more knowledgeable than the lower income group
with regard to -the necessity of foods for maintaining good health. This
study showed the need for more education for the total society with
regard to the application of nutritional knowledge. Knowing the subject
does not mean that the people will apply the knowledge to their real
life situation. '
Attitudes
Definition - Bird (1) defines Attitudes as "pre-dispositions towards
issues, institutions, or people. As such, attitudes are inferred from,
or are best known to us through verbal responses as opinions." Attitudes

12
in human beings refer to the ways in which a person thinks and feels
about things in his environment. The range of attitudes is unlimited:
What does one think of the food he eats or of the place he lives in?
How does he react to a piece of music or to his neighbor? When all
our thoughts and beliefs, feelings and tendencies to react to any event
in our environment become organized in a manner which is stable and
persists consistently, an attitude takes shape and is often reflected
in our behavior. Observing behaviors leads one to make inferences•r '
about attitudes from which particular behaviors arise.
Attitudes are formed as* the individual adjusts to the social
environments. They are not sharply differentiated in their early
stages; they are all favorable or unfavorable. Favorable represent
undifferentiated "good" and unfavorable represent undifferentiated "bad"
which has to be avoided. Attitudes become distinct and specific from
one another by differentiation and integration. For example, an in
dividual might .have favorable attitudes toward meat, coffee, and cereal.
This may be differentiated as palatability of the meat, refreshing effect
of the coffee, and the convenience of the cereal.
Components and Development of Attitudes
Attitudes have three components: feelings, reaction and tendencies,
and thoughts and beliefs. They are learned by the principles of associ
ation, transfer and need satisfaction. For example, the individual
learns to fear and avoid things or people associated with unpleasant
happenings, and to like and approach those associated with pleasurable
happenings. Avoiding in the first case and approaching in the second,

13
satisfy basic needs of pleasure and comfort. Need satisfaction is
usually involved when attitudes are learned by transfer. Such needs
are pleasurer comfort, recognition, prestige, and hunger.
Modification of Attitudes
Once attitudes have developed and become part of the personality,
it is very difficult to modify or change them. Thought-belief components
of attitudes might be altered but not the feelings, and reaction tendencies.
Therefore, attitudes might change to their former state. It seems that
it would be very difficult to change attitudes which have been learned
early in life by association and transfer, if they help satisfy basic
needs, and if they have been integrated into ones personality and
pattern of behavior.
To bring about change in the people’s attitudes, we must use techniques
which facilitate learning. Various methods of communications should be
used such as: mass media, group, and person-to-person teaching.
New attitude components are learned by the same three principles;
that is, association, transfer, and need satisfaction. Therefore, group
and person-to-person teaching are more effective than other teaching
methods in transferring new attitudes. The personality of the educator
will influence the extent to which the clientele accept the new attitude.
The changing of attitudes is facilitated when the person feels the need
satisfaction; that is, when he feels that it is to his advantage to
adopt the new attitude.
Dimensions of Attitudes
Attitudes have five common dimensions:

1. Direction - refers to the positive or negative aspects of
attitude; that is, "for" or "against."
2. Degree - denotes the amount of favorableness or unfavorable
ness an attitude possesses (9).
3* Strength or intensity - refers to the degree of conviction with
which an attitude is held by an individual. It indicates the
extent to which an attitude can become the basis for action
(9). This dimension of attitude is very important, and it
should be considered when a new idea is presented to the clientele.
4* Salience - is related to intensity. It is concerned with the
centrality the attitude has within the individual as well as
the spontaneity with which it is manifested.
5. Coherence or consistency - is the ordering of attitudes, how
the individual maintains his attitude under different situations
(9).
Measuring Attitudes
Attitude scales are the most important instruments in measuring
attitudes. They are characterized by their adaptability to measure one
or more of the dimensions of attitudes.
Some properties of attitude scales are:
1. An attitude scale is used to assign a numerical value to an
object in terms of units defined in known ways of a certain
dimension. It indicates how favorable a person's attitudes
are, how intensely and how consistently the person holds them.
2. An attitude scale is composed of several items: phrases,

15
statements, or propositions. Respondents should indicate
their agreement or disagreement with each item.
3. Positions on the scale have to be in proper sequence and
should be consistent.
4. The scale should have equal intervals so that the inferences
about positions or dimensions of the attitudes are not
distorted by varying scores for the same positions.
5. The scale should be reliable; it should give consistent
results. This could be achieved by increasing the number
of items and testing it.
6. The scale should be valid; that is, it should measure what
it is supposed to measure. Validity can be established
by checking the item's content and. testing it.
There are several scales for measuring attitudes. They are used
mostly to place an individual at a specified point on a continuum
range from favorable to unfavorable attitudes. This is the Lilcert Scale.
The items on the Lilcert Scale are presented to respondents offering
the choice of five alternatives: strongly agree, agree, undecided, disagree,
and strongly disagree. The items included should be "for" and "against"
the issue that has to be measured. Neutral statements are not included.
The scale should be tested for validity and reliability.
The method of scoring is to give five points to the extremely
favorable statements, going down to one point for the extremely unfavorable
statements. For the ti*ue unfavorable statements the scores should be
reversed.

16
The final LikerI: score is determined by the difference between
the final scores for the favorable responses and the final score of
the unfavorable responses. That is: (number of favorable responses
X intensity of the response) -- (number of unfavorable responses X
intensity of the response). This score represents pooling of more than
one dimension of an attitude. It could be, for example, direction and
degree. Likert scores should be related to other people's scores and
positions on the continuum so that inferences can be made.
The Interre1ationsh1p Between Perception, Eating Practices and Attitudes
Educational Objectives are classified by Tyler (10) in.three
domains: cognitive, affective, and psychomotor. Bloom (2) et. al.,
classified the educational goals in the Cognitive Domain. According to
his taxonomy, it contains six major classes: Knowledge, Comprehension ,
Application, Analysis, Synthesis, and Evaluation. In the teaching
process, the educator carries the thinking of the learner from the
lowest level, which is knowledge or recall, to the higher levels in the
hierarchy of the different classes. The knowledge the learner gai.ns on
any subject matter might be at the level of any of these classes. In
Extension work we always aim and hope that the clientele will go in
his thinking beyond the level of Comprehension. In most cases we aim
at taking the learner through the Application level, so that he can put
into practice what has been recalled and comprehended. The learner will
continue using the new practice when he reaches the Evaluation stage and

17
finds it to his advantage.
Bloom also classifies educational objectives in the affective
domain (5). .He indicates that the attitude of the learner moves
through four stages: Awareness, Response, Commitment, and Internal
ization. It is at the Commitment stage when the learner is most
likely to decide to adopt the new idea or to put into practice and
thus apply what he knows and feels is best for him.
The preceding discussion shows the strong interrelationship between
the cognitive and affective objectives of education. The educator
should consider the Attitude 'of the learner before he can mo.ve him to
the Application stage. For a change or new practice to be adopted, ulti
mately the learner's attitude should be studied. It might need to be changed or modified before we introduce the new idea.
The homemaker plays an important role in the improvement of food
habits and nutritional status of her family. She has a large influence
on her family members' attitudes and choices of food. The Extension
Service should reach these homemakers to assure their participation in
improving food habits, eating practices, and attitudes toward foods.
This study was carried out to assess the homemaker's comprehension
of some basic elements in human nutrition, food practices, and attitudes
towards foods. Upon such information, needs and desires of the
clientele of the Extension Service could be determined in order to
offer them the help they need for improving the nutritional status
of their families.

All the studies referred to in this literature review dealt with
level of knowledge and practice of the homemakers. In this study, it
is intended to go beyond the level of knowledge or recall to the com
prehension level. Are the homemakers fully aware and do they under
stand the basic concepts in human nutrition? What are their attitudes
toward the food they eat? What are their eating practices? The
literature indicated strong interrelationship among the attitudes,
knowledge, and application. ^It is planned in this study to investigate
the relationship among these three factors.
CHAPTER III
RESEARCH DESIGN
Objectives of the Study
The objectives of this study were:
1. To assess the homemaker's comprehension of some elements
in human nutrition.
2. To determine the homemaker's eating practices.
3. To determine the homemaker's attitudes toward the food•f
eaten.
4. To test the factors that affect comprehension, eating
practices, and attitudes toward foods.
5. To determine whether or not there is a correlation between
comprehension, eating practices, and attitudes as dependent
variables and some other independent variables. These were:
homemaker's age, number of children, age of oldest child,
level of education, formal training in home economics,
family income per year, food expenses per month, place of
residence,.employment status, and whether the homemaker was
previously a 4-H Club member or involved in home demonstration
clubs.
6. To test the correlation between comprehension and eating
practices.
19

20
7. To test the correlation between comprehension and
attitudes.
8. To test the correlation between attitudes and eating
practices.
9. To investigate the homemaker's interest with regard to
some common nutritional problems and the best channels
to receive information on foods and nutrition.
Null Hypotheses ✓ '1. There is no difference between:
a. Homemaker's comprehension of basic elements in human
nutrition.
b. Homemaker's eating practices.
c. Homemaker's attitudes toward foods -- at the different
levels of the following variables:
1
2
3
4
5
67
8 9
1011
number of children.
age of oldest child.
participation in 4-H Club.
participation in Home Demonstration Club.
formal home economics training.
state of origin.
area (urban, rural, farm).
employment status.
level of education.
homemaker's age.attending L.S.U. at the time of conducting the study,

21
12) income per year.
13) food expenses per month.
2. There is no correlation between comprehension, eating
practices, and attitudes, and each of the previous mentioned
variables.
3. There is no correlation between comprehension and eating
practices.
4. There is no correlation between comprehension and attitudes.*1
5. There is no correlation between eating practices and attitudes.
Selection of the Sample *
The study was carried out with the wives of students residing
in married student housing of Louisiana State University in the summer
of 1971. In order to obtain a homogenous group, only the wives of the
American students living on Nicholson Drive were included in the study.
Such a group of homemakers should be homogenous with regard to age,
educational level, economical status, and social and cultural back
grounds .
A list of the names and countries of all the students living at
Louisiana State University married student housing was obtained from
the Assistant Director of Men's Housing at the University. The list
included 363 American families and the rest (77) were International
students. One hundred names were chosen at random from the list of
names of the American students.
22
Design of Interview Schedule
A personal interview schedule was used to collect data for this
study. It included questions to obtain the following information:
1. Homemaker's comprehension of basic elements in human nutrition.
This was carried out by asking the homemaker to respond to
several statements on basic nutritional knowledge. The
response had to be one of three choices: agree, undecided,
or disagree.
2. Homemaker's eating practices were obtained through the use•4
of a 24-hour recall of foods eaten.
3. The homemaker was asked to state to what extent she was
influenced by each of eleven reasons that might influence
people to have food for every food or drink she had in
the 24-hour period. Thus, the attitudes toward food could
be determined.
4. Common food and nutritional problems were included in the
schedule in order to find out the homemaker's needs and
interest in foods and nutrition.
5. The practicality of various methods of obtaining information
on foods and nutrition was obtained.
6. The schedule included questions on personal and family
characteristics. A copy of the interview schedule is in %the Appendix.
The interview schedule was pre-tested through interviewing six
homemakers who were chosen from the group under study. The pre-testing

23
resulted in making the following changes:
1. Rewording some of the statements .on foods and nutrition in
order to facilitate understanding by the interviewee.
2. Reconstructed the table for obtaining the 24-hour recall infor
mation, as well as reworded reasons for having such foods. This
simplified administering the interview.
3. Included additional factors affecting people's selection of
foods such as weight control, special diet, and weather.
4. Added some reasons for avoiding foods, such as contamination
and health problems, and weight control.
5. Reworded and added some questions to obtain information about
the interests, needs, and personal characteristics of the
interviewee.
The interview schedule was ready then to administer to the sample.
Collection of Data
The homemakers included in the sample were intereviewed by the
author. In order to facilitate her work, an introductory letter was
obtained from Mr. King Eversull, Assistant Director of Men's Housing,
concerning the interviewee and the purpose of the study. The letter
was to be shown to the homemaker at the interview. The assistant
director introduced the author to the four living counselors' wives living
in the community. He also mentioned the study and its purpose to several
homemakers.* This effort, as well as the introductory letter, facilitated
the interviewing and lessened the introduction made by the author to the

24
homemaker s .
Data was collected during May and June, 1971. The interviewing
was done on Tuesday through Fridays, since the homemaker was asked
to recall the foods and drinks she had had during the 24-hours
previous to the interview. It was necessary to meet the interviewee
at different times during the day and in the evenings since some of
them go to school or work outside their homes. The interviewee was
given a copy of the interview schedule to follow while the author
was reading the statements or asking the questions. This technique
facilitated and hastened the interview since the part on foods and
nutrition needed some thought before they could answer it. Each
interview lasted for about thirty minutes; it took a little longer
if there was some interruption from the children.
Methods of Processing and Data Analysis
The principles of the Likert-type scale were used in measuring the
comprehension • of basic elements of foods and nutrition, as well as
the attitudes toward foods eaten (1).
A number of statements relevant to general knowledge about foods
and the four food groups were presented to the homemaker by the author.
The interviewee indicated which of three possible answers she thought
was the right one--agree, undecided, or disagree.
The interview schedule was presented to six nutrition specialists
from the State Extension office and the Home Economics Department. They
were asked to answer the part on foods and nutrition. The author had

25
a discussion with each specialist about the answers. The food value
tables were used to check some of the answers which the specialists
did not agree on.
According to this standard answer sheet, every interview schedule
was given a score for the five parts of comprehension of foods and
nutrition, general knowledge and the four food groups. A composite
score for the comprehension was calculated for each respondent.
For attitude measurement, eleven reasons were presented to the•r
homemaker, and she was asked to tell to what extent she was influenced
by each reason when she had consumed each food during the 24-hour re
call period. There were three possible choices— very much, some, and
little or none! These had to be changed as a result of the schedule
pre-testing to a lot, some, and little or none.
Every degree of influence was given a score. A lot (2), some
(1), and little or none was given a score of zero. For every reason
for eating food, from the eleven reasons, the degree of influence
was summed up for all the foods and the mean score was calculated. Thus,
the highest score was two which denoted that the respondent was influenced
very much by the given reason when choosa.ng foods. The lowest score was
zero which means that such reason did not influence the respondent to
eat the food.
Attitudes could not be grouped as to favorable and unfavorable due to
the variety of reasons for having foods. It would not have been meaning
ful if grouping had been attempted.
26
For eating practices, the consumed foods were tabulated according
to the four food groups.
A score was given to the homemaker's interest in ten nutritional
problems.
At this point, all the data were ready for coding.
The data were prepared and coded to be submitted for computer
analysis. Frequency distributions were obtained to assess comprehension,
eating practices, and attitudes. Least-squares analysis of variance
was used to test the factors that affect the three dependent variables.IThis procedure enables us to measure the effect of each independent
variable on the dependent variable while holding the other independent
variables constant. Correlation coefficient was obtained to ascertain
the relationship between comprehension, eating practices, and attitudes.
CHAPTER IV
ANALYSIS AND INTERPRETATION OF DATA
The Agricultural Research Service of the U.S. Department of
Agriculture recommended a daily food plan which was referred to as
"Essentials of an Adequate Diet." The plan states:
"It is not difficult to obtain the nutrients needed if the types of food listed below are eaten daily in the amounts suggested:Milk group: Some daily (varies from 2 servings foradults to 6 for nursing mothers).Meat group: 2 or more servings.Vegetable-fruit group : 4 or more servings.Bread-coreals group: 4 or more servings.The minimum number of servings listed above forms the foundation for a good diet."*
The intention in this study was to measure the adequacy of the
homemaker's diet and not her nutritional status. Therefore, the
minimum number of servings was taken as a basis to assess the diet
adequacy of the homemakers.
As indicated earlier in Chapter I, the purpose of this study was
to assess the homemaker's comprehension of some elements in human
nutrition; to determine her eating practices; to determine her intensity
or strength of attitudes toward foods and the factors that affect; and
to determine the correlation between comprehension, eating practices,
and attitudes.
*"Essentials of an Adequate Diet," Home Economics Research Report No. 3, Agricultural Research Service, U.S.]).A. Government Printing Office, Washington, D. G., 1957.
27

At this point, definitions of concepts used in this chapter
should be made:
General Comprehension of Foods and Nutrition: refers to the home
maker's answers to some general statements on foods and nutrition.
Comprehens ion of Milk and Milk Products: refers to the homemaker's
answers to some statements on milk and its products.
Comprehension of Meat and Meat Substitutes: refers to the homemaker's
answers to some statements on meat and its substitutes.•r
Comprehension of Vegetables and Fruits: refers to the homemaker's
answers to some statements on vegetables and fruits.
Comprehension of Bread and Cereals: refers to the homemaker's
answers to some statements on bread and cereals.
Comprehension of Basic Elements in Human Nutrition: refers to the
homemaker's answers to all the statements in the above five categories.
Data were coded and analyzed statistically. Frequency distributions
were obtained to assess comprehension, eating practices, and attitudes.
The statistical procedure least-squares analysis of variance was
used to test the factors that affect the above mentioned three dependent
variables (4). This procedure enabled us to measure the effect of each
independent variable on the dependent variable while holding the other
independent variables constant.
The statistical model of the least-squares analysis of variance
used in the analysis of the data is presented in Table X.

29
TABLE I
MODEL AND TABLE OF LEAST-SQUARES ANALYSIS OF VARIANCE USED IN THE EXPERIMENTAL ANALYSIS
Source of Degrees of Sum of MeanVariance Freedom Squares Square F
Total 99
Number of children 4
4-H participation 1
Home demonstration 1
Home economic training 3
Level of education 6
State 2
Area 2
Schooling 1
Employment status 1
Family income 6
Age of oldest child 1
Homemaker1s age 1
Monthly food expenses 1
Error 69
Correlation coefficient was obtained to ascertain the relationship
between comprehension, eating practices, and attitudes. An nF"
test for significance was used. "F" values were compared at

30
significant levels of: a) .01, b) .05, c) .10, and d) .25. The
data were processed at the Louisiana State University Computer Center.
This chapter deals with the analysis and interpretation of the
findings. It includes the following sections:
1. Comprehens ion.
2. Eating practices.
3. Attitudes.
4. The correlation between comprehension, eating practices, and
attitudes.
5. Sources of nutritional knowledge - The homemaker's interest
in a nutrition education, and the practical methods for
giving her information.
A • C omp r eh ens i on
a • The homemaker1s comprehens ion of some elements in human nutrition:
The homemaker's total comprehension of human nutrition was determined
by measuring her comprehension of 5 major categories as follows: general
comprehension of foods and nutrition, comprehension of milk and milk
products group, meat and meat substitutes group, vegetables and fruits
group, and bread and cereal group. Level of comprehension was ascertained
by the correct responses the homemakers could give to several statements
in each category. A score was given to the respondent's answers for
each division. Ten points were given for every correct answer to each
of the statements. Thus the possible score for each of the five divisions
was 50. All answers were classified into three levels of comprehension:

31
poox* comprehension for those who scored less than 40, fair compre
hension for those who got 40-45 points, and good comprehension for
those who scored above 45 points. An overall score for comprehension
was calculated by summing up all scores made on every category. In this
case the possible score was 250. The respondents were classified into
three categories according to their comprehension of some elements in
human nutrition as follows: poor (less than 150 points), fair (150
to 199 points), and good (200 to 250 points). Table II shows that
just above one-half of the sample had good scores in general compre
hension of foods and nutrition. The remainder had either fair or poor
scores. The scores on comprehension of milk and milk products was poor
among 59 percent of the sample, fair among one quarter and good among
16 percent of the respondents. The homemaker's score on comprehension
of meat and its substitutes was better than milk and its products.
About one-half of the homemakers had poor scores while the rest fell
into the fair and good categories. About one-fifth of the respondents
had good scores on comprehension of vegetables and fruits, one-half had
fair scores, and the rest fell into the poor category. Their compre
hension of bread and cereal was the worst among the four food groups.
More than two-thirds of the sample had poor scores on. comprehension
of bread and cereal, only 9 percent had good and less than one-quarter
had fair scores .

32
The overall score of comprehension revealed that 23 percent had
good comprehension, 63 percent had fair and 14 percent had poor
comprehension of some elements in human nutrition.
When broken down according to their level of comprehension,
the scores of almost all the poor comprehension group indicated lack
of comprehension of all the four food groups. Also the majority of
the fair comprehension group had lack of good understanding of the
four food groups. On the whole, the better comprehension group had
better understanding of the food groups, but their lack of knowledge
was more on the bread/cereal and vegetable/fruit groups (Table II).
These data indicate lack of understanding of the four food groups
especially bread/cereal, milk and milk products, and vegetable/fruit
groups. It seems that the homemakers are better informed on the
meat and meat substitutes group than the other three groups.
The homemakers were asked how many servings an adult needs daily
from each of the four food groups. Respondents who indicated that an
adult should get 2 servings of each of the two food groups, milk
and meat, and 4 servings of each of vegetable/fruits and bread/cereal
were considered to know the minimum adequate daily diet. Findings
revealed that only 3 percent of the homemakers had this knowledge.
Their lack of knowledge of the correct diet was due to their poor
comprehension of bread/cereal, vegetable/fruits, and milk groups.

TABLE II„ A COMPARISON OF HOMEMAKERS BY LEVEL OF COMPREHENSION OF SOME BASIC ELEMENTS IN
HUMAN NUTRITION ACCORDING TO THEIR SCORES IN THE DIFFERENT ’FOOD GROUPS, LOUISIANA, 1971
Level of Comprehension
Poor Score Fair Score Good ScorePoorComprehension
FairComprehension
GoodComprehension
>>os0)r-i 3CO CC
PoorComprehension
FairComprehension
GoodComprehension
u - c<DiH 2d xj*
Poor | Comprehension
FairComprehension
GoodCompre-
"jDif f-erent Food - Groups No. % No. % No. %
AJ OJo w H No. % No. % No. %4J Go u
No. % No. % No. - %o ;
General 2 14 7 11 9 9 64 24 38 7 30 40 3 21 32 51 16 70 5:
Milk 13 93 44- 70 2 9 59 1 7 16 25 8 35 25 3 5 13 57 IfMeat 13 93 31 49 4 17 48 13 21 5 22 18 - 1 7 19 30 14 61 3̂Vegetable/Fruits 9 64 23 37 2 9 34 3 21 30 48 15 65 48 2 14 10 16 6 26 liBread/Cereal 14 100 51 81 4 17 1 69 — — 11 18 11 48 22 — - 1 2 8 35 (
33

34
Table III shows that 93 percent of the total sample did not
know the minimum daily servings of bread/cereal. Seventy-nine percent
of the homemakers failed to give the correct number of daily servings
of vegetable/fruits. About one quarter of the respondents did not
know the required daily servings of milk and its products, or meat
and meat substitutes.
These findings relative to knowledge of the required daily servings
of food correspond with the data of the comprehension scores on the
five different categories. Lack of comprehension about bread/cereal,
and vegetable/fruits groups resulted in their inability to state the
required minimum number of daily servings of foods from each of these
groups.
TABLE III
A COMPARISON OF HOMEMAKERS ACCORDING TO THE ABILITY TO STATE THE DAILY SERVINGS OF EACH OF THE
FOUR FOOD GROUPS, LOUISIANA, 1971
Percent by Number of N = 100
Servings
Food Groups None One Two ThreeFour or More
Milk and its products 8 15 37 21 19
Meat and its substitutes
0 25 52 . 22 1
Vegetable and fruits 0 18 31 30 21
Bread and cereal 1 37 36 19 7

b. Factors affecting the homemaker1s comprehension and the
correlation between comprehension and other independent variables
Comprehension could be affected by none, several, or all of the
independent variables mentioned earlier in this chapter. The null
hypothesis of the factors that will have significant effect or significant
correlation with comprehension will be rejected. It will be accepted
if no significant effect or correlation exists at the .25 level.
1. Number of Children:
Over one-half of the homemakers (51 percent) had one child, 20
percent had two children,while very few (2 percent) had three to four
children and the rest (27 percent) had none. Eight percent of the home
makers were pregnant.
When the homemakers were divided according to their comprehension,
it was found that 26 percent of the good comprehension group had two
children as compared with 18 percent and 21 percent in the fair and
poor comprehension groups respectively. Almost one-half of the home
makers in the good comprehension group had one child,as compared with
over one-half of those in the fair and 43 percent in the poor compre
hension groups. The highest percentage of homemakers who had no
children fell into the poor comprehension category and the lowest fell
into the good comprehension group (Table IV).
These data show an indication that homemakers with more children
had better comprehension of basic elements in human nutrition. However,

3b
the "FM test of the analysis of variance was not significant. On the
other hand, homemakers who had three or more children were better able
to state the correct bread and cereal daily servings. This result
was significant at the .25 level (Table V).
TABLE IV
A COMPARISON OF HOMEMAKERS BY LEVEL OF COMPREHENSION OF SOME BASIC ELEMENTS IN HUMAN NUTRITION ACCORDING TO NUMBER OF CHILDREN, LOUISIANA, 1971
Number of Children*
Level of Clomprehension
NPoor = 14
Fair N = 63
Good N = 23
No. % No. % No. %TotalN=100
None 5 36 17 27 5 22. 27
One child 6 43 34 53 11 48 51
Two children 3 21 11 18 6 26 20
Three children - - 1 2 -• - 1
Four or. more - - - - 1 4 1
* F = 0.17 with 4 and 69 degrees of freedom. Not significant at the .25 level.
2. Age of Children:
The range in age of the children in the total sample was from one
week to 10 years. Forty-three percent of the homemakers had pre-school
children, their ages ranged from one to six years. Almost one quarter
of the respondents (23 percent) had infants while 7 percent had school
age children.
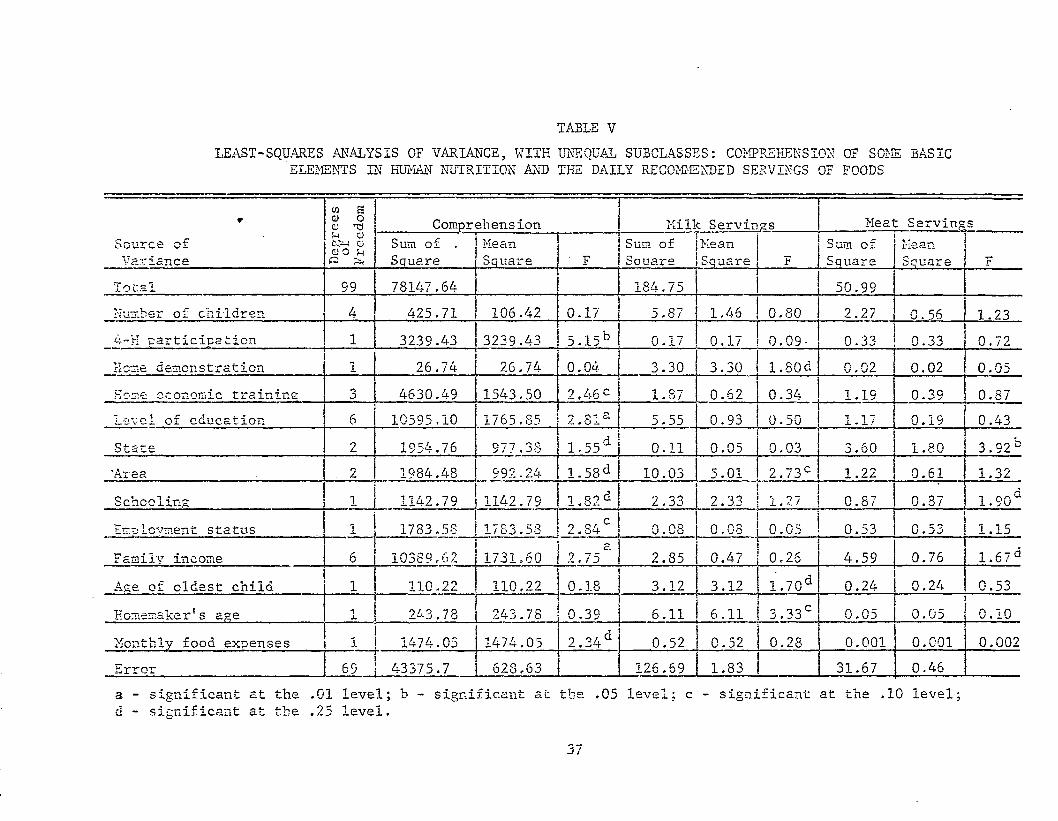
TABLE VLEAST-SQUARES ANALYSIS OF VARIANCE, WITH UNEQUAL SUBCLASSES: COMPREHENSION OF SOME BASIC
ELEMENTS IN HOMAN NUTRITION AND THE DAILY RECOMMENDED SERVINGS OF FOODS
♦
Source of Variance De
grees
of Free
dom
Comprehens ion Milk Servings Meat ServingsSum of . Square
MeanSquare ' F
Sum of Square
MeanSquare F
Sum of Square
MeanScuare r
Total 99 78147.64 184.75 50.99Number of children 4 425.71 106.42 0.17 5.87 1.46 0.80 2.27 0.56 1.234-H participation 1 3239.43 3239.43 5 -15b 0.17 0.17 0,09- 0.33 0.33 0.72Home demonstration x 26.74 26.74 0.04 3.30 3.30 1 .S0d 0.02 0.02 0.05Home economic training **> 4630.49 1543.50 2.46 c 1.87 0.62 0.34 1.19 0.39 0.87Level of education 6 10595.10 1765.85 2 ,81 a 5.55 0.93 0.50 1.17 0.19 0.43State 2 1954.76 977.33 1.55d 0.11 0.05 0.03 3.60 1.80 3.92 b'Area 2 1984.48 992.24 1.58d 10.03 5.01 2.73° 1.22 0.61 1.32Schooling i 1142.79 1142.79 1.82d 2.33 2.33 1.27 0.87 0.87 1.90gEmplovnent status X 1783.58 1783.58 O OA ^ Z . 0*4 0.08 0.08 0.05 ! 0.53 0.53 1.15Family income 6 10389.62 1731.60
a2.75 2.85 0.47 0.26 4.59 0.76 1.67d
Age of oldest child 1 110.22 110.22 0.18 3.12 3.12 1.70d 0.24 0.24 0.53Homemaker’s age iX 243.78 243.78 0.39 6.11 6.11 3 ,33c 0.05 0.05 0.10Monthly food expenses 1
11474.05 | 1474.05 2.24d 0.52 0.52 0.28 0.001 0.001 0.002
F. 2T T O IT 69 43375.7 i 628.63 126.69 1.83 31.67 0.46a - significant at the .01 level; b - significant at the .05 level; c - significant at the .10 level; d - significant at the .25 level.
37

TA3LE V (continued)
Source of Variance
Vegetable/Fruit Servings Bread/Cereal ServingsSum of Squares
MeanSquare F
Sum of Squares
Mean ] Square i F
Total 110.64 32.75
Number of children 3.19 0.79 0.71 5.50 1.37 1.60 d
4~H participation 0,12 0.12 0.11 0.003 0.003 0.003Home demonstration 2.59 2.59
d2.33 2.59 2.59 3 .01°
Hone economic training 1.31 0.49 0.39 10.64 3.54 4 .14aLevel of education 7.10 1.18 1.06 8.43 1.40 1.64dState 4.81 2.40 2 .16 ̂ 4.67 2.33 2.72°Area 0.88 0.44 0.40 1,00 0.51 0.6Schooling 1.46 1.46 1.31a 2.40 2.40 2.80°Employment status 0.39 0.39 0.35 0.01 0.01 0.01Family income 9.71 1.61 1.45 ̂ 2.79 0.46 0.54Age of oldest child 0.12 0.12 0.10 0.02 0.02 0.02Homemaker's age 0.34 0.34 0.31 0.07 0.07 0.08Monthly food expenses 0.04 0.04 0.04 0.28 0.28 0.33Error 76.89 1.11 1 59.17 0.85
a - significant at the .01 level; b - significant at the .05 level; c - significant at the .10 level; d - significant at the .25 level.
38

39
When homemakers were divided according to level of comprehension,
it was found that 56 percent of the good comprehension group had
pre-school children as compared with 38 percent and 43 percent in the
fair and poor comprehension groups,respectively. Homemakers with
infants were 13 percent, 27 percent, and 21 percent in the good, fair
and poor groups respectively (Table VI).
It seems that the older the homemaker's children, the better
comprehension of basic elements in human nutrition she had. This
difference, however, was not significant at the .25 level (Table V).
Age of oldest child affected the correct answer relative to the
daily number of servings of milk at the .25 level of significance.
Home makers who had older children were better able to.state the
daily servings of milk and its products (Table V).
TABLE VI
A COMPARISON OF HOMEMAKERS BY LEVEL OF COMPREHENSION OF SOME BASIC ELEMENTS IN HUMAN NUTRITION ACCORDING TO
AGE OF CHILDREN, LOUISIANA, 1971
Level of Comprehension
Age ofPoor
N = 14Fair
N = 63Good
N = 23 TotalChildren* No % No. % No. % N=100
New born to 1 year ‘3 21 17 27 3 13 23
Over 1 year to 6 years 6 43 24 38 13 56. 43
7 years or over - - 5 8 2 9 7
Do not have children 5 36
t
17 27 5 22 27
* F =0.18 with 1 and 69 degnees of freedom . Not significant at the.25 level.

40
3. Family Income Per Year:
The annual income of the family was obtained in order to see
whether or not it had any affect on the homemaker's comprehension.
Table VII shows that 58 percent of the total sample had an annual
income of less than $5,000, and 42 percent had an income above this
level.
According to the respondent's level of comprehension, the
highest percentage in the good and fair comprehension groups (26.f'
percent and 20 percent, respectively) had incomes of over $7,000 a
year,while 37 percent of the poor comprehension group had incomes
of less than $4,000 annually. There is an indication that income had
an effect on the homemaker's comprehension.
In the "F" test a significant difference existed at the .01 level
between homemaker's level of comprehension and family income. Those
with income over $5,000 a year had better comprehension (Table V).
This result was supported by a significant positive association
between income and level of comprehension at the .05 level (Table VIII).
Income affects the ability of the homemaker to state the correct
minimum daily servings of vegetables and fruits, and meat and its
substitutes at the .25 level. Homemakers who had family income over
$5,000 were better able to state the correct daily amounts of these
two food groups (Table V).

TABLE VII
A COMPARISON OF .HOMEMAKERS BY LEVEL OF COMPREHENSION OF SOME BASIC ELEMENTS IN HUMAN NUTRITION
ACCORDING TO ANNUAL FAMILY INCOME, LOUISIANA, 1971
_______Level of Comprehension_______________Poor Fair Good
Family Annual N = 14 N = 63 N = 23 TotalIncome * _________________ No. % No . X No'. ' ' X N=100
Less than $2,000 2 14 8 13 3 13 13
$2,000 to $2,999 2 14 8 13 1 4 11
$3,000 to $3,999 5 37 8 13 2 ■ 9 15
$4,000 to $4,999 3 21 12 19 4 18 19
-$5,000 to $5,999 1 7 10 16 3 13 14
$6,000 to $6,999 1 7 4 6 4 17 9
$7,000 and over - - 13 20 6 26 19
* F - 2.75 with 6 and 69 degrees of freedom. Significant at the .01level.
4. Monthly Food Expenses:
The range of monthly, food expenses was from $30 to $175. The
highest proportion of the families (45 percent) spent from $76 to
$100 a month; these could be the larger size families with more
children. The highest proportion of the homemakers in the good com
prehension group (34 percent) spent from $101 to $125 a month on foods,

42
while 60 percent of the fair comprehension group had from $76 to
$100 food expenditure, and 37 percent in the fair group spent from
$51 to $75 a month on foods (Table IX).
TABLE VIII '
CORRELATION COEFFICIENT BETWEEN HOMEMAKER1S COMPREHENSION AND THIRTEEN INDEPENDENT VARIABLES
Independent Variables Comprehenslion
Number of children 0.11
4-H participation 0.18 (c)
Home demonstration 0.03
Home economic training 0.11 (d>
Level of education 0.16 (d)
State 0.11
Area 0.03
Schooling 0.07
Employment status 0.03
Family income 0.23 (b)
Age of oldest child 0.09
Homemaker's age 0.15 (d)
Monthly food expense 0.19 (d)
a ~ significant at the .01 level; b - significant at the .05 level c - significant at the .10 level; d - significant at the .25 level.

43
The previous data on number and age of children indicated that
a higher percentage of homemakers in the good comprehension group
had older and more children, and higher income. Thus, these factors
can be related to food expenses per month, which in turn might affect
comprehension.
At the .25 level of significance, it was found that food expense
per month was affected by comprehension. Homemakers who had better
levels of comprehension had higher food expenditures (Table V). This•f
was supported by a significant positive association between compre
hension and food expense at the .05 level (Table VIII). This variable
had no significant effect or association with stating the correct daily
servings of foods for an adult (Table V).
TABLE IX
A COMPARISON OF HOMEMAKERS BY LEVEL OF COMPREHENSION OF SOME BASIC ELEMENTS IN HUMAN NUTRITION ACCORDING TO
MONTHLY FOOD EXPENSES, LOUISIANA, 1971
Level of ComprehensionPoor Fair Good
Monthly Food N = 14 N = 63 N = 14 TotalExpenses* No. % No. % No. 1 N=100$30 to $50 3 21 8 13 2 9 13
$51 to $75 5 37 7 11 3 13 15
$76 to $100 2 14 38 60 5 22 45
$101 to $125 3 21 8 13 8 34 19
$126 to $150 - - - - 5 22 5
$151 to $175 1 7 2 3 - 3
* F = 2.34 with 1 and 69 degrees of freedom. Significant at the .25 level.
44
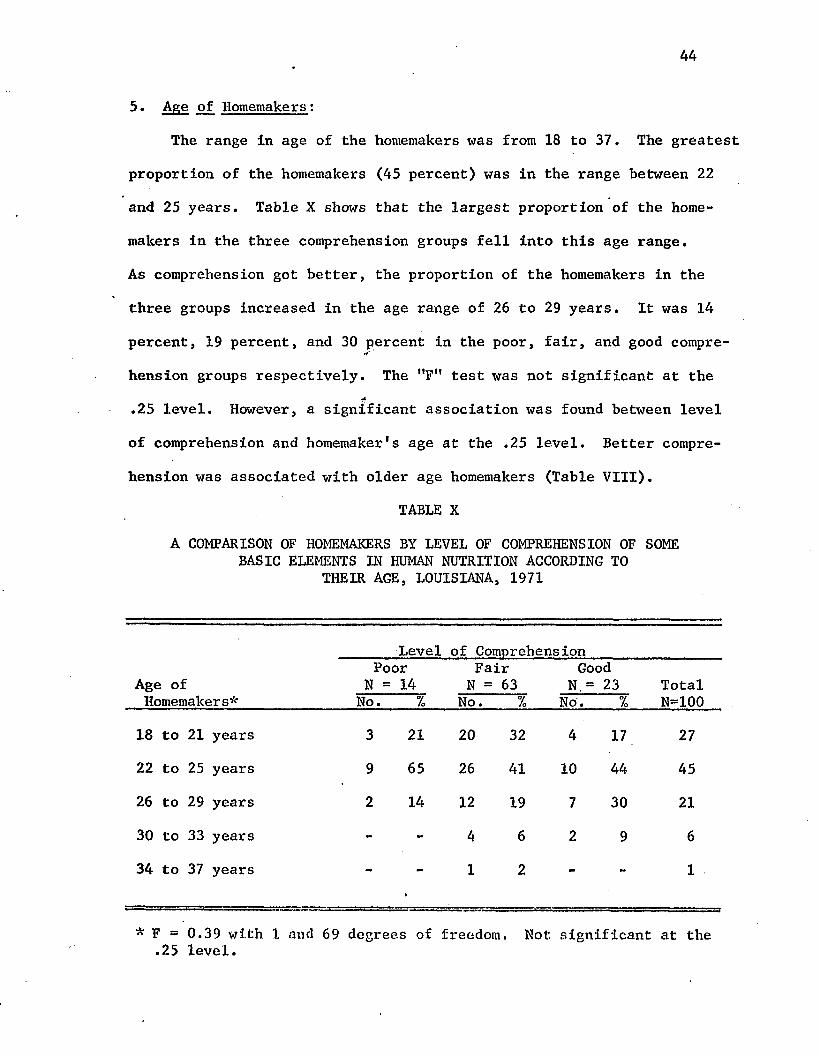
5. Age of Homemakers:
The range in age of the homemakers was from 18 to 37. The greatest
proportion of the homemakers (45 percent) was in the range between 22
and 25 years. Table X shows that the largest proportion of the home
makers in the three comprehension groups fell into this age range.
As comprehension got better, the proportion of the homemakers in the
three groups increased in the age range of 26 to 29 years. It was 14
percent, 19 percent, and 30 percent in the poor, fair, and good compre-•f '
hension groups respectively. The "FM test was not significant at the■A.25 level. However, a significant association was found between level
of comprehension and homemaker's age at the .25 level. Better compre
hension was associated with older age homemakers (Table VIII).
TABLE X
A COMPARISON OF HOMEMAKERS BY LEVEL OF COMPREHENSION OF SOME BASIC ELEMENTS IN HUMAN NUTRITION ACCORDING TO
THEIR AGE, LOUISIANA, 1971
Level of ComprehensionPoor Fair Good
Age of N = 14 N = 63 N.= 23 TotalHomemakers* No. % No. % No. % N=100
18 to 21 years 3 21 20 32 4 17 2722 to 25 years 9 65 26 41 10 44 45
26 to 29 years 2 14 12 19 7 30 21
30 to 33 years - - 4 6 2 9 6
34 to 37 years - - 1 2 m - 1
* F = 0.39 with 1 and 69 degrees of freedom. Not significant at the .25 level.

Age was found to affect the homemaker's correct answer of daily
milk servings at the .10 level. Older homemakers were better able
to state the correct answer (Table V).
6. Education:
Almost all homemakers had high school education. Thirty-nine
percent studied beyond high school and 35 percent were college graduates
Very few had higher degrees which included 2 percent Master's and
1 percent Ph.D. degree (Table XI). Comprehension improved with a
college education.TABLE XI
A COMPARISON OF HOMEMAKERS BY LEVEL OF COMPREHENSION OF SOME BASIC ELEMENTS IN HUMAN NUTRITION ACCORDING TO
LEVEL OF EDUCATION LOUISIANA, 1971
Level of Comprehension
Level ofPoor
N = 14Fair
N = 63Good
N = 23 TotalEducation* No. % No. % N o. % N=100Below high school - - 1 2 - - 1
High school graduate 4 29 13 21 3 13 20
Beyond high school 7 50 26 40 6 26 39
College graduate 3 21 19 30 13 57 35
Master's degree - - 1 2 1 4 2
Ph.D. degree - - 1 2 - - 1
Others - - 2 3 - - 2
* F = 2.81 with 6 and 69 degrees of freedom. .01 level.
Significant at the

46
At the .01 level of significance, level of education was found
to affect the homemaker's comprehension. College graduates had better
comprehension (Table V). This result was supported by a significant
positive correlation between education and comprehension at the .25
level (Table VIII). Education had an effect on the homemaker's
answer of bread and cereal daily servings at the .25 level. Re
spondents who had college education were better informed relative
to this food group. There were no significant differences in stating
the minimum daily servings of the other three food groups (Table V).
7. Schooling:
The homemakers were asked if they were students at L.S.U. at
the time the study was conducted. Table XII shows that 22 percent
were attending. One quarter of the fair comprehension group were
students and 22 percent and 7 percent in the good and poor compre
hension groups,respectivelyswere attending.
Homemakei-s who were attending school had better comprehension.
The "F" test was significant at .25 level. They also were able to
give significantly better answers of the daily requirement of vege
table and fruits at the .25 level (Table V).
However, respondents who were not going to school stated the
correct daily servings of bread and cereal and meat and meat sub
stitutes better than those who were. This result was significant at
the .10 and the .25 levels Respectively (Table V).

47
TABLE XII
A COMPARISON OF HOMEMAKERS BY LEVEL OF COMPREHENSION OF SOME BASIC ELEMENTS IN HUMAN NUTRITION ACCORDING TO
SCHOOL ATTENDANCE, LOUISIANA, 1971
Level of ComprehensionPoor Fair Good
N = 14 N = 63 N = 23 TotalAttending L.S.U.* No. % No. % No. % N=100
Yes 1 7 16 25 5 22 22
No 13 93 47 75 18 78 78
* F= 1.82 with 1 and 69 degrees of freedom. Significant at the .25 level.
8. Formal Home Economics Education:
The majority of the homemakers (61 percent) had received formal
home economics education. The highest proportion (41 percent) were
trained in high school, 7 percent received college training,while
13 percent had both high school and college training. The good com
prehension group had higher proportions of homemakers who received
training in high school and college than in the fair and poor com
prehension groups (Table XIII). The home economics training could have
been obtained in any area of home economics. However, there is an
indication that the more formal training they received the better their
comprehension was.

48
TABLE XIII
A COMPARISON OF HOMEMAKERS BY LEVEL OF COMPREHENSION OF SOME BASIC ELEMENTS IN HUMAN NUTRITION ACCORDING TO
FORMAL HOME ECONOMICS EDUCATION LOUISIANA, 1971
_______ Level of Comprehension_______________Poor Fair Good
Source of N = 14 N = 63 N = 23 TotalEducation* No." T No. % No. % N=100
High school 29 29 46 8 35 41
College - - 5 8 2 9 7
High school and college7*
2 14 5 8 6 26 13
No formal education 8 57 24 38 7 30 39
* F = 2.46 with 3 and 69 degrees of freedom. Significant at the .10 level.
At the .10 level of significance formal home economics training
affected the homemaker's comprehension. Those who received such
training were at better comprehension levels (Table V ). This result
was supported by a positive significant association between compre
hension and receiving formal home economics training at the .25 level
(Table VIII). College trainees were better able to state the correct
answer of bread and cereal minimum daily servings. The "F" test was
significant at the .10 level (Table V).

49
9 • Employment Sta tus :
Homemakers wore asked whether they were employed on a full-time
basis outside their homes. Thirty-seven percent of the total sample
had a full-time job. When further divided by level of comprehension,
it was found that the highest proportion of the employed homemakers
were in the fair comprehension group. (41 percent) Table XIV. Although
there was not much difference in the percentage of those who were
employed in the poor and good comprehension groups, the "F" test was
significant at the .10 level. Homemakers who were not full-time
employed had better comprehension. There was no significant affect
of employment status on the answer of the minimum daily food servings
at the .25 level (Table V).
TABLE XIV
A COMPARISON OF HOMEMAKERS BY LEVEL OF COMPREHENSION OF SOME BASIC ELEMENTS IN HUMAN NUTRITION ACCORDING
TO EMPLOYMENT STATUS LOUISIANA, 1971
Level of Comprehensive
EmploymentPoor
N = 14Fair
N = 63Good
N = 23 TotalStatus* No. % No. 7a No. % N=100
Full-time job 4 29 26 41' 7 30 37
No full-time job
...•*-■-- —--
10 71 37 59 16 70 63
* F = 2.84 with 1 and 69 degrees of freedom. Significant at ,10 level.
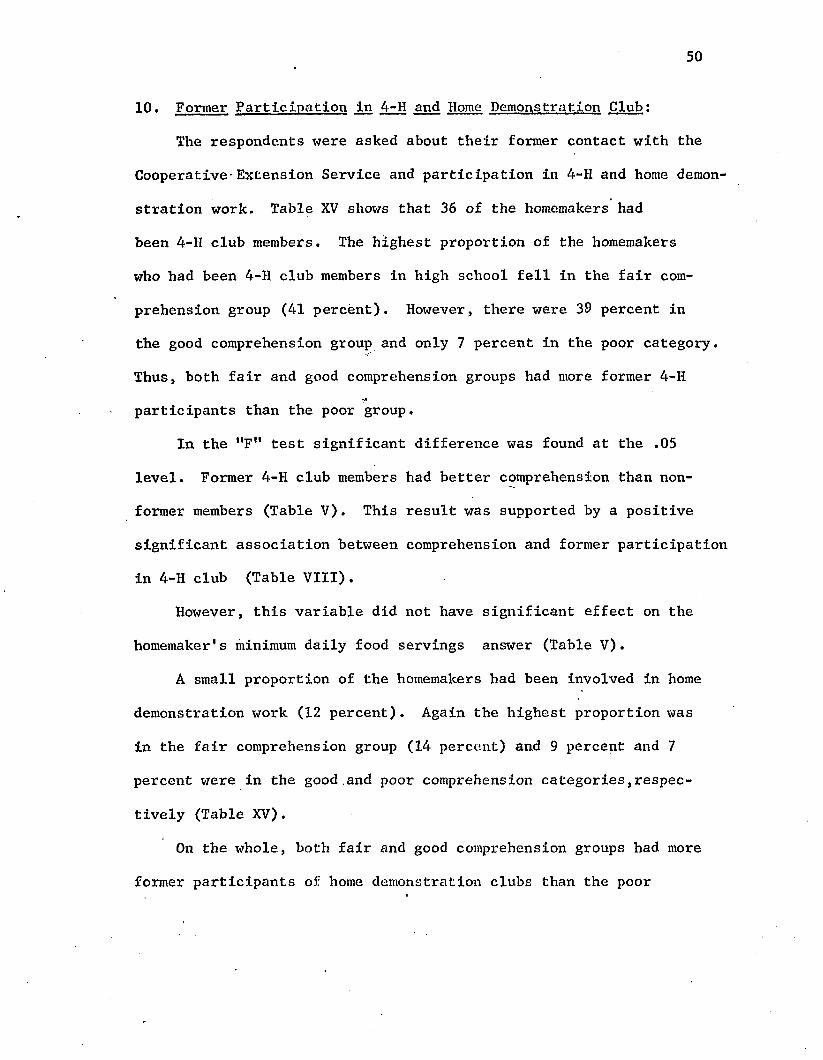
50
10. Former Participation in 4-H and Home Demonstration Club:
The respondents were asked about their former contact with the
Cooperative-Extension Service and participation in 4-H and home demon
stration work. Table XV shows that 36 of the homemakers had
been 4-H club members. The highest proportion of the homemakers
who had been 4-H club members in high school fell in the fair com
prehension group (41 percent). However, there were 39 percent in
the good comprehension group and only 7 percent in the poor category.
Thus, both fair and good comprehension groups had more former 4-H
participants than the poor group.
In the "F" test significant difference was found at the .05
level. Former 4-H club members had better comprehension than non
former members (Table V). This result was supported by a positive
significant association between comprehension and former participation
in 4-H club (Table VIII).
However, this variable did not have significant effect on the
homemaker's minimum daily food servings answer (Table V).
A small proportion of the homemakers had been involved in home
demonstration work (12 percent). Again the highest proportion was
in the fair comprehension group (14 percent) and 9 percent and 7
percent were in the good.and poor comprehension categories,respec
tively (Table XV).
On the whole, both fair and good comprehension groups had more
former participants of home demonstration clubs than the poor
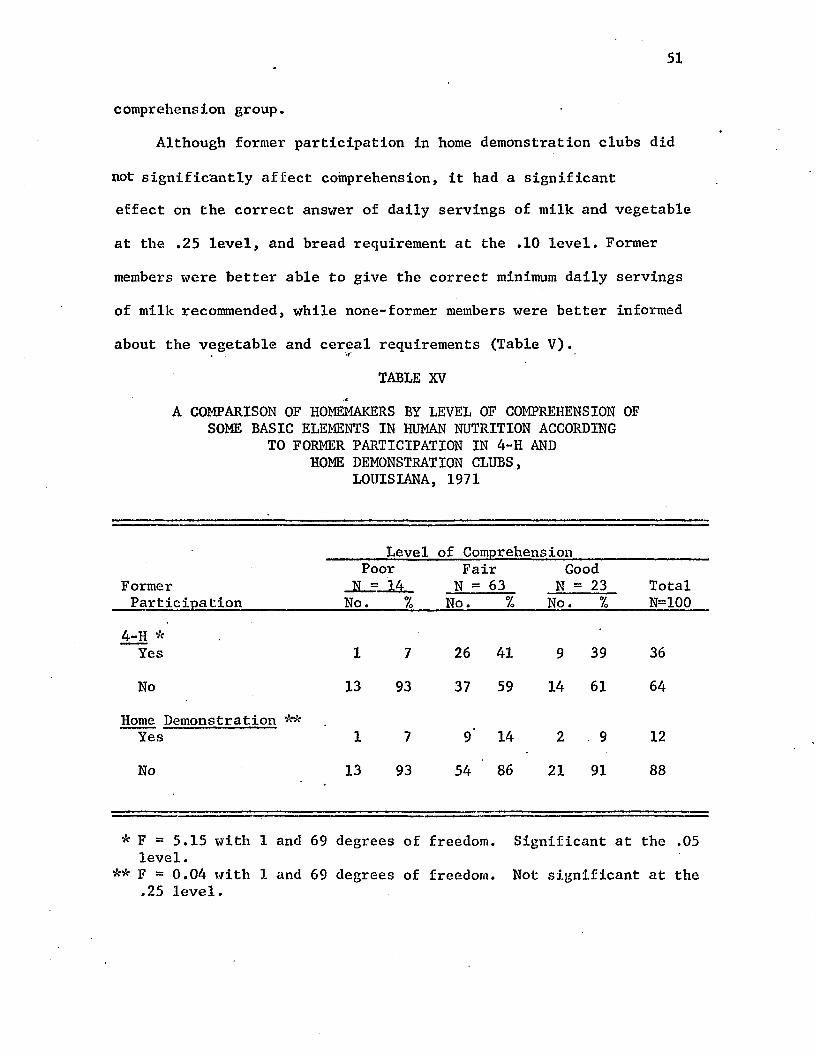
51
comprehension group.
Although former participation in home demonstration clubs did
not significantly affect comprehension, it had a significant effect on the correct answer of daily servings of milk and vegetable
at the .25 level, and bread requirement at the .10 level. Former
members were better able to give the correct minimum daily servings
of milk recommended, while none-former members were better informed
about the vegetable and cereal requirements (Table V).•f
TABLE XV
A COMPARISON OF HOMEMAKERS BY LEVEL OF COMPREHENSION OF SOME BASIC ELEMENTS IN HUMAN NUTRITION ACCORDING
TO FORMER PARTICIPATION IN 4-H AND HOME DEMONSTRATION CLUBS,
LOUISIANA, 1971
Level of Comprehension
FormerPoor Fair
N = 63Good
N = 23 TotalParticipation No. % No. % No. % N=100
4-H * Yes 1 7 26 41 9 39 36
No 13 93 37 59 14 61 64
Home Demonstration ** Yes 1 7 9' 14 2 9 12
No 13 93 54 86 21 91 88
* F - 5.15 with 1 and 69 degrees of freedom. Significant at the .05 level.
** F = 0.04 with 1 and 69 degrees of freedom. Not significant at the .25 level.
52
Original Place of Residence:
Homemakers were asked about their original place of residence.
Data revealed that 77 percent came from Louisiana, 16 percent came
from other southern states, and the rest (7 percent) were from other
sections of the United States (Table XVI).
Homemakers who came from other sections of the United States
had better comprehension. This result was statistically significant
at the .25 level (Table V ) .'■f
With regard to stating the correct answer of the daily re--4commended servings of foods, homemakers who came from other parts
of the United States scored higher. The "F" test was significant
at the .05 level for meat requirement, .25 level for vegetable
requirement, and .10 for bread requirement. The difference was not
significant for milk servings (Table V ) .
Data showed that 73 percent of the respondents came from urban
areas as compared with 18 percent and 9 percent who came from rural
and farm areas,respectively. Almost all the poor comprehension group
came from urban areas (93 percent). About two-thirds (64 percent)
of the fair comprehension group came from urban areas as compared
with 87 percent in the good comprehension group.
The "F" test at the..25 level showed that respondents who were
brought up in rural areas had higher comprehension levels than those
who came from urban or farm areas. Farm homemakers were better able
to give the correct answer of milk servings. The "F" test was

53
significant at the .10 level (Table V).
TABLE XVI
A COMPARISON OF HOMEMAKERS BY LEVEL OF COMPREHENSION OF SOME BASIC ELEMENTS IN HUMAN NUTRITION ACCORDING
TO ORIGINAL PLACE OF RESIDENCE,LOUISIANA, 1971
Level of Comprehension______________Poor Fair Good
N = 14 N = 63 N = 23 TotalPlace of Residence No. % No. °L No. % N=100
State*
Louisiana 12 86 47 75 18 78 77
Southern states 2 14 11 17 3 13 16
Other states - - 5 8 2 9 7
Area**
Urban 13 93 40 64 20 87 73
Rural 1 7 15 23 2 9 18
Farm - - 8 13 1 4 9
* F = 1.55 with 2 and 69 degrees of freedom. Significant at the .25 level.
irk p = 1.58 with 2 and 69 degrees of freedom. Significant at the .25 level.
B . Eating Practices:
The homemaker's eating practices were ascertained by recording
food consumption for the 24 hours preceding the interview. The data

were coded according to the four food groups and the minimum daily
recommended servings in order to determine eating practices and diet
adequacy. It was found that only 7 percent of the total sample
consumed the daily minimum adequate amount of the basic four food
groups. These diets were typical eating practices for 78 percent
of the homemakers. When di.vided by level of comprehension findings
revealed that only 9 percent, 6 percent, and 7 percent in the good,
fair, and poor comprehension groups,respectively,were consuming
minimum adequate diets.4a. Milk and milk products in the daily diets of the homemaker,
factors affecting its consumption, and the relationship
between milk eating practices and some independent variables
Findings in Table XVII show that 30 percent of the total sample
had no milk during the 24-hour recall period. When broken down in
to comprehension levels, 50 percent of the poor comprehension group
had none,as compared with 29 percent, and 22 percent in the fair and
good groups,respectively. The data indicated that 31 percent of the
total sample met the minimum daily requirements of two servings of
milk and its products. There was a small difference between the good
and fair comprehension groups but the difference was great between
those two groups and the poor comprehension group.
The only factor that was found to affect the milk consuming
practices was formal home economics training which was significant
at the .05 level (Table XVIII). Homemakers who had formal training
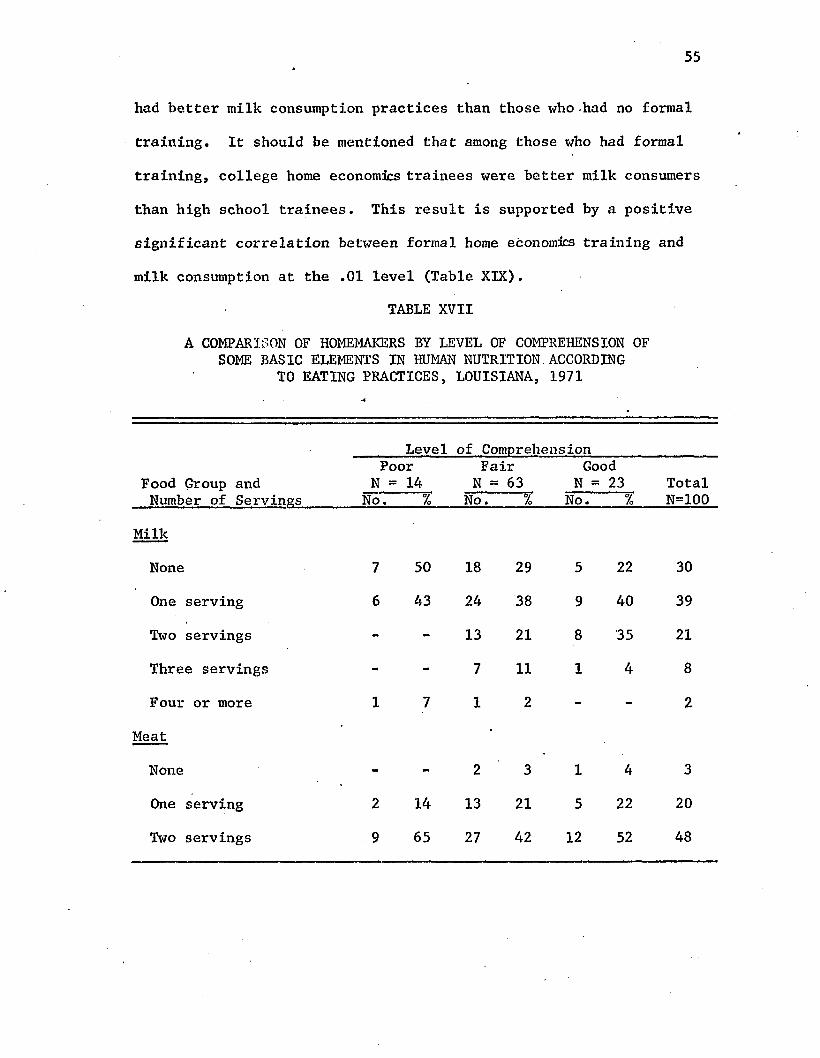
55
had better milk consumption practices than those who had no formal
training. It should be mentioned that among those who had formal
training, college home economics trainees were better milk consumers
than high school trainees. This result is supported by a positive
significant correlation between formal home economics training and
milk consumption at the .01 level (Table XIX).
TABLE XVII
A COMPARISON OF HOMEMAKERS BY LEVEL OF COMPREHENSION OF SOME BASIC ELEMENTS IN HUMAN NUTRITION.ACCORDING
TO EATING PRACTICES, LOUISIANA, 1971
Food Group and Number of Servines
Level of ComprehensionPoor
N = 14 No. %
Fair N = 63
No. %
Good N = 23
No. %TotalN=100
Milk
None 7 50 18 29 5 22 30
One serving 6 43 24 38 9 40 39
Two servings - - 13 21 8 35 21
Three servings - - 7 11 1 4 8
Four or more 1 7 1 2 - - 2
Meat •
None - - 2 3 1 4 3
One serving 2 14 13 21 5 22 20
Two servings 9 65 27 42 12 52 48

56
Table XVII (continued)______Level, of Comprehension______________
Poor Fair GoodFood Group and N = 3.4 N = 63 N ~ 23 TotalNumber of Servings________ '$io. T~ No. % TTo~. 7, N=100
Meat (continued)
Three servings 1
Four or more 2
Vegetable/fruit
None
One serving 1
Two servings 4
Three servings 2
Four or more 7
Bread/cereal
None
One serving 2
Two servings
Three servings 3
Four or more 9
Beverages
None 5
One serving 3
Two servfngs 4
Three servings 1
Four or more 1
7 10 16 2 9 13
14 11 18 • 3 13 16
- 3 5 2 9 5
7 8 13 2 9 11
29 20 31 4 17 28
14 19 30 4 17 2.5
50 13 21 11 48 31
- 4 5 - - 4
14 6 10 4 17 12
- 11 18 7 30 18
21 8 13 3 13 14
65 34 54 9 40 52
36 22 35 3 13 30
21 13 21 5 22 21
29 21 33 8 35 33
7 3 5 6 26 10
7 4 6 1 4 6

57
TABLE XVIII
LEAST-SQUARES ANALYSIS OF VARIANCE, WITH UNEQUAL SUBCLASSES: MILK CONSUMING PRACTICES
_____________ Milk Eating Practices________Degrees
Source of of Sum of MeanVariance________________ Freedom_____Square______Square__________ F
Total 99 99.31
Number of children 4 3.47 0.86 0.80
4-II participation 1 0.78 0.78 0.72
Home demonstration 1 0.44 0.44 0.40
Home economic training 3 9.60 3.20 2.95 b
Level of education 6 4.81 0.80 0.74
State 2 0.77 0.38 0.35
Area 2 0.42 0.21 0.20
Schooling 1 0.33 0.33 0.31
Employment status 1 1.02 1.02 0.94
Family income 6 2.76 0.46 0.42
Age of oldest child 1 0.13 0.13 0.12
Homemaker's age 1 0.11 0.11 0.10
Monthly food expense 1 0.44 0.44 0.41
Error 69 74.98 1.08
a - Significant at the .01 level; b - significant at the .05 level;c - significant at the .10 level; d - significant at the .25 level.

58
TABLE XIX
CORRELATION COEFFICIENT BETWEEN HOMEMAKER'S EATING PRACTICES AND THIRTEEN INDEPENDENT VARIABLES
_______Eating Practices______________________
Independent Vegetable/ Bread/Variables Milk Me a t Fruits Cereal
Number of children -0.1 0.03 0.18 c -0.11
4-11 participation 0.07 0.02 0.01 0.09
Home demonstration 0.08 0.25 a 0.04 0.11
Home economic training 0.25 a 0.30 a 0.01 0.08
Level of education 0.01 0.06 0.13 d 0.11
State 0.07 0.1 0.05 0.23 b
Area 0.11 d 0.24 b 0.05 0.12 d
Schooling 0.03 0.02 0.1 0.03
Employment status 0.08 0.03 0.11 0.08
Family income -0.1 -0.02 0.07 -0.14 d
Age of oldest child -0.11 -0.01 0.15 d -0.23 a
Homemaker1s age -0.12 d -0.13 d 0.19 c -0.26 a
Monthly food expense 0.06 0.08 0.1 -0.04
a - Significant at the .01 level; b - significant at the .05 level; c - significant at the .10 level; d - significant at the .25 level.

b. Meat and meat substitutes in the daily diets of the home
maker, factors affecting its consumption, and the relation
ship between meat eating practices and some independent
variables;
In the total sample, the majority of the homemakers consumed two
or more servings of meat or meat substitutes daily (77 percent). When
broken down by their comprehension level, there was not much difference
between the good and fair groups in consuming the daily recommended
servings of meat or meat substitutes. The poor comprehension group
had a higher percentage of homemakers who had two or more servings
(Table XVII). These findings correspond with the comprehension data,
since it seemed that the homemakers were better informed about meat
and its substitutes than the other food groups.
There were several factors that affected eating practices of
meat and meat substitutes. At the .10 level of significance formal
home economics training and the area from which the person originally
came were found to affect meat eating practices. Homemakers who
received formal home economics training consumed more meat than those
who did not. It should be mentioned that high school training in
fluenced the homemakers to consume more meat than college training
(Table XX). This finding was supported by the existence of a positive
significant correlation between formal home economics training and meat
consumption (Table XIX).

60
TABLE XX
LEAST-SQUARES ANALYSIS OF VARIANCE, WITH UNEQUAL SUBCLASSES: MEAT EATING PRACTICES
Meat E;ating Practices
Source of Variance
Degreesof
FreedomSum of Square
MeanSquare F
Total 99 130.24
Number of children 4 3.60 0.90 0.77
4-H participation 1 1.73 1.73 1.47 d
Home demonstration 1 2.89 2.89 ■ 2.46 d
Home economic, training 3 7.59 2.53 2.15 c
Level of education 6 9.42 1.57 1.34 d
State .2 2.70 1.35 1.15
Area 2 6.72 3.36 2.86 c
Schooling 1 0.0005 0.0005 0.0004
Emp1oyment status 1 1.94 1.94 1.65 d
Family income 6 4.38 0.73 0.62
Age of oldest child 1 0.05 0.05 0.04-
Homemaker's age 1 2.63 2.63 2.23 d
Monthly food expense 1 0.002 0.002 0.001
Error 69 81.14 1.17
a - Significant at the .01 level; b -• significant at the .05 level; c - significant at the .10 level; cl - significant at the .25 level.

61
Homemakers who came from rural or farm areas had better eating
practices with regard to meat. This is supported by the existance
of a positive significant correlation between rural or farm areas
and meat consumption at the .05 level.
Former participation in 4-H and home demonstration clubs,
education, employment status, and homemaker's age were found to have
significant effect on meat consumption at the .25 level. Former
members of 4-H and home demonstration clubs consumed more meat than>r
non-former members. A positive significant correlation was found
between meat eating practices and former participation in home demon
stration clubs at the .01 level.
Homemakers who studied beyond high school consumed more meat
than high school or college graduates, however, there was no significant
association between meat consumption and level of education.
Homemakers who did not have full-time jobs consumed more meat
than those who did have. It should be mentioned, however, that there
was no significant association between employment status and meat
consumption.
Young homemakers were better meat consumers than older home-
makers. This finding was supported by a negative significant correlation
between homemaker's age and meat consumption at the .25 level. This
means that better meat eating practices are associated with younger age
homemakers.
62
c. Vegetables and fruits in the dally diets of the homemaker.
factors affecting their consumption, and the relationship
between vegetable and fruit eating practices and some
independent variables.
Only one-third of the total sample consumed the daily require
ments of four or more servings of vegetables and fruits. When broken
down into comprehension levels it was found that 50 percent of the
poor group, 48 percent of the good group, and only 21 percent of the
fair group met the daily recommended servings of vegetables and fruits
(Table XVII). These findings indicated that there was not much
difference in the consumption of vegetables and fruits by the poor
and good comprehension groups of the homemakers but the difference
was large between these two groups and the fair comprehension group.
Although the scores of vegetable and fruits show that the fair
comprehension group were better than the poor comprehension group,
their vegetable and fruit consumption was far less than the poor
group. There must be another factor that affects the homemakers and
results in these eating practices. It could be that they do not
like vegetables, thus, they do not eat them although they know vege
tables are required for good health.
Least-square analysis of variance showed that formal home
economics training at the .001 level of significance; level of education
at the .01 level; schooling at the .05 level; income at the .10 level; and

63
former praticipation in 4-H clubs at the .25 level affected eating
practices relative to vegetable and fruits (Table XXI).
The homemakers who had better consumption of vegetable and
fruits were those who had formal training in home economics in high
school and college. High school trainees were better, with regard
to vegetable consumption, than college trainees. However, those
who had no training consumed more vegetables than those who received
their training in college. There was no significant association•r
between formal home economics training and vegetable consumption.
College graduates and tlhose who studied beyond high school had
better vegetable and fruit eating practices than other homemakers.
This finding is supported by a significant association between
better consumption of vegetables and higher level of education at the
.25 level (Table XIX).
Homemakers with family income over $4,000 a year, those who were
attending Louisiana State University at the time of conducting this
study, and who were not former members of 4-H clubs had better eating
practices of vegetable and fruits than lower income families, home
makers who were not going to school and former members of 4-H clubs.
A positive significant association existed between vegetable
consumption and number (at the .10 level) and age (at the .25 level)
of children; and age of the homemaker (at the .10 level). This
means that older homemakers who have more and older children con
sume more vegetable and fruits than younger homemakers who have

64
fewer and younger children.
TABLE XXI
LEAST-SQUARES ANALYSIS OF VARIANCE, WITH UNEQUAL SUBCLASSES: VEGETABLE-FRUIT EATING
PRACTICES
Vegetab'J.e/fruit ea t in g practices
Source of Variance
Degreesof
FreedomSum of Square
MeanSquare F
Total 99 206.11•
Number of children 4 9.34 2.33 1.28
4-H participation 1 2.34 2.34 1.29 d
Home demonstration 1 0.23 0.23 0.13
Home economic training 3 32.87 10.96 6.02
Level of education 6 34.07 5.68 3.12 3
State 2 1.37 0.68 0.38
Area 2 0.62 0.31 0.17
Schooling 1 9.72 9.72 5.34 b
Employment status 1 0.31 0.31 0.17
Family income 6 9.94 1.65 0.91 c
Age of oldest child 1 0.001 0.001 0.0006
Homemaker 1s age 1 0.008 0.008 0.005
Monthly food expense 1 0.60 0.60 0.33
Error * 69 125.61 1.18
* Significant at the J b - significant at the d - significant at the
001.05.25
level; a - level; c - '.Level.
significant at significant a
the .01 level; t the .10 level;

65
The majority of older children in this study were pre-school
children who needed vegetables and fruits more than children under
one year of-age. This could be the reason why more consumption of
vegetables and fruits is associated with older homemakers who have
more and older children.
d. Bread and cereal in the daily diets of the homemaker. factors
affecting their consumption and the relationship between
bread and cereal eating practices and some independent
variables:ifTable XVII shows that just above one half the total sample met
the minimum daily servings of bread and cereal. When divided according
to level of comprehension, unexpectedly, the highest proportion of
homemakers who met the daily requirement fell into the poor compre
hension group (65 percent). Fifty-four percent of the fair comprehension
group and 40 percent in the good group met the minimum servings of
bread and cereal. It seems that the better comprehension the home
makers had, the less bread and cereal they consumed daily.
At the .25 level of significance, it was found that former
participation in 4-H and home demonstration clubs, and the home
maker's age affect the eating practices of bread, and cereal. Former
4-H club members, non-former members of home demonstration clubs, and
younger homemakers consumed more, bread and cereal than non-former
4-H club members, former home demonstration club members, and older

66
homemakers (Table XXII). This finding was supported by a negative
significant association between homemaker's age and bread consumption
at the .01 level. Less bread and cereal consumption was associated
with older homemakers (Table XIX).
The correlation coefficient showed that there was a significant
association between age of the children at the .01 level, income at
the .25 level, and eating practices of bread and cereal. Less bread
consumption was associated with homemakers who had older children
and better incomes.
Significant associations existed between bread and cereal con
sumption and the state from which the homemaker came (at the .05
level); and residental area at the .25 level. More bread and cereal
consumption was associated with homemakers who came from Louisiana
and other southern states and who were brought up on a farm.
e. Consumption of Beverages;
The 24“hour food recall included the beverages the respondent
had. It included all the beverages which could not be classified in
the four food groups. Table XVII shows that the highest percentage
of homemakers who consumed 3 or more servings of beverages a day
fell into the good comprehension category. There was a slight
difference between the percentages in the poor and fair groups. Greater
consumption of beverages by the homemakers in the good comprehension
group may account for less consumption of bread and cereal by these
individuals.

67
TABLE XXIILEAST-SQUARES ANALYSIS OF VARIANCE, WITH UNEQUAL
SUBCLASSES: BREAD-CEREALEATING PRACTICES
Bread/cerea1 Eating Practices
Source of Variance
Degreesof
FreedomSum of Square
MeanSquare F
Total 99 364.64
Number of children 4 11.82 2.95 0.77
4-H participation 1 5.12 5.12 1.34 d
Home demonstration 1 5.00 5.00 1.30 d
Home economic training 3 11.79 3.93 1.03
Level of education 6 12.16 2.03 0.53
State 2 9.43 4.71 1.23
Area 2 6.38 3.19 0.83
Schooling 1 1.59 1.59 0.41
Employment status 1 0.41 0.41 0.11
Family income 6 5.20 0.87 0.23
Age of oldest child 1 0.06 0.06 0.02
Homemaker's age 1 6 .47 6.47 1.70 d
Monthly food expense 1 1.45 1.45 0.38
Error 69 2.63.87 382.42
a - Significant at the .01 level; h - significant at the .05 level; c - significant at the .10 '.Level; d - significant at the .25 level.

68
f. Food Avoidance;
The respondents were asked if they avoided any foods and what
were the reasons,if any. Just above one-half of the total sample
indicated they avoided having some foods (52 percent). The lowest
proportion of homemakers who avoided foods were in the poor compre~
hension group. There was a slight difference in the percentages
in the fair and good groups (Table XXIII).
TABLE XXIII
A COMPARISON OF HOMEMAKERS BY LEVEL OF COMPREHENSION OF SOME BASIC ELEMENTS IN HUMAN NUTRITION
ACCORDING TO FOOD AVOIDANCE,LOUISIANA, 1971
Level of ComprehensionAvoid Foods No. %
Do Not Avoid Foods No. %
TotalN=100
Poor N = 14 5 36 9 64 14
Fair N = 63 35 56 28 44 63
Good N = 23 ’ 12 52 11 48 23
Sweets, desserts, and bread were the foods most frequently
avoided by the homemakers. The reason given was weight control. When
broken down according to their level of comprehension, it was found
that 30 percent of the homemakers who avoided bread fell into the
good comprehension category as compared with 24 percent, and 14 percent
69ill the fair and poor comprehension groups respectively. This be
havior might account for and support the findings which indicated
that the poor comprehension homemakers got their daily requirements
of bread and cereal, while the good comprehension homemakers did not
because of weight control.
Vegetables were avoided by 25 percent of the total sample, and
the main reason was that either the homemaker or her family did not
like them. For the same reasons, meat was avoided by 12 percent
of the total sample. It was noticed that 4 percent of the homemakers
avoided eating fish and its products due to the recent discovery of
mercury contamination (Table XXIV).
G . Attitudes:
As mentioned earlier in Chapter I, Attitudes were defined as:
learned predispositions which influence or govern the way the person
feels, thinks, reacts, and behaves toward things and people in his
environment.
Attitudes have five common dimensions: direction, degree, strength
or intensity, salience, and coherence or- consistency. This study deals
with the strength or intensity of attitudes. It refers to the degree
of conviction with which an attitude can become the basis for action.
a. Intensity o_f attitudes of the homemakers toward foods:
Intensity of attitudes of the homemaker toward foods consumed
during the*24-hour recall period were determined by presenting eleven
reasons which might influence the individual to select foods.

TABLE XXIVA COMPARISON OF HOMEMAKERS BY LEVEL OF COMPREHENSION OF SOME BASIC
ELEMENTS IN HUMAN NUTRITION ACCORDING TO SEASONS FOR FOOD AVOIDANCE. LOUISIANA, 1971
Reasons for Food Avoidance
F O O D S
Milk MeatsVegetables
BreadSweets F ish Beverage
TotalNo. % No. % No. 7, No. 7c, No. % No. 7o
Fcor Comprehension N = 14 - - - - - - - - - - - - -
Medical - - - - 1 7 - - - - - - 1
Do not like it - - 1 7 2 14 - - - - 1 7 4
Family does not like it - - - - - - - - - - - - -
Weight control - - - - - - 2 14 - - - - 2
Contamination - - - - - - - - - - - - -
Health problems - - - - - - - - - - - -
Others - - - - - - - - - - - - -
Do not avoid 14 100 13 S3 11 79 12 86 14 100 13 93
70

TA3LE XXTvT - continuedF O O D S
Reasons for Food Avoidance
Milk MeatsVegetables
BreadSweets Fish Beverage
TotalNo. % No. % No. *//o No. % No. % No. <7//a
Fair Comprehension N = 63
Medical - - - - 1 2 3 5 - - - - 4
Do not like it 1 2 5 8 6 10 - - - - 1 2 13
Family does not like it - - 3 5 8 13 1 2 - - - - 12
Weight control 1 2 - - - - 15 24 - - - - 16
Contamination - - - - - - - - 4 6 - - 4
Health problems 2 3 - - - - - - - - 1 2 3
Others - - 1 2 - - - - - - 1 2 2
Do not avoid 59 94 54 86 48 76 44 70 59 94 60 95
71

TABLE XXIV - continuedF O O D S
Reasons for Food Avoidance
Milk MeatsVegetables
BreadSweetsiN O . /o
Fish BeverageTotal.No. /o No. % No. % No. <v.'•3 No. %
Good Comprehension N = 23
Medical - - - - 1 4 - - 1 4 - - o
Do not like it 2 a«/ 1 4 - - - - - - - - 3
Family does not like it - 1 4 5 22 - - - - - - 6
Weight control - - - - 1 4 7 30 1 - - Q
Contamination - - - - - - 1 4 - - - - 1
Health problems - - - - - - - - - - 2 9 2
Others - - - - - - - - - - - - -
Do not avoid 21 91 21 91 16 70 15 .65 23 100 21 91
72

73
She was aslced to indicate to what extent she was influenced by each
reason--did it influence her "much," "some," "little or none"? A
score was given to every measurement--2 for "much," 1 for "some,"
and zero for "little or none." The average was calculated for all
scores given to a given attitude and was considered to be the inten
sity of that particular attitude. All averages were coded into four
categories: "much" (2 - 1.5), "some" (1.4 - 1), "little" (.9 - .1),
and "none" (zero).
The reasons included in this study which might influence the
individual to have foods were: the homemaker likes it, the family
likes it, convenient, economic, healthy, special occasion, habit, happen
to have it, weight control, diet, and weather. Data revealed that
"personal and family preference," "conveniency," "healthy," and "eco
nomics" are the more intensive attitudes of the homemakers toward foods.
The attitudes which affected them least were: "dieting," "weather,"
"weight control," '.'special occasion," "habit," and "happen to have it."
When divided by their level of comprehension, there was a slight
difference between the three groups with regard to personal and family
preference. The attitude of the homemakers toward foods being
healthy was stronger among the good and fair comprehension groups
(17 percent and 13 percent, respectively) than in the poor comprehension
group (zero percent). Thirteen percent in the good comprehension
group, 14 percent in the fair, and only 7 percent in the poor group
were influenced to choose the food by habit. It seems that the homemakers
in the good and fair groups were influenced to choose foods because of
health reasons, and thus habits were formed on this basis (Table XXV).

TABLE XXVA COMPARISON OF HOMEMAKERS BY LEVEL OF COMPREHENSION OF SOME BASIC ELEMENTS IN HUMAN
NUTRITION ACCORDING TO INTENSITY OF ATTITUDES TOWARD FOODS, LOUISIANA, 1971
Level of Comprehension
Poor N - 14 Fair N = 63None Littie Some Much None Little Some Much
Attitudes No. % No. c//o No. % No . % No. % No. % No. % No. %
Homemaker likes it - - 3 21 5 36 6 43 5 8 10 16 21 33 27 43
Family likes it • 1 7 4 29 3 21 6 43 11 18 21 33 15 24 16 25
Convenient 6 43 6 43 1 7 1 7 11 18 32 51 11 18 9 14
Economic 7 50 5 36 1 7i 1 7 25 40 27 43 8 13 3 5
Healthy 6 43 6 43 2 14 - - 15 24 25 40 15 24 8 •13
Special Occasion 12 86 2 14 - - - - 36 57 21 33 3 5 3 5
Habit 5 36 8 57 1 7 - - 29 46 25 40 7 11 2 3
Happen to have the food
3 21 10 71 - - 1 7 23 37 33 52 5 8 2 - 3
Weight control 11 79 2 14 - - 1 7 48 76 11 18 2 3 2 3
Diet 12 86 1 7 x / - - 59 94 3 5 - - 1 2
Weather 9 64 4 29 - - 1 7 56 89 7 11 - - - -

TABLE XXV “ continuedLevel of ComprehensionGood N = 23______ Total N = 100
Attitudes 9None No. %
Little No. %
Somi No.
Ok
7=MuchNo. /c None Little Some Much
Homemaker likes it 1 4 '5 22 4 17 13 57 6 18 30 46
Family likes it 4 17 4 • 17 8 35 7 30 16 29 26 29
Convenient 3 13 9 39 4 17 7 30 20 47 16 17
Economic 4 17 10 44 7 30 2 9 36 42 16 6
Healthy 3 13 8 35 8 35 4 17 24 39 25 12
Special occasion 14 61 9 39 - - - - 62 32 3 3
Habit o> 39 11 48 x ' 4 2 9 43 44 9 4
Happen to have the food 7 30 11 48 2 9 3 13 33 54 7 6
Weight control 15 65 6 26 2 9 - - 74 19 4 3
Diet 20 87 1 4 1 /,*T 1 4 91 5 2 2
weather 16 70 6 26 - - 1 4 81 17 - 2
75
76
b. Factors affecting and the correlations between attitudes
and other independent variables:
The thirteen independent variables mentioned earlier were
tested for their significant effect on every reason for which the
respondent might have chosen the foods. Correlations between each
of the eleven reasons for eating the foods and the independent
variables were determined, also. Factors affecting attitudes and
the correlations between attitudes and other independent variables
are discussed in 4 sections:
. 1) Personal and family preference.
2) Convenience, economic, and health.
3) Special occasion, habit, and happen to have the food.
4) Weight control, dieting and weather.
Personal and Family Preference:
The factors that affected the homemaker's preference of foods
were: area was significant at the .10 level, employment status and
food expense were significant at the .25 level. Coming from urban
areas, having full-time job, and less expensive foods affected the
personal preference of the homemaker to choose certain foods. This
result was supported by the existence of significant association
between personal.preference of foods, and area at .01, employment status
at .25, and food expense at the .05 (Table XXVI). Strong personal
preference for foods was associated with urban homemakers and those
who had full-time jobs more than rural or farm homemakers and those

who did not have a full-time job. "Personal preference" of the food
increased when the price was less expensive. A significant association
was found between "personal food preference" and former 4-H club
membership at the .25 level. Eating foods due to a "personal pre
ference" was associated with former 4-H club membership (Table XXVII).
The factors that affected the homemaker to have foods because
of her family's "preference of foods" were: schooling and food
expense both significant at the .05 level and former participation
in home demonstration significant at the .10 level. These findings
were supported by the existence of significant associations between
family preference for the food and homemaker's schooling at the
.25 level, food expense at the .05 level, and former home demonstration
membership at the .25 level. Homemakers who were not attending school
considered their family preference for the foods more than those
who were attending. This could be due to the time element which
does not allow the student homemaker to spend much time on food pre
paration in comparison with the full-time homemaker. Less expensive
foods were preferred by the family. Homemakers who were former
members of home demonstration clubs gave more consideration to foods
preferred by their families than non-former members.
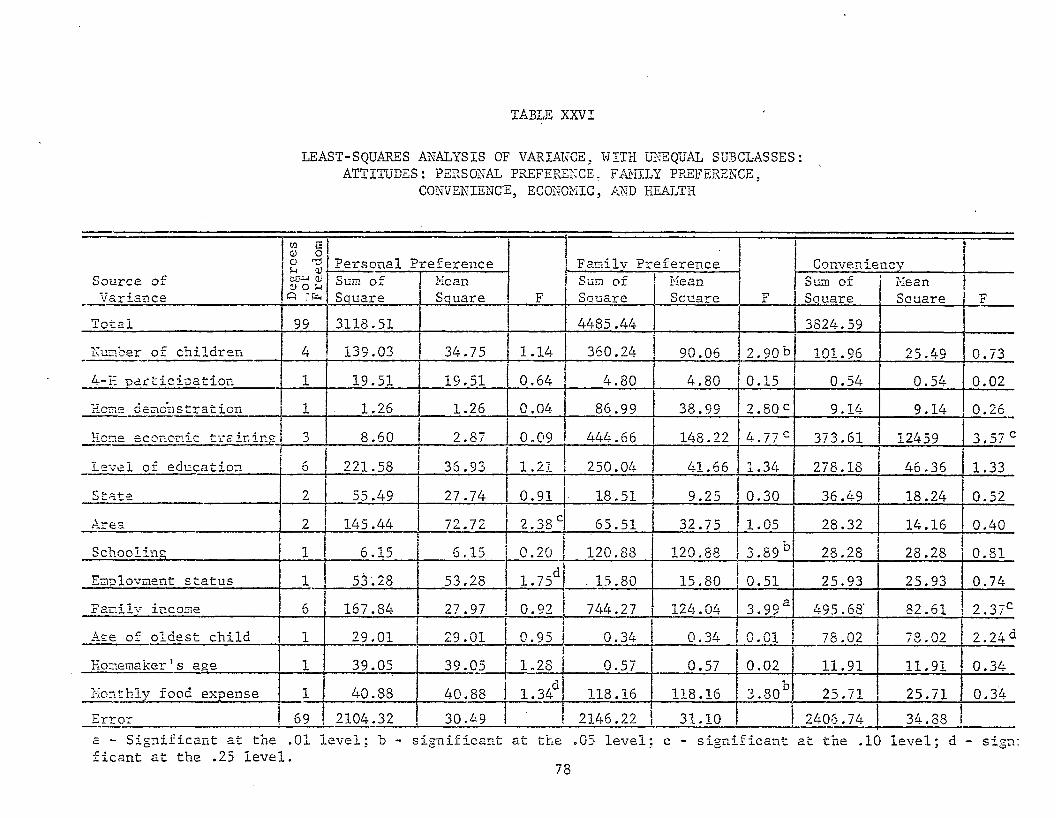
TABLE XXVI
LEAST-SQUARES ANALYSIS OF VARIANCE, WITH UNEQUAL SUBCLASSES: ATTITUDES: PERSONAL PREFERENCE. FAMILY PREFERENCE,
CONVENIENCE, ECONOMIC, AND HEALTH
Source of Variance De
grees
• .of Free
dom
Personal Preference Family Preference ConvenieneySum of Square
MeanSquare F
Sum of Square
MeanSquare
iF
Sum of Square
MeanSquare F
Total 99 3118.51 4485.44 3824.59Number of children 4 139.03 34.75 1.14 360.24 90.06 2,90b 101.96 25.49 0.734-H participation 1 19.51 19.51 0.64 4.80 4.80 0.15 0.54 0.54 0.02Hctne demonstration 1 1.26 1.26 0,04 86.99 38.99 2.80 c 9.14 9.14 0.26Hone economic training o 8.60 2.87 0.09 444.66 148.22 4.77 c 373.61 12459 3.57 cLevel of education 6 221.58 36.93 1.21 250.04 41.66 1.34 278.18 46.36 1.33State 2 55 .49 27.74 0.91 18.51 9.25 0.30 36.49 18.24 0.52A.rea 2 145.44 72.72 2.38 c 65.51 32.75 1.05 28.32 14.16 0.40Schooling 6.15 6,15 0.20 120.88 120.88 3.89 D 28.28 28.28 0.81Eaplovment status l 53.28 53.28 1.75d . 15.80 15.80 0.51 25.93 25.93 0.74Family in.corne 6 167.84 27.97 0.92 744.27 124.04 3.99 a 495.68' 82.61 2.37cAge of oldest child 1 29.01 29.01 0.95 0.34 0.34 0.01 78.02 78.02 2.24 dHomemaker's age 1 39.05 39.05
i
1.28 0.57 0.57 0.02 11.91 11.91 0.34Monthly food expense 1 40.88 40.88 1.34a 118.16 118.16 3.80b 25.71 25.71 0.34Error 69 2104.32 30.49 I 2146.2 2. 31.10
i! 2406.74 34.88
a - Significant at the .01 ficant at the .25 level.
level; b - significant at the .05 level: significant at the .10 level; d - sign:78

TAEi:Z XXVI - continued
Source of Variance
Economic
F
Health
FSum of Square
MeanSquare
Sum of Square
MeanSquare
Total 2726.24 3420.59Number of children 38.70 9.67 0.38 143.47 35.87 1.244-H participation 17.80 17.80 0.69 0.08 0.08 0.003Home demonstration 29.09 29.09' 1.13 8.11 8.11 0.28Hone economic training 215.21 71.73 2.78 b 465.2S 155.09 5.38 aLevel of education 373.72 62.30 2.42 b 136 .96 22.82 0.79State 21.60 10.80 0.42 24.85 12.42 0.43Area 84.96 42.48 i.64d 130.11 65.05 2.26 dSchooling 9.01 9.01 0.35 22.43 22.43 0.78Employment status 0.49 0.49 0.02 38.44 38.44 1.33 dFamily income 331.29 55.21 2.14 C 491.87 81.98 2,84 °
Ase of oldest child 33.50 33.50 1.30 3.98 3.98 0.14Homemaker's age 93.42 93.42 2.63 c 5.09 5.09 0.18Monthly food expenses 45.16 45.16 1.75 d 0.02 0.02 0.0008Error 1777 .67 25.70 1988.43 28.81
a - significant at the .01 level; b - significant at the .05 level; c - significant at the .10 level; a - signi ficant at the .25 level.
79

TABLE XXVIICORRELATION COEFFICIENT BETWEEN HOMEMAKER'S ATTITUDES TOWARD
FOODS AND THIRTEEN INDEPENDENT VARIABLES
IndependentVariables
PersonalPreference
FamilyPreference Conveniency Economic Healthv
SpecialOccasion
Number of children -0.11 -0.03 -0.11 -0.03 -0.02 -0.064-H participation 0.13 d 0.11 0.07 0.04 0.14 d 0.15 dHome demonstration 0.05 0.12 d 0.003 0.09 0.17 c 0.06Home economic training 0.01 0.04 0.16 c ?
! i-* o 0.16 d 0.02
Level of education 0.11 0.14 d 0.15 d 0.11 0.10 0.16 dState 0.11 0.12 d 0.05 0.03 0.05 0.02Area a
0.25 0.10 0.11 0.11 0.11 d0.14Schooling 0.06 0.12 d 0.10 0.06 0.07 0.06Eno1ovment status 0.12 d 0.09 0.22 b 0.08 0.12 d 0.04Familv income 0.02 0.07 0.11 0.02 0.13 d -0.04Age of oldest child -0.05 -0.05 -0.04 -0.05 0.01 -0.11Homemaker’s age -0.05 0.08 0.05 -0.02 0.13 d -0.07Monthly food expense -0.20 b -0.21 b -0.12 d ..-0..1Q ... -0.07 -0.09
a - Significant at the .01 level; b - significant at the .05 level: c - significant at the .10 level; d - significant at the .25 level.
80

TABLE XXVII - continued
IndependentVariable Habit
Happen to Have the Food
WeightControl Dieting Weather
Humber of children 0.11 d -0.07 -0.01 -0.13 d 0.034-H participation 0.004 0.10 0.05 -0.03 -0.05Home demonstration 0.13 d 0.09 0.03 0.20 b 0.06Hone economic training 0.15 d 0.003 0.003 0.04 0.04Level of education 0.08 0.03 0.08 0.10 0.11State 0.02 0.15 d 0.02 0.10 0.11Area 0.26 a 0.09 0.06 0.02 0.07Schooling 0.04 0.11 0.13 d 0.01 0.09Ennlovment status 0.11 0.05 0.03 0.02 0.05Family income -0.03 J O M 0.06 0.05 0.04A.s.e of eldest child 0.02 -0,07
13CMr-1
o
1
-0.03 0.02Homemaker’s age -0.11 -0.01 0.05 -0.07 0.12 dMonthly food expenses • 0.10 -0.08 0.07 0.07 0.04
a - Significant at the -01 level; b - significant at the .05 level; c - significant at the .10 level; d - significant at the .25 level.
81
Other significant factors that affected the homemaker to have
foods due to her "family preference" were: number of children at
the .05 level, formal training in home economics at the .10 level,
and income at the .01 level. Homemakers who had three children and
those who had formal home economics training in college and high
school considered their "family preference" of foods more than other
homemakers. This could be due to the fact that families with three
children consider the children's desire of foods due to their age
and consumption of the same food as the adult family members. Home
makers with family income between $4,000 to $6,000 gave more con
sideration to their "family preference" of foods. There was no
significant association between "family preference" of foods and any
of the variables mentioned above (Table XXVII).
Two significant associations existed between "family preference"
of foods and the homemaker's education ancUstate from which she came
at the .25 level. Giving more consideration to "family preference"
of foods by the homemaker was associated with those who came from
Louisiana and homemakers who had better levels of education (Table
XXVII).
2., Convenience, Economic, and Health:
The factors that caused the homemakers to have food because
it was "convenient" were: formal home economic training and income
at the .05 significance level, and age of children at the .25 level.

83
Homemakers who had formal training in home economics were influenced
more by food convenience in their choice of meals (Table XXVI). This
result was supported by a positive significant association between
food conveniency and receiving formal home economics training at the
.25 level (Table XXVII).Differences were found among the various income
categories. Homemakers with family income between $4,000 and less
than $6,000 were influenced by ’’food convenience" more than those
with lower or higher income. The older the children were, the more
the homemaker was influenced to have convenience foods. This was
expected since those homemakers have other responsibilities and thus
prefer to use "convenient" foods. At the .25 level of significance,
a negative association existed between "convenience" and food expense,
and a positive association between the same attitude and education was noted
at the same level. Another association was found between "convenience"
and employment status at the .05 significant level. Full-time employed
homemakers, higher level of education, and less expensive foods were
associated with having convenient meals. Since "convenient foods"
are handy and do not need much preparation, working homemakers are
influenced to use them.
At the .05 level of significance formal home economics training
and education were found to affect the homemaker to have "economic
foods." The more formal home economics training the homemaker received,

84
and the better level of education she had, the more she was influenced
to use "economic foods." This indicated that the homemaker put into
practice what she had learned in school.
Income and age were found to affect the homemaker significantly
at the .10 level. Those with family income between $4,000 and $6,000
were influenced to have "economic foods" more than those who had
lower or higher incomes. Younger homemakers were less influenced by
"food economy" than older homemakers.
At the .25 level of significance area and food expense were
found to affect the homemaker's choice of "economic foods." Urban
homemakers planned more economic meals than did the farm or rural
homemakers (Table XXVI).
None of the thirteen independent variables had significant assoc
iations with "economic foods" (Table XXVII).
There were four factors that had significant affect on the home
maker to have a food because it was "healthy." Formal training in
home economics at the .01 level, income at the .05 level, job and
area at the .25 level. Homemakers who had full-time jobs and those
who received formal home economics training both in high school and
college were influenced to have a particular food because it was
"healthy" more than those who did not have full-time jobs and had
less or no formal home economics training. Homemakers who came from
rural or urban areas and had family income between $4,000 and $6,000
85
a year, chose food because of its "healthy" effect more than farm
homemakers and those who had lower or higher income (Table XXVI).
These findings were supported by the existence of positive
significant associations between having "healthy" foods and receiving
formal home economics training, their income and employment status at
the ,25 level (Table XXVII).
Other significant associations were found between homemaker's
age and former membership in 4-H at the .25 level, and former partici
pation in home demonstration clubs at the .25 level. Former 4-H
and home demonstration club’ members and older homemakers considered
"healthy" foods more than non-former members and younger homemakers.
3. Special occasion, habit, and happen to have the food;Area was a factor that significantly affected and related
(at the .25 level) to the homemaker choice of foods due to the fact
that it was a "special occasion." Rural homemakers were affected more
than those who came from urban or farm areas. This result was supported
by a significant association between rural residence and having foods
because of "special occasions" at the .25 level.
There were significant associations between foods eaten on
"special occasions" and education and former 4-H club membership at
the .25 level. The influence of having foods due to a "special occasion"
was stronger among those who were former members of 4-H clubs and had %
higher levels of education (Table XXVII).

TABLE XXVIIILEAST-SQUARES ANALYSIS OF VARIANCE, WITH UNEQUAL SUBCLASSES: ATTITUDES:
SPECIAL OCCASION, HABIT, AND HAPPEN TO HAVE THE FOOD
Source of Variance
to a0! O a)̂ <u Special Occasion
F
HabitF
Happen to have the food
Fco M-i or o o u Q p*
Sum of Mean Square Square
Sum of Sauare
MeanSquare
Sum of Square
MeanSquare
Total 9S 746.91 2211.79 2170.00Number of children 4 10.52 2.63 0.31 37.17 9.29 0.47 80.85 20.21 0.974-H participation 1 5.82 5.82 0.69 0.66 0.66 0.03 55.62 55.62 2 .6 6 c
Home demonstration 1 10.08 10.08 1.19 0.76 0.76 0.04 34.83 34.83 , r,d1 4 ̂ •Hone economic training 3 7.64 2.54 0.30 70.14 23.38 . 1.17 98.61 32.87 1.57dLevel of education 6 40.42 6.73 0.80 135.35 22.55 1.13 276.28 46.04 2 .20°State 2 5.16 2.58 0.30 2.27 1.13 0.06 52.54 26 .27 1.26Area 2 28.28 14.14 1.67d 13S.83 69.41 3 .48b 11.30 5.65 0.27Schooling 1 1.50 1.50 0.18 3.24 3.24 0.16 9.09 9.09 0.43Employment status 1 0.01 0.01 0.001 0.06 0.06 0.003 21.05 21.06 1.01Family income 6 30.58 50.96 0.60 319.77 53.24 0 £• 7 k s. # O / 179 .22 29.87 1.43dAge of oldest child 1 2.27 2.27 0.27 18.10 18.10 0.91 57 .96 57.96 7 7 7
Homemaker's age 1 6.54 6.54 0.77 86.78 86.78 4.34b 7.40 7.40 0.35Monthly food expense 1 0.004 0.004 O.OOOaI 0.36 0.36 0.02 6 .17 6.17 0.30Error 69 i 583.20 8.45 L1378 . 07 19.97 1442.10 20.90
a - Significant at the .01 level; b - significant at the ,05 level; c - significant at the .10 level; d - significant at the .25 level.
86
At the .05 level of significance, it was found that the area>
income, and homemaker's age affected her having foods because of
"habit." Older, farm homemakers, and those with family income
between $4,000 and $6,000 had foods because of "habit" more than
younger, urban or rural homemakers and those with lower or higher
incomes. A significant association was found between "food habits"
and farm residence at the .01 level and therefore the above finding
is supported. According to this finding, it seemed that food
habits were more established as the individual got older (Table
XXVII).
Significant associations existed between "food habits" and
number of children, former home demonstration membership and
formal home economics training at the .25 level (Table XXVII). Home
makers with more children had foods more because of their "habits."
This result corresponds with the age effect on "food habits" since
homemakers with more children are expected to be older than those
with fewer children. Non-former home demonstration members were
influenced to have foods due to their "habit" more than former
members. Also the higher level of formal home economics training
the less the homemaker's consumption of foods as "a habit." It
seems that she is more influenced by other factors.
Education was found to affect the homemaker to have foods
because she "happen to have it." This factor was significant at
the .05 level and affected homemakers who had lower educational

88
level more than those who had higher levels of education (Table
XXVIII).
Former participation in 4-H clubs and children's ages were
found to affect the homemaker at the .10 level of significance.
Former 4-H members and those who had older children had foods be
cause they "happen to have it" more than non-members and homemakers
with younger children.
At the .25 level of significance it was found that former parti
cipation in home demonstration clubs, formal home economics training
and income affected the homemaker. Regarding family income between
$4,000 and $6,000, homemakers who were not members in home demon
stration, and those who had formal training in home economics had
foods which they "happen to have" more than lower and higher income
homemakers, former members in home demonstration and those who re
ceived no formal home economics training. The only significant assoc
iation was found between state and consuming foods for "its presence
in the home" at the .25 level. Homemakers who came from Louisiana
were affected by this factor more than those who came from other
parts of the country (Table XXVII).
4. Weight Control, Dieting, and Weather;
At the .05 level of significance, it was found that number and
age of children, and area affect the homemaker to have food for
"weight control." Rural homemakers who have older and one or three

89
children watch their weight more than those who come, from urban or
farm, areas and have youngei* children or do not have children. The
effect of children's age on the homemaker's "weight control" was
supported by a positive significant association between age of
oldest child and having foods for "weight control" at the .25 level.
Formal home economics training affected the homemaker significantly,
at the .25 level, to have certain foods because of "weight control."
Respondents who received formal training in both high school and
college had foods because of "weight control" more than high school
trainees or those who had no training (Table XXIX).
There was a significant association between "weight control"
and schooling at the .25 level. Homemakers who were not attending
school had foods for "weight control" more than those who
were in school (Table XXVII).
Number of children affected the homemaker, significantly at the
.25 level, to have food for "dieting" reasons. Homemakers with no
children had foods for "special diets" more than those who had
children. This is supported by a negative significant association
between "dieting" and number of children at the .25 level.
It was found that area, at the .10 level, state and food expense
at the .25 level affected the homemaker's diet. Respondents who came
from rural areas, Louisiana residents and those who spent more money
on foods had "special diets" more than other homemakers (Table XXIX).

TABLE XXIXLEAST-SQUARES ANALYSIS OF VARIANCE, WITH UNEQUAL SUBCLASSES: ATTITUDES:
WEIGHT CONTROL, DIETING, AND WEATHER
Source of Variance
IB S o c o - a Weight Control
p
Diet ing
F
Weather
P 1
t o w O CD O Ur> r.r ,
Sum of Square
MeanSquare
Sum of Square
Ms an Square
Sum of Square
MeanSquare
Total 99 1476.84 854.11 622.04Number of children 4 171.04 42.76 2.87 b 51.44 12.88 1.43 a 13.96 3.49 0.474-H pa rt ic it a t ion 1 9.74 5.74 0.65 0.07 0.07 0.008 0.14 0.14 0 . 0 2
Home demonstration 1 5.43 5.43 0.36 5.91 5.91 0.66 0.42 0.42 0 .06Home economic training 3 83.25 27.75 d1.86 35.75 11.72 1.32 5.82 1.94 0.26Level of education 6 83.25 13.37 0.93 21.18 3.19 0.39 33.57 5.59 _0 , / 6State 2 22.63 11.31 0.76 27.97 13.98 1.55d 25.66 12.83 1.74dArea 2 100.74 50.37 b3.38 47.55 23.77 2.64c 9.39 4.69 0.64Schooling x 15.48 15.48 1.04 9.60 9.60 1.07 3.04 3.04 0.41Emplovr.ent status 1 0.09 0.09 0.006 5.42 5.42 0.60 2.54 2.54 0.35Fsmilv income 6 42.80 7.13 0.48 24.99 4.16 0.46 11.76 1.96 0.27Age of oldest child 1 75.66 75.66 5.08 13 5.90 5.90 0.65 0.04 0.04 0.006Homemaker's age 1 2.63 2.63 0.18 1.41 1.41 0.16 0.93 0.93 0.13Monthly food expense 1 8.27 8.27 0.55 20.28 20.28 d2.25 0.007 0.007 0.001Error 69 1028.11 14.9 621.66 9.01 508.15 7.36
*
a - Significant at the .01 level; b - significant at the .05 level; c - significant at the .10 level; d - significant at the .25 level
90

91
A significant association was found between former participation
in home demonstration and "dieting" at the .05 level. "Special diets"
were associated with former participants in home demonstration clubs
Table XXVII).State was found to have a significant affect, at the .25 level,
on the homemaker consumption of food because of the "weather." Home
makers who came from Louisiana are affected by the "weather" in
their choice of foods more than those who came from other parts of
the U.S. (Table XXIX).
A significant association was found at .25 level, between age
and having foods to suit the "weather." Younger age was associated
with the consumption of certain foods specifically because of hot
"weather" (Table XXVII).
On the whole the attitudes that affected the homemakers most
to have foods were "personal" and "family preference," "convenience,"
and "health." .
The factors that affected attitudes and the correlation between
attitudes and other independent variables were similar. On the whole
these were: formal and informal education; culture and background
of the homemaker; full-time job; food expenses; and age and number
of children.
D • The correlation between comprehension, eating practices, and
attitudes:
One of the objectives of this study was to test the correlation

between comprehension, eating practices, and attitudes. This section
includes three parts:
a. The correlation between comprehension and eating practices.
b. The correlation between comprehension and attitudes.
c. The correlation between eating practices and attitudes.
a. The Correlation Between Comprehension and Eating Practices:
The eating pattern of the homemaker during a 24-hour recall
period was considered her eating practices. The correlation coefficient
between comprehension and the number of servings consumed from each
of the basic four food groups was determined.
Findings showed that there was positive significant correlation
between comprehension and milk consumption at the .10 significant
level. At the same level there was negative significant correlatipn
between comprehension and bread eaten. These correlations support
the findings on the scores of the milk and bread comprehension and
the amount consumed from each by the homemaker* These findings
indicated that milk consumption increased when the score on milk
comprehension got better. In the meantime, bread consumption de
creased when the homemakers had better understanding of this food
group. The reason was weight control.
The correlation between comprehension and the meat group, and
vegetable group, was not significant at the .25 level (Table XXX).

93
TABLE XXXCORRELATION COEFFICIENT BETWEEN lTOMEMAKER'S
COMPREHENSION ANJ) EATING PRACTICES
i i 1 } i Comprehension
I
Eating Practices
Milk Me a t Vegetable/Fruits
Bread/Cereal
0.18 c -0.05 0.009 0COo1
a - Significant at the .01 level; b - significant at the .05 level; c - significant at the .10 level; d - significant at the .25 level.
b. The Correlation Between Covnprehens 1 on and Attitudes :
At the .01 level of significance a positive correlation was
found between comprehension and "having foods because it was con
venient," "economic," and "healthy." A better level of comprehension
was associated with homemakers who were strongly influenced to have
foods because of these reasons.
At the .05 level a positive significant correlation was found
between comprehension and consuming foods because "they happen to
have it." The same correlation was found between comprehension and
"weight control" and "dieting" at .25 level (Table XXXI).

TABLE XXXICORRELATION COEFFICIENT BETWEEN HOMEMAKER1S
COMPREHENSION AND ATTITUDES
A T T I T U D E S
o1—iis
PersonalPreference
FamilyPreference
Convenient Economic Healthy
SpecialOccasion Habit
Happen to
Have ItWeightControl Dieting; Weather
r ,Cjrt-iCU 0.01 0.08a
0.28a
0.29a
0.36 0.08 0.11b
.0.20d
0.13d
0.13d
0.16
a - Significant at the .ol level; b - significant at the .05 level; c - significant at the .10 level; d - significant at the .25 level.

95
c • The Correlation Between Eating Practices and Attitudes:
Correlation coefficients were determined between the number
of servings consumed from each of the four food groups and each of
the eleven study reasons for having foods.
At the .05 level of significance, a positive correlation was
found between milk consumption and "having it because it was healthy"
and "habit" (Table XXXII).
These correlations support the findings on factors that
influenced the homemakers most to have foods.
With regard to meat and meat substitutes, the significant
correlation was negative between meat servings and "having it due
to its convenience, "happen to have it" (at the .05 level),
"weight control," and "weather" (at the .25 level). The scores
on meat and meat substitutes indicated that the homemakers were well
informed about this food group. From these correlations, it seems
that they planned to have meat in the diet regardless of other factors.
A positive correlation was found between eating meat and food
habits at the .25 level of significance (Table XXXII).
The correlation between eating practices of vegetables and
"personal preference" was positive and significant at the .25 level.
This means that more consumption of vegetables and fruits is assoc
iated with strong personal preference for these foods.

TABLE XXXIICORRELATION COEFFICIENT BETWEEN HOMEMAKER'S EATING PRACTICES
AND ATTITUDES
9
EatingPractices
PersonalPreference
FamilyPreference Convenient Economic Healthy
Milk and milk bproducts 0.0073 0.05 -o.os -C .004 0.22
Meat and meat ' bsubstitutes -0.03 0.07 -0.24 -0.09 0.06
Vegetable/ a 3.
fruits 0.15 0.26 -0.08 -0.05 0.28
d a b cBread/cereal 0.02 -0.15 -0.25 -0.20 -0.19
a - Significant at the .01 level; b - significant at the .05 level; c - significant at the .10 level d - significant at the .25 level.

TABLE XXXII - Continued.
EatingPractices
I
SpecialOccasion Habit
Happen to Have the Food
WeightControl Dieting Weather
Milk and milk bproducts -0.07 0.20 -0.02 -0.08 -0.03 -0.04
Meat and meat d b d dsubstitutes -0.03 0.12 -0.21 -0.16 -0.009 -0.11
Vegetable./ d afruits -0.03 0.11 -0.04 -0.12 -0.25 -0.02
c c a d dBread/cereal -0.10 0.17 -0.17 -0.31 -0.16 -0.15
a - Significant at the .01 level; b - significant at the .05 level; c - significant at the .10 level; d - significant at the .25 level.
97

There was a positive significant relationship between eating
vegetables and fruits, and "family preference" and "having it
because it was healthy," at the .01 level. This correlation
supports the finding that the homemakers were affected most by
"health" when they made their choice of foods.
A negative significant correlation was found between con
suming vegetables and "weight control" and "dieting" at the .25
level for the former variable and at the .01 level for the latter.
It seems that homemakers who were on a "diet" and those who were
"watching their weight" ate less vegetables and fruits (Table XXXII).
There was significant correlation between bread consumption
and nine reasons for having foods. All the correlations were
negative and significant at different levels. These correlations
were: "convenience" and "weight control" (.01 level), "economic"
(.05 level), "health," "habit," and "happen to have it" (.10 level),
"family preference," "dieting," and "weather" (.25 level).
E . Sources of nutritional knowledge, the homemaker1s interests,
and the practical methods for nutrition education:
It was planned in this study to gain some information on where
the homemaker learned her nutritional knowledge; her interest in
participating in nutrition education programs; her desires and
needs of information with regard to some foods and nutrition pro-
blems; her contact with the Cooperative Extension Service and the
best method Extension might use to give her information. In this

99
section, results on these items are presented.
a . Sources of nutritional knowledge learned by the home
maker :
The homemakers were asked where or from whom they learned
most of their nutritional knowledge and whether or not there
were any other sources. Results indicated.that, the major source
of information was high school where about, two-thirds of the
total sample received their nutrition education. It should be
noted that nutrition information was obtained in. different
courses such as biology and physical education classes and not
necessarily in foods and nutrition-classes.
When divided by their level of comprehension, there was a
slight difference between the percentages of the homemakers in
the good (61 percent.) and fair (71 percent) comprehension groups,
but the difference was very great between these, two groups and
the poor comprehension group (36 percent).
The second main source of learned nutritional knowledge was
parents. About one-half of the total sample learned about feeding
their families from their parents. When broken down by the level
of comprehension, there was not much difference in the percentages
of homemakers in the three groups. Other important sources of
information were books, magazines and newspapers, television and
personal observations.

TABLE XXXIIIA COMPARISON OF HOME-MAKERS BY LEVEL OF COMPREHENSION OF
SO*£ BASIC ELEMENTS IN HUMAN NUTRITION ACCORDING TO SOURCE OF LEARNED NUTRITIONAL KNOWLEDGE.
LOUISIANA, 1971
Level of Comprehension
Sources of Learned Poor N = 14 Fair N = 63 Good N = 23Nutritional Ye. No Yes No Yes No Total N=100Knowledge No. % No. % No. 7c No. 7o No. 7. No. 7c No. 7=
High school 5 36 9 54 45 71 18 29 14 61 9 39
College 1 7 13 93 8 13 55 87 - - 23 100
High school and college 2 14 12 86 5 8 58 92 7 30 16 70
‘ Nursing school - - 14 100 1 2 62 98 . 1 4 22 96
Special classes 1 7 13 93 - - 63 LOO 2 9 21 91
4-H Club - - 14 100 6 10 57 90 3 13 20 87
Doctors 1 7 13 93 2 3 61 97 1 4 ' 22 96
Parents 7 50 7 50 31 49 32 51 11 48 12 52
Marriage.....
— 14 100 5 8 57 91 2 9 21 91
100

TAELS XXXIII - Continued
Sources of Learned Nutritional Knowledge
Level of Comprehens ion a.
Poor 1T = 14 Fair N = 63 Good N = 23Total N=100Yes • No Yes No Yes No
No. % No. °fto No. ~L No. No. % No. % No. %
Husband - - 14 100 1 2 62 98 - - 23 100
Friends 1 7 13 93 2 3 61 97 - - 23 100
Books 2 14 12 86 19 30 44 70 9 39 14 61
Magazines 3 21 11 79 24 38 39 62 9 39 14 61
Television 3 21 11 79 6 10 57 91 3 13 20 87
Others 2 14 12 86 2 3 61 97 - - 23 100
101
102
It was noticed that the homemakers In the poor comprehension
group when compared to the fair and good comprehension groups
learned their nutrition knowledge from parents and mass media more
than as a result of high school training (Table XXXIII).
b. The homemaker1s interest in participating in nutrition
educational programs and the best time for conducting
them:
The respondents were asked if they would be definitely, possibly,
or not interested in participating in a nutrition educational pro
gram if it were held in the'1 neighborhood free of charge. About
one-fourth of the total sample showed definite interest in partici
pating. Most of these were in the poor comprehension group. Over
one-half of the total sample indicated possible participation.
Most of these were in the fair comprehension group. Those who were
not interested made up one-fifth of the total sample and (36 per
cent) of them were in the poor comprehension group. It seems that
they need to be motivated to learn more about foods and nutrition
(Table XXXIV).
When asked about the best time for conducting such nutrition
educational programs, the answer of the majority of the homemakers
was during the evening and night (Table XXXIV).
c * The degree of interest of the homemaker in some nutritional
problems:
Ten foods and nutrition problems which might face the homemaker
in feeding her family were presented to every respondent. Each was

103
asked to Indicate whether she was very much interested, had some
interest, or had no interest in gaining more knowledge about each
problem. The data were coded and every respondent was given a
score according to the extent to which she was interested in the
ten problems. About half of the total sample showed little interest
in the ten problems and the other half indicated some or very much
interest (Table XXXV).
About three quarters of the total sample showed very much
interest in getting information on low cost meals. The highest
proportion was in the good comprehension group, and the lowest was
in the poor comprehension group. Planning adequate diets was the
second major interest. It seems that the poor comprehension home
makers felt a need with regard to planning adequate diets}hence
the majority showed very much interest in learning more about diets.
Infant and young children feeding were two problems that the
respondents showed very much interest in knowing more about. This
is expected since the majority of the sample was young and had
children in these age ranges. Less interest was shown for school
children and teen-age feeding since only a few had children in school.
Other nutritional problems such as low-calorie meals, nutrition
for pregnancy and lactation, and poor family food habits were given
considerable interest by the homemakers. The only problem that the *
respondents showed little interest in was diet for diseases. They
do not feel the need for it since they were probably not faced with
this problem at the time.

104
TABLE XXXIV
A COMPARISON OF HOMEMAKERS BY LEVEL OF COMPREHENSION OF SOME BASIC ELEMENTS IN HUMAN NUTRITION ACCORDING TO . PARTICIPATION IN NUTRITION PROGRAM AND THE
BEST TIME FOR CONDUCTING IT,LOUISIANA, 1971
Level of ComprehensionPoor N=14 Fair N=63 Good N=23 Total
No. % No. % No. % N=100. _
Participation:
Definitely 5. 36 11 18 7 30 23
Possibly 4 29 42 67 11 48 57
Not interested 5 36 10 16 5 22 20
Best Time:
Any time •m 1 2 1
Morning - - 6 10 2 9 8
Afternoon 1 7 9 14 4 17 14
Evening and nights 8 57 37 59 11 48 56
Other times - - - - 1 4 1
Not interested 5 36 10 16 5 22 20
Apart from a desire to gain more information on planning low cost
meals, the homemakers in the three levels of comprehension indicated
different interests. In the poor comprehension group, the information

desired more by the homemaker was on poor family food habits and
young and school children feeding. For the fair group, children
feeding at different ages, adequate diet planning, nutrition for
pregnancy and lactation, and planning low-calorie meals was the
information most desired. The good comprehension group had similar
needs (Table XXXVI).
TABLE XXXV
A COMPARISON OF HOMEMAKERS BY LEVEL OF COMPREHENSION OF SOME BASIC ELEMENTS IN HUMAN NUTRITION ACCORDING TO DEGREE OF INTEREST OF GAINING MORE KNOW
LEDGE ABOUT NUTRITIONAL PROBLEMS,LOUISIANA, 1971
Level of ComprehensionDegree of Interest
PoorNo.
N=14%
Fair N=63 No. %
Good N^TO No. %
Total N = 100
Little interest 10 71 24 38 14 61 48
Some interest 4 29 32 51 6 26 42
Very much int. err est - - 7 11 3 13 10
d. The practical methods 1?L .Riving nutrition education to
the homemakers:
The respondents were asked about the practicality of seven
methods of receiving information on foods and nutrition.
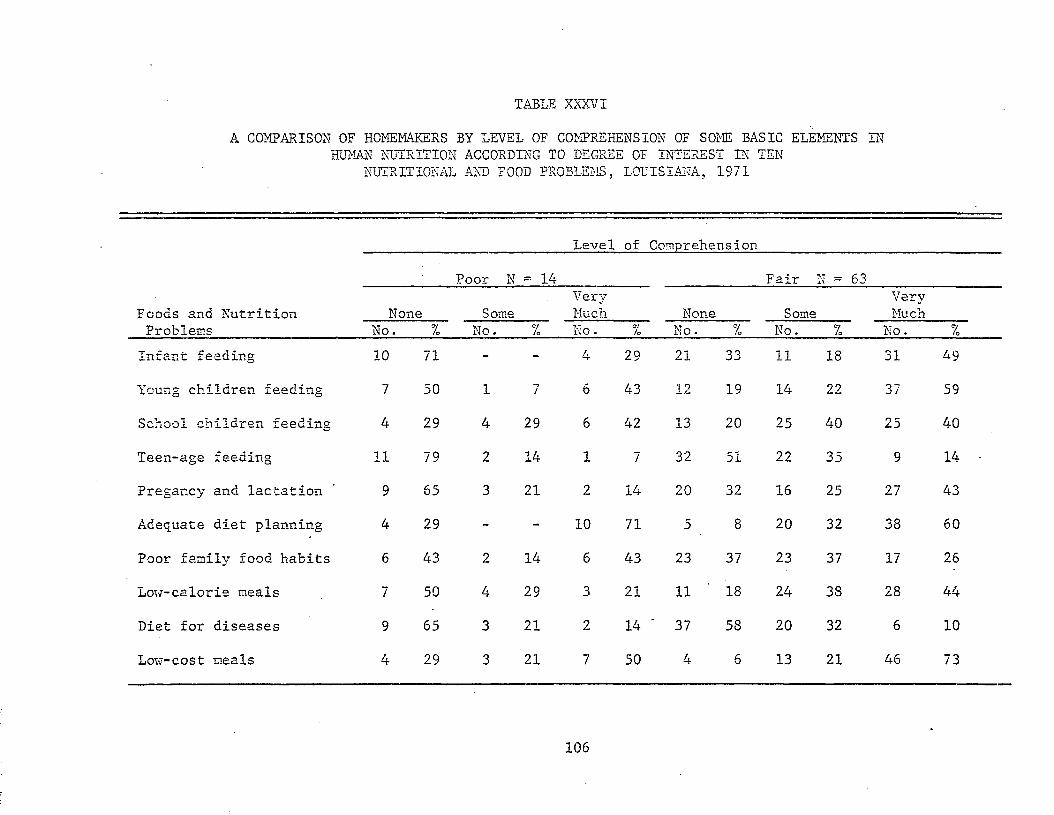
TABLE XXXVIA COMPARISON OF HOMEMAKERS BY LEVEL OF COMPREHENSION OF SOME BASIC ELEMENTS IN
HUMAN NUTRITION ACCORDING TO DEGREE OF INTEREST IN TEN NUTRITIONAL AND FOOD PROBLEMS, LOUISIANA, 1971
Foods and Nutrition Problems
Level of Compreheinsion
Poor N = 14 Fair 1i = 63
None SomeVeryMuch None Some
VeryMuch
No. % No. % No. c:/o No. % No. % No. %Infant feeding 10 71 - - 4 29 21 33 11 18 31 49
Young children feeding 7 50 1 —>! 6 43 12 19 14 22 37 59
School children feeding 4 29 4 29 6 42 13 20 25 40 25 40
Teen-age feeding 11 79 2 14 1 7 32 51 22 35 9 14 ■
Pregancy and lactation 9 65 3 21 2 14 20 32 16 25 27 43
Adequate diet planning 4 29 - - 10 71 5 8 20 32 38 60
Poor family food habits 6 43 2 14 6 43 23 37 23 37 17 26
Low-calorie meals 7 50 4 29 3 21 11 18 24 38 28 44
Diet for diseases 9 65 3 21 2 14 ‘ 37 58 20 32 6 10
Low-cost meals 4 29 3 21 7 50 4 6 13 21 46 73
106

TABLE XXXVI - C o n t i n u e dLevel of Comprehension_____________
GoodVery
Foods and Nutrition None Some Much Total N = 100_________Problems___________________No._____%____ No. %____ No._____%______ None Some_____ Very Much
Infant feeding 11 4S 5 22 7 30 42 16 42
Young children feeding 2 9 10 44 11 47 21 25 54
School children feeding 6 26 9 39 8 35 23 38 39
Teen-age feeding 14 61 6 26 3 13 57 30 13
Preg'ancy and lactation 12 52 2 9 9 39 41 21 38
Adequate diet planning 5 22 7 30 11 48 14 27 59
Poor family food habits 9 40 7 30 7 30 38 32 30
Low-calorie meals 5 22 5 22 13 56 23 33 44
Diet for diseases 14 61 7 30 2 9 60 30 10
Low-cost meals ■ ■ 2 9 2 9 19 82 10 18 72
107

The majority of the sample indicated that mailed materials such as
pamphlets and letters are very practical. The next most practical
methods according to the homemakers were newspapers and television.
Meetings were not very popular due to the problem of baby sitting.
The least practical method was visits at home (Table XXXVII).
TABLE XXXVII
A COMPARISON OF THE PRACTICALITY OF GIVING INFORMATION TO THE HOMEMAKER,
LOUISIANA, 1971
Methods
" Little Practical
N=100
FairlyPractical
N=100
.VeryPractical
N=100
Home visits 59 33 8
Letters 3 26 71
Pamphlets 6 19 75
Newspapers 27 36 37
Radio 54 29 17
Television 31 31 38
Meetings 37 39 24
Data showed that the majority of the sample had heard of the
Cooperative Extension Service. Over one-third had had contact with
its service before. About 41 percent indicated that they would

109
contact the Cooperative Extension office for Information and help
(Table XXXVIII) if needed.
TABLE XXXVIII
HOMEMAKER'S CONTACT WITH COOPERATIVE EXTENSION SERVICE, LOUISIANA, 1971
Number and PercentYes No
Heard of Extension before 71 29
Contacted Extension office before 39 61
Contact Extension office in the future 41 59

CHAPTER V
SUMMARY, CONCLUSIONS AND IMPLICATIONS
Summary
The Problc-m:
Despite the abundance of food and agricultural wealth of the
United States of America, there is a problem of malnutrition at all
ages and at all socio-economic levels in the nation. Research
results indicate that the problem is not always lack of money.
Lack of knowledge, culture, and attitudes toward foods might con
tribute, to a great extent, to the problem of malnutrition. Since
food patterns are acquired during childhood, the homemaker has a
large effect on nutritional practices among the family members,
especially the youngsters. Teaching nutrition to the homemaker should
influence the diet and health of all family members.
Studies mentioned in the literature dealt with level of know
ledge and practice of nutrition by the homemakers. It was planned
in this study to go beyond the level of knowledge or recall to the
comprehension level.
Purpose of the Study:
The purpose of this study was to assess the homemaker's compre
hension of some basic elements in human nutrition, to determine her
eating practices, and the strength or intensity of her attitudes
110

toward foods. The study was planned to Investigate the factors
that affect and are associated with comprehension, attitudes, and
eating practices, and the interrelationship between them. The
independent variables included in this study were: number of
children, former participation in 4-H and home demonstration clubs,
formal home economics training, level of education, residence with
regard to the state and area, schooling status at the time of con
ducting the study, employment status, family income per year, age
of oldest child, homemaker's age, and monthly food expense.
The Sample:
The study was carried out with the wives of American students
residing in married student quarters on the Louisiana State University
campus during the summer of 1971. One hundred names were chosen
at random from the list of names of the American students living
there.
Data Collection:
Personal interview schedules were used to collect the data from
the homemakers. The schedule included questions to obtain infor
mation on: the homemaker's comprehension of some basic elements in
human nutrition, her eating practices, her attitudes toward the food
eaten during a 24-hour recall period, her interest in obtaining
information on some foods and nutritional problems, the practicality
of various methods of giving her such information and personal and

112
family characteristics. The interview schedule was pre-tested
and this resulted in some changes which facilitated administering
the interviews.
Data were collected during May and June of 1971. The inter
views were done on Tuesdays through Fridays at convenient times
for the homemakers.
Data Processing:
The principles of Likert-type scale were used in measuring the
comprehension of basic elements in human nutrition as well as the
attitudes toward the foods eaten. A number of statements relevant
to general knowledge about foods and the four food groups were
presented to the homemaker. She was asked to indicate which of
three possible answers she thought was the right one: agree, un
decided, and disagree. A standard was developed from the answers
of six nutrition specialists to this inquiry. Every interview
schedule was given a score for each part of the five comprehension
categories as well as a composite score for comprehension of all
the basic elements in human nutrition included in the study.
For eating practices the homemaker was asked to recall what
foods and drinks she had had during the 24 hours previous to the
interview.
For attitude measurement, eleven reasons were presented to the
homemaker and she was asked to tell to what extent she was influenced
by each reason when she had consumed each food during the 24 hours

113
previous to the Interview time. There were three possible choices;
very much, some, and little or none. Every degree of influence was
given a score.
Data were prepared and coded for computer analysis. Frequency
distributions, least-square analysis of variance to test the effect of
independent variables on the three dependent variables, and correlation
coefficients to test the association or relationship between the variables
were used in analyzing the data.
Findings;
A . a . Comprehension of some basic elements in human nutrition;
The results of the study indicated that 14 percent of the sample had
a poor comprehension of all basic elements in human nutrition, 63 percent
had fair comprehension, and the rest were in the good comprehension category.
Scores of the homemakers on the different food groups indicated that
their comprehension of the bread and cereal group was worse among the
four food groups, where 69 percent of the sample fell into the poor
category. About two^thirds of the homemakers had poor comprehension of
milk and milk products. The vegetable and fruit group was relatively
better understood among the homemakers. It seems that they were better
informed on the meat and meat substitutes gtoup than any of the other
food groups.
Results showed that only 3 percent of the total sample was able
to state the daily recommended servings of the four food groups for
an adult. The rest of the sample failed due to their poor compre
hension of milk and its products, bread and cereal, and vegetable

114
and fruit groups. At the .01 level it was found that a better
level of comprehension was associated with stating the correct
answer of daily servings of milk, vegetables and bread. There
was no significant association for meat servings.
b. Factors affecting the homemaker1s comprehension and the
correlation between comprehension and other independent
variables:
1. Number of Children:
Over one-half of the homemakers (51 percent) had one child,
20 percent had two children, while very few (2 percent) had three
to four children and the rest (27 percent) had none. When home
makers were divided according to their comprehension, the data
showed an indication that homemakers with more children had better
comprehension of nutrition. However, neither the "F" test nor the
correlation at .25 level was significant. On the other hand, home
makers with three or more children had significantly better ability
to state the daily recommended servings of bread and cereal at the
.25 level. There was no statistical significance regarding the correct
answers to questions on milk, meat and vegetables.
2* Age of Children:
Forty-three percent of the homemakers had pre-school children,
23 percent had infants while 7 percent had school children. When
homemakers were divided according to comprehension, it seemed that
the older the homemaker's children, the better comprehension she
had. However, the "F" test showed no significant effect or correlation

115
at the .25 level. Age of oldest child affected the correct answer
of the milk daily servings at the .25 level of significance. Those
who had older children were better able to give the correct daily
amount. There was no significant affect on meat, vegetable, and
bread recommended servings.
3. Family Income:
Fifty-eight percent of the total sample had annual income of
less than $5,000; the rest had income above this level. According
to the level of comprehension■, data showed an indication that family
income has an effect on the homemakers' comprehension. At the .01
level of significance it was found that homemakers with income over
$5,000 a year had better comprehension than lower income homemakers.
This finding was supported .by a positive significant association
between income and comprehension at the .05 level. The same income
bracket homemakers were better able to state the correct daily servings
of vegetable and fruit, and meat and its substitutes. This was signifi
cant at the .25 level. There was no significant affect on the milk
and bread daily servings.
4. Monthly Food Expenses:
Forty-five percent of the families spent from $76 to $100 a month
on food. A small proportion (3 percent) spent from $151 to $175 a
month. The findings on level of comprehension indicated an association
between income and comprehension. The "F" test showed a significant

116
affect at the .25 level. Homemakers who spent more money on foods
were those who had better comprehension. This finding was supported
by a positive significant association at the .05 level. Income had
no significant effect on stating the correct daily recommended
servings of the four food groups.
5. Age of the Homemaker:
The greatest proportion of the homemakers (45 percent) was in
the range between 22 and 25 years of age. There was an indication
that better comprehension is related to older age. There was no
significant effect of age on comprehension at the .25 level. How
ever there was significant association at the .25 level. Better
comprehension was associated with older age homemakers. At the .10
level, it was found that older homemakers were better able to state
the milk daily servings. No significant effect was found on the
.recommended servings of meat, vegetables and bread.
6* Level of Education:
Almost all homemakers had high school education.; 39 percent
studied beyond high school, and 35 percent were college graduates.
At the .01 level of significance, those with college education had
better comprehension. This finding was supported by a positive
significant correlation at the .25 level. College graduates also
had better ability to state the correct bread and cereal daily
servings, and this finding was significant at the .25 level. There

117
was no significant effect on the answer of milk, meat, and vegetable
daily recommended servings.
7. Schooling:
Twenty-two percent of the homemakers were attending college at
the time this study was conducted. At the .25 level of significance,
it was found that those who were attending school had better com
prehension. There was no significant association at the .25 level.
Attending school affected the answer of daily servings of meat and
vegetables at the .25 level, and bread at the .10 level. Homemakers
who were not attending college were better able to state the correct
servings of meat and bread, while those who were attending had a better
ability to answer the recommended amount of vegetables. There was
no significant affect on milk servings.
8. Formal Home Economics Training:
Sixty-one percent of the total sample had formal training
in home economics. The highest proportion (41 percent) were trained
in high school, 7 percent received college training while 13 percent
had both high school and college home economic training. At the .10
level of significance, it was found that homemakers with college
training had better comprehension. This result was supported by
a significant positive association at the .25 level. The same home
makers were better able to state the correct bread and cereal daily
recommended servings. This was significant at the .10 level. There

118
was no significant effect on milk, meat, and vegetable servings.
9. Employment Status:
Thirty-seven percent of the total sample had a full-time job
outside their homes. At the .10 level of significance, it was
found that unemployed homemakers had better comprehension. However,
there was no significant correlation at the .25 level. Employment
status had no significant effect on arswers in the four food groups.
10* Former participation in 4-H and home demonstration clubs:
Thirty-six percent of"the homemakers were former 4-H .club
members. At the .05 level, it was found that those who were former
members had better comprehension. This finding was supported by
a significant positive association at the .01 level. There was no
significant effect on the answer of the recommended servings of
the four food groups.
Twelve percent of the homemakers were former participants in
home demonstration clubs. There was no significant effect or associ
ation of home demonstration participation on total comprehension
at the .25 level. However, there was a significant effect on stating
the correct servings of milk and vegetables at the .25 level, and
bread and cereal at the .10 level. Former members were better able
to state the correct milk amounts while non-former members were better
informed about the vegetable and bread daily servings. There was no
significant effect on meat daily servings at the .25 level.
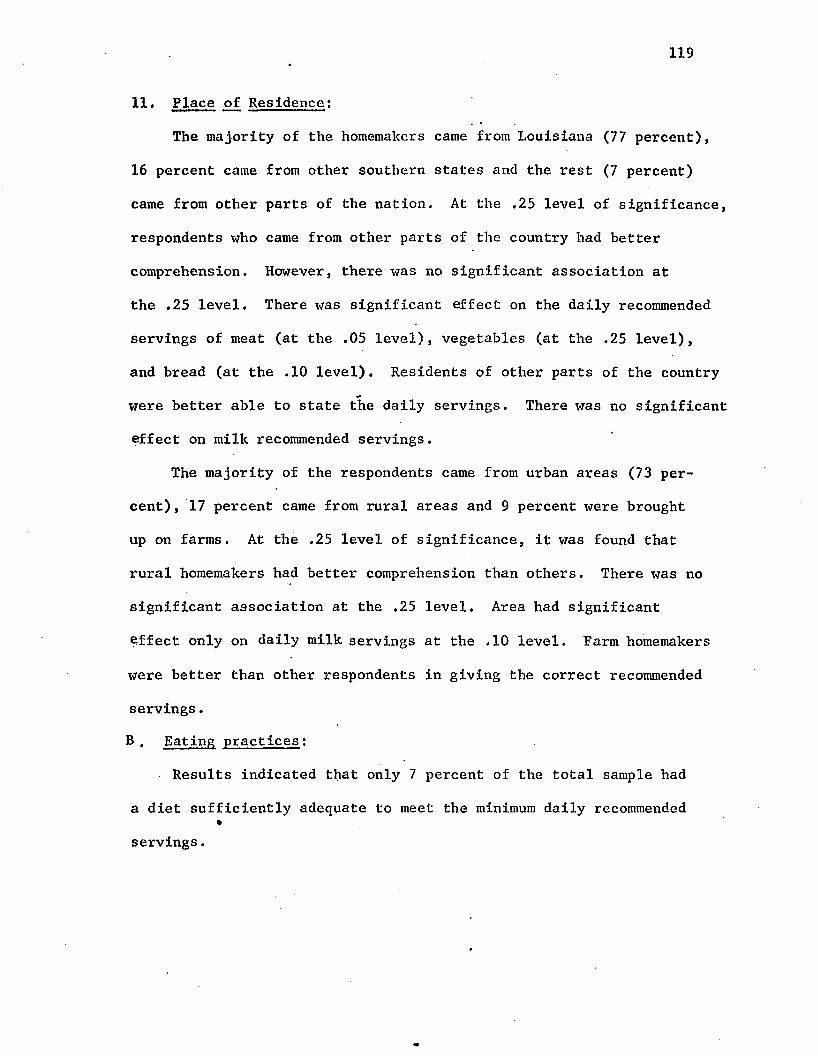
119
Place of Residence;
The majority of the homemakers came from Louisiana (77 percent),
16 percent came from other southern states and the rest (7 percent)
came from other parts of the nation. At the .25 level of significance,
respondents who came from other parts of the country had better
comprehension. However, there was no significant association at
the .25 level. There was significant effect on the daily recommended
servings of meat (at the .05 level), vegetables (at the .25 level),
and bread (at the .10 level). Residents of other parts of the country
were better able to state the daily servings. There was no significant
effect on milk recommended servings.
The majority of the respondents came from urban areas (73 per
cent), 17 percent came from rural areas and 9 percent were brought
up on farms. At the .25 level of significance, it was found that
rural homemakers had better comprehension than others. There was no
significant association at the .25 level. Area had significant
effect only on daily milk servings at the .10 level. Farm homemakers
were better than other respondents in giving the correct recommended
servings.
B . Eating practices:
Results indicated that only 7 percent of the total sample had
a diet sufficiently adequate to meet the minimum daily recommended
servings.

120
a * M U k and Milk Products:
About one-third of the total sample consumed their daily
recommended, servings of milk. Homemakers who had formal training
in home economics had better milk drinking practices than those
who did not have such training. This was supported by a significant
correlation between formal home economics training and milk con
sumption.b. Meat and Meat Substitutes:
The majority of the sample (77 percent) got their daily re
commended servings of meat and meat substitutes. Homemakers who
received formal home economics training consumed more meat than those
who did not. A significant correlation existed between formal home
economics training and meat eating practices.
Respondents who came from rural or farm areas had better eating
practices with regard to meat. This is supported by the existence
of a significant correlation between originating on a farm or rural
residence and more consumption of meat.
Former members of 4-H and home demonstration clubs consumed more
meat than non-former members. The correlation coefficient showed that
more consumption of meat is associated with former membership in
a home demonstration club.
Homemakers who studied beyond high school but had not finished
college consumed more meat than high school and college graduates.
Non-employed homemakers and those who were younger were better

121
meat consumers. This result was supported by significant correlation
between homemaker's age and meat consumption.
c . Vegetables and Fruits:
One-third of the total sample had the daily recommended servings
of vegetables and fruits. Homemakers who had better consumption were
those who had formal training in home economics both in college and
high school.
College graduates and those who studied beyond high school had
better vegetable and fruit eating practices than other homemakers.
This finding was supported'by significant association between better
consumption of vegetables and fruits and a higher level of education.
Respondents with family income over .$4,000 a year, those who
were going to school and who were not former members of a 4-H club
had better eating practices of vegetables and fruits. A correlation
coefficient indicated that older homemakers who have more and older
children consumed more vegetables and fruits than younger homemakers,
who had fewer and younger children.
d. Bread and Cereal:
Just above one-half of the total sample met the minimum daily
servings with regard to bread and cereal consumption.
. Former 4-H club members, non-former home demonstration members
and younger homemakers consumed more bread and cereal. This finding %
was supported by a negative significant association between homemaker's
age and bread and cereal consumption. A correlation coefficient showed
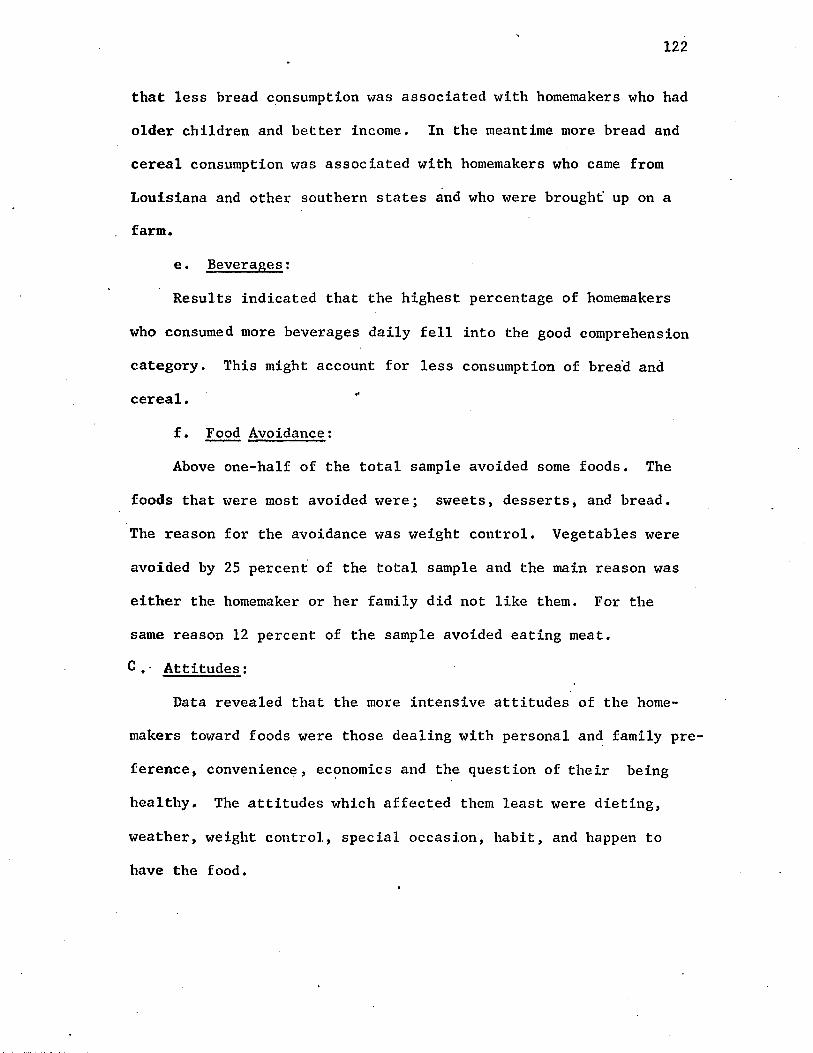
122
that less bread consumption was associated with homemakers who had
older children and better income. In the meantime more bread and
cereal consumption was associated with homemakers who came from
Louisiana and other southern states and who were brought' up on a
farm.
e . Beverages:
Results indicated that the highest percentage of homemakers
who consumed more beverages daily fell into the good comprehension
category. This might account for less consumption of bread and
cereal.
f. Food Avoidance:
Above one-half of the total sample avoided some foods. The
foods that were most avoided were; sweets, desserts, and bread.
The reason for the avoidance was weight control. Vegetables were
avoided by 25 percent of the total sample and the main reason was
either the homemaker or her family did not like them. For the
same reason 12 percent of the sample avoided eating meat.
C.- Attitudes:
Data revealed that the more intensive attitudes of the home
makers toward foods were those dealing with personal and family pre
ference, convenience, economics and the question of their being
healthy. The attitudes which affected them least were dieting,
weather, weight control, special occasion, habit, and happen to
have the food.

123
Coming from an urban area, having a full-time job, and less
expensive foods affected the personal preference of the homemaker
to have foods. This finding was supported by the existence of
significant associations between personal preference and urban home
makers, and those who have a full-time job. The correlation coefficient
showed that former 4-H members ate food because they liked it more
than non-former members.
The factors that affected the homemaker to have foods because
of her family preference were: schooling, food expense, and former
membership in a home demonstration club. These findings were
supported by the existence of significant associations. Homemakers
who were not attending school considered their family preference of
foods more than those who were attending school. Respondents who
were former participants in 4-H clubs gave more consideration to
foods preferred by their families. Also less expensive foods were
preferred by those homemakers.
Respondents who had three children, had received formal training
in home economics in high school and college, and had family income
between $4,000 and $6,000 considered their family preference of
foods more than other homemakers.
Giving more attention to family preference of foods was associated
with homemakers who came from Louisiana and who had a better educational
level.
Homemakers who had formal home economics training and those

124
iwho had older children were influenced more by food convenience.
Having convenient meals was associated with homemakers employed
full-time, with those who had a higher level of education, and
with those having less monthly food expenditures.
The more formal home economics training the homemaker received,
and the better level of education she had, the more she was in
fluenced to have economics foods. Older homemakers with a family
income of $4,000 to $6,000 were influenced more by food economy.
Also, urban homemakers planned more economic meals than did farm
or rural homemakers.
Respondents who had full-time jobs, formal home economics
training both in college and in high school, those who came from
rural or urban areas, and those who had a family income between
$4,000 and $6,000 were influenced more to have foods because it was
healthy. Having healthy foods was associated with former participants
in 4-H and home demonstration clubs and older homemakers.
c. Special occasion, habit, and happen to have the food:
Rural homemakers were affected more than those who came from
urban or farm areas to have foods for a special occasion. Special occasion
food was associated with former 4-H club members and those who had
better levels of education.
Older and farm homemakers, and those with family income between
$4,000 and $6,000 had food as a habit more than other homemakers.
Non-former home demonstration club members, homemakers with

125
more children and those with little or no formal home economics
training consumed food as a habit more than other homemakers.
Homemakers who had better levels of education were less likely
to have foods because they happen to have it. The opposite was
true with former 4-H club members and those who had older children.
Homemakers with family income between $4,000 and $6,000, those
who were non-former members in home demonstration clubs and those
who had formal training in home economics were more likely to consume
foods they happen to have.
There was significant association between homemakers who came
from Louisiana and having foods available in the house.
d. Weight control, dieting and weather:
Rural homemakers and those who have older and one or three 0
children consumed weight-control foods more than others. This finding
was supported by significant positive association between age of oldest
child and weight-control food consumption.
Homemakers who received high school or college home economics
training were prone to select foods which would control their
weight.• There was a significant association between having foods for
weight control and homemakers who were not attending school.
Homemakers with no children had foods more for special diets.
This was supported by a significant statistical association.
Respondents who came from rural areas, Louisiana residents,
and those who had more food expenditure had special diets more than
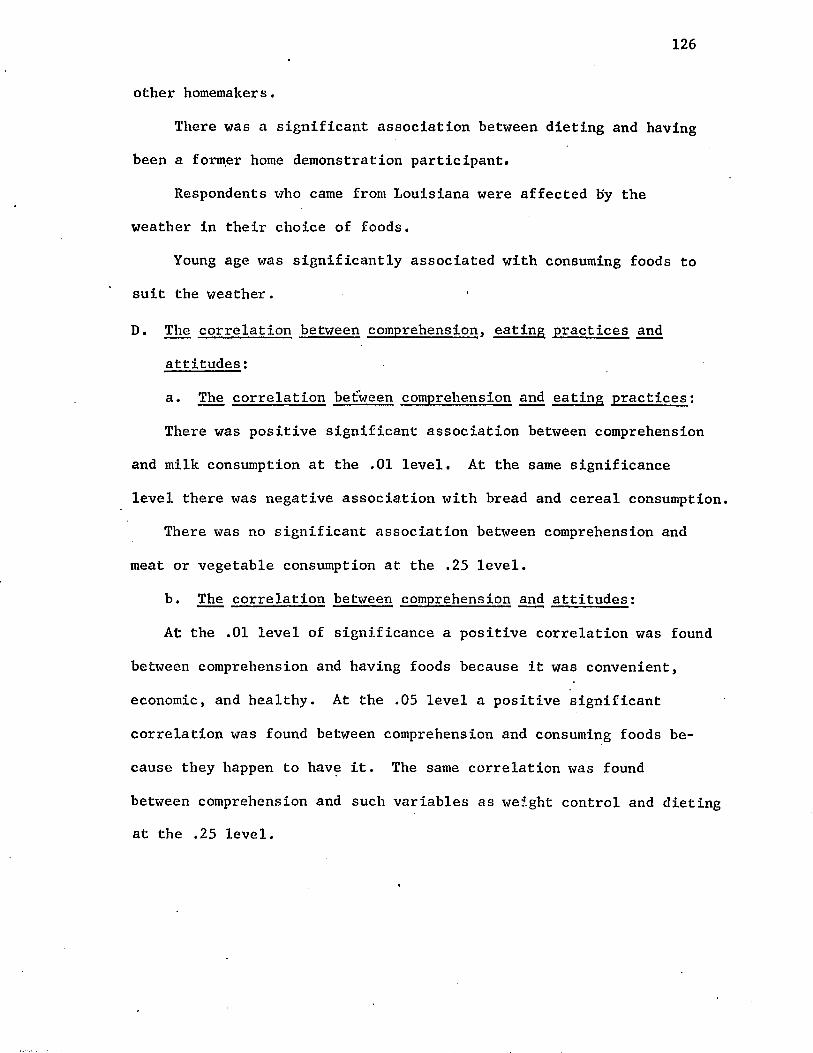
126
other homemakers.
There was a significant association between dieting and having
been a former home demonstration participant.
Respondents who came from Louisiana were affected by the
weather in their choice of foods.
Young age was significantly associated with consuming foods to
suit the weather.
D. The correlation between comprehension, eating practices and
attitudes:
a. The correlation between comprehension and eating practices:
There was positive significant association between comprehension
and milk consumption at the .01 level. At the same significance
level there was negative association with bread and cereal consumption.
There was no significant association between comprehension and
meat or vegetable consumption at the .25 level.
b. The correlation between comprehension and attitudes:
At the .01 level of significance a positive correlation was found
between comprehension and having foods because it was convenient,
economic, and healthy. At the .05 level a positive significant
correlation was found between comprehension and consuming foods be
cause they happen to have it. The same correlation was found
between comprehension and such variables as weight control and dieting
at the .25 level.

127
c . The correlation between eating practices and attitudes:
At the .05 level of significance, a positive significant
correlation.was found between milk consumption and having it because
it was healthy and because of habit.
With regard to meat and its substitutes, the significant associ
ation was negative between meat servings and convenience, happen to
have it (at the .05 level), and weight control and weather (at the
.25 level). A positive correlation was found between eating meat
and food habits at the .25 level.
The association between eating practices of vegetables and
personal preference was positive and significant at the .25 level.
There were other significant positive relationships with family
preference, and consuming it because it was healthy at the .01 level.
A negative significant correlation was found between vegetable
consumption and weight control (at the .25 level) and dieting (at
the .01 level).
There were 9 negative associations with bread consumption;
convenience and weight control (at the .01 level), economics (at
the .05 level), healthy, habit, and happen to have it at the (.10
level), and family preference, dieting and weather (at the .25 level).
E. a. Sources of nutritional knowledge learned by the homemaker:
About two-thirds of the total sample learned their nutritional
knowledge in biology and physical education classes in high school.
The second major source of learned information was parents. Data

128
indicated that poor comprehension homemakers gained their knowledge
from their parents and the mass media.
b. The homemaker1s interest in participating in a nutritional
education program and the best time for conducting it;
About one-fourth of the total sample showed definite interest
in participating in a nutritional education program. Most of this
proportion were in the poor comprehension category. About one-half
of the respondents indicated a possibility of participating; most
of them were in the fair comprehension group.
c . The degree of interest of the homemaker in some nutritional
problems:
About one-half of the total sample showed little interest in
gaining more information on the nutritional problems presented to
them; the other half indicated some or very much interest. The
respondents showed more interest in getting information on low-cost
meals, planning adequate diets, atid the feeding of infants and young
children.
d. The practical methods for nutritional education for the
homemakers;
Mailed materials such as pamphlets and letters were very
practical to the majority of the homemakers. Newspapers and
television shows were the next most practical methods. Meetings
were not very practical due to the problem of baby-sitting.

CONCLUSIONS
Although the homemakers had a fairly high level of educational
attainment, their comprehension of basic elements in human nutrition
was relatively low. This resulted in the failure to know the
minimum daily recommended servings of foods since results showed
that there was a positive association between comprehension and
the statement of the correct daily servings of foods.
The study showed that formal or informal education; income
per year, food expense per month, age of the homemaker, employment status, and her culture and background affected her
comprehension. The effect of these variables indicated that better
comprehension can be achieved through nutrition education;
The study showed that the majority of the homemakers did not
consume an adequate diet. The inadequacy of the diet was due to
lack of the minimum daily servings of milk, vegetables, and bread.
On the whole, they were good meat consumers. The main reasons for
such inadequacies were the lack of understanding of the importance
and function of these foods. They might have been able to recall
that every individual needed such foods, but they lacked the know
ledge of the importance and the function of the foods in the body
in relation to other nutrients.
129

X30
Results showed that there was a strong interrelation between
comprehension, eating practices, and attitudes. The aim of the
Extension Service is to establish sound nutritional eating practices
among the homemakers and their families. Such practices are affected
by comprehension and attitudes. Therefore, for effective nutrition
education, these two factors should be considered in order to
achieve our educational goal.
Since the poor comprehension homemakers learned most of their
nutritional knowledge from their parents and mass media, it would
seem that they should be subjected to current nutrition education.
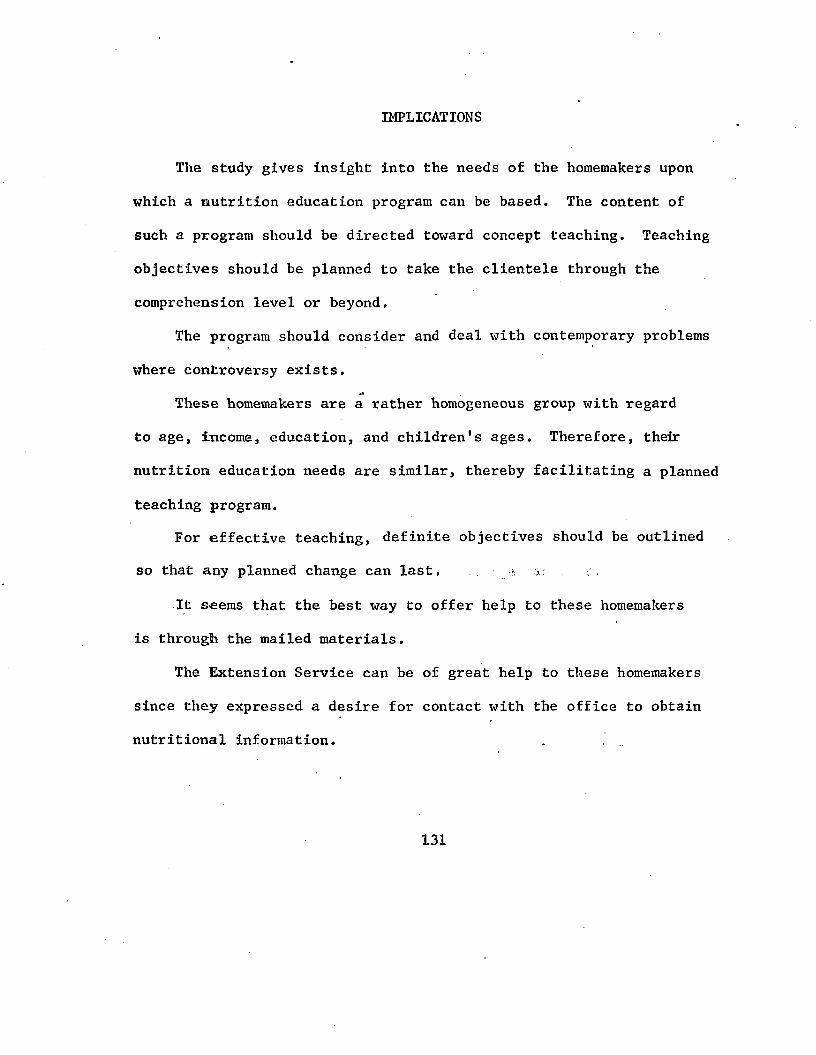
IMPLICATIONS
The study gives insight into the needs of the homemakers upon
which a nutrition education program can be based. The content of
such a program should be directed toward concept teaching. Teaching
objectives should be planned to take the clientele through the
comprehension level or beyond.
The program should consider and deal with contemporary problems
where controversy exists.
These homemakers are a rather homogeneous group with regard
to age, income, education, and children's ages. Therefore, their
nutrition, education needs are similar, thereby facilitating a planned
teaching program.For effective teaching, definite objectives should be outlined
so that any planned change can last, ~ ?
It seems that the best way to offer help to these homemakers
is through the mailed materials.
The Extension Service can be of great help to these homemakers
since they expressed a desire for contact with the office to obtain
nutritional information.
131

BIBLIOGRAPHY
A. BOOKS
1. Bird, Charles. Socla 1 Psycholofty■ New York: D. Appleton-CenturyCompany, 194 0.
2. Bloom, B. S. (Editor). Taxonomy of Educational Objectives: TheClassification of Educational Goals . Handbook I. Cognitive JDomain. New York: McKay, 1956.
3. Bloom, Benjamin S., J. Thomas Hastings, and George F. Madaus.■Handbook on Formative and Summativo Evaluation of Student Learning■ New York: McGraw-Hill, 1971.
4. Harvey, W. R. Least-Square Analysis of Data with Unequal Subclass Numbers. Beltsvillo, Maryland: U.S.D.A., AgriculturalRes ear ch Center, 1960.
5. Kratliwohl, D. R., B. S. Bloom, and B. B. Masia. Taxonomy ofEducational Objectives: The Class1fication of EducationalGoals. Handbook II. Affective Domain . New York: McKay,1964V
6 . Lambert, W. W., and W. E. Lambert. Social Psychology. New Jersey:Prentice Hall Inc., 1964.
7. Leverton, Ruth. Food Becomes You. Garden City: Dolphin Books,Doubleday and Company, I960.
8 . Newcomb, T. M. Social Psychology. Holt Rinehart and Winston,New York, 1961.
9. Sargent, S. S. and R. C. Williamson. Social Psychology. NewYork: The Ronal Press Company, 1958 (Second Edition).
10. Tyle r, Ralph W ., Basic Principles of Curriculum and Instruction.Chicago: The University of Chicago Press, 1970.
B. PUBLICATIONS OF THE GOVERNMENT
11. Leverton, Ruth M. and Jean Pazur. Food Practices and Nutritional Status of Typical Nebraska Faniilj.es . Miscellaneous publication No. 5., Nebraska Agriculture. Experiment Station, 1957.
132

133
12.
13.
14.
15.
16.
17.
18.
19.
20 .
21 .
2 2 .
23.
Louisiana Stale University Cooperative Extension Service. Evaluation of the Louisiana Nutrition Prop,ram, 1969.
United States Department of Agriculture, Agricultural Research Service. Food Consumption of Households in the United States, Household Food Consumption Survey. 1965-1966. Report No. 1, 1965.
United States Department of Agriculture, Agricultural Research Service. Dietary Levels of Households in. the Unf ted States,Report No. 6, 1965.
United States Department of Agriculture. The Background Paper on F_ood and Nutrition for tire 1970-1971 White House Conference on Children and Youth, 1970.
United States Printing Office. White House Conference on Food, Nutrition and Health. Final Report, Washington, D. C. 1970.
United States Department of Health, Education, and Welfare. Ten- state Nutrition Survey in the United States,' 1968-1970. Preliminary Report to the Congress, 1971.
C. PERIODICALS
Culbertson, Hugh M. "What is an Attitude?" Journal of Cooperative Extension, Vol. VI, No. 2, 1968, pp. 79-84.
Futrel'l, Mary F., Lois T. Kilgore, and Frances Windham. "Impact of Education and Income: Nutritional Status of Negro PreschoolChildren in Mississippi." Journal of the American Dietetic Association, Vol. 59, No. 3, 1971, pp. 224-227.
Goble, Eva. "Young Homemaker and Extension." Journal of Cooperative Extension, Vol. II, No. 3, 1964, p. 142.
Louisiana State Department of Health, Nutrition Section. "National and State Activities Resulting from the White House Conference." Confidentially Speaking, January, 1970, pp. 1-3.
The White House Conference on Food, Nutrition, and Health. "Recommendations of Panels on Nutrition Teaching and Education.: Journal of Nutrition Education, Vol 1, No. 3, 1970, pp. 24-39.
The White House Conference on Food, Nutrition and Health. "Recommendations of Panels on Nutrition Teaching and Education. Section Four." Journal of Nutrition Education, Vol. 1, No. 3, 1970, p. 32.

134
24. Wang, Virginia Li., "Food Information of Homemakers and 4-11Youth." Journal of the American Dietetic Association,Vol. 58, No. 3, 1971, pp~ 215-218.
25. Young, Charlotte M. jrt. aJL. "What the Homemaker Knows AboutNutrition, I. Description of Studies in Rochester and Syracuse, New York." Journal of the American Dietetic Association. Vol. 32, March, 1956, pp. 211-217.
26 . _________________________ . "What the Homemaker Knows AboutNutrition, II. Level of Nutritional Knowledge." Journalof the American Dietetic Association, Vol. 32, March 1956,pp.' 218-222.
27 . _________________________ . "What the Homemaker Knows AboutNutrition, III. Relation of Knowledge to Practice." Journal of the American Dietetic Association, Vol. 32, April 1956, pp.”' 321-325".'
2 8 . . "What the Homemaker Knows AboutNutrition, Shopping Habits and Sources of Information." Journal of the American Dietetic Association, Vol. 32,May, 1956, pp. 429-434.
D- UNPUBLISHED MATERIALS
29. Brew, Etta Pearl Holmes. "A Comparison of Lower-Income andUpper-Income Homemakers Relative to Their Knowledge and Practice of Nutrition," unpublished Master's Thesis,Baton Rouge, Louisiana State University, 1971.
30. Gercke, Sarah. "Some Factors Associated with Young Homemaker';Knowledge of Nutrition," unpublished Master's Thesis,Baton Rouge, Louisiana State University, 1965.
31. Mitchell, Jackie P. "Factors Associated with Knowledge ofNutrition Among Morehouse Parish Homemakers," unpublished Master's Thesis, Baton Rouge, Louisiana State University, 1966.
32. Williams, Leodrey. "A Study of the Expanded Nutrition Education Program in Three Northeast Louisiana Parishes," unpublished Master's Thesis, Baton Rouge, Louisiana State University, 1969.

135APPENDIX
INTERVIEW SCHEDULE
SOME FACTORS ASSOCIATED WITH THE HOMEMAKER'S COMPREHENSION, EATING PRACTICES AND ATTITUDES TOWARD
FOODS AND NUTRITION
Apartment No.______________ .
1. Do you have children?-------■----------------- YesNo
If no, go to question No. 2c.
2. a. If yes, how many children do you. have? One child------Two children —--Three children —Four children --More than four
children -----
b. What are their ages? __________________________
c. Are you pregnant at the present time? YesNo
The following are some statements each of which has three possible answers: Agree, Undecided, and Disagree. Pleasetell which answer you think is the right one.
Agree Undecided Disagree3. Meals should generally include the
foods we like. X X X
4. If the individual eats all the foods he wants, he will never sufferfrom malnutrition diseases. X X X
5. Adults eat food, only to get energyfor activities. X X X
6 . Children need food mainly to get energy for activities and body growth. X X X

136
Agree Undecided Disagree
7. A variety of foods should be included in the meals of every individual since no one food can meet the body requirement ofnutrients. X X X
8 . Milk is needed more by the children than adults for the development oftheir bones. X X X
9. Dry skim milk contains as muchprotein and. calcium as whole milk. X X X
10. Dry skim milk powder has the samenutritive value as fresh skim milk. X X X
11. People who are dieting should avoidmilk completely. X X X
12. On the whole, margarine is asnutritious as butter. X . X X
13. People who do not eat meat are boundto be in poor health. X X X
14. Inexpensive meats are just as nutritious as expensive meats. X X X
15. Children need foods rich in protein to help their growth and development . X X X
16. Toasted bread is as nutritious asuntoasted bread. X X X
17. Whole-wheat bread is just as nutritious as white bread that is enriched withvitamins and minerals. X X X
18. Whole grain and enriched cereal contain more nutrients needed to keep ushealthy than the un-enrlclied cereals. X X X

137
.19. Enriched bread can be substituted for vegetables and meat.
20. The main function of bread is giving us energy.
21. Every individual should eat some green or yellow vegetables every day.
•22. The most important nutrient in citrus fruit juices is Vitamin C.
23. If you want to reduce your weight, you should avoid eating potatoes completely.
24. Carrots are good for vision.
25. It does make a difference in thenutritive value of the vegetables if it is cooked in small or large amount of water.
26. Meat is a good source of body building materials. Which of the following foods also have a large amount of protein and can be used as a meat, substitute?
Bread _________ Peanut Butter _____________ Apples___
Eggs __________ Oleomargarine_____________ Beans _______
Spinach________ Cottage Cheese_______________ Milk___
27. How many cups of milk should an adult get every day? ___________
28. How many servings of meat or meat substitute should an adult getdaily? __________________
29. How many servings of vegetables and fruit should an adult have every day? ________ __________
30. How many servings of bread and cereal should an adult get daily?
Agree Undecided Disagree
X X X
X X X
X X X
X X X
X X X
X X X
X X X

31. The following are some questions concerning the food you ate during the last 24 hours. To what extent did each of the following reasons influence you to have each food?
2 - A lot 1 - Some0 - Little or none
p1
Reasons
Breakfast Mid-day Meal!
Evening Meal I Snacks
1. I like it.
j 2. My family likes | it.i1 3. It is convenient.i| 4. Ir is economical.|I 5. It is healthy.
1
6. It was special ! occasion.
7. It is a habit.
8 . Happen to have it.
9, weight control.trj 10. Special diet.1S 11. weather.
V
138

139
32. Were the meals mentioned above typical of Yes —your usual practices? No---
33. Do you avoid eating certain foods? Yes —N o ---
If no, go to question no. 35.
34. If yes, what are these foods? What are the reasons for avoiding each food?
Reason for avoiding foods
F O O D S .
1. Medical2. Do not like it.3. Family does not
like it.4. Weight control.5. Contamination.6 . Health problems.7. List others.
35. If a nutritional educational program is designed for homemakers and officially free of charge at a convenient location in your neighborhood, would you definitely participate, possibly, or would you be notinterested? _____
Definitely ------ -----Possibly------- ------Not interested —
36. If you answer is definitely or possibly, what time would be more convenient to y o u ? _________________________________________________
37. To what extent will you be interested i.n getting information on the following nutritional problems?
Very Much Some None1. Infant feeding. X X X2. Young children feeding. X X X

140
38,
No. 37 continued. Very Much Some None
3. Nutrition for school children. X X X4. Nutrition for teen age. X X X5. Nutrition for pregnancy and lactation. X X X6. Adequate diet planning. X X X7. Poor family food habits. X X X8 . Low calorie meals. X X X9. Diet for diseases. X X X10. Low cost meals. X X X
To wliat extent would each of the following methods of receivinginformation be practical for you?
Very Fairly Little or NotPractical Practical Practical
1. Personal visits in yourhome. X X X
2 . News letters mailed to you. X X X3. Pamphlets. X X X4. Local newspapers. X X X5. Rad io. X X X6. Television. X X X7. Special series of meetings
designed for homemakers. X X X8 . Others (list):
X X XX X X
39. Have you ever heard of Agricultural Extension Service?Y e s --N o ---
If no, go to question No. 44.
40. If yes, have you ever been in contact with the Agricultural Extension Service?
Y e s -----N o ------
If no, go to question No. 44.
41. If yes, and if you needed nutritional information, would you contact "the Extension Service for this information or would you seek the information from another source?
Yes - Would contact Extension Service No — Would contact another source
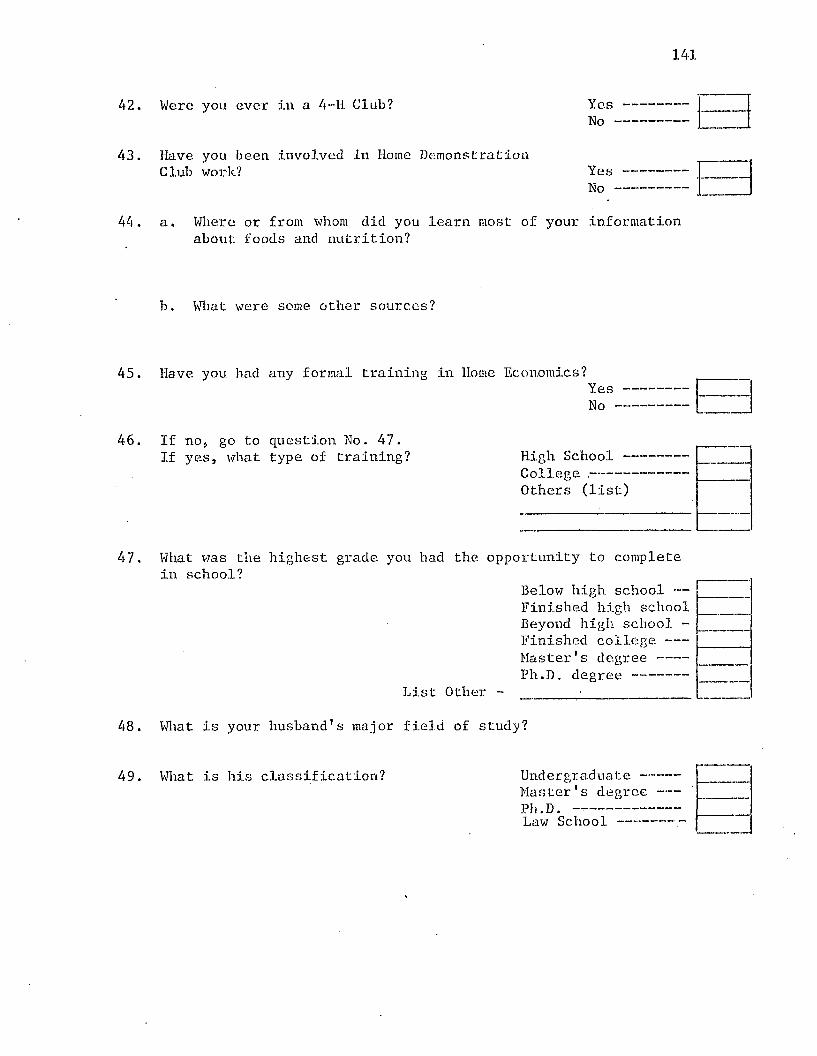
141
42. Were you ever in a 4-H Club? Yes -------No --------
43. Have you been involved in Home DemonstrationClub work? Yes -------
No --------
44. a. Where or from whom did you learn most of your informationabout foods and nutrition?
b. What were some other sources?
45. Have you had any formal training in Home Economics?Yes - No
46. If no, go to question No. 47.If yes, what type of training? High School -
College .----Others (list)
47. What was the highest grade you had the opportunity to complete in school?
Below high school — Finished high school Beyond high school -Finished college --Master’s degree ---Ph.D. degree ------
List Other - ■ ___
48. What is your husband's major field of study?
49. What is his classification? Undergraduate-----Master's degree --Ph.D. ------------Law School ------ -
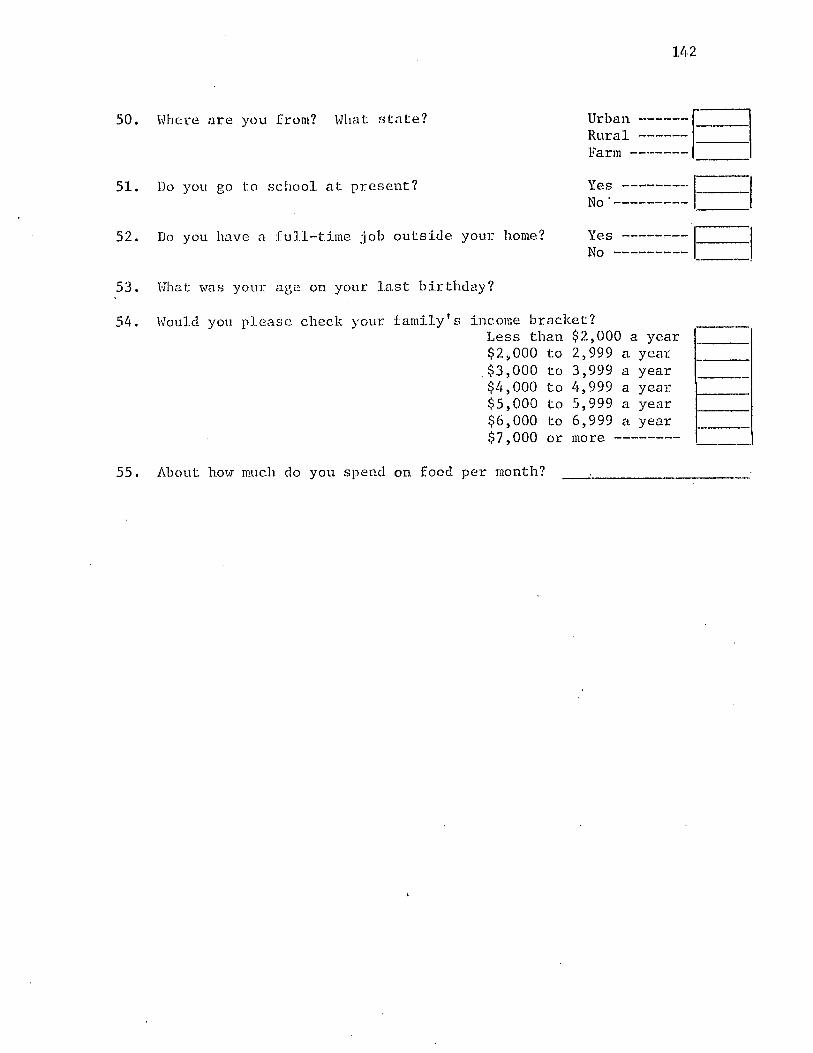
142
50. Where are you from? Wlial: state? Urban-----Rural -----Farm------
51. Do you go to school at present? Yes -------No ‘--------
52. Do you have a full-time job outside your home? Yes ---- <—N o --------
53. What; was your age on your last birthday?
54. Would you please check your family’s income bracket?Less than $2,000 a year $2,000 to 2,999 a year .$3,000 to 3,999 a year $4,000 to 4,999 a year $5,000 to 5,999 a year $6,000 to 6,999 a year $7,000 or more -------
55. About how much do you spend on food per month? ____ .___________
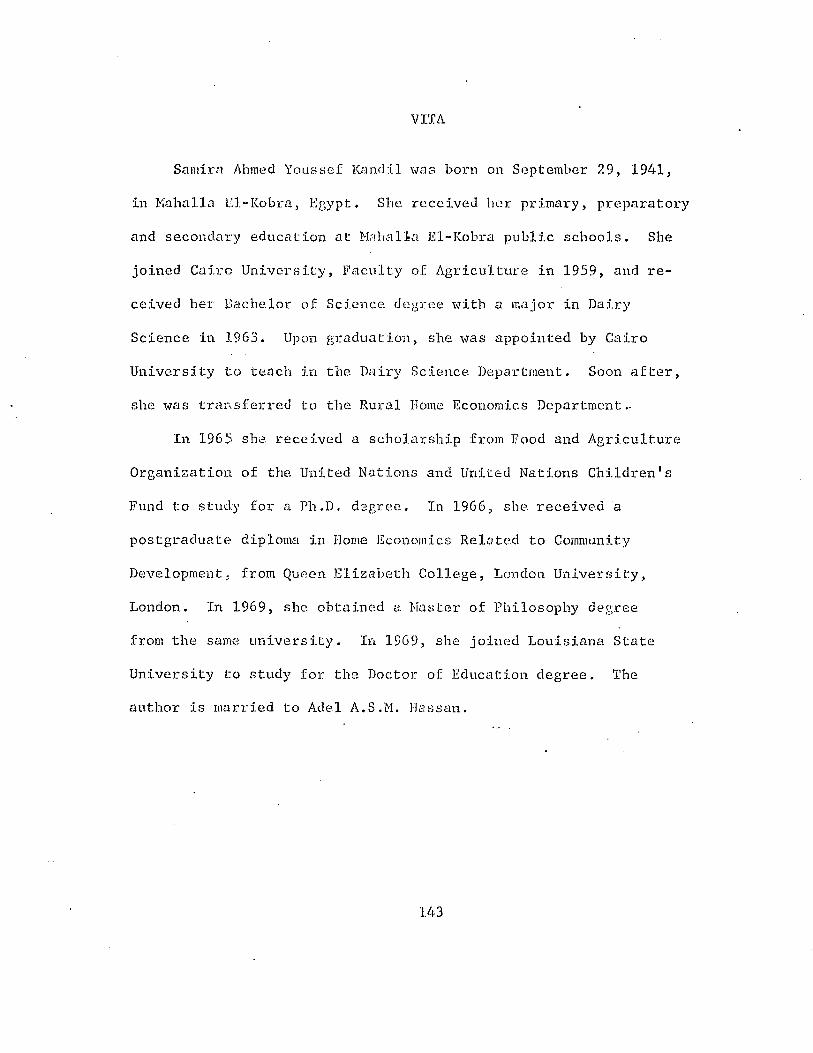
VITA
Samira Ahmed Youssef Kandil was born on September 29, 1941,
in Kahalla El-Kobra, Egypt. She received her primary, preparatory
and secondary education at Mahalla El-Kobra public schools. She
joined Cairo University, Faculty of Agriculture in 1959, and re
ceived her bachelor of Science degree with a major in Dairy
Science in 1963. Upon graduation, she was appointed by Cairo
University to teach in the Dairy Science Department. Soon after,
she was transferred to the Rural Home Economics Department
In 1965 she received a scholarship from Food and Agriculture
Organization of the United Nations and United Nations Children's
Fund to study for a Ph.D. degree. In 1966, she received a
postgraduate diploma in Home Economics Related to Community
Development, from Queen Elizabeth College, London University,
London. In 1969, she obtained a Master of Philosophy degree
from the same university. In 1969, she joined Louisiana State
University to study for the Doctor of Education degree. The
author is married to Adel A.S.M. Haasan.
143

EXAMINATION AND THESIS REPORT
Candidate: Samira Ahmed Youssef Kandil
Major Field: Extension Education
Title of Thesis: Some Factors Associated with the Homemaker’s Comprehension,Eating Practices, and Attitudes Toward Foods and Nutrition
Approved:
Major Professor and Chairman
Dean of the Graduate School
EXAMINING COMMITTEE:
Date of Examination:
October 19, 1971