qut digital repository: …eprints.qut.edu.au/40004/1/c40004.pdfjournal of colloid and ... without...
TRANSCRIPT

This is the author version published as: This is the accepted version of this article. To be published as : This is the author’s version published as: Catalogue from Homo Faber 2007
QUT Digital Repository: http://eprints.qut.edu.au/
Frost, Ray L., Blain, Paul, Martens, Wayde N., & Yang, Dongjiang (2011) Sodium niobate adsorbents doped with tantalum (TaV) for the removal of bivalence radioactive ions in waste waters. Journal of Colloid and Interface Science, 356(1), pp. 240‐247.
Copyright 2011 Elsevier
1
Sodium Niobate Adsorbents Doped with Tantalum (TaV) for the Removal of Bivalence Radioactive Ions in Waste Waters
Blain Paul, Dongjiang Yang,Wayde N. Martens, Ray L. Frost*
Discipline of Chemistry, Queensland University of Technology, Brisbane, Qld 4001,
Australia, Email*: [email protected], Fax: +61 7 3138 1804
Abstract
Sodium niobates doped with different amount of tantalum (TaV) were prepared via
thermal reaction process. It was found pure nanofibril and bar-like solids can be
obtained when tantalum was introduced into the reaction system. For the well-
crystallized fibril solids, the Na+ ions are difficult to be exchanged, and the
radioactive ions such as Sr2+ and Ra2+ ions just deposit on the surface of the fibers
during the sorption process, resulting in lower sorption capacity and distribution
coefficients (Kd)`. However, the bar-like solids are poorly-crystallized and have lots
of exchangeable Na+ ions. They are able to remove highly hazardous bivalent
radioactive isotopes such as Sr2+ and Ra2+ ions. Even in the presence of lots of Na+
ions, they also have higher Kd. More importantly, such sorption finally intelligently
triggers considerable collapse of the structure, resulting in the entrapment of the toxic
bivalent cations permanently in the solids so that they can be safely disposed. This
study highlights new opportunities for the preparation of Nb-based adsorbents to
efficiently remove the toxic radioactive ions from contaminated water.
2
1. Introduction
While investigating the contamination of the environment by radioactive ions from
the heap-leach residues of the uranium mining industry (such as 226Ra2+ ions) and
while addressing the by-product of nuclear fission reaction (such as 90Sr2+) as well as
the leakage of the nuclear reactors; one should not be daunted, extensive research is
underway to develop advanced technologies for the elimination of hazardous
radioactive ions from water [1-7].
In fact, different methods are used to remove radioactive metal ions from waste water
such as ion exchange and adsorption [8-11]. Ion exchange processes are selective,
very effective and are able to remove very low levels of metal ions from solutions
[12-16]. However, the development of materials with a high level of efficiency and
selectivity by an order of magnitude is still in its infancy. In fact, the ever more
sophisticated future versions of scavenger solids also demands a framework capable
of binding guests such as radioactive ions inside irreversibly, without any leaching as
a safe storage material [1].
Environmental remediation efforts have been somewhat successful after the discovery
of the following materials. Organic resins are unlikely to compete with zeolites and
other clay absorbents due to their limited long-term stability under high radiation
conditions as well as due to their high cost [4]. Moreover, the inability of organic
resins to maintain permanent thermal, chemical, mechanical and radiation stabilities
as well as their inability to avoid structural rearrangements upon guest exchange has
been an obvious drawback [17, 18]. In spite of the promise for selectivity and high
radiation stability, zeolite and clays are high pH responsive materials [19]. However,
synthetic inorganic cation-exchangers provide the best examples of practical success.
One of the first examples of such a solid was synthetic mica, which has an efficiency

3
that is larger than the efficiency of any natural inorganic exchangers [3, 5]. Another
example is a -zirconium phosphate framework [2]. Very recently developed titanate
[1, 20, 21] and niobate [6, 7] solids has exhibited a high storage capacity as well as a
high selectivity. Moreover, synthetic inorganic cation exchangers appear to be
particularly suitable for immobilizing radioactive ions and thus mitigate toxicity from
water [3, 5]. It can be observed that these reinforced solids favour the uptake of
radioactive ions not only at distinctly lower concentrations, but also with a
considerably higher degree of selectivity [2-7, 21]. These new types of synthetic
cation exchangers, which can act as host materials, involve the immobilization of the
nuclear waste that is being developed; however, the commercial viability of the
resultant solids is often limited because of the high production cost. Clearly, although
suitable compounds have not yet been found and numerous challenges remain, this
slowly advancing area will deliver exciting developments in future. The synthesis of
an efficient material also constitutes other challenges such as low yield, low speed and
low reproducibility, which although not new, however remains unsolved. We have
recently begun to fabricate structures with nanometric precision in order to
incorporate several of these desirable features into one solid-stage material.
Recently, sodium niobate molecular sieves doped with Ti/Zr -IV were synthesized by
hydrothermal treatment [6, 7]. It was found that the sodium niobate molecular sieves
can selectively adsorb Sr2+ ions from highly concentrated Na+ aqueous solutions [22].
A structural evolution during the reaction between the Nb2O5 powder and the
concentrated aqueous NaOH solution under hydrothermal conditions was also
reported by our group [23], which provides a marvelous opportunity for the further
growth of the niobate community.

4
Herein, a new family of Ta(V) doped sodium niobates were synthesised using
chloride precursors via the reported hydrothermal reaction at 165 ºC. The Ta:Nb ratio
in the resultant product is directly correlated with the precursor molar ratio for the
range of 0 – 10% Ta:Nb. Within this composition range, bar-like solids with poor
crystalline and well-crystallized fibers (2%) are formed based on powder X-ray
diffraction (XRD) and scanning electron microscopy (SEM). The bar-like solids
possess excellent abilities to exchange with the radioactive Sr2+ and Ra2+ (Ba2+) ions
in water. More importantly, by monitoring the structural change before and after
adsorption with XRD and Raman spectroscopy, we are able to determine the
structural collapse of bar-like solids due to the toxic bivalent ions that are exchanged
with Na+ ions in the solids. The structural collapse induced by the ion-exchange
process entraps the radioactive ions in the adsorbents permanently, so that the
hazardous radioactive contaminants can be safely disposed of. This is significant
research on efficient adsorbents for the removal of radioactive ions from water.
2. Experimental Section
2.1 Sample preparation
All of the chemicals used were reagent grade or better and were provided by the
Sigma Chemical Cooperation. TaV doped sodium niobates were synthesised starting
with the NbCl5 and the TaCl5 precursors. The incorporation of tantalum into the
niobates was carried out by dissolving 0.5 g of NbCl5 in 20 ml of a dry propan-2-ol
mixed with a different weight ratio of tantalum, which was in the range from 0, 0.5, 1,
2, 5 to 10% under nitrogen flow. When the NbCl5 dissolved in propan-2-ol was used
as a Nb precursor, a yellow precipitate initially appeared after the propan-2-ol
addition, which disappeared again after stirring for 20 min. A transparent solution was
obtained after 24 h of stirring, to which 10 ml of distilled water was carefully added in
5
a dropwise manner and finally a transparent gel was formed after 24 h. The
precipitates were separated by filtration and washed with deionised water several
times in order to remove the chlorides. The resulting mixture of oxides was then
reacted with 10 M of sodium hydroxide under hydrothermal conditions. The syntheses
of Ta incorporated niobates were prepared in specially designed autoclaves at 165 ºC
for 2 h. The solid products in the reaction mixture were recovered by filtration,
washed several times with deionized water, then with ethanol once, and finally dried
at 100 ºC for 24 h. These syntheses were perfectly reproducible.
2.2 Adsorption experiments
It should be noted that radioactive strontium and radium ions are highly hazards in
nature, therefore due to safety reasons all of the studies were carried out in a non-
radioactive environment. In a further compilation of relevant literature, we found that
Ba2+ ions (1.36 Å) have a extremely similar ionic radius to radioactive 226Ra2+ ions
(1.43 Å) as well as possessing a similar ion exchange property [24]. Therefore, there
is a significant incentive to use barium as a representative of radium in order to mimic
all of the properties of radium except for the radioactivity. In such a situation we also
used non radioactive strontium. The sorption isotherm of M2+ ions (M2+ = Sr2+ and
Ba2+) were determined by equilibrating 10 mg of adsorbent in 50 ml of SrCl2 or
BaCl2 solutions at concentrations between 0 to 200 ppm for 24 h at room temperature.
In fact, the deposition of a carbonate such as SrCO3 or BaCO3 is often accompanied
on the surface of the sorbent at a high pH level. In order to avoid this tendency the pH
of the solution was adjusted to a range between 6 and 7 using diluted HCl solution
during the adsorption process.
The distribution coefficients (Kd) were determined by the analysis of the filtered
solution [3, 6, 25] and were calculated from the expression:

6
where Co is the initial concentration (mg/ml), Ceq is the concentration after
equilibrating (mg /ml), V is the solution volume (ml) and m is the mass of exchanger
(g). The Kd represents the ratio of the amount of barium or strontium adsorbed per
gram of solid to the amount of strontium or barium remaining per milliliter of the
solution, and thus has units mL/g.
2.3 Characterization
Niobate materials were characterized by scanning electron microscopy (SEM), power
X-ray diffraction (XRD), Raman spectra, and diffuse reflectance UV-visible (DR-
UV-Vis) spectroscopy techniques prior to and after adsorption experiments. Raman
spectra were measured by the presentation of the dehydrated sample on a stainless
steel slide and the spectra were collected on Renishaw 1000 Olympus BHSM
microscope system equipped with 10× and 50× objectives, which was fitted with a
monochromator, a filter system and a charge coupled device (CCD). The excited
source was a Renishaw doubled laser diode-pumped Nd-YAG emitting at a
wavelength of 633 nm at a resolution of 4 cm−1 in the range between 100 and 4000
cm−1. Repeated acquisition using the highest magnification was accumulated to
improve the signal-to-noise ratio. Spectra were calibrated using the 520.5 cm−1 line of
a silion wafer. SEM images were taken with an FEI Quanta 200 scanning electron
microscope. XRD patterns of the sample powder were recorded on a Siemens D5000
diffractometer equipped with a graphite monochromator. Cu Kα radiation and a fixed
power source (40 kV and 40 mA) were used. The data were collected over a 2θ range
between 4 and 75°, at a scanning rate of 2.5°/ min. The diffuse reflectance UV-visible
(DR-UV-Vis) spectra of the samples were acquired with the Varian Cary 5E UV-Vis-

7
NIR spectrophotometer. The concentration of M2+ in the aqueous solution was
analyzed by ion coupled plasma (ICP) technique using a Varian Liberty 200 ICO
emission spectrometer.
3. Results and discussion
3.1 Particle morphology
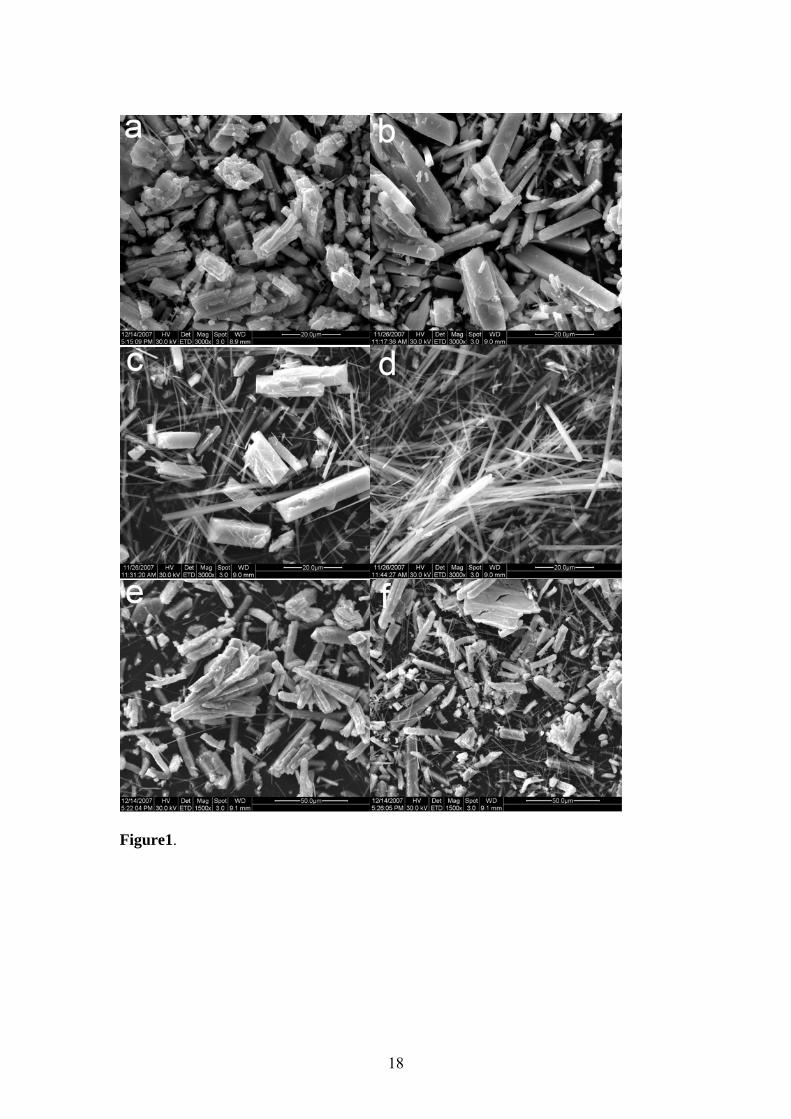
The SEM images of the samples in Figure 1 illustrate the interesting morphological
changes of the solids by incorporating TaV in various percentages into the frame work
structures. Without any doping, the niobate product displays grain morphology of
several micrometers in size (Figure 1a), which is similar to our reported early-stage
niobate samples prepared at 180 ºC by the use of Nb2O5 as a reagent [26]. With the
introduction of 0.5% TaV, long bar-like particles with a length of tens of micrometers
were obtained (Figure 1b).
A few fibres with a length of tens of micrometers and a width of several micrometers
were formed at the expense of the bars were observed in 1% TaV doped sample
(Figure 1c). As the doping amount of TaV increased to 2%, highly uniform fibril
morphology was obtained (Figure 1d). It has also been observed that a further
increase in the TaV amount leads to a disappearance of the fibre structure. For
example, when the doped TaV amount had reached a level of 5% and 10%, the fibre
phase had almost totally disappeared and only long bar-like particles were retained
(Figure 1e and 1f). This result suggests that a change in the amount of TaV, was found
to cause a change in the morphology as well as in the overall crystalline nature of the
products.

8
3.2 XRD Patterns and Raman Spectra
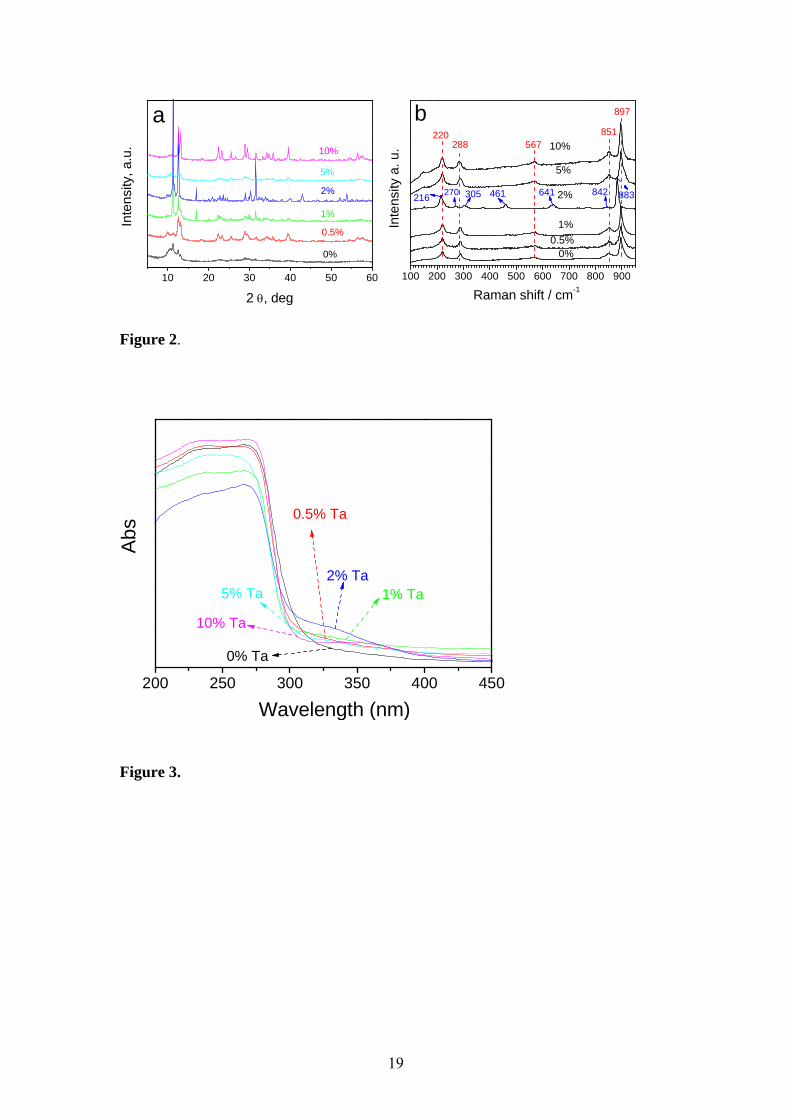
The XRD patterns of the solids are presented in Figure 2a. For the pure fibre phase
(2% TaV), the reflection peaks in the XRD pattern are narrow and have a high
intensity, indicating well-crystallized fibres were formed. The crystal parameters are
the space group C2/c, a = 16.984 Ǻ; b = 5.0245 Å; c = 16.432 Ǻ; β= 113.88º. These
results fit in well with recent reported work [22]. However, the reflection peaks in the
XRD patterns of other samples are broad and have a low intensity, this means that less
crystallinity exists in these bar-like solids (Figure 1). The Raman spectra of samples
have features typical of niobate phases [27-32]. Similar to the XRD patterns of the
samples, the Raman spectrum of the pure fibre niobate is different from those of the
bar-like solids (Figure 2b). For the bar-like solids, the strong peak at 897 cm1 is
assigned to the short Nb=O stretching mode (A1g), and an intrinsic band at 851 cm1 is
due to the vibration of the short Nb=O bond (~1.8 Å). A weak band was also found
that at 567cm1; this peak was found to correspond to the Eg mode arising from
stretching the vibration of Nb-O-Nb [23]. The Raman lines at 290 and 220 cm1 can
be assigned as the A1g and T2g modes of the bar-like niobate phase, respectively. The
A1g mode at 290 cm1 arising from the breathing vibration of the long NbO bond and
T2g mode at 220 cm1 reveals the bending vibration of the NbONb (bridging O
atom) [30]. For the 2% Ta doped sample, new bands at 461 and 641 cm-1 were
observed. The former corresponds to the bridge NbO stretching mode together with
the T2g symmetry and the latter is also probably associated with the edge-sharing of
the NbO6 octahedra [23]. The other obvious change is due to the fact that the band has
disappeared at 570 cm1. Furthermore, the A1g band observed at 288 cm1 in the
spectra of poor-crystallized solids is split into two weak bands at 270 and 305 cm1,
9
respectively. The bands at 897 and 851 cm1 are shifted to 883 and 842 cm1,
respectively. These spectra are basically similar to those of our previously reported
sodium niobates [23]. However, no Raman bands of crystalline Ta2O5 were observed
at 105, 253 and 627 cm1 in any of the solids [33, 34].
According to our previous work, the bar-like solids in the less crystalline phase are
mainly composed of intermediate with edge-sharing Nb6O198- units. The well-
crystallized fibril solids are composed of edge-sharing NbO6 octahedral units [23].
Note that the central Nb atom is octahedrally coordinated by six oxygen atoms in each
unit. Clearly, these octahedra form the primary building blocks of different
morphologies by sharing corners as well as occasionally sharing edges and faces
depending on the hydrothermal conditions. In our tantalum doped hydrothermal
syntheses of niobates, the doped elements take part in the coordination entities. As a
result those metal cations influence the build up of the polyhedra which were
connected in the sequence. All of the hydrothermal preparations have a Nb:Ta ratio
within a relatively narrow range. Too much or too little tantalum in these reactions
gives rise to bar like-solids that do not crystallize well. However, the detailed
mechanism herein is not clear although these syntheses are perfectly reproducible.
3.3 UV-Visible Spectra
Figure 3 presents the UV-vis spectra of various niobate products. According to the
early reports [23, 35-37], oxygen to metal charge transfer bands can be influenced by
the transition metal ion as well as by the number of oxygen atom surrounding it.
Therefore, the changes in UVvis absorbance upon doping are consistent with the
types of transition metal oxide configurations present in the sample. Pure Ta2O5
exhibits a main adsorption band at 270 nm which is from the octahedral configuration

10
of Ta5+ ion [38]. As anticipated, 2% of the TaV doped sample with pure fibril
morphology and the well-crystallized phase have weak but distinguishable charge-
transfer transitions at above 300 nm because the fibril sample is mainly composed of
edge-sharing NbO6 octahedra, which concurs with the XRD and the Raman results.
For the 1% TaV doped sample, the intensity of the absorption at above 300 nm is the
second highest because it was composed both of a fibre and of a bar-like solid. Other
samples, especially the undoped ones, displayed weak absorption. These are mainly
composed of intermediates with edge-sharing octahedra, and their absorption bands
were observed at only ~250 nm. Furthermore, the spectra of pure niobate (0% Ta)
showed the same evolution as the spectra obtained for 10% Ta mixed Nb oxides. An
obvious shift of absorption bands can be seen for various concentration of Ta in the
niobate matrix. This significant shift means that the presence of Ta within the niobate
matrix not only influences the morphology of the products, but also has an effect both
on the lattice structure and on the electronic properties.
3.4 Sorption of bivalence radioactive ions
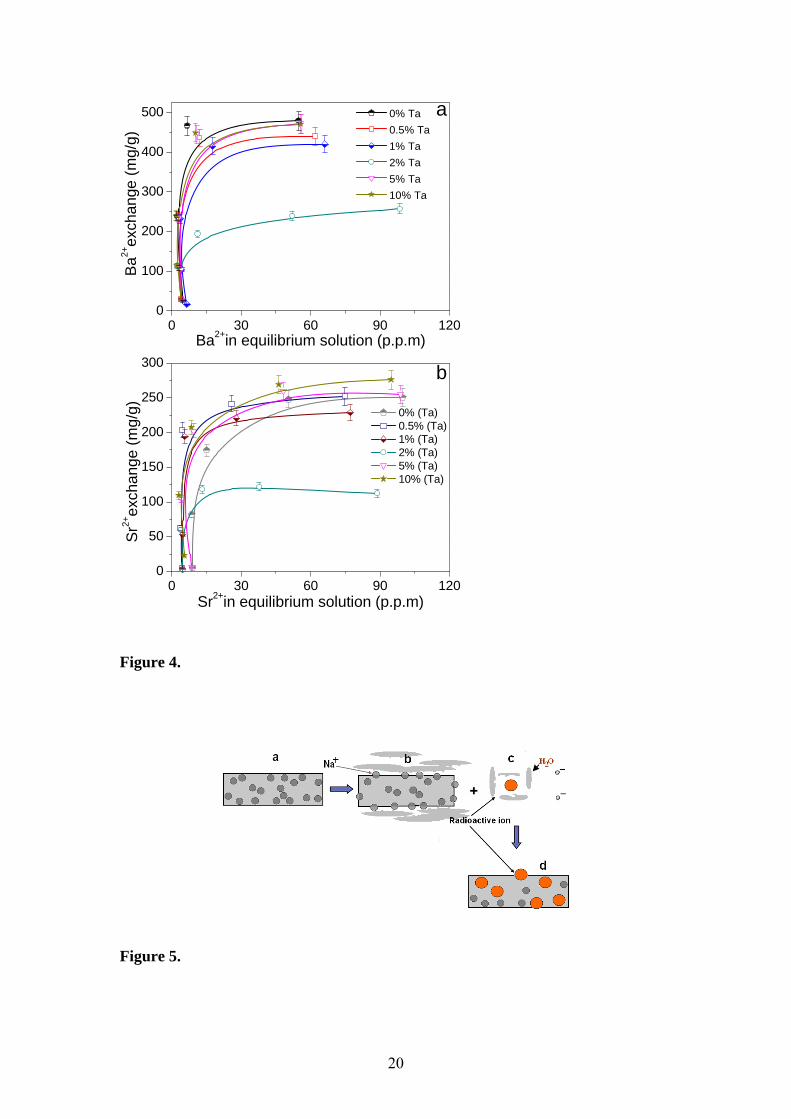
Figure 4 illustrates the adsorption isotherms of Ba2+ and Sr2+ by various amounts of
the tantalum doped niobate samples. For the removal of the Ba2+ ions (Figure 4a), the
bar-like solids exhibited high sorption ability. For instance, the uptake capacities of
Ba2+ ions by 0, 0.5, 5, and 10% TaV doped samples are quite similar and are ~ 470
mg/g. However, 2% of the Ta doped fibre phase sample displays weak sorption ability
with its capacity being only ~ 220 mg/g. The uptake capacity of 1% TaV doped
sodium niobate was composed of bar-like solids and few fibres are ~ 400 mg/g. For
the removal of the Sr2+ ions, the bar-like solids also displayed a higher exchange
capacity than the fibril one (Figure 4b). This is similar to the sorption of the Ba2+ ions.

11
For example, the uptake capacities of the Sr2+ of bar-like solids were doped with 0.5,
5, and 10% TaV are 250, 260, and 270 mg/g, respectively. The value of the pure
sodium niobate solid is slightly less than 250 mg/g. This means that the availability of
exchangeable Na+ ions in poorly-crystallized bar-like solids is more than that of the
well-crystallized fibres. The results presented above highlight the impact of tantalum
in the framework design and the resulting morphological forms obtained after
hydrothermal synthesis, which performed differently in the ion-exchange processes.
Too much (10%) or too little (0% and 0.5%) tantalum in the reactions gives rise to
solids which don’t crystallize well. These less crystalline solids possess loosely held
frameworks and therefore more ions are easily available for exchange reactions.
Furthermore, the exchange of radioactive ions in the framework of weakly crystalline
solids often imparts a high degree of apparently random rearrangement in the
framework, which favours the encapsulation of radioactive ions irreversibly inside the
framework. The sorption data leaves no doubt that the incorporation of TaV affecting
the formation of the framework which can easily control the availability of the
exchangeable Na+ ions. Furthermore, the semi crystalline solids contribute more
active adsorption sites for the exchange of radioactive sites.
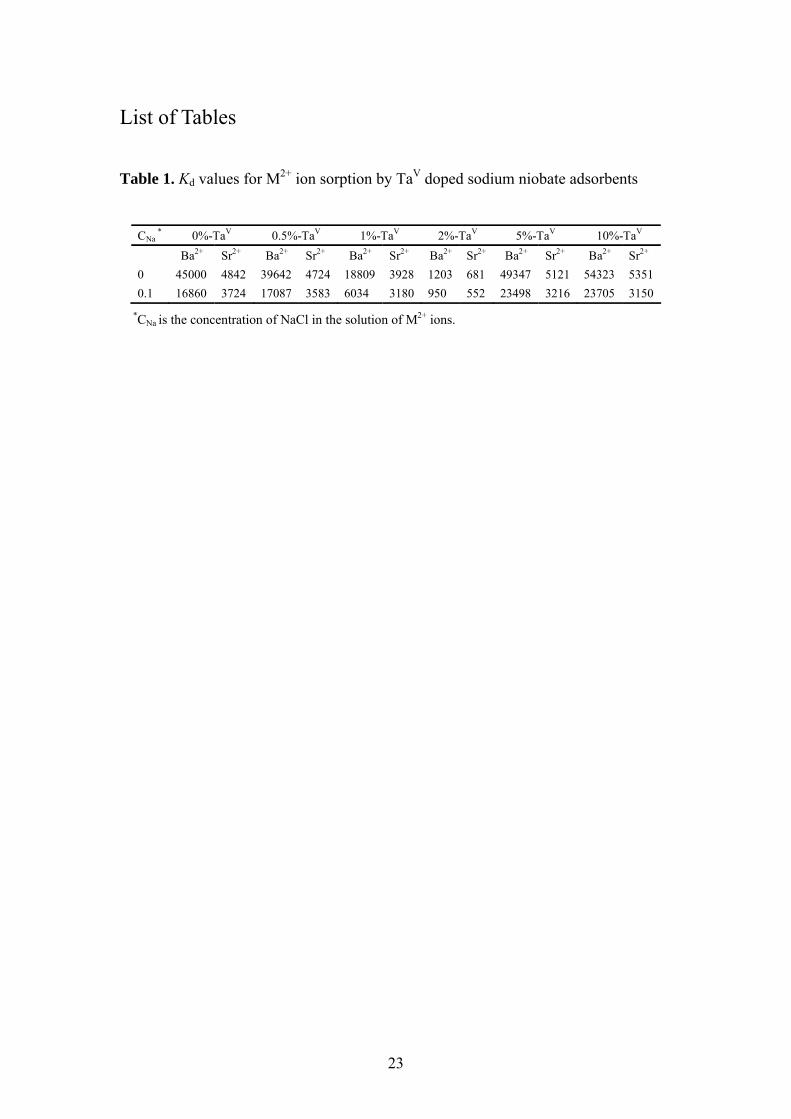
The distribution coefficient, Kd, represents the ratio of the concentration of M2+ ions
absorbed on one gram of various forms of niobate versus the concentration of M2+ left
in solution (per milliliter) and is listed in Table 1. It can be observed that the bar-like
solids doped with 0.5, 5, and 10% TaV exhibit higher Kd than those of the fibril one;
this is due to the higher sorption capacities of the Ba2+ and Sr2+ ions. Furthermore, it
is also noted that even in the presence of the sodium ions Kd remains significantly
high for semi-crystalline solids. This is a succinct illustration of the fact that the semi-
12
crystalline solids have achieved optimum crystallinity in order to gain maximum
selectivity for the removal of radioactive ions.
As seen in Figure 5, the exchange of radioactive ions was carried out in two different
steps: 1) the hydration of the sodium ions that were present in the niobate crystals and
that resulted is the formation of micelle 2) the hydrated Sr2+ and Ra2+ (Ba2+) were
exchanged with sodium ions due to its less tendency to form soluble products which
creates products with less free energy. The property of permanently trapping the
radioactive cations allows us to isolate the radioactive ions from the contaminated
water, so that the tantalum doped sodium niobate and the used adsorbents can be
disposed of safely without the risk of release of the adsorbed cations from the
adsorbents that may cause secondary contamination. To ensure the binding of
radioactive ions inside the niobate solids, we carried out a desorption test. The solid
contents were separated out from aqueous solutions by using a centrifuge. The
recovered solids were kept at 80 oC for 24 h. Water was then added to the solid
samples and the dispersions were equilibrated in a shaker at room temperature for 48
h. The salt contents released into the water were analyzed by an ICP technique. This
experiment revealed that bar-like solids showing a high level of leaching resistance
from the framework. It was found that only ~ 5% of the adsorbed M2+ ions were
detected in the solution for the bar-like solids, indicating that ~ 95% of the radioactive
ions had been locked in the adsorbents. However, in the sample with fibril
morphology, 90% of the adsorbed M2+ ions were detected in solution. This means that
it is more feasible to use the bar-like solids as adsorbents in the removal of radioactive
ions from water.

13
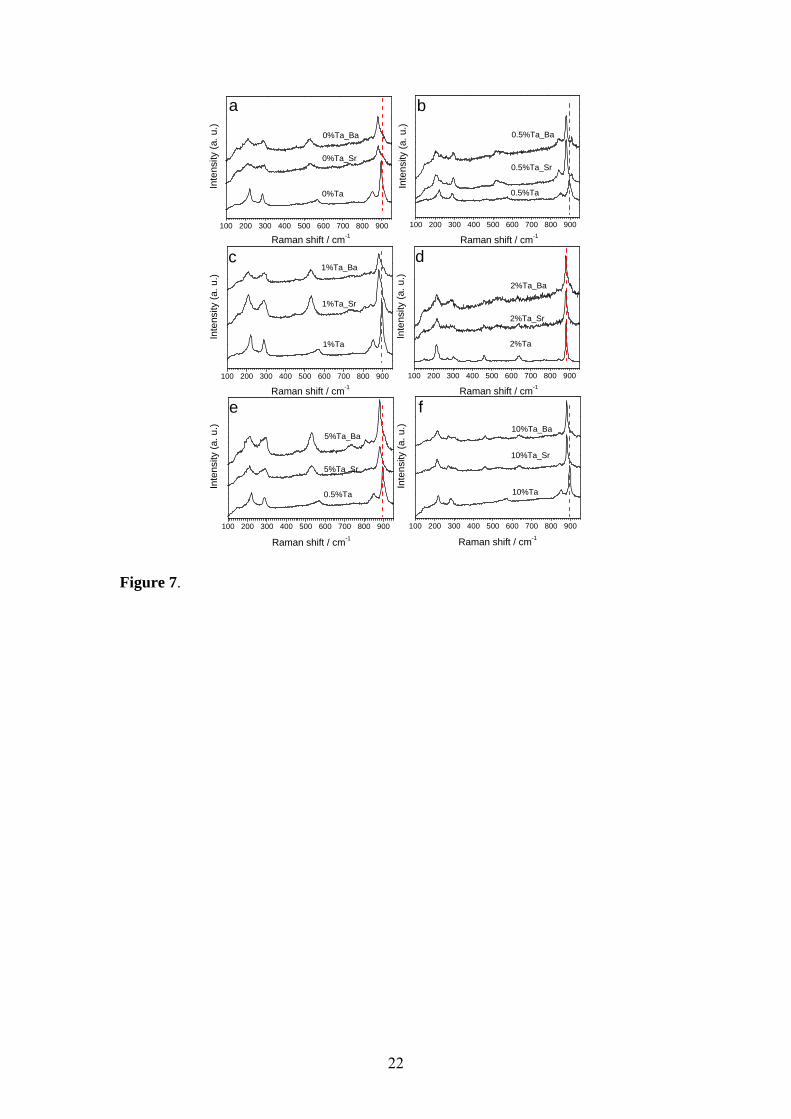
To uncover the large difference in the adsorption properties between the bar-like
solids and the fibre adsorbents, we compared the XRD patterns and the Raman spectra
of the TaV doped sodium niobates before and after sorption. The XRD patterns are
shown in Figure 6. For the bar-like solids, the XRD patterns changed greatly after
sorption (Figure a, b, e, and f). The most obvious variation is that the peaks between
2 = 20 and 60 disappeared or decreased significantly after the sorption of Ba2+ and
Sr2+ ions. It is also noticeable that the peaks at 2 = 10 to 15 shifted to a low angle
after sorption of Ba2+ ions. Although the structural change is too complicated to be
analyzed in detail, we can determine that both the higher sorption capacity and the
leaching resistance are due to the easily changed structure of the bar-like solids.
Because the bar-like solids are poorly-crystallized, the sodium ions in the solids can
be more easily exchanged by the radioactive ions. After sorption, the structure of the
metastable solids were either deformed or collapsed. This resulted in the radioactive
ions being locked into the solids and not being released again. However, for the fibril
solid, no structural change is observed after the sorption process (Figure 6d). As
discussed in Figure 6, the fibre adsorbent is a well-crystallized solid. Therefore the
sodium ions available for the exchange of Ba2+ or Sr2+ are relatively few compared to
the quantity of bar like solids. The XRD signals obtained from the sample after the
adsorption of radioactive ions were essentially identical to the corresponding fresh
fibres. Furthermore, the crystal structures of the fibres were almost insensitive to the
adsorption process, indicating that radioactive ions that were added were not involved
in the framework rearrangement. Therefore the recovered radioactive ions were easily
leached out from the framework. For the solid composed of bars and fibers, only the
bar-like solids really adsorb the radioactive ions and the fibril solids are not strongly
involved in this part of the absorption process. Therefore, the peaks that correspond to
14
the poorly-crystallized bar solids are changed after adsorption and the peaks that are
assigned to the fibril phase still remain unchanged (Figure 6c). The Raman spectra
provide similar results with the XRD pattern (Figure 7).
4. Conclusion
Sodium niobates doped with different amount of TaV (0, 0.5, 1, 2, 5, and 10%) were
prepared via thermal reaction process. Pure nanofibril solids can be obtained when
2% TaV was introduced into the reaction system. These hybrid fibers are well-
crystallized and are mainly composed of edge-sharing NbO6 octahedra. Bar-like
solids can be obtained under other conditions. These bar-like solids are poorly-
crystallized and are mainly composed of intermediates with edge sharing Nb6O198-
units. It was observed that the bar-like solids possess high sorption capacities for
bivalent radioactive ions, such as Sr2+ and Ra2+ (Ba2+). And even though in presence
of lots of Na+ ions, the solids are able to selectively adsorb the bivalent radioactive
ions. More importantly, considerable structure deformation or collapse occurs during
the sorption process, resulting in entrapment of the dangerous bivalence cations in the
solids. In particular, it is possible that a metastable framework rather than a rigid
structure, which consequently enabled the solids to be suitable for concentrating most
of the radionnuclides from contaminated water and would allow the bulk of the waste
to be disposed of. Obviously, the newly prepared Nb-based adsorbents may develop
new pathway to remove the toxic radioactive ions from contaminated water.
Acknowledgment
This research is supported by the Australian Research Council (ARC). The author is
grateful to Prof. H.Y. Zhu for his aid in the data analysis.
15
References
[1] D.J. Yang, Z.F. Zheng, H.Y. Zhu, H.W. Liu, X.P. Gao, Advanced Materials 20 (2008) 2777. [2] S. Komarneni, N. Kozai, W.J. Paulus, Nature 410 (2001) 771. [3] W.J. Paulus, S. Komarneni, R. Roy, Nature 357 (1992) 571. [4] S. Komarneni, R. Roy, Nature 299 (1982) 707. [5] S. Komarneni, R. Roy, Science 239 (1988) 1286. [6] M. Nyman, A. Tripathi, J.B. Parise, R.S. Maxwell, W.T.A. Harrison, T.M. Nenoff, Journal of the American Chemical Society 123 (2001) 1529. [7] M. Nyman, A. Tripathi, J.B. Parise, R.S. Maxwell, T.M. Nenoff, Journal of the American Chemical Society 124 (2002) 1704. [8] P.K. Mohapatra, D.S. Lakshmi, A. Bhattacharyya, V.K. Manchanda, Journal of Hazardous Materials 169 (2009) 472. [9] T.P. Valsala, S.C. Roy, J.G. Shah, J. Gabriel, K. Raj, V. Venugopal, Journal of Hazardous Materials 166 (2009) 1148. [10] F. Belloni, C. Kuetahyali, V.V. Rondinella, P. Carbol, T. Wiss, A. Mangione, Environmental Science & Technology 43 (2009) 1250. [11] P. Sharma, R. Tomar, Microporous and Mesoporous Materials 116 (2008) 641. [12] A. Dyer, J. Newton, L. O'Brien, S. Owens, Microporous and Mesoporous Materials 120 (2009) 272. [13] M.J. Manos, N. Ding, M.G. Kanatzidis, Proceedings of the National Academy of Sciences of the United States of America 105 (2008) 3696. [14] P.K. Mohapatra, S.A. Ansari, A. Sarkar, A. Bhattacharyya, V.K. Manchanda, Analytica Chimica Acta 571 (2006) 308. [15] N. Rawat, P.K. Mohapatra, D.S. Lakshmi, A. Bhattacharyya, V. Manchanda, Journal of Membrane Science 275 (2006) 82. [16] D.L. Guerra, A.A. Pinto, R.R. Viana, C. Airoldi, Journal of Hazardous Materials 171 (2009) 514. [17] B.W. Mercer, L.L. Ames, P.W. Smith, Nuclear Applications and Technology 8 (1970) 62. [18] A. Dyer, A.M. Yusof, J. Inor. Nucl. Chem. 41 (1979) 1479. [19] C.B. Amphlett, L.A. McDonald, M.J. Redman, J. Inor. Nucl. Chem. 6 (1958) 220. [20] G.M. Bancroft, J.B. Metson, S.M. Kanetkar, J.D. Brown, Nature 299 (1982) 708. [21] E.A. Behrens, P. Sylvester, A. Clearfield, Environmental Science & Technology 32 (1998) 101. [22] H.W. Xu, M. Nyman, T.M. Nenoff, A. Navrotsky, Chemistry of Materials 16 (2004) 2034. [23] H.Y. Zhu, Z.F. Zheng, X.P. Gao, Y.N. Huang, Z.M. Yan, J. Zou, H.M. Yin, Q.D. Zou, S.H. Kable, J.C. Zhao, Y.F. Xi, W.N. Martens, R.L. Frost, Journal of the American Chemical Society 128 (2006) 2373. [24] M. Jurado-Vargas, M. Oliguín, E. Erdóñez-Regil, M. Miménez-Reyes, Journal of Radioanalytical and Nuclear Chemistry 218 (1997) 153. [25] R.G. Anthony, R.G. Dosch, D. Gu, C.V. Philip, Industrial & Engineering Chemistry Research 33 (1994) 2702.
16
[26] V.J. Inglezakis, M.D. Loizidou, H.P. Grigoropoulou, Water Research 36 (2002) 2784. [27] B. Morosin, P.S. Peercy, Chemical Physics Letters 40 (1976) 263. [28] J.-M. Jehng, I.E. Wachs, Catalysis Today 8 (1990) 37. [29] S. Lanfredi, L. Dessemond, A.C.M. Rodrigues, Journal of the European Ceramic Society 20 (2000) 983. [30] F.J. Farrell, V.A. Maroni, T.G. Spiro, Inorganic Chemistry 8 (2002) 2638. [31] J.M. Jehng, I.E. Wachs, The Journal of Physical Chemistry 95 (2002) 7373. [32] M.N. Iliev, M.L.F. Phillips, J.K. Meen, T.M. Nenoff, Journal of Physical Chemistry B 107 (2003) 14261. [33] Y. Chen, J.L.G. Fierro, T. Tanaka, I.E. Wachs, The Journal of Physical Chemistry B 107 (2003) 5243. [34] J. Huuhtanen, M. Sanati, A. Andersson, S. Lars T. Andersson, Applied Catalysis A: General 97 (1993) 197. [35] G. Blasse, G.P.M. van den Heuvel, Materials Research Bulletin 7 (1972) 1041. [36] G. Blasse, L.G.J. De Haart, Materials Chemistry and Physics 14 (1986) 481. [37] M. Wiegel, M. Hamoumi, G. Blasse, Materials Chemistry and Physics 36 (1994) 289. [38] W.-J. Chun, A. Ishikawa, H. Fujisawa, T. Takata, J.N. Kondo, M. Hara, M. Kawai, Y. Matsumoto, K. Domen, The Journal of Physical Chemistry B 107 (2003) 1798.
17
List of Figures
Figure1. Niobate solids illustrated by the SEM images of the samples: (a) 0% Ta, (b) 0.5% Ta, (c) 1% Ta, (d) 2% Ta, (e) 5% Ta, and (f) 10% Ta. Figure 2. XRD patterns (a) and Raman spectra (b) of TaV doped niobate specimen.
Figure 3. The DR – UV – Vis spectra of TaV doped sodium niobates
Figure 4. The isotherms of M2+ sorption by the Ta doped niobate samples: (a) Ba2+and (b) Sr2+. Figure 5. Ion exchange assisted absorption of radioactive ions on the framework of niobate: (a) sodium niobate crystals; (b) hydrated sodium niobate crystals; (c) hydrated radioactive ions; (d) sodium ions exchanged with ratioactive ions. Figure 6. The XRD patterns of the TaV doped sodium niobates before and after sorption of M2+ ions. Figure 7. The Raman spectra of the TaV doped sodium niobates before and after sorption of M2+ ions.
18
Figure1.
19
10 20 30 40 50 60
a
10%
5%
2%
1%
0%
0.5%
2 , deg
Inte
nsity
, a.u
.
100 200 300 400 500 600 700 800 900
567
216
220
270 305
897
461 641 842
851
0%0.5%
10%
5%
2%
1%
Raman shift / cm-1
Inte
nsity
a. u
.
b288
883
Figure 2.
200 250 300 350 400 450
Wavelength (nm)
Abs
2% Ta
0% Ta
5% Ta 1% Ta
0.5% Ta
10% Ta
Figure 3.
20
0 30 60 90 1200
100
200
300
400
500
Ba2+
exch
ange
(m
g/g)
Ba2+in equilibrium solution (p.p.m)
0% Ta
0.5% Ta
1% Ta
2% Ta
5% Ta
10% Ta
a
0 30 60 90 1200
50
100
150
200
250
300
Sr2+
exch
ange
(m
g/g)
Sr2+in equilibrium solution (p.p.m)
0% (Ta) 0.5% (Ta) 1% (Ta) 2% (Ta) 5% (Ta) 10% (Ta)
b
Figure 4.
Figure 5.

21
10 20 30 40 50 60
a
2 , deg
Inte
nsity
, a.u
.
0%Ta_Sr
0%Ta_Ba
0%Ta
10 20 30 40 50 60
0.5%Ta_Sr
0.5%Ta_Ba
0.5%Ta
2 , deg
Inte
nsity
, a.u
.
b
10 20 30 40 50 60
1%Ta_Sr
1%Ta_Ba
1%Ta
2 , deg
Inte
nsity
, a.u
.
c
10 20 30 40 50 60
2%Ta_Sr
2%Ta_Ba
2%Ta
2 , degIn
tens
ity, a
.u.
d
10 20 30 40 50 60
2 , deg
5%Ta_Sr
5%Ta_Ba
5%Ta
Inte
nsi
ty,
a.u.
d
10 20 30 40 50 60
10%Ta_Sr
10%Ta_Ba
10%Ta
2 , deg
Inte
nsity
, a.u
.f
Figure 6.
22
100 200 300 400 500 600 700 800 900 0%Ta_Sr
0%Ta_Ba
0%Ta
a
Raman shift / cm-1
Inte
nsity
(a.
u.)
100 200 300 400 500 600 700 800 900
0.5%Ta_Sr
0.5%Ta_Ba
0.5%Ta
b
Raman shift / cm-1
Inte
nsity
(a
. u.)
100 200 300 400 500 600 700 800 900
1%Ta_Sr
1%Ta_Ba
1%Ta
c
Raman shift / cm-1
Inte
nsity
(a
. u.)
100 200 300 400 500 600 700 800 900
2%Ta_Sr
2%Ta_Ba
2%Ta
d
Raman shift / cm-1
Inte
nsi
ty (
a. u
.)
100 200 300 400 500 600 700 800 900
5%Ta_Sr
5%Ta_Ba
0.5%Ta
e
Raman shift / cm-1
Inte
nsi
ty (
a. u
.)
100 200 300 400 500 600 700 800 900
10%Ta_Sr
10%Ta_Ba
10%Ta
f
Raman shift / cm-1
Inte
nsi
ty (
a. u
.)
Figure 7.
23
List of Tables
Table 1. Kd values for M2+ ion sorption by TaV doped sodium niobate adsorbents
CNa * 0%-TaV 0.5%-TaV 1%-TaV 2%-TaV 5%-TaV 10%-TaV
Ba2+ Sr2+ Ba2+ Sr2+ Ba2+ Sr2+ Ba2+ Sr2+ Ba2+ Sr2+ Ba2+ Sr2+
0 45000 4842 39642 4724 18809 3928 1203 681 49347 5121 54323 5351
0.1 16860 3724 17087 3583 6034 3180 950 552 23498 3216 23705 3150
*CNa is the concentration of NaCl in the solution of M2+ ions.