qut digital repository: this is ...eprints.qut.edu.au/32437/1/c32437.pdf · slow heating rate of 1...
TRANSCRIPT
This is the author version published as: This is the accepted version of this article. To be published as : This is the author version published as:
QUT Digital Repository: http://eprints.qut.edu.au/
Frost, Ray L. and Kristof, Janos and Palmer, Sara J. and Horvath, Erzsebet and Jakub, Emma (2010) Thermoanalytical studies of natural potassium, sodium and ammonium alunites. Journal of Thermal Analysis and Calorimetry, 100(3). pp. 961-966.
Copyright 2010 Akadémiai Kiadó/Springer Science+Business Media B.V.

1
Thermoanalytical studies of natural potassium, sodium and ammonium alunites
János Kristóf, a Ray L. Frost b1, Sara J. Palmer, b Erzsébet Horváth,c Emma Jakab d
a Department of Analytical Chemistry, University of Pannonia, H8201
Veszprém, PO Box 158, Hungary b Inorganic Materials Research Program, School of Physical and Chemical Sciences,
Queensland University of Technology, 2 George Street, GPO Box 2434, Brisbane,
Queensland 4001, Australia c Institute of Environmental Engineering, University of Pannonia, H8201
Veszprém, PO Box 158, Hungary d Central Research Institute for Chemistry, Hungarian Academy of Science, H
1525 Budapest, Po Box 17
Abstract:
Dynamic and controlled rate thermal analysis (CRTA) has been used to characterise alunites
of formula [M(Al)3(SO4)2(OH)6 ] where M+ is the cations K+, Na+ or NH4+. Thermal
decomposition occurs in a series of steps. (a) dehydration, (b) well defined dehydroxylation
and (c) desulphation. CRTA offers a better resolution and a more detailed interpretation of
water formation processes via approaching equilibrium conditions of decomposition through
the elimination of the slow transfer of heat to the sample as a controlling parameter on the
process of decomposition. Constant-rate decomposition processes of water formation reveal
the subtle nature of dehydration and dehydroxylation.
Keywords: alunite, thermal analysis, controlled rate thermal analysis, dehydration,
dehydroxylation
Introduction
Interest in alunites stems from a number of reasons: (a) firstly there is the possible
discovery of alunites on Mars and possibly other planets [1, 2]. Such findings implies the
presence of water either at present or at some time in the planetary past, since alunites are
2
only formed from solution through precipitation and crystallisation processes. Interest in such
minerals and their thermal stability rests with the possible identification of these minerals and
dehydrated paragenetically related minerals. There have been many studies on related
minerals such as the Fe(II) and Fe(III) sulphate minerals and jarosites [3-7]. (b): the
importance of alunite formation and its decomposition depends upon its presence in soils,
sediments and evaporite deposits [8-10]. These types of deposits have formed in acid soils
where the pH is less than 3.0 pH units. Such acidification results from the oxidation of pyrite
which may be from bacterial action or through air-oxidation. (c): thirdly alunites are
important from an environmental point of view. Alunites are minerals which can function as
collectors of heavy metals and low concentrations can be found in the natural alunites. Such
minerals can act as a significant environmental sink.
One of the difficulties associated with the analysis of alunites is that they are often
poorly crystalline, making detection using XRD techniques difficult. Another problem
associated with the study of alunites is their thermodynamic stability. Often the minerals are
formed from acid-sulphate rich environments such as acid mine drainage and acid-sulphate
soils and as such their solubility is controlled by climatic conditions, in particular the
temperature. Such minerals lend themselves for thermal analysis. Interestingly, there have
been few recent studies on the thermal analysis of alunites. The reason for this is unclear.
Perhaps it is because of the variation in composition which occurs with natural minerals.
Such variation can be overcome with the use of synthetic minerals. The first recorded thermal
analysis of alunite occurred in 1919. Early studies focussed on the effect of alunite impurity
on the thermal treatment of other chemicals. Many studies occurred when new equipment
became available . Recently thermal analysis has been used to enhance the understanding of
the stability of minerals [11-23].
In this work, as part of our studies of secondary mineral formation and their stability,
we report the comparison of the thermal analysis of selected natural alunites using both
dynamic and controlled rate thermal analysis techniques.
Experimental
3
Minerals
The alunites were obtained from the Mineralogical Research Company, Australia. The
minerals were phase analysed by powder X-ray diffraction and were analysed for chemical
composition by EDX methodology.
Thermal Analysis
Conventional thermal analysis experiment
Thermal decomposition of the alunites was carried out in a Derivatograph PC type
thermoanalytical equipment (Hungarian Optical Works, Budapest, Hungary) capable of
recording the thermogravimetric (TG), derivative thermogravimetric (DTG) and differential
thermal analysis (DTA) curves simultaneously. The samples were heated in a ceramic
crucible in static air atmosphere at a rate of 5 °C/min. The thermoanalytical equipment is
coupled to a mass spectrometer. In order to understand the gas evolution pattern, mass
spectrometric identification of gaseous decomposition products has been carried out in argon
atmosphere in a Perkin Elmer TGS-2 type thermobalance connected to a Hayden HAL 2/301
PIC type mass spectrometer. The heating rate was 10 ºC min-1. As water produces m/z 17
fragment ion, the contribution of water was subtracted from the intensity curve of m/z 17.
Thus the m/z 17 ion represent only NH3+ molecular ion.
Controlled Rate Thermal Analysis (CRTA) experiment
Thermal decomposition of the alunite samples under CRTA conditions was carried
out in the Derivatograph under static air in an open ceramic crucible at a pre-set, constant
decomposition rate of 0.1 mg min-1. (Below this threshold value the samples were heated
under dynamic conditions at a uniform rate of 1.0 °C min-1).. With the quasi-isothermal,
quasi-isobaric heating program of the instrument the furnace temperature was regulated
precisely to provide a uniform rate of decomposition in the main decomposition stage.
Results and discussion
4
The dynamic TG, DTG and DTA patterns of potassium, sodium and ammonium
alunites are shown in Figures 1, 2 and 3 respectively. The results of the conventional constant
rate heating experiment are reported in Table 1. The controlled rate thermal analysis results
are reported in Table 2 and the CRTA patterns of potassium, sodium and ammonium alunites
are shown in Figures 5, 6 and 7.
Dynamic Thermal analysis of potassium alunite
The behaviour of the thermal decomposition is different for the potassium, sodium and
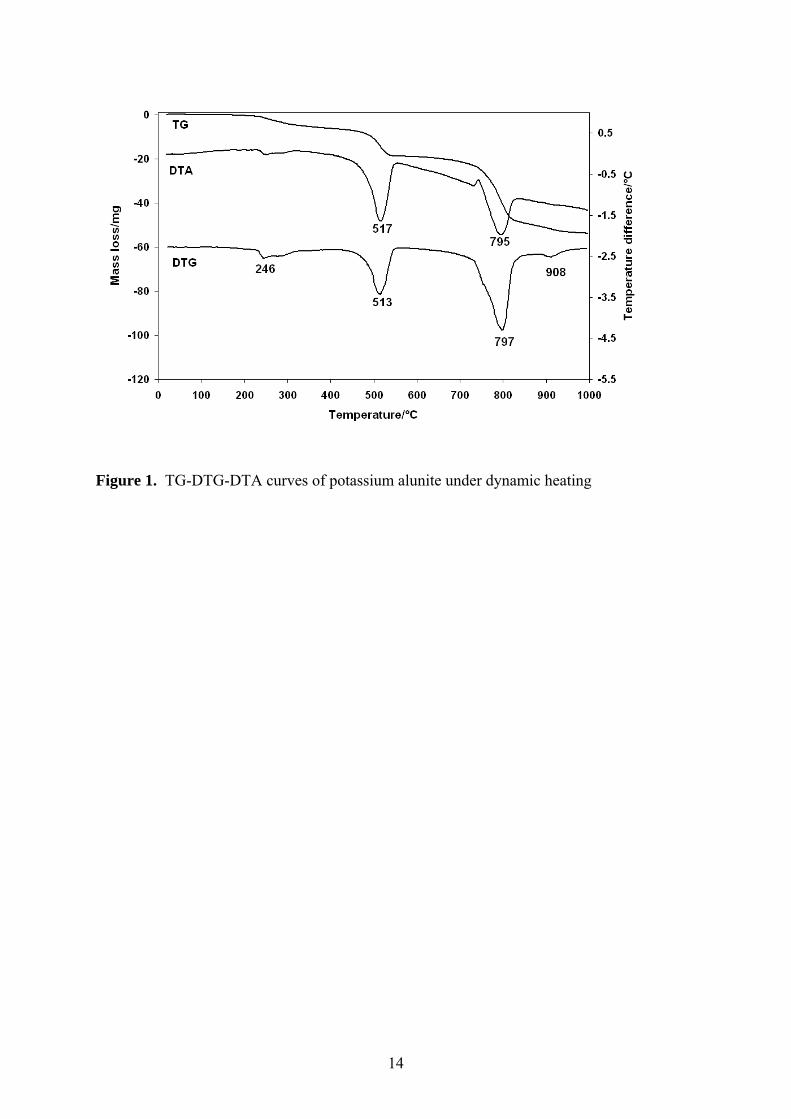
ammonium alunites. The thermal decomposition of potassium alunites takes place in four
mass loss steps as shown in Fig. 1. The mass loss values belonging to the individual
decomposition steps are summarized in Table 1. DTG peak maxima are observed at 246, 513,
797 and 908°C. The DTA patterns shows minima at 246, 517 and 795 °C indicating
endothermic steps in the thermal decomposition process.
Step 1: dehydration
The loss of crystallization water takes place at 246 ºC according to the following equation:
KAl3(SO4)2(OH)6 xH2O → KAl3(SO4)2(OH)6 + xH2O
Based on the TG curve, the exact amount of crystallization water was 1.31 mole.
Step 2: dehydroxylation
Dehydroxylation occurs at 513 ºC resulting in the evolution of 3 moles of water:
KAl3(SO4)2(OH)6 → KAl3O3(SO4)6 + 3 H2O
(the theoretical mass loss is 13.0%, the observed loss is 11.6 %).
Step 3: desulphation
The desulphation reaction occurs in two steps at 797 and 908 ºC leading to the formation of
K2SO4·Al2O3 and alumina as follows:
2 KAl3O3(SO4)6 → K2SO4·Al2O3 + 2 Al2O3 + 3 SO3
(the theoretical mass loss in this reaction is 33.34%, the actual loss is 36.37%).
Dynamic Thermal analysis of sodium alunite
5
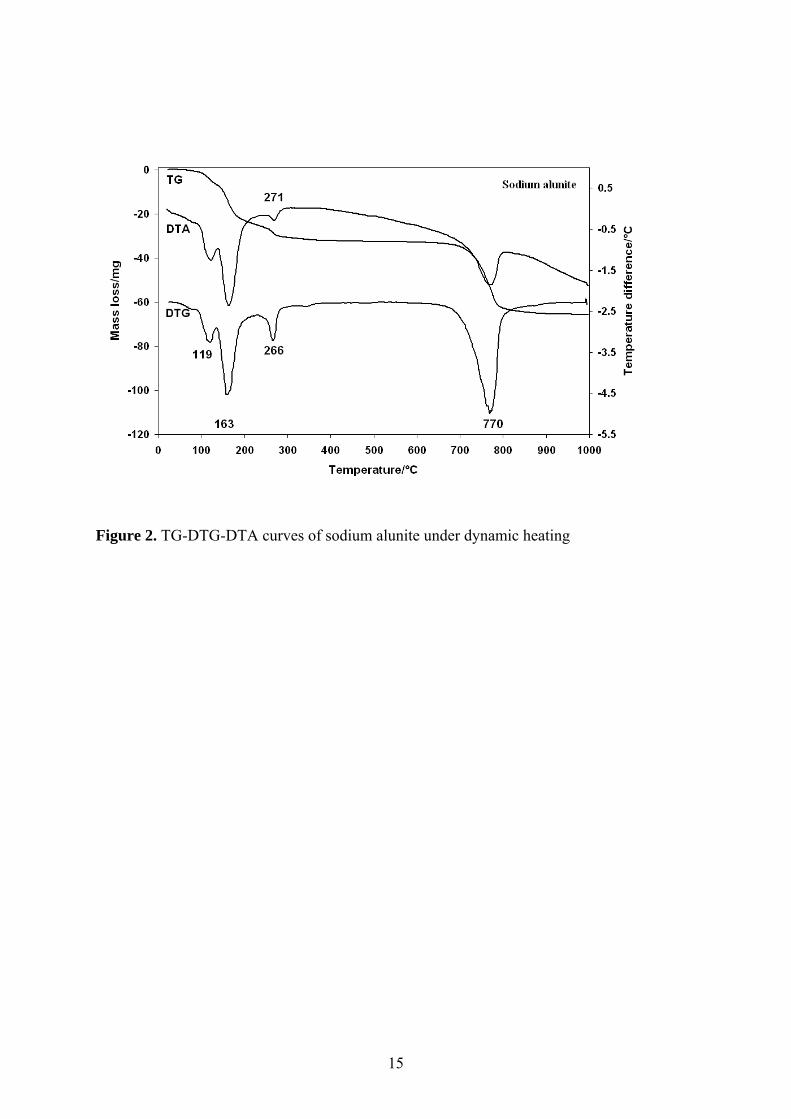
The thermal decomposition behaviour of the sodium alunite appears significantly
different to that of the potassium alunite (Figure 2). The three mass loss steps that appear in
the DTG curve at 119, 163 and 266 °C belong to the liberation of water, while desulphation
occurs in a single process at 770 °C.
Step 1: dehydration
Dehydration is believed to take place in two steps resulting in all together the release of 7.88
moles of water. Therefore, the following dehydration mechanism is proposed:
NaAl3(SO4)2(OH)6 8 H2O → NaAl3(SO4)2(OH)6 6 H2O + 2 H2O
NaAl3(SO4)2(OH)6 6 H2O → NaAl3(SO4)2(OH)6 + 6 H2O
Step 2: dehydroxylation
Dehydroxylation is believed to take place at 266 °C as follows:
NaAl3(SO4)2(OH)6 → NaAl3O3(SO4)2 + 3 H2O
(the theoretical mass loss in this process is 9.54%, while the actual one is 10.41%).
Step 3: desulphation
Sulphur trioxide is released at 770 °C in accordance with the following equation based on
stoichiometric calculations:
NaAl3O3(SO4)6 → NaAlO2 + Al2O3 + 2 SO3
(the theoretical mass loss in this reaction is 46.54%, while the actual amount of SO3 released
is 53.17%).
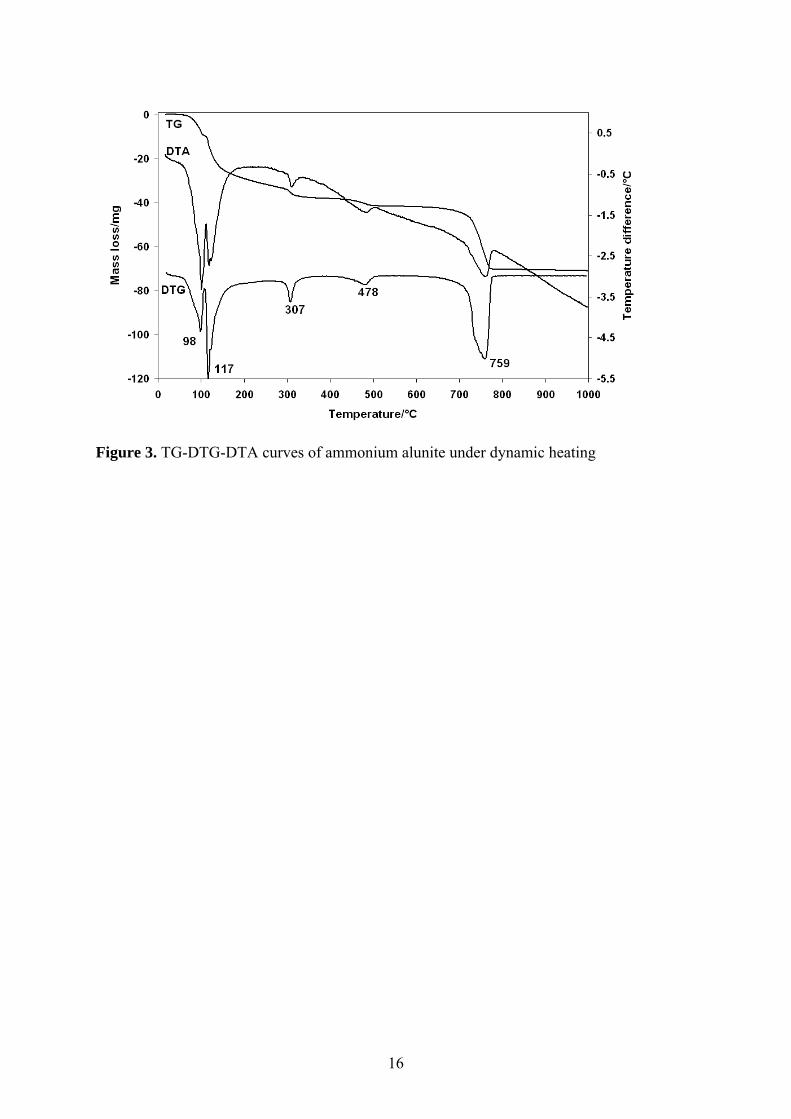
Dynamic Thermal analysis of ammonium alunite
The thermal decomposition of ammonium alunite shows peaks in the DTG curve at
98, 117, 307, 478 and 759°C (Fig. 3). Endothermic peaks in the DTA curves occur at similar
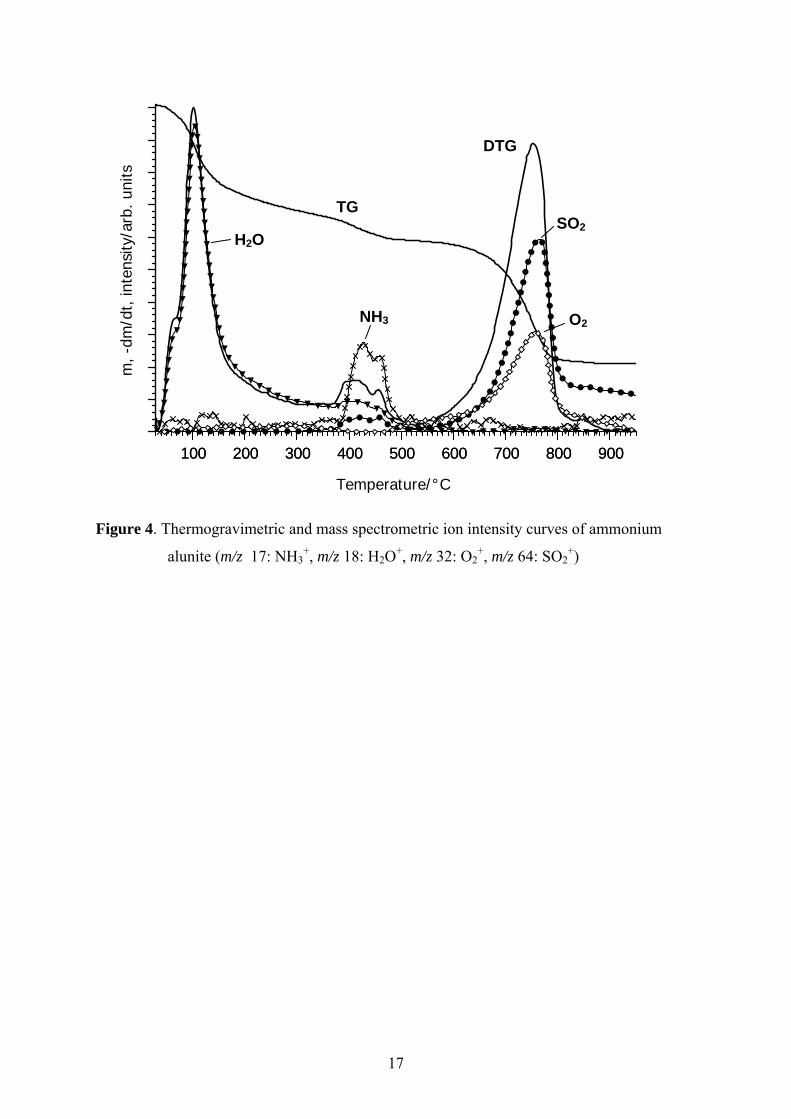
positions. The TG-MS pattern (Fig. 4) is essential to reveal the complicated nature of
decomposition. In the first step water is released, while the two decomposition steps between
300 and 550 ºC belong to the simultaneous evolution of water and ammonia. In the last step
of decomposition sulphur trioxide is liberated, only. However, sulphur trioxide is not stable
under mass spectrometric conditions, therefore the evolution of sulphur dioxide and oxygen
can be monitored.
6
Step 1: dehydration
Since water elimination in the first two steps (at 98 and 117 ºC) belongs to dehydration, the
total amount of crystallization water is 13.0 moles. Thus, the following dehydration
mechanism is proposed:
NH4Al3(SO4)2(OH)6 13 H2O → NH4Al3(SO4)2(OH)6 9 H2O + 4 H2O
NH4Al3(SO4)2(OH)6 9 H2O → NH4Al3(SO4)2(OH)6 + 9 H2O
Step 2: dehydroxylation and de-ammonification
At 307 and 478 ºC dehydroxylation water and ammonia are liberated simultaneously. With
faster heating the two processes merge together as it is witnessed in Figure 4. Thus, the
proposed mechanism of decomposition is as follows:
6 NH4Al3(SO4)2(OH)6 → 6 NH3 + 21 H2O +4 Al2(SO4)3 + 5 Al2O3
(the theoretical mass loss in this process is 20.37%, while the actual loss is 17.60%).
Step 3: desulphation
The decomposition step of the mineral observed at 759 °C is interpreted by liberation of
sulphur trioxide as follows:
Al2(SO4)3 → Al2O3 + 3 SO3
The controlled rate thermal analysis experiment
The thermal decomposition patters of the potassium, sodium and ammonium alunite
samples recorded under CRTA decompositions are shown in Figs. 5 to 7. The mass loss data
are summarized in Table 2. The dehydration process of potassium alunite (Fig. 5) under the
slow heating rate of 1 ºC min-1 can be resolved to four overlapping steps between 100 and
200 ºC, at 222, 257 and 326 ºC. During the dynamic experiment only two dehydration steps
could be identified in the DTG curve. The controlling rate of 0.1 mg min-1 was not reached
until 400 ºC. Dehydroxylation took place in a homogeneous process represented by an
isothermal, constant rate of water evolution at 469 ºC.
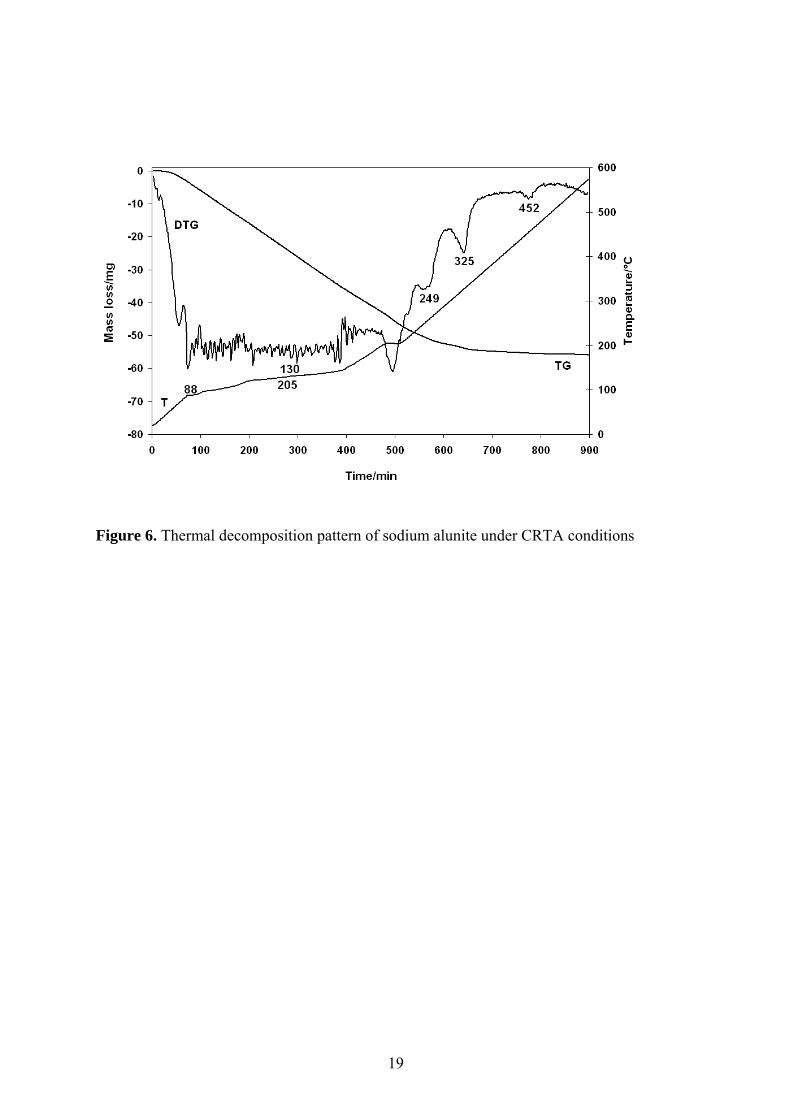
Dehydration of sodium alunite (Fig. 6) under CRTA conditions took place in two
steps (similarly to the dynamic experiment) up to 200 min and between 200 and 400 min. The
controlling level of 0.1 mg min-1 was reached in both steps resulting in a quasi-isothermal
pattern of water evolution at 88 and 130 ºC. Above 400 min dehydroxylation took place in
four steps at 200, 249, 325 and 452 ºC under the slow heating (the rate of decomposition did
7
not reached the controlling level of 0.1 mg min-1). This experiment revealed the subtle nature
of dehydroxylation which was not observed in the dynamic experiment.
The dehydration of the ammonium alunite sample (Fig. 7) took place up to 600 min in
three isothermal steps at 59, 81 and 100 ºC. In the dynamic experiment only two steps can be
distinguished. The parallel process of dehydroxylation and de-ammonification takes place in
two steps (similarly to the dynamic experiment) under the controlling level of 0.1 mg min-1.
Conclusions
Natural alunites show characteristic thermogravimetric patterns with thermal
decomposition steps: (a) dehydration, (b) well defined dehydroxylation and (c) desulphation.
While the patterns of dehydration and dehydroxylation (as well as the amounts of
crystallisation water) differ significantly depending on the nature of the cation, desulphation
is a rather homogeneous process (the DTG peak temperatures fall in the range between 760
and 800 ºC for all the three samples).
CRTA offers a better resolution and a more detailed interpretation of the
decomposition processes via approaching equilibrium conditions of decomposition through
the elimination of the slow transfer of heat to the sample as a controlling parameter on the
process of decomposition. With this technique differences in the dehydration and
decomposition patterns can be revealed suspecting a more complex pattern of decomposition
as revealed under dynamic hating.
It is very important to be able to thermally characterise minerals such as alunites
which may be found on planets such as Mars. The existence of alunites on Mars would
confirm the presence of water at some time in the past as such minerals are only formed from
solution. The thermal stability of alunites is most important as there is a need to find the
temperature range over which the minerals are stable, since wide temperature ranges are
likely on planets.
Acknowledgements
8
This research was supported by the Hungarian Scientific Research Fund (OTKA)
under grant No. K62175. The financial and infra-structure support of the Queensland
University of Technology Inorganic Materials Research Program is gratefully acknowledged.
9
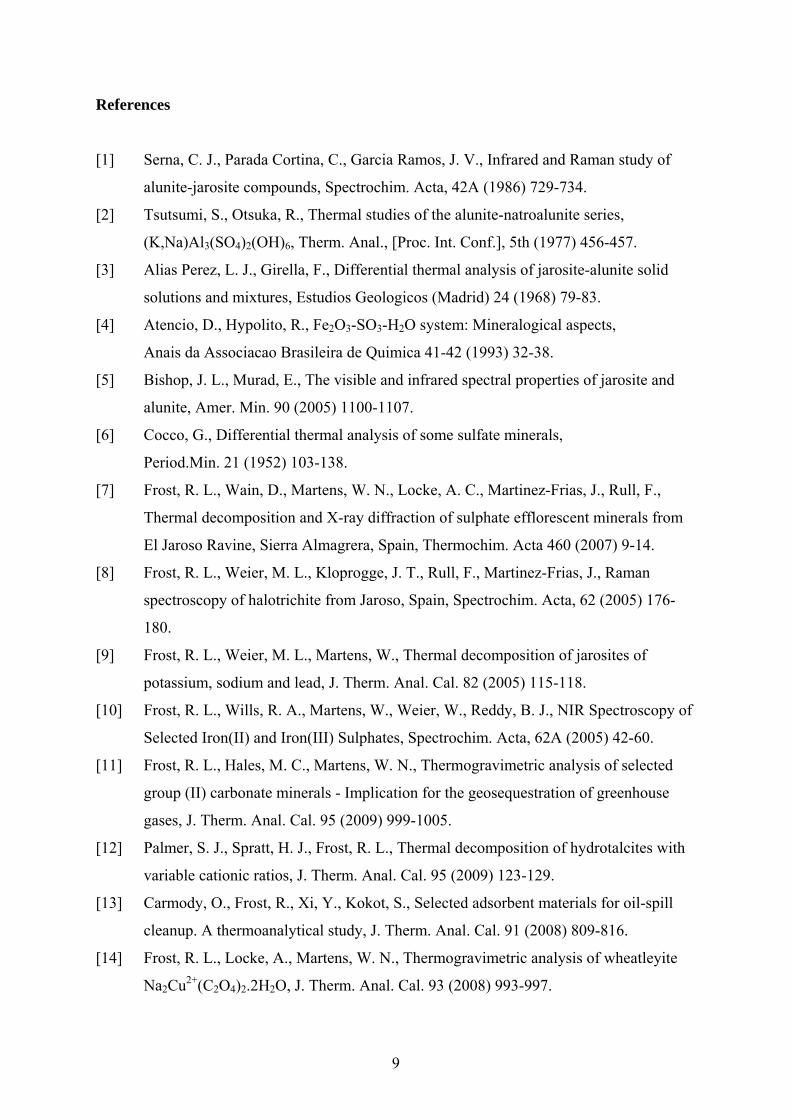
References
[1] Serna, C. J., Parada Cortina, C., Garcia Ramos, J. V., Infrared and Raman study of
alunite-jarosite compounds, Spectrochim. Acta, 42A (1986) 729-734.
[2] Tsutsumi, S., Otsuka, R., Thermal studies of the alunite-natroalunite series,
(K,Na)Al3(SO4)2(OH)6, Therm. Anal., [Proc. Int. Conf.], 5th (1977) 456-457.
[3] Alias Perez, L. J., Girella, F., Differential thermal analysis of jarosite-alunite solid
solutions and mixtures, Estudios Geologicos (Madrid) 24 (1968) 79-83.
[4] Atencio, D., Hypolito, R., Fe2O3-SO3-H2O system: Mineralogical aspects,
Anais da Associacao Brasileira de Quimica 41-42 (1993) 32-38.
[5] Bishop, J. L., Murad, E., The visible and infrared spectral properties of jarosite and
alunite, Amer. Min. 90 (2005) 1100-1107.
[6] Cocco, G., Differential thermal analysis of some sulfate minerals,
Period.Min. 21 (1952) 103-138.
[7] Frost, R. L., Wain, D., Martens, W. N., Locke, A. C., Martinez-Frias, J., Rull, F.,
Thermal decomposition and X-ray diffraction of sulphate efflorescent minerals from
El Jaroso Ravine, Sierra Almagrera, Spain, Thermochim. Acta 460 (2007) 9-14.
[8] Frost, R. L., Weier, M. L., Kloprogge, J. T., Rull, F., Martinez-Frias, J., Raman
spectroscopy of halotrichite from Jaroso, Spain, Spectrochim. Acta, 62 (2005) 176-
180.
[9] Frost, R. L., Weier, M. L., Martens, W., Thermal decomposition of jarosites of
potassium, sodium and lead, J. Therm. Anal. Cal. 82 (2005) 115-118.
[10] Frost, R. L., Wills, R. A., Martens, W., Weier, W., Reddy, B. J., NIR Spectroscopy of
Selected Iron(II) and Iron(III) Sulphates, Spectrochim. Acta, 62A (2005) 42-60.
[11] Frost, R. L., Hales, M. C., Martens, W. N., Thermogravimetric analysis of selected
group (II) carbonate minerals - Implication for the geosequestration of greenhouse
gases, J. Therm. Anal. Cal. 95 (2009) 999-1005.
[12] Palmer, S. J., Spratt, H. J., Frost, R. L., Thermal decomposition of hydrotalcites with
variable cationic ratios, J. Therm. Anal. Cal. 95 (2009) 123-129.
[13] Carmody, O., Frost, R., Xi, Y., Kokot, S., Selected adsorbent materials for oil-spill
cleanup. A thermoanalytical study, J. Therm. Anal. Cal. 91 (2008) 809-816.
[14] Frost, R. L., Locke, A., Martens, W. N., Thermogravimetric analysis of wheatleyite
Na2Cu2+(C2O4)2.2H2O, J. Therm. Anal. Cal. 93 (2008) 993-997.

10
[15] Frost, R. L., Locke, A. J., Hales, M. C., Martens, W. N., Thermal stability of synthetic
aurichalcite. Implications for making mixed metal oxides for use as catalysts,
J. Therm. Anal. Cal. 94 (2008) 203-208.
[16] Frost, R. L., Locke, A. J., Martens, W., Thermal analysis of beaverite in comparison
with plumbojarosite, J. Therm. Anal. Cal. 92 (2008) 887-892.
[17] Frost, R. L., Wain, D., A thermogravimetric and infrared emission spectroscopic
study of alunite, J. Therm. Anal. Cal. 91 (2008) 267-274.
[18] Hales, M. C., Frost, R. L., Thermal analysis of smithsonite and hydrozincite,
J. Therm. Anal. Cal. 91 (2008) 855-860.
[19] Palmer, S. J., Frost, R. L., Nguyen, T., Thermal decomposition of hydrotalcite with
molybdate and vanadate anions in the interlayer, J. Therm. Anal. Cal. 92 (2008) 879-
886.
[20] Vagvoelgyi, V., Daniel, L. M., Pinto, C., Kristof, J., Frost, R. L., Horvath, E.,
Dynamic and controlled rate thermal analysis of attapulgite, J. Therm. Anal. Cal. 92
(2008) 589-594.
[21] Vagvolgyi, V., Frost, R. L., Hales, M., Locke, A., Kristof, J., Horvath, E., Controlled
rate thermal analysis of hydromagnesite, J. Therm. Anal. Cal. 92 (2008) 893-897.
[22] Vagvolgyi, V., Hales, M., Martens, W., Kristof, J., Horvath, E., Frost, R. L., Dynamic
and controlled rate thermal analysis of hydrozincite and smithsonite, J. Therm. Anal.
Cal. 92 (2008) 911-916.
[23] Zhao, Y., Frost, R. L., Vagvolgyi, V., Waclawik, E. R., Kristof, J., Horvath, E., XRD,
TEM and thermal analysis of yttrium doped boehmite nanofibres and nanosheets,
J. Therm. Anal. Cal. 94 (2008) 219-226.

11
List of Tables
Table 1. Temperature and mass loss data of the decomposition of alunite samples under
dynamic conditions.
Table 2. Temperature and mass loss data of the decomposition of alunite samples under
CRTA conditions.
List of Figures
Figure 1. TG-DTG- DTA curves of potassium alunite under dynamic heating
Figure 2. TG-DTG- DTA curves of sodium alunite under dynamic heating
Figure 3. TG-DTG- DTA curves of ammonium alunite under dynamic heating
Figure 4. Thermogravimetric and mass spectrometric ion intensity curves of ammonium
alunite (m/z = 17: NH3+, m/z 18: H2O
+, m/z 32: O2+, m/z 64: SO2
+)
Figure 5. Thermal decomposition pattern of potassium alunite under CRTA conditions
Figure 6. Thermal decomposition pattern of sodium alunite under CRTA conditions
Figure 7. Thermal decomposition pattern of ammonium alunite under CRTA conditions
12
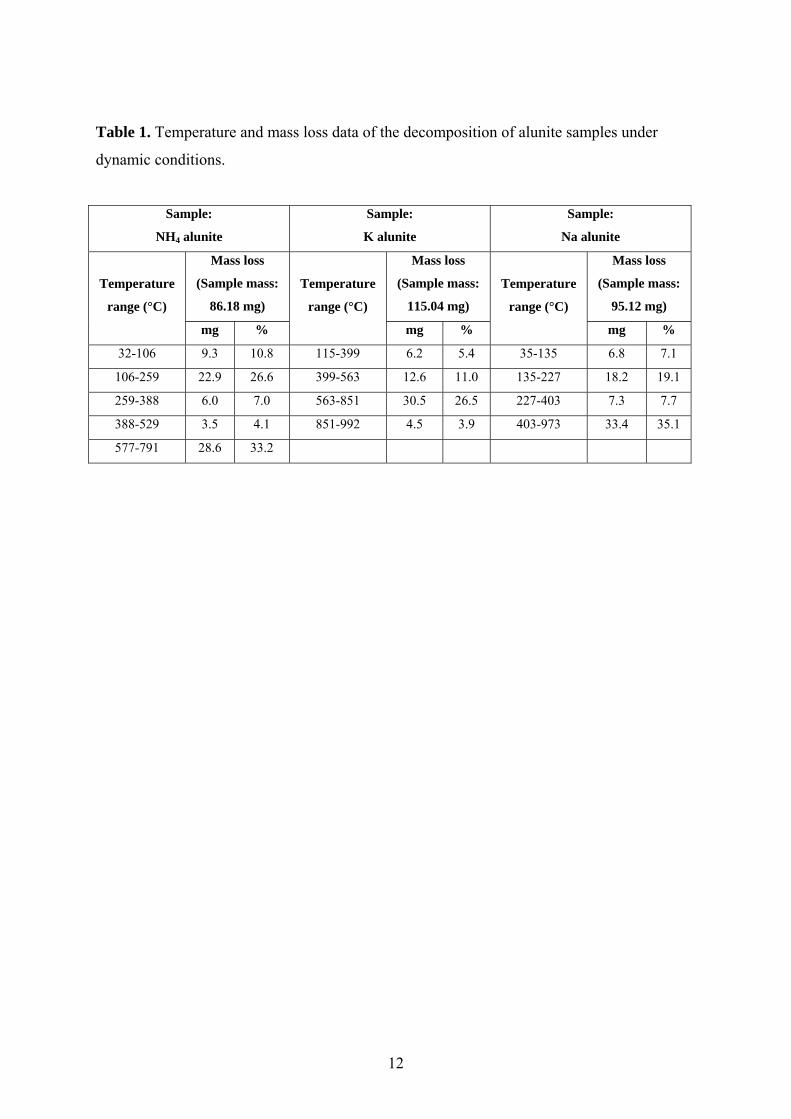
Table 1. Temperature and mass loss data of the decomposition of alunite samples under
dynamic conditions.
Sample:
NH4 alunite
Sample:
K alunite
Sample:
Na alunite
Temperature
range (°C)
Mass loss
(Sample mass:
86.18 mg)
Temperature
range (°C)
Mass loss
(Sample mass:
115.04 mg)
Temperature
range (°C)
Mass loss
(Sample mass:
95.12 mg)
mg % mg % mg %
32-106 9.3 10.8 115-399 6.2 5.4 35-135 6.8 7.1
106-259 22.9 26.6 399-563 12.6 11.0 135-227 18.2 19.1
259-388 6.0 7.0 563-851 30.5 26.5 227-403 7.3 7.7
388-529 3.5 4.1 851-992 4.5 3.9 403-973 33.4 35.1
577-791 28.6 33.2
13
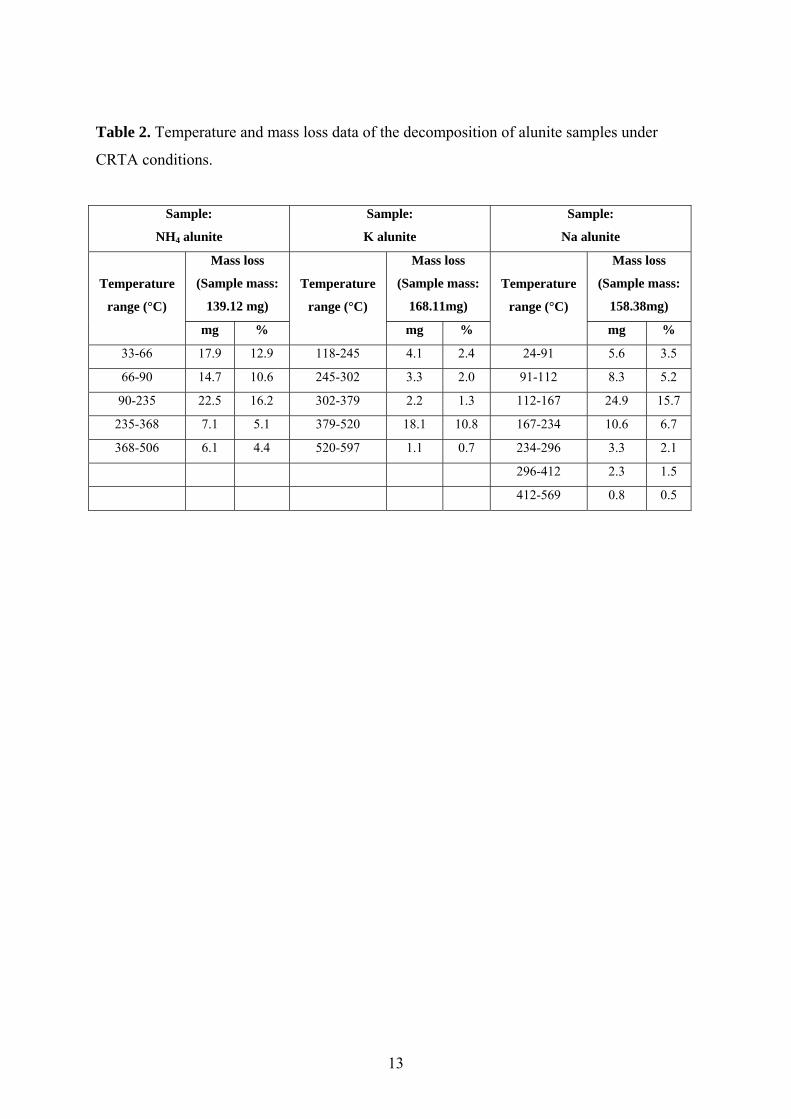
Table 2. Temperature and mass loss data of the decomposition of alunite samples under
CRTA conditions.
Sample:
NH4 alunite
Sample:
K alunite
Sample:
Na alunite
Temperature
range (°C)
Mass loss
(Sample mass:
139.12 mg)
Temperature
range (°C)
Mass loss
(Sample mass:
168.11mg)
Temperature
range (°C)
Mass loss
(Sample mass:
158.38mg)
mg % mg % mg %
33-66 17.9 12.9 118-245 4.1 2.4 24-91 5.6 3.5
66-90 14.7 10.6 245-302 3.3 2.0 91-112 8.3 5.2
90-235 22.5 16.2 302-379 2.2 1.3 112-167 24.9 15.7
235-368 7.1 5.1 379-520 18.1 10.8 167-234 10.6 6.7
368-506 6.1 4.4 520-597 1.1 0.7 234-296 3.3 2.1
296-412 2.3 1.5
412-569 0.8 0.5
14
Figure 1. TG-DTG-DTA curves of potassium alunite under dynamic heating
15
Figure 2. TG-DTG-DTA curves of sodium alunite under dynamic heating
16
Figure 3. TG-DTG-DTA curves of ammonium alunite under dynamic heating
17
Figure 4. Thermogravimetric and mass spectrometric ion intensity curves of ammonium
alunite (m/z 17: NH3+, m/z 18: H2O
+, m/z 32: O2+, m/z 64: SO2
+)
Temperature/°C
m, -
dm/d
t, in
tens
ity/a
rb. u
nits
100 200 300 400 500 600 700 800 900100 200 300 400 500 600 700 800 900
TG
DTG
H2O
NH3
SO2
O2

18
Figure 5. Thermal decomposition pattern of potassium alunite under CRTA conditions
19
Figure 6. Thermal decomposition pattern of sodium alunite under CRTA conditions

20
Figure 7. Thermal decomposition pattern of ammonium alunite under CRTA conditions