r e a d i n g u n i t 1 : m o b i l e p h o n e u s a ge
TRANSCRIPT
Reading Unit 1: Mobile phone usage Read the report below, usage of mobile phones in different parts of the world
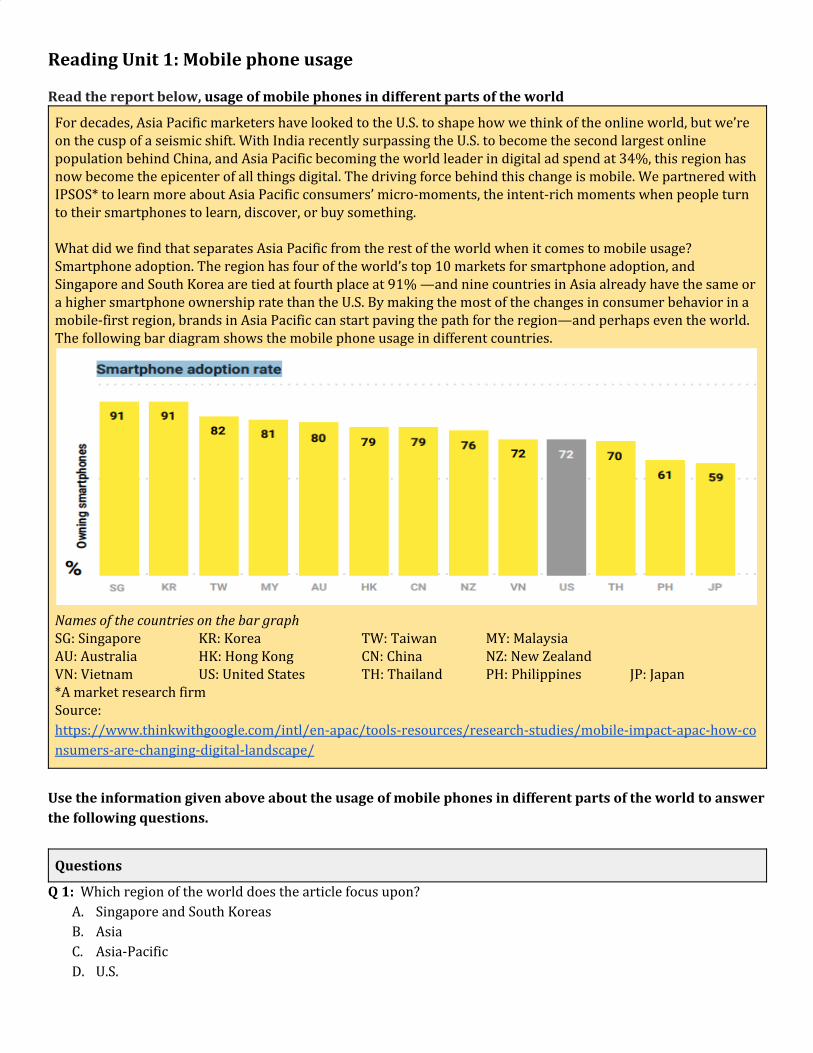
For decades, Asia Pacific marketers have looked to the U.S. to shape how we think of the online world, but we’re on the cusp of a seismic shift. With India recently surpassing the U.S. to become the second largest online population behind China, and Asia Pacific becoming the world leader in digital ad spend at 34%, this region has now become the epicenter of all things digital. The driving force behind this change is mobile. We partnered with IPSOS* to learn more about Asia Pacific consumers’ micro-moments, the intent-rich moments when people turn to their smartphones to learn, discover, or buy something. What did we find that separates Asia Pacific from the rest of the world when it comes to mobile usage? Smartphone adoption. The region has four of the world’s top 10 markets for smartphone adoption, and Singapore and South Korea are tied at fourth place at 91% —and nine countries in Asia already have the same or a higher smartphone ownership rate than the U.S. By making the most of the changes in consumer behavior in a mobile-first region, brands in Asia Pacific can start paving the path for the region—and perhaps even the world. The following bar diagram shows the mobile phone usage in different countries.
Names of the countries on the bar graph SG: Singapore KR: Korea TW: Taiwan MY: Malaysia AU: Australia HK: Hong Kong CN: China NZ: New Zealand VN: Vietnam US: United States TH: Thailand PH: Philippines JP: Japan *A market research firm Source: https://www.thinkwithgoogle.com/intl/en-apac/tools-resources/research-studies/mobile-impact-apac-how-consumers-are-changing-digital-landscape/
Use the information given above about the usage of mobile phones in different parts of the world to answer the following questions.
Questions
Q 1: Which region of the world does the article focus upon? A. Singapore and South Koreas B. Asia C. Asia-Pacific D. U.S.

Q2: Looking at the smartphone adoption rate bar graph, it can be concluded that A. The bar graph shows the smartphone adoption rates in Asian countries only. B. The maximum variation between the smartphone adoption rate is between the two Asian countries. C. Exact figures about the smartphone adoption rate for a particular continent can not be provided. D. The western countries have maximum smartphone adoption rate.
Q3: What is the central idea of the article
A. To research upon the moments when people turn to their smartphones for various practical purposes. B. South Korea and Singapore have emerged as leaders in the usage of smartphones. C. Western world need to pace up the mobile phone usage for digital development. D. Asia-Pacific region has emerged as the central point for digital expansion.
Reading Unit 2: A Survey Report Read the report below, from The Times of India, e-newspaper dated December 01, 2019.
Creating a flutter: 246 bird species at winter count… ...over 100 of them seasonal migrants, quite a few rare. A total of 246 bird species were recorded during the Winter Bird Count 2019 last Sunday, a slight increase from last year’s count of 241. A team of over 100 birders in 15 teams set out across different parts of the territory and the National Capital Region and logged a number of important and rare sightings in the region.
Of the 246 species recorded this year, over 100 were winter migrants. This year’s species sighting tally was less than the 252 recorded in 2017. The birding teams covered areas like the riverine belt of the Yamuna, including
Okhla sanctuary and Wazirabad, wetlands of Gautam Buddh Nagar, including Surajpur and Dhanauri, the wetlands around Gurgaon, among them Sultanpur and Basai, Najafgarh drain up to Dhasna barrage, the Aravali belt towards Mangar Bani and the neighbouring districts of Sonipat and Jhajjar. Kanwar B Singh, coordinator of the count, described the overall diversity recorded as good with some important sightings. Singh said the similar species count of the past few years signified that most wetlands were faring fairly well. “This annual event gives us a good idea of the nature of the regional birdlife, helps collect essential data on bird diversity in the region and boosts support for the environment and nature conservation, while popularising bird-watching as a healthy pastime,” said Singh. The white-crowned penduline-tit - a tiny wintering bird - was spotted by Pradyumna Vidwansa in Chandu village near Gurgaon after a gap of several years. Arvind Yadav, whose team sigqhted a Eurasian skylark at Mandothi in Jhajjar, Haryana, informed that this was a rare sighting in Haryana and NCR. “Both the Eurasian skylark and the white crowned penduline-tit have been recorded for only the third time in this region,” he said. The birders said a few hundred greater flamingo are currently at the Najafgarh jheel. However, this number is fewer than the arrivals in the last few years. Among the rare or uncommon waders reported by birders were the dunlin, jack snipe and Eurasian curlew. The enumerators also revealed the raptor count was higher this year when compared with the recording of the last few years. “Various teams reported resident and wintering raptors, including crested serpent eagle, booted eagle, imperial eagle, steppe eagle, tawny eagle, greater and indian spotted eagles, long-legged and common buzzards, marsh Harrier, Eurasian sparrow hawk, osprey, common kestrel and red-necked laggar and peregrine falcons,” said Singh. “In addition, a black eagle, which is a magnificent forest eagle that is rarely seen around Delhi, was once again reported last Sunday by the team led by Tapas Misra and Tanweer Alam.” The count in the forested areas of the Aravallis including Mangar Bani, returned interesting species like the white-bellied drongo, sirkeer malkoha and cinereous tit. Meanwhile, the birding team noted the presence of Brook’s leaf warbler, Siberian stonechat, common kestrel and Isabelline shrike in NCR’s woodlands and grasslands. Source and weblink: https://timesofindia.indiatimes.com/city/delhi/creating-a-flutter-246-bird-species-at-winter-count-/articleshow/72313654.cms
Use the information given above about birds spotting and counting to answer the following questions.
Questions
Q1: How many species of birds were recorded during the winter bird count in 2018? A. 246 B. 241 C. 412 D. 252
Q2: Which of the following subgroups of birds have been reported in the news article?
A. Waders but not raptors

B. Both waders and raptors C. Neither waders nor raptors D. Raptors but not waders
Q3: Conducting events such as bird counting are crucial as these help in
A. Reporting exclusively on the number of waders in different parts of Delhi and NCR B. Reporting exclusively on the number of raptors in different parts of Delhi and NCR C. Collecting essential data on bird diversity and to conserve nature D. Identifying the place where most number of bird species are spotted
Q4: Read the statements given below
1. Spotted and counted birds at different spots in Delhi-NCR 2. Spotted rare birds in rural areas also 3. Did a phase wise count of the birds over a period of two winter months 4. Also spotted migrant birds 5. Were focusing only on wetlands and riverine belt
Which of the combination of statements hold true for the teams engaged with the winter bird count
A. 2, 4 and 5 B. 1, 2 and 4 C. 1, 4 and 5 D. 1, 2 and 3
Q5: Which of the statements related to the number and variety of species of birds being spotted is true?
A. The number of species being sighted by the birders has increased gradually over the past three years and there have been rare sightings too.
B. The number of species being sighted by the birders has decreased gradually over the past three years and there have not been any rare sightings.
C. The number of species being sighted by the birders has increased gradually over the past three years and there have not been any rare sightings.
D. There hasn’t been any specific trend in terms of number of species being sighted by the birders over the past three years but there have been rare sightings in the latest winter bird count.
Reading Unit 3: Blog Reading
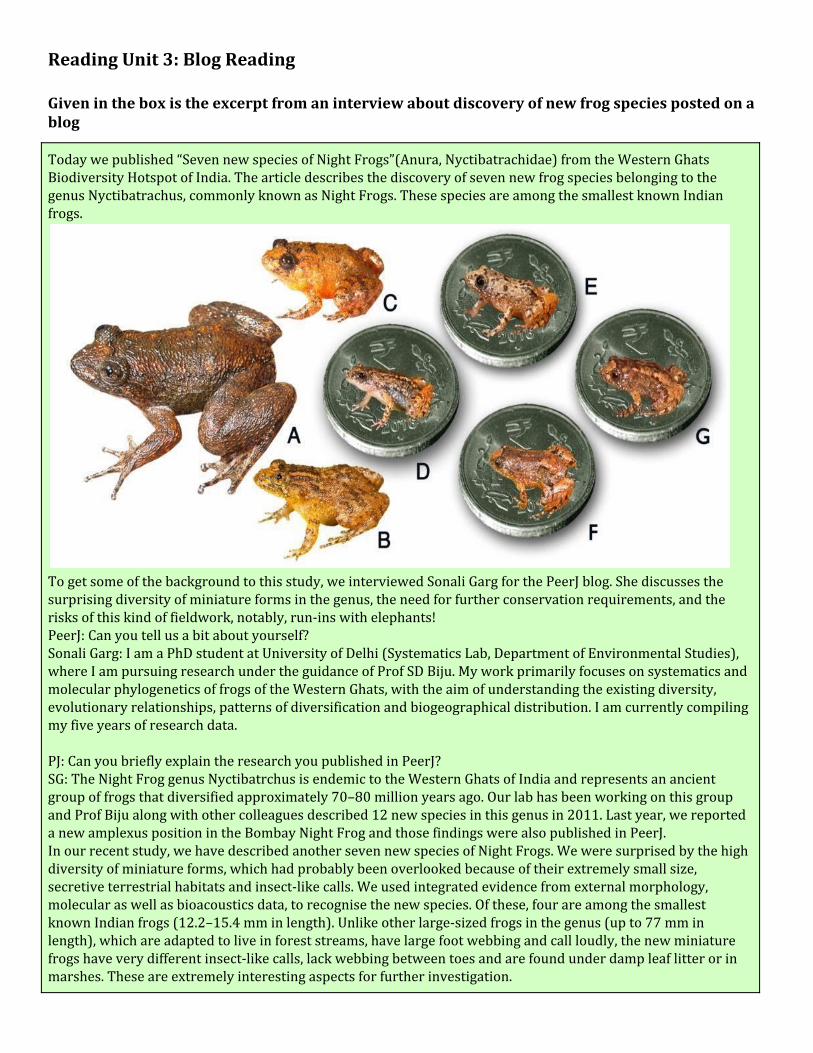
Given in the box is the excerpt from an interview about discovery of new frog species posted on a blog Today we published “Seven new species of Night Frogs”(Anura, Nyctibatrachidae) from the Western Ghats Biodiversity Hotspot of India. The article describes the discovery of seven new frog species belonging to the genus Nyctibatrachus, commonly known as Night Frogs. These species are among the smallest known Indian frogs.
To get some of the background to this study, we interviewed Sonali Garg for the PeerJ blog. She discusses the surprising diversity of miniature forms in the genus, the need for further conservation requirements, and the risks of this kind of fieldwork, notably, run-ins with elephants! PeerJ: Can you tell us a bit about yourself? Sonali Garg: I am a PhD student at University of Delhi (Systematics Lab, Department of Environmental Studies), where I am pursuing research under the guidance of Prof SD Biju. My work primarily focuses on systematics and molecular phylogenetics of frogs of the Western Ghats, with the aim of understanding the existing diversity, evolutionary relationships, patterns of diversification and biogeographical distribution. I am currently compiling my five years of research data. PJ: Can you briefly explain the research you published in PeerJ? SG: The Night Frog genus Nyctibatrchus is endemic to the Western Ghats of India and represents an ancient group of frogs that diversified approximately 70–80 million years ago. Our lab has been working on this group and Prof Biju along with other colleagues described 12 new species in this genus in 2011. Last year, we reported a new amplexus position in the Bombay Night Frog and those findings were also published in PeerJ. In our recent study, we have described another seven new species of Night Frogs. We were surprised by the high diversity of miniature forms, which had probably been overlooked because of their extremely small size, secretive terrestrial habitats and insect-like calls. We used integrated evidence from external morphology, molecular as well as bioacoustics data, to recognise the new species. Of these, four are among the smallest known Indian frogs (12.2–15.4 mm in length). Unlike other large-sized frogs in the genus (up to 77 mm in length), which are adapted to live in forest streams, have large foot webbing and call loudly, the new miniature frogs have very different insect-like calls, lack webbing between toes and are found under damp leaf litter or in marshes. These are extremely interesting aspects for further investigation.
PJ: Do you have any anecdotes about this research? SG: On one occasion, after hours of extensive search we had located a well-exposed calling male of a miniature species. We were so excited to record the call that we ignored two loud sounds of a nearby elephant. Eventually, we almost got chased and had to run for our lives, without the frog or a frog call! On many occasions, I have experienced the scepticism of local people when they would see a young woman venturing into ‘shady places’ such as agricultural fields and urban forest areas along with men at night. Source: https://peerj.com/blog/post/115284878933/seven-new-species-of-night-frogs-author-interview-with-sonali-garg/
Use the information given above about the research on frogs to answer the following questions.
Questions
Q1: Which of the following statements is true about the research being described in the blog entry A. A new genus of frogs is being discovered B. New species in an already existing genus of frogs have been discovered. C. One new genus and one corresponding species of frogs have been discovered. D. A night frog genus is being discovered.
Q2: What is the size range of the frogs numbered as D, E, F and G in the picture.
A. 70- 77 mm B. 12- 15.4 mm C. 12.2- 15.4 mm D. Not mentioned in the blog entry
Q3: What could be the identifying factors that might have helped the researchers for the discovery of the stated frogs
A. Webbing between feet, loud calls, Easy to spot B. Webbing between feet, small size, insect like calls C. No webbing between feet, medium size, insect like calls D. No webbing between feet, small size, insect like calls and secretive terrestrial habitats
Q4: How many species of miniature frogs have been discovered since 2011 by the Systematics lab with which the researcher was affiliated.
A. Seven B. Twelve C. Nineteen D. Fifteen

Reading Unit 4: Training on Sustainable Rural Sanitation The following announcement notice of a specific course has been sourced from the Centre for Science and Environment website.
India has declared itself open defecation free (ODF). The infamous distinction of having the world’s largest number of people going out to defecate is a history. But would that signal the end of our quest for sanitation story? Most certainly not. The country is beginning to wake up to fresh challenge: how would it dispose of the massive amounts of solid and liquid waste generated from the millions of new toilets we have built? How do we prevent all this waste to seep back into our groundwater or our lakes and rivers and turn into an unmanageable health hazard? What are the safe, adaptable and sustainable technologies for managing toilet waste and for reusing faecal sludge? We bring you a training programme designed to understand the problem and explore solutions. It will be conducted at our state-of-the-art residential training facility in Nimli, Rajasthan, by acknowledged experts from the field. THE KEY TAKEAWAYS:
1. Information on safe toilet technologies practised in different ecological regions of India
2. Understanding of decentralised technologies used for management of grey and black water
3. How to design decentralised wastewater treatment systems and monitor their efficiency
4. How to treat and reuse faecal sludge
5. How to use Information, Education and Communication (IEC) materials effectively for making an ODF state sustainable
6. How to develop guidelines for making DPRs for solid-liquid resource management
7. Site visits and real-time problem analyses COURSE FEES Rs 23,000 per person for double occupancy. Rs 30,000 per person for single occupancy. The fees covers pick-up and drop from Delhi, boarding and lodging at Nimli and field trip costs. COURSE DURATION: February 3-6, 2020 COURSE VENUE AAETI Campus, Nimli, Alwar, Rajasthan LAST DATE FOR APPLYING: January 20, 2020 OPEN FOR National, state and district-level officials, elected representatives, CSR agencies, students, academicians, researchers, consultants, practitioners and non-profits • 10% early bird discount till January 1, 2020 • 20% discount for group participation (four and above) Source : https://www.cseindia.org/training-on-sustainable-rural-sanitation-9662
Use the information given in this announcement notice to answer the following questions.
Questions
Q1: Which of the following best defines the need of a course on sustainable rural sanitation A. To introduce the campaign to make India ‘Open defecation free’ country B. To apply technologies of urban waste management to rural areas C. To certify persons as authorised rural sanitation managers D. Proper disposal of huge amount of liquid and solid waste generated as a result of newly built toilets.
Q2: Read the statements given below
1. The course provides opportunities for real time problem analysis and solution related to rural sanitation 2. The course encourages passing of mandates related to the campaign on ‘Open defecation free’ state 3. The course helps in acquiring specialisation in the rural sanitation techniques in the state of Rajasthan
exclusively 4. The course enables designing of decentralised wastewater treatment system
Which of the combination of statements hold true for the person who has undergone the specified course on sustainable rural sanitation
A. 1,2 and B. Both 1 and 4 A. All four B. 1,3, and 4
Q3: Why do you think the course has been kept open for a wide range of personnel?
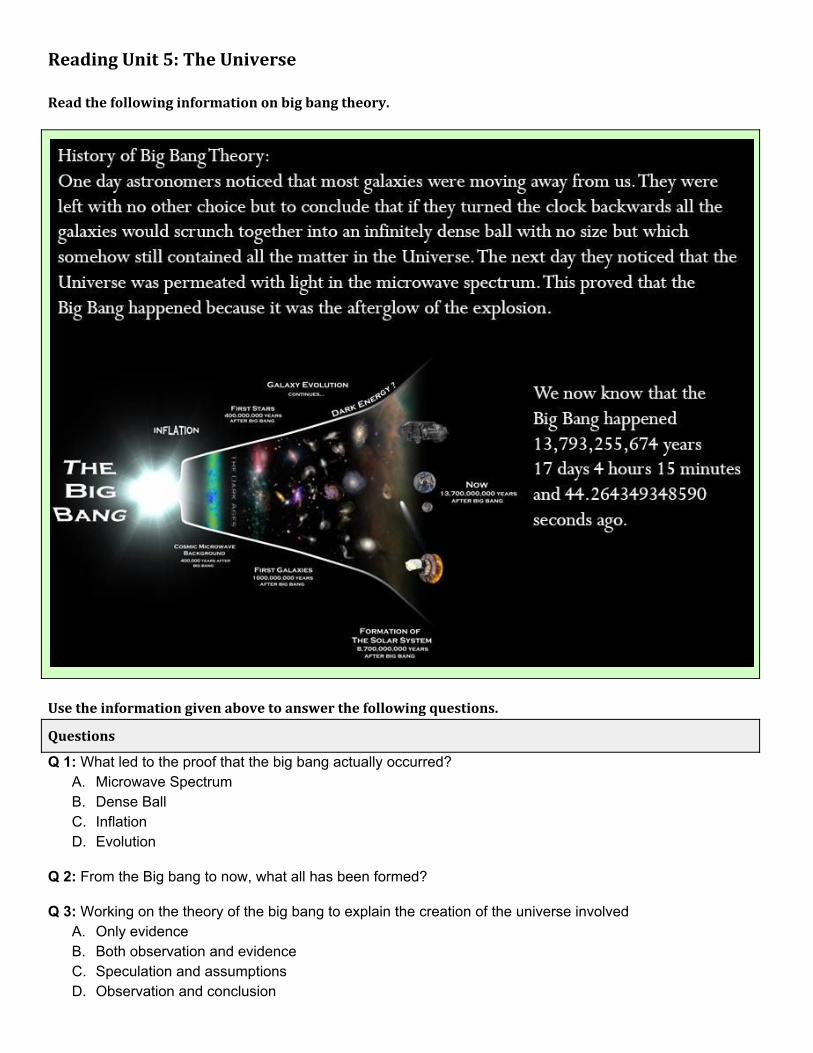
Reading Unit 5: The Universe Read the following information on big bang theory.
Use the information given above to answer the following questions.
Questions
Q 1: What led to the proof that the big bang actually occurred? A. Microwave Spectrum B. Dense Ball C. Inflation D. Evolution
Q 2: From the Big bang to now, what all has been formed?
Q 3: Working on the theory of the big bang to explain the creation of the universe involved A. Only evidence B. Both observation and evidence C. Speculation and assumptions D. Observation and conclusion

Answers - Q1
Question 1 Processes: Level 1(b) Proficiency : Access & Retrieve Coding and scoring:
● Full Credit: C ● Partial Credit: N.A ● No Credit: Any option except C
Question 2 Processes: Level 5 Proficiency : Reflect and Evaluate Coding and scoring:
● Full Credit: B ● Partial Credit: N.A ● No Credit: Any option except B
Question 3 Processes: Level 3 Proficiency : Integrate and interpret Access & Retrieve Coding and scoring:
● Full Credit: D ● Partial Credit: N.A ● No Credit: Any option except D
Answers - Q2
Question 1 Processes: Level 1(b) Proficiency : Access & Retrieve Coding and scoring:
● Full Credit: B ● Partial Credit: N.A ● No Credit: Any option except B
Question 2 Processes: Level 1 (a) Proficiency : Access & Retrieve Coding and scoring:
● Full Credit: B ● Partial Credit: N.A ● No Credit: Any option except B
Question 3
Processes: Level 2 Proficiency : Access & Retrieve Coding and scoring:
● Full Credit: C ● Partial Credit: N.A ● No Credit: Any option except C
Question 4 Processes: Level 3 Proficiency : Integrate and interpret Coding and scoring:
● Full Credit: B ● Partial Credit: N.A ● No Credit: Any option except B
Question 5 Processes: Level 5 Proficiency : Reflect and Evaluate Coding and scoring:
● Full Credit: D ● Partial Credit: N.A ● No Credit: Any option except D
Answers
Question 1 Processes: Level 1(b) Proficiency : Access & Retrieve Coding and scoring:
● Full Credit: B ● Partial Credit: N.A ● No Credit: Any option except B
Question 2 Processes: Level 1 (a) Proficiency : Access & Retrieve Coding and scoring:
● Full Credit: C ● Partial Credit: N.A ● No Credit: Any option except C
Question 3 Processes: Level 3 Proficiency : Integrate and interpret Coding and scoring:
● Full Credit: D ● Partial Credit: N.A ● No Credit: Any option except D
Question 4 Processes: Level 2 Proficiency : Access and retrieve Coding and scoring:
● Full Credit: C ● Partial Credit: N.A ● No Credit: Any option except C
Answers - Q4
Question 1 Processes: Level 1(b) Proficiency : Access & Retrieve Coding and scoring:
● Full Credit: D ● Partial Credit: N.A ● No Credit: Any option except D
Question 2 Processes: Level 2 Proficiency : Access & Retrieve Coding and scoring:
● Full Credit: B ● Partial Credit: N.A ● No Credit: Any option except B
Question 3 Processes: Level 3 Proficiency : Integrate and interpret Coding and scoring:
● Full Credit: 1. To spread awareness among all the stakeholders of the society about the importance of sustainable rural sanitation 2. To encourage both ground level work and academic research on the matter 3. To enable a wider network to participate in the practice of sustainable rural sanitation 4. To make it a joint responsibility of government and non government organisation
● Partial Credit: Any of the above one/two or three points ● No Credit: Any other point irrelevant to the context or apart from the above four points
Answers - Q5
Question 1 Processes: Level 1 (b) Proficiency: Access & Retrieve Coding and scoring:
● Full Credit: A ● Partial Credit: N.A ● No Credit: any option except A
Question 2 Processes: Level 2 Proficiency : Access and Retrieve Coding and scoring: Full Credit:
● First stars ● First galaxy- Galaxy Revolution ● Formation of the Solar System
Partial Credit: ● Stars ● Galaxy
No Credit: ● All options other than above
Question 3 Processes: Level 3 Proficiency: Integrate and Interpret Coding and scoring:
● Full Credit: B ● Partial Credit: N.A ● No Credit: any option except B