r e p o r t - national partnership for women & families · * iwpr/gwu research fellow misha...
TRANSCRIPT

* IWPR/GWU Research Fellow Misha Werschkul and IWPR Research Intern Kris Cronin provided invaluable research support for this work. IWPR President Heidi Hartmann and IWPR Director of Research Barbara Gault offered helpful input throughout the project.
R E P O R T
IWPR Pre-Publication #B248 April 2005
Valuing Good Health: An Estimate of Costs and Savings for the Healthy Families Act
Vicky Lovell, Ph.D. *
The Healthy Families Act (HFA) would ensure that all eligible workers have a minimum of seven days of paid time off annually to take care of their own health needs and those of members of their families. This report presents an estimate of the cost of that Act and of certain cost savings it would provide to employers, to workers and their families, and to the broader community (Table 1). Several other likely benefits for which we currently lack estimation data are also discussed. Of course, the overall purpose of the Act is to reduce economic hardship of workers when they, or their family members, have medical care needs, and we are unable to calculate the value of that benefit.
Table 1. Summary of HFA costs and savings
Total ($ millions)
Per worker per week (over all
wage and salary
employees)
Per worker per
week (over workers covered
by HFA) Costs Wages and payroll taxes for: Newly covered workers $ 17,549.9 Workers with new leave uses 2,293.6 Workers with additional leave days 35.6 Administrative expenses $356.7 Total costs
$ 20,235.9
$3.04
$5.98
Savings Wages currently paid to unhealthy workers with
low productivity (includes payroll taxes) $ 1,571.5
Reduced turnover 25,840.0 Reduced spread of the flu at work 738.5 Reduced short-term nursing home stays 225.0
Total savings $ 28,375.0 $4.26 $8.38 Notes: Columns may not sum to totals due to rounding. In 2003 dollars, using data from the 2004 Current Population Survey.

- 2 -
These estimates assume full utilization of the HFA by all eligible workers. Particularly during the early years of the program, it is likely that some workers will be unaware of their new leave benefits and thus not use any HFA leave. In particular, workers may not know the multiple uses the law allows (see text box). Key provisions of the Healthy Families Act • Guarantees a minimum of 7 days of paid sick leave annually (prorated for those working less
than 30 hours a week, or 1,500 hours during the year to which the HFA applies). • Workers regularly working at least 20 hours a week, or at least 1,000 hours a year, are
eligible. • Employers with 15 or more employees are covered. • Leave must accrue at least quarterly. • Leave may be used for “an absence resulting from a physical or mental illness, injury, or
medical condition” or “from obtaining professional medical diagnosis or care, or preventive medical care.”
• Absence may be for employee’s health or that of “a child, a parent, a spouse, or any other individual related by blood or affinity whose close association with the employee is the equivalent of a family relationship.”
• Private-sector, local and state government, military, and agricultural workers are covered. (Federal government workers already have a similar benefit.1)
Three groups of workers will enjoy new leave benefits under the HFA: those who currently have no paid sick leave; those with paid sick leave who would be able to use their leave for additional purposes; and those who currently have only one or two days of leave. Analyzing current data on the wage and salary workforce and recent data on paid sick leave programs from Lovell (2004), we estimate that 65.8 million workers will have new or expanded paid sick leave coverage under the HFA (Table 2). Table 2. Number of workers affected by the HFA Workers who currently have no paid sick leave 46.3 million Workers who would be able to use their existing sick leave for expanded
leave purposes (sick children and doctor visits) 18.8 million
Workers who currently have 1 or 2 days of sick leave who would be able to take additional time off
0.7 million
Total 65.8 million Estimating the cost of the Healthy Families Act We use the following methodology to estimate the cost of leave-taking under the HFA (Table 3):

- 3 -
1. How many workers will be affected?
a. There are 94.2 million workers who meet the HFA eligibility criteria of working 20 or more hours a week, in firms with 15 or more employees (IWPR analysis of the March 2004 Annual Social and Economic Supplement to the Current Population Survey (CPS)).
b. Of those eligible workers, 46.3 million have no paid sick leave (IWPR analysis using the CPS analysis in 1(a) above and paid sick leave participation data by wage quartile from the IWPR analysis reported in No Time to be Sick (Lovell 2004)).2
c. In addition, 18.8 million workers who currently have paid sick leave but are not allowed to use their leave to care for sick children or for doctor visits will have their sick leave uses expanded under the HFA.
d. Finally, 742,000 workers have fewer than three days of paid sick leave and would see their paid time off increased under the HFA (unpublished IWPR analysis for the report No Time to be Sick; Lovell 2004).3
2. How many days of paid sick leave will workers take? a. For own medical needs: When constrained to a maximum of seven days of work loss,
workers with paid sick leave miss an average of 1.8 days annually for illness and injury, excluding maternity leave (IWPR analysis of the 2003 National Health Interview Survey (NHIS)4; see text box). (Those without paid sick leave miss an average of 1.3 days annually; for all workers, the average is 1.6 days.)5
53.7 percent of workers do not take any days off for illness or injury in a given year, and an additional 37.7 percent miss seven or fewer days. Without capping days off at seven, average work-loss for those with and without paid sick leave are 3.95 and 3.35 days, respectively.
b. For family care: According to the U.S. Department of Labor’s 2000 Family and Medical Leave Act Survey of Employees, workers take 0.33 days of FMLA-type leave to care for ill children, spouses, and parents for every 1.0 days of own-health leave (Rutgers University Center for Women and Work 2005). 1.8 * 0.33 = 0.6 days (4.8 hours).
c. For doctor visits: Workers with paid sick leave visit the doctor an average of 3.7 times per year (IWPR analysis of the 2003 NHIS). (Without paid sick leave, doctor visits average 3.1 annually.) These visits may be during or outside of work hours or may already be included in time off due to illness or injury in 2(a) above. We assume 3.7 hours of leave in additional doctor visits during work hours (0.4625 days).

- 4 -
Estimates of health-related work absence from the National Health Interview Survey We assume that the average work-loss of 1.8 days calculated from the National Health Interview Survey includes own medical needs only, excluding doctor visits. However, due to respondent discretion in interpreting the survey’s questions, reported work-loss “because of illness or injury” may include time off work to care for others and for doctor visits, in addition to time for workers’ recuperation. To the extent that this occurs, our estimates of days taken under the HFA may overestimate actual leave-taking. d. For maternity leave and corresponding time for new mothers’ partners:
i. There are 2.40 million births to employed women each year (IWPR analysis of the 2004 CPS).
ii. We allow for a partner to take leave for the 77.01 percent of these new mothers who are married and have an employed husband (IWPR analysis of the 2004 CPS, U.S. BLS 2004a) and for half of the unmarried new mothers.
iii. We assume that each of these workers will take the maximum number of paid sick days, with the additional days (beyond those allocated in paragraphs 2(a) – 2(c), above) used for prenatal care, maternity recovery, or care of the new mother.6 (Men who take paternity leave average 7.2 days of leave (Rutgers University Center for Women and Work (2005).) We already assume in 2(a) – 2(c) that workers take 2.8625 days, so we add 4.1375 days for this set of workers.
3. How much do workers earn?
We calculate mean wages by wage quartile for non-maternity-related HFA use and use mean wages (by wage quartile) for new mothers for maternity-related HFA leave. Earnings are adjusted for work hours using the median work hours for full-time and part-time workers for these two groups of workers.
4. Legally mandated payroll taxes (the employer’s share of Social Security and Medicare taxes, plus federal and state unemployment insurance taxes and workers’ compensation) amounting to 11.46 percent of wages (U.S. Bureau of Labor Statistics 2005) are added to wage costs.
5. Administrative expenses are estimated at 2.0 percent of wages. This is roughly one-third the average ratio of administrative costs to benefit payments for state Temporary Disability Insurance programs (TDI) in California, New Jersey, and Rhode Island (U.S. Social Security Administration 2005). TDI is somewhat similar to HFA leave in that both relate to workers’ illness-related work absence, but TDI is more complex, involving collection of payroll taxes, evaluation of medical disability, tracking of health status, and long-term benefit periods.

- 5 -
Table 3. Estimated cost of HFA leaves (2003 dollars) Cost factor Value Notes / Source
Number of HFA-eligible workers who currently lack paid sick leave
46.3 million IWPR analysis of the 2004 CPS, using paid sick leave incidence rates from Lovell (2004)
Average number of days of HFA leave workers will take
2.8625 days Analysis of the NHIS and the 2000 FMLA survey presented in paragraphs 2(a) – 2(c), above
Number of workers with 1 or 2 days of sick leave who will receive additional time off under the HFA
0.7 million IWPR analysis of the 2004 CPS, using paid sick leave incidence rates from Lovell (2004)
Number of workers with paid sick leave who currently cannot use their leave for sick children or doctor visits
18.8 million IWPR analysis of the 2004 CPS, using paid sick leave incidence rates from Lovell (2004)
Additional days taken by pregnant employed women and their partners
4.1375 Maximum of 7 days of HFA leave, less 2.8625 days accounted for above
Hourly wage Varies by wage quartile ($6.70 - $32.60); accounting for work hours
IWPR analysis of the 2004 CPS
Payroll taxes 11.46 percent of wages
U.S. Bureau of Labor Statistics (2005)
Administrative expenses 2.0 percent of wages
U.S. Social Security Administration (2005)
Total $ 20,235.9 million
Paid Time-Off Programs (PTOs) and Paid Sick Leave Some employers are transforming their single-use paid leave programs, such as vacation and sick leave, into a combined paid time-off program. (Workers are typically allowed somewhat more discretion in their use of PTOs than in traditional sick leave programs, where employers might expect documentation of the legitimacy of the time-off claim, but often the total number of days is more limited.) Our estimates of the percent of workers with paid sick are derived from the U.S. Department of Labor’s Employee Benefits Surveys (the precursor of the current National Compensation Survey) fielded in 1996 to 1998. That survey collected information about single-use programs but also allowed employers to report leave offered through PTOs. Based on interview protocols, it is likely that a substantial portion of paid sick leave offered through PTO programs is included in the Department of Labor surveys of employee benefits. Research on trends in paid leave programs of all kinds documents a secular decline in the share of workers with any paid time off (Wiatrowski 2004), confirming that coverage by paid sick leave (including that available through PTOs) is unlikely to be greater now than was represented in our analysis.

- 6 -
6. The cost of replacing workers on HFA leave By definition, employers pay wages that are equal to each worker’s productivity, or the value they produce for the employer. If an employer elects to hire a temporary worker to fill in for one on HFA leave, there is no additional net employer expense; replacement workers are paid their marginal product, and the employer reaps the same amount of value in the replacement worker’s work product. Thus, while employers hiring replacements will pay wages to two workers, the net impact will be the same as if no replacement were hired. As an illustration, assume a worker and her replacement (if any) are paid $100 (Table 4): Table 4. Analysis of cost of replacing workers on HFA leave
Absence / replacement situation
A Wage cost
B
Productivity
C
Employer’s net cost of
absence (= A – B)
Current situation: no paid leave Absent worker not paid, not replaced $ 0 0 $ 0 Absent worker not paid, replaced $100 100% (= $100) $ 0 Under HFA: paid leave Absent worker paid, not replaced $100 0 $100 Absent worker paid, replaced $200 100% (= $100) $100
Net employer costs of $100 under the HFA, either with or without a replacement worker, are accounted for in the estimate of wages and payroll taxes for workers on HFA leave (Table 3). Hiring of temporary workers is likely to be relatively uncommon for the short leaves possible under the HFA. For longer absences under the federal Family and Medical Leave Act, where leaves may total 12 weeks in a year, 12.7 percent of leave-takers reported that a replacement worker was hired to fill in for them during their leave (Cantor et al. 2001, Table A2-6.7). It is much more common for work to be covered by other employees or held for the absent worker to address when back on the job. We estimate that the HFA will cost $20,235.9 million annually for wages paid to workers on HFA leave and associated payroll taxes and administrative expenses -- $5.98 per HFA-covered worker per week. Benefits of the HFA Ensuring that workers have paid time off work when needed to take care of their own health needs or those of members of their families is likely to lead to improved health outcomes for workers and their families (Lovell 2004). Better health outcomes will reduce health-care expenditures and increase quality of life. While there is solid theoretical work suggesting the nature of these benefits, in some cases we lack empirical data that would allow us to put a value on them. In this report, we estimate some

- 7 -
health-related benefits of the HFA and discuss other likely benefits. Future research may provide measures of these benefits that can be added to those analyzed here. Workers with inadequate paid time off work spend more time on the job at lowered productivity. These workers are currently paid their full wages for this reduced work effort. Taking an additional half day off work under the HFA will save employers the wages they would otherwise pay without any work of value being performed. In addition, workers with paid sick leave have lower voluntary turnover than workers without this leave (Cooper and Monheit 1993), so expanding access to paid sick leave will reduce employers’ costs related to turnover. Involuntary turnover for workers who are fired for taking unauthorized leave will also decrease under the HFA, saving employers additional expenditures for replacement costs. Productivity losses related to presenteeism—ill employees going to work—will fall, as workers stay home when they are contagious and avoid passing the flu and other diseases to others. Finally, we anticipate that increasing the flexibility available to caregivers to respond to their families’ chronic and acute medical needs will reduce nursing home stays. This will save private and public dollars while improving health outcomes for medically frail adults. Cost savings #1: Wages currently paid to workers with low productivity Employers pay substantial wages to employees who are unproductive because of health issues. Goetzel et al. (2004) estimate the average total annual productivity loss, per employee, for the top 10 most costly health conditions at between $1,566.63, using average productivity loss estimates, and $217.07, using low productivity loss estimates (in 2001 dollars; from Table 4A). Empirical studies document that workers with influenza have worse performance on a variety of tasks than healthy workers. A study that used random assignment of experimentally induced colds and influenza found that “minor illnesses . . . have significant effects on performance efficiency” during both incubation and symptomatic periods (Smith 1989, 68). A follow-up study discovered that performance impairment continues even after clinical symptoms no longer appear (Smith 1990). We estimate the costs currently paid by employers to HFA-eligible workers who, without paid sick leave, are on the job but less productive than usual (Table 5). Analysis of the National Health Interview Survey finds that workers without paid sick leave miss an average of 0.5 fewer days due to illness and injury than workers with paid sick leave. Other research suggests that productivity during this extra time at work is 50 percent of normal (Nichol 2001).

- 8 -
Table 5. Cost savings from not paying ill workers for unproductive time on the job
Cost factor Value Notes / Source Number of HFA-eligible workers who currently lack paid sick leave
46.3 million IWPR analysis of the 2004 CPS, using paid sick leave incidence rates from Lovell (2004)
Lost productivity currently paid 0.5 days at 50 percent effectiveness
IWPR analysis of the NHIS (the difference in work-loss days for illness and injury for workers with and without paid sick leave); Nichol (2001)
Hourly wage Varies by wage quartile ($6.70 - $32.60); accounting for work hours
IWPR analysis of the 2004 CPS
Payroll taxes 11.46 percent of wages U.S. Bureau of Labor Statistics (2005)
Total $1,571.5 million We estimate that the HFA will save $1,571.5 million annually for wages that would otherwise be paid to workers with lowered work productivity due to illness. Cost savings #2: Reduced turnover Research establishes that having paid sick leave reduces voluntary job mobility by 5.58 percentage points for married men, 3.61 pp for married women, 5.75 pp for single women, and 6.43 pp for single men (Cooper and Monheit 1993), as workers choose to retain a valued employment benefit by staying in their current job.7
With paid sick leave expanded under the HFA, some of this effect on voluntary turnover may be reduced, as more workers considering a job change will have paid sick leave both at their current job and at their potential new job. Workers in firms with fewer than 15 employees will not be covered by the HFA, however, so important differences in paid leave quality among jobs will remain. Participating in paid sick leave under the HFA through a current job may also increase worker loyalty to the current employer, in response to having a more adequate leave benefit (which may be perceived as an employer initiative, rather than a public policy). In addition, having paid sick leave affects involuntary turnover, with decreased job terminations related to unauthorized work absences for ill workers and for workers caring for sick family members (Heymann 2000, Earle and Heymann 2002). Seven percent of women’s job separations are responses to health issues, and another 15 percent concern other family or personal reasons (Emsellem, Allen, and Shaw 1999). We lack data for accurately estimating the savings related to lowered involuntary turnover from the HFA. We believe it is reasonable to expect that any overestimation in savings from voluntary turnover in our analysis will be countered by savings in employer expenses from reduced involuntary turnover. Turnover entails a variety of costs for employers, of which actual outlays to recruit a new worker are only a small portion. Low productivity of new hires, drains on the productivity of the new worker’s colleagues and supervisors, human resources processing time for exit and entry, training, and lost productivity during vacancies are also real costs to employers (Phillips 1990).

- 9 -
A newly hired low-paid retail worker may lose sales—and customers—during the period the employee is learning about the employer’s products, and may mistakenly undercharge for products (Johnson and Tratensek 2001). Careful analyses of the range of impacts associated with turnover provide guidance on the true costs to employers. Phillips (1990) reports that replacing a mid-level manager costs 1.5 times the worker’s annual salary. An estimate by Johnson and Tratensek (2001) pegs turnover of retail workers earning $7 an hour at $6,241, or 43 percent of their annual pay. A widely cited rubric for figuring turnover costs places them at 25 percent of total compensation (Employment Policy Foundation 2002). We use the latter figure to estimate employers’ savings under the HFA from reduced turnover (Table 6). Table 6. Cost savings from reduced turnover
Cost factor Value Notes / Source Number of HFA-eligible workers who currently lack paid sick leave
46.3 million IWPR analysis of the 2004 CPS, using paid sick leave incidence rates from Lovell (2004)
Percentage point reduction in voluntary turnover when paid sick leave is provided
Varies by worker demographics (3.61 - 6.43)
Cooper and Monheit (1993)
Cost of turnover 25 percent of total compensation
Employment Policy Foundation (2002)
Hourly wages Varies by wage quartile ($6.70 - $32.60); accounting for work hours
IWPR analysis of the 2004 CPS
Wages as percent of total compensation
70.7 percent U.S. Bureau of Labor Statistics 2004b, Table 1
Total $25,840.0 million We estimate that savings under the HFA related to reduced turnover will total $25,840.0 million annually. Cost savings #3: Reduced spread of the flu within workplaces; reduced overall absence and lowered productivity Employers are increasingly aware of the cost of the spread of disease within workplaces that occurs when sick employees go to work, a practice known as presenteeism. Two of every five employers identifies presenteeism as a problem for their organization (CCH Incorporated 2004a). As Dr. Richard Chaifetz notes, presenteeism can lead to “the spread of illness for an even greater reduction in productivity” than would be caused by an individual worker’s absence (ComPsych 2004). Firms with low employee morale are more likely to experience presenteeism than those with better morale (CCH Incorporated 2004b).
Empirical research has documented the widely suspected link between presenteeism and contagion within workplaces. Li et al. (1996) find lower rates of respiratory and gastrointestinal infection among nursing home residents when nurses have paid sick leave, demonstrating that
- 10 -
the spread of disease is diminished (at least in workplaces involving intimate physical contact) when ill workers can stay home. Potter et al. (1997) report reduced disease and mortality among patients in long-term care hospitals when health-care workers are vaccinated against influenza.
Because influenza (the flu) is highly contagious and accounts for 10 to 12 percent of all illness-related employment absences—about the same portion as musculoskeletal disorders (Keech, Scott, and Ryan 1998)—the impact of the Healthy Families Act leave on transmission of the flu virus is likely to be the largest consequence of increased paid leave on the spread of disease in the workplace. Longini, Koopman, Haber, and Cotsonis (1988) estimate the probability of an individual contracting influenza from community contacts at 16.4 percent and from an infected household member at 26.0 percent. Islam, O’Shaughnessy, and Smith (1996) calculate the probability of an individual catching an infection from community contacts during a flu epidemic at 0.168;8 intra-household disease transmission probabilities per cohabitant are a bit higher (mean of 0.177). These transmission rates suggest that a sick worker who is in the workplace while contagious is likely to infect 1.8 of every 10 co-workers.
By a low estimate, 5 percent of healthy working adults will get the flu in a given flu season (Nichol 2001). Studies find that workers with the flu miss one to five days of work (Nichol 2001). Half of employees out sick with the flu are attended by a caregiver, with an average work-loss of 0.4 days per caregiver (Keech, Scott, and Ryan 1998).
Workers with the flu also incur costs for doctor visits (45 percent seek medical care; Nichol 2001), hospitalizations (four hospitalizations per 10,000 flu cases; Nichol 2001), and purchase of prescription and non-prescription medications and other treatments (Kavet 1977). In addition, the flu kills one in every 100,000 infected individuals (Nichol 2001).
These factors are combined with workforce data to estimate savings under the HFA from reduced spread of the flu in workplaces (Table 7). We lack data to estimate savings from other contagious diseases (see text box).
The Cost of Other Contagious Diseases
The flu is the only contagious disease for which we were able to locate accurate data on transmission rates, work absence, and treatment costs. A comprehensive accounting for the spread of all relatively common contagious diseases—including, e.g., colds, mononucleosis, strep, and pink-eye—would certainly be much higher.

- 11 -
Table 7. Cost savings from reduced spread of the flu within workplaces Cost factor Rate Source
Employers’ wage costs Number of HFA-eligible workers without paid sick leave
46.3 million IWPR analysis of the 2004 CPS, using paid sick leave incidence rates from Lovell (2004)
Influenza illness rate 5 percent Nichol (2001), Table 6
Contagion rate (i.e., each co-worker’s chance of contracting the flu)
18 percent Islam, O’Shaughnessy, and Smith (1996)
Assumed number of close daily work contacts
5 co-workers
Number of missed workdays per infected co-worker
2 Nichol (2001)
Number of missed workdays for employed caregivers of ill workers
50 percent of flu-stricken workers receive care; average of 0.4 lost workdays per caregiver
Keech, Scott, and Ryan (1998)
Lost productivity for infected co-workers on return to work
0.5 days at 50 percent productivity
Nichol (2001)
Median hourly wage, all workers $14.65 IWPR analysis of the 2004 CPS
Average work hours per day 7.65 IWPR analysis of the 2004 CPS
Payroll taxes 11.46 percent of wages U.S. Bureau of Labor Statistics (2005)
Subtotal $636.1 million
Workers’ medical costs Doctor visits for infected co-workers 45 percent of ill workers, at
average cost of $60 Nichol (2001), BlueCross BlueShield of Texas n.d.
Prescription drugs 42 per 100 ill workers, at average cost of $53
Kavet (1977), Kaiser Family Foundation webtool (2005)
Subtotal $102.4 million
Total $738.5 million
We estimate that savings due to reduced spread of the flu in workplaces will total $738.5 million annually.

- 12 -
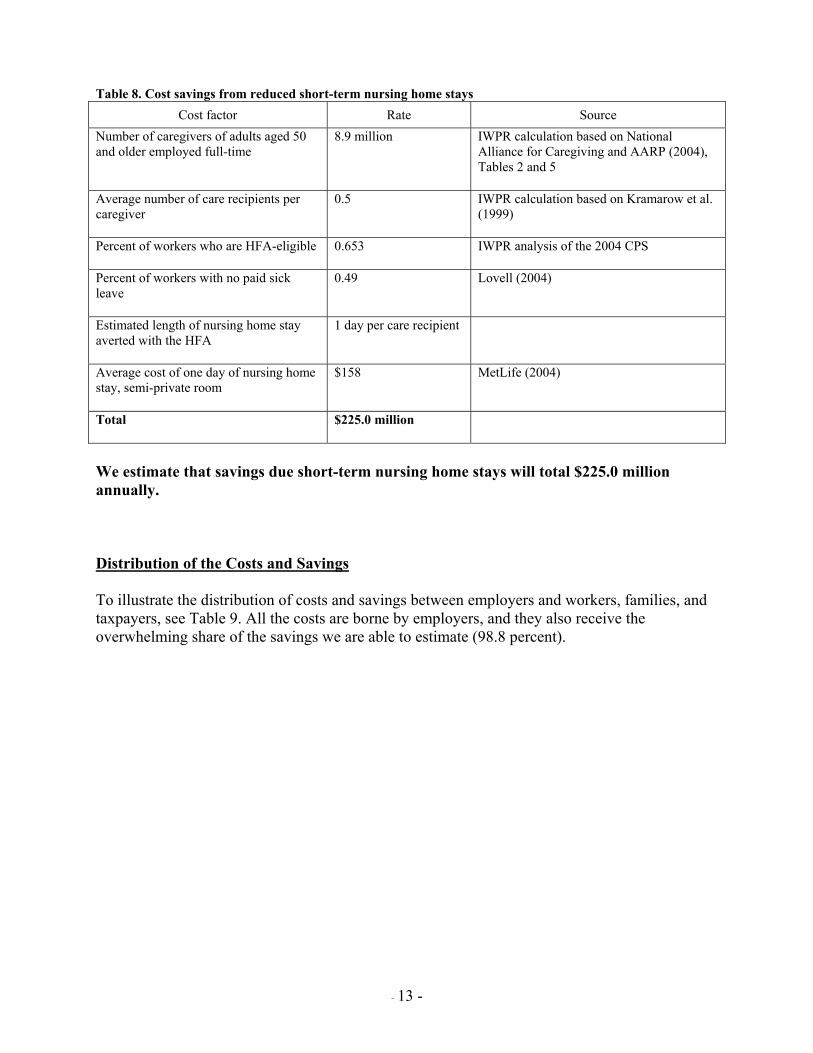
Cost savings #4: Reduced expenditures for short-term nursing home stays Workers with the flexibility to provide informal care for elderly, disabled, and medically fragile relatives may be able to reduce expenditures for health care, including paid care at home or in nursing homes that might otherwise be financed by Medicaid or Medicare. Certainly, individuals consider the level of informal care available to them in decisions about purchasing formal care. When adult children increase their hours of informal care for their single parents, the likelihood of purchasing home health care and nursing home services decreases, and lengths of stays in nursing homes and hospitals are reduced (Van Houtven and Norton 2004). (Because informal care may increase elders’ ability to navigate the health care system, informal care increases hospital stays, outpatient surgery, and physician visits.) A 10 percent increase in the number of hours of informal care provided to individuals aged 70 and older reduces the probability of entering a nursing home by 0.77 percentage points, from 8.6 to 7.83 (Van Houtven and Norton 2004). Elderly patients discharged from acute care wards return home at higher rates if they have children, rather than moving to a lower-level care facility of the hospital (McClaran, Berglas, and Franco 1996). Unmarried and childless individuals are more likely to enter nursing homes than others (Freedman 1993), as they less often have an informal caregiver to help them return home. With nearly 9 million full-time workers providing care to adults aged 50 and older (IWPR calculation from National Alliance for Caregiving and AARP 2004), nearly 1.5 million nursing facility patients at any one time (AHCA n.d.), or roughly 2.7 nursing home admissions per year (IWPR calculation from Mehdizadeh and Applebaum 2003, Table 1)—78 percent paid for by Medicare or Medicaid (AHCA n.d.)—and average annual per-patient costs of $58,000 (MetLife 2004), savings to families and taxpayers from reduced nursing home utilization could be substantial. An even larger number of elderly individuals receive paid care at home (Lo Sasso and Johnson 2002). This group may be particularly affected by their adult children’s work hours flexibility—having a child who can respond to medical crises may mean the difference between staying at home and transitioning to assisted living or nursing home facilities. Preventing short-term nursing home care of medically frail individuals saves money for families and taxpayers and leads to better health outcomes for the individuals themselves. Recognizing this, the government has stated that “preventing premature institutionalization is a major public health goal” (Sahyoun et al. 2001). Savings from reduced short-term nursing home stays are estimated in Table 8.
- 13 -
Table 8. Cost savings from reduced short-term nursing home stays
Cost factor Rate Source Number of caregivers of adults aged 50 and older employed full-time
8.9 million IWPR calculation based on National Alliance for Caregiving and AARP (2004), Tables 2 and 5
Average number of care recipients per caregiver
0.5 IWPR calculation based on Kramarow et al. (1999)
Percent of workers who are HFA-eligible 0.653 IWPR analysis of the 2004 CPS
Percent of workers with no paid sick leave
0.49 Lovell (2004)
Estimated length of nursing home stay averted with the HFA
1 day per care recipient
Average cost of one day of nursing home stay, semi-private room
$158 MetLife (2004)
Total $225.0 million
We estimate that savings due short-term nursing home stays will total $225.0 million annually. Distribution of the Costs and Savings To illustrate the distribution of costs and savings between employers and workers, families, and taxpayers, see Table 9. All the costs are borne by employers, and they also receive the overwhelming share of the savings we are able to estimate (98.8 percent).

- 14 -
Table 9. Distribution of HFA costs and savings
Total
($ million)
Per worker per week (over all
wage and salary
employees)
Per worker per week (over
workers covered by HFA)
EMPLOYERS Costs Wages and payroll taxes for: Newly covered workers $ 17,549.9 Workers with new leave uses 2,293.6 Workers with additional leave days 35.6 Administrative expenses 356.7 Subtotal: Costs $ 20,235.9 $ 3.04 $ 5.98 Savings Wages currently paid to workers on the job while
too ill to be productive (includes payroll taxes)
$ 1,571.5
Reduced turnover 25,840.0 Reduced spread of the flu at work 636.1 Subtotal: Savings to employers $ 28,047.7 $ 4.21 $ 8.28 Net savings to employers $ 1.17 $ 2.30 WORKERS, FAMILIES, AND TAXPAYERS Savings on health care expenditures related to
reduced spread of flu at work 102.4
Reduced short-term nursing home stays 225.0 Other savings we cannot yet value: Reduced health care expenditures due to faster
recuperation and better health outcomes Reduced public assistance spending for
workers fired for missing work without authorization
Increased financial stability for families with earnings during leave
Subtotal: Savings to workers, families, and taxpayers
$ 327.4 $0.05 $0.10
Total savings $ 28,375.0 $4.26 $8.38 Net savings to employers, workers, families, and taxpayers
$ 8,139.1 $ 1.22 $ 2.40
Note: Columns may not sum to totals due to rounding. In 2003 dollars, using data from the 2004 Current Population Survey.

- 15 -
Other benefits to measure when needed data become available While we currently lack data to calculate the economic impact of all the consequences of workers not having adequate paid sick leave, it is certain that there are many others, in addition to those discussed above, that do impose costs on workers, their families, employers, taxpayers, and society as a whole. Eliminating these costs thus confers benefit on society. They include the following: 1. Additional impacts of presenteeism on employers and workers
a. Health care expenditures for workers who are sick longer because they are unable to recuperate at home: extra expenditures for workers and firms. Without adequate time to regain health, minor medical problems may be exacerbated (Grinyer and Singleton 2000), eventually requiring longer work absence and/or increased treatment costs.
b. Cost to employers of scheduling uncertainties (e.g., from workers who call at the start of their shifts to say they’re ill, when they knew the previous day they would have to stay home with a sick child).
c. Improved morale and resultant productivity; impacts on co-workers and customers. Enhanced worker loyalty and job satisfaction related to having adequate paid time off may translate into gains for employers through improved customer relations. In addition, “if ill health results in more accidents or increased errors, all who explicitly or even implicitly interact with unhealthy employees can become less productive” (Greenberg, Finkelstein, and Berndt 1995, 36).
2. Health and health care utilization impacts on family members when workers cannot provide care
Keeping children at home when they have contagious diseases like the flu can prevent illness and work absence among their schoolmates’ parents. Because “children are more susceptible to influenza, carry and spread the influenza virus over a longer period of time than adults, and are often the first to get the infection in the community” (King 2004), preventing children from being disease vectors in school and child-care settings can significantly reduce workplace absence and productivity effects among adults. Children have better short- and long-term health outcomes when they are cared for by their parents (Palmer 1993); hospital stays are shorter when parents are involved in care (Kristensson-Hallstrom, Elander, and Malmfors 1997). With increased flexibility in attending to sick children, the HFA is likely to reduce treatment costs and overall length of illness. Heart attack survivors who perceive that they receive adequate tangible social support have decreased mortality rates and better overall health outcomes than those perceiving inadequate levels of tangible social support (Woloshin et al. 1997). Being married or having children (even if not living nearby) reduces the length of hospital stays for elderly patients in acute care wards (McClaran, Berglas, and Franco 1996). Stroke victims have better functional and social outcomes when they receive high levels of family social support, and are more likely to receive nursing home care if they have low levels of support (Tsouna-Hadjis et al. 2000). Workers with

- 16 -
the flexibility provided by paid sick leave may be able to positively affect the health status of their relatives with coronary disease and other chronic medical conditions by being more able to provide timely care. 3. Other impacts on families when workers cannot take time needed to provide care When parents cannot stay home to care for sick children, older siblings may be kept out of school to care for their younger siblings (Dodson and Dickert 2004). These school absences may affect school performance and have long-range impacts on the older children’s education and work productivity. Informal caregivers whose work schedules are incompatible with the care needs of their relatives may decrease their work hours or even leave the labor force completely (Stone and Short 1990). The HFA may provide sufficient leave to many caregivers to allow them to maintain their desired level of employment while continuing to perform their caregiving work as well. 4. Lost wages of workers suspended for missing work without authorization when they are sick or a family member needs care (Dodson, Manuel, and Bravo 2002), workers fired for missing work without authorization when they are sick or a family member needs care (Browne and Kennelly 1999, Dodson, Manuel, and Bravo 2002)
5. Reduced expenditures on public assistance of workers who lose their jobs due to having inadequate paid sick days. (For instance, 8.7 percent of workers who take an FMLA-type leave and do not receive their full wages during the leave turn to public assistance for support (Cantor et al. 2001, Table A1-4.8).) 6. Increased financial stability and economic well-being of families when their incomes are not interrupted by unpaid leave. 7. The value of workers and their family members feeling better because they’re in better health (improved quality of life).
Summary The Healthy Families Act would provide a critical support for the health of workers and their families, while providing substantial, measurable benefits for employers, workers, and taxpayers. Beyond the 46.2 million workers who would get their first day of paid sick leave under the HFA, an additional 19.5 workers would have more adequate sick leave benefits under the HFA than they currently are given. The impacts of the HFA are congruent with some of the most important policy goals of the United States: a healthy, productive workforce; parental responsibility for healthy children; reduced short-term nursing home stays for the frail elderly and other medically needy individuals; and containment of individuals’ and insurers’ medical expenditures. References
American Health Care Association [AHCA]. N.d. Nursing Facility Patients by Payor. <http://www.ahca.org/research/oscar/pt_payer_200412.pdf> (March 16, 2005).
- 17 -
Blue Cross and Blue Shield of Texas. Nd. “Health Care Fact Sheet: Doctor’s Office vs. E.R.” <http://www.bcbstx.com/employer/hccc/8710_685_503.doc/> (April 18, 2005).
Browne, Irene, and Ivy Kennelly. 1999. “Stereotypes and Realities: Images of Black Women in the Labor Market.” In Latinas and African American Women at Work: Race, Gender, and Economic Inequality, Irene Browne, ed., pp. 302-326. New York: Russell Sage Foundation.
Cantor, David, Jane Waldfogel, Jeffrey Kerwin, Mareena McKinley Wright, Kerry Levin, John Rauch, Tracey Hagerty, and Martha Stapleton Kudela. 2001. Balancing the Needs of Families and Employers: Family and Medical Leave Surveys. Washington, DC: U.S. Department of Labor <http://www.dol.gov/asp/fmla/main2000.htm> January 20, 2001.
CCH Incorporated. 2004a. “Unscheduled Absenteeism Rises to Five-Year High.” Human Resources Management Ideas & Trends (Issue No. 592): 145-148.
-----. 2004b. “Flu Vaccination Shortage Means Employers Should Take Special Steps to Combat ‘Presenteeism’.” Human Resources Management Ideas & Trends (Issue No. 593).
ComPsych. 2004. Vast Majority of Employees Work While Sick, According to ComPsych Survey. Press Release. Chicago: ComPsych. March 8. <http:/www.compsych.com> (downloaded March 17, 2005).
Cooper, Philip F., and Alan C. Monheit. 1993. “Does Employment-Related Health Insurance Inhibit Job Mobility?” Inquiry 30 (Winter): 400-416.
Dodson, Lisa, and Jillian Dickert. 2004. “Girls’ Family Labor in Low-Income Households: A Decade of Qualitative Research.” Journal of Marriage and Family 66 (May): 318 – 332.
Dodson, Lisa, Tiffany Manuel, and Ellen Bravo. 2002. Keeping Jobs and Raising Families in Low-Income America: It Just Doesn’t Work. Cambridge, MA: Radcliffe Institute for Advanced Study.
Earle, Alison, and S. Jody Heymann. 2002. “What Causes Job Loss Among Former Welfare Recipients: The Role of Family Health Problems.” Journal of the American Medical Women’s Association 57 (Winter): 5 – 10.
Employment Policy Foundation. 2002. “Employee Turnover – A Critical Human Resource Benchmark.” HR Benchmarks (December 3): 1-5 (www.epf.org, accessed January 3, 2005).
Emsellem, Maurice, Katherine Allen, and Lois Shaw. 1999. The Texas Unemployment Insurance System: Barriers to Access for Low-Wage, Part-Time & Women Workers. New York, NY: National Employment Law Project.
Freedman, Vicki A. 1993. “Kin and Nursing Home Lengths of Stay: A Backward Recurrence Time Approach.” Journal of Health and Social Behavior 34(June): 138-152.
Goetzel, Ron Z., Stacey R. Long, Ronald J. Ozminkowski, Kevin Hawkins, Shaohung Wang, and Wendy Lynch. 2004. “Health, Absence, Disability, and Presenteeism Cost Estimates

- 18 -
of Certain Physical and Mental Health Conditions Affecting U.S. Employers.” Journal of Occupational and Environmental Medicine 46 (April): 398-412.
Greenberg, Paul E., Stan N. Finkelstein, and Ernst R. Berndt. 1995. “Economic Consequences of Illness in the Workplace.” Sloan Management Review 36 (Summer): 26-38.
Grinyer, Anne, and Vicky Singleton. 2000. “Sickness Absence as Risk-Taking Behavior: A Study of Organizational Culture Factors in the Public Sector.” Health, Risk and Society 2 (March): 7 – 21.
Heymann, Jody. 2000. The Widening Gap: Why America’s Working Families AreIin Jeopardy and What Can Be Done About It. New York: Basic Books.
Islam, M. N., C. Dennis O’Shaughnessy, and Bruce Smith. 1996. “A Random Graph Model for the Final-Size Distribution of Household Infections.” Statistics in Medicine 15 (April 15 – May 15): 837-843.
Johnson, Walter E. and Dan M. Tratensek. 2001. “Employee Turnover.” Do-It-Yourself Retailing 180 (June).
Kaiser Family Foundation. 2005. “Average Price of Retail Prescriptions Filled, 2003.” <http://www.statehealthfacts.org> (April 18, 2005).
Kavet, Joel. 1977. “A Perspective on the Significance of Pandemic Influenza.” American Journal of Public Health 67 (November): 1063 – 1070.
Keech, M., A. J. Scott, and P. J. J. Ryan. 1998. “The Impact of Influenza and Influenza-Like Illness on Productivity and Healthcare Resource Utilization in a Working Population.” Occupational Medicine 48 (February): 85 – 90.
King, James C. 2004. Quoted in Study Shows School-Based Nasal Influenza Vaccinations Significantly Reduce Flu-Related Costs in Families. Press Release. University of Maryland Medical Center, May 25. <http://www.umm.edu/cgi-bin/printpage.cgi> (March 17, 2005).
Kramarow, E., H. Lentzner, R. Rooks, J. Weeks, and S. Saydah. 1999. “Health Care Access and Utilization.” Health and Aging Chartbook. Hyattsville, Maryland: National Center for Health Statistics. <http://www.cdc.gov> (April 17, 2005).
Kristensson-Hallstrom, Inger, Gunnel Elander, and Gerhard Malmfors. 1997. “Increased Parental Participation in a Pediatric Surgical Day-Care Unit.” Journal of Clinical Nursing 6 (July): 297 – 302.
Li, Jiehui, Guthrie S. Birkhead, David S. Strogatz, and F. Bruce Coles. 1996. “Impact of institution size, staffing patterns, and infection control practices on communicable disease outbreaks in New York state nursing homes.” American Journal of Epidemiology 143 (10): 1042 – 1049.

- 19 -
Longini, Ira M., Jr., James S. Koopman, Michael Haber, and George A. Cotsonis. 1988. “Statistical Inference for Infectious Diseases: Risk-Specific Household and Community Transmission Parameters.” American Journal of Epidemiology 128 (October): 845 – 859.
Lo Sasso, Anthony T., and Richard W. Johnson. 2002. “Does Informal Care from Adult Children Reduce Nursing Home Admissions for the Elderly?” Inquiry 39 (October 1).
Lovell, Vicky. 2004. No Time to be Sick: Why Everyone Suffers When Workers Don’t Have Paid Sick Leave. IWPR Publication No. B242. Washington, D.C.: Institute for Women’s Policy Research.
McClaran, Jacqueline, Robin Tover Berglas, and Eliane Duarte Franco. 1996. “Long Hospital Stays and Need for Alternate Level of Care at Discharge.” Canadian Family Physician 42 (March): 449 – 461.
Mehdizadeh, Shahla, and Robert Applebaum. 2003. “A Ten-year Retrospective Look at Ohio’s Long-term Care System.” Scripps Gerontology Center of Miami University. May. <http://www.scripps.muohio.edu/scripps/publications/documents/SGC0070TenYearRetrospective.pdf> (April 17, 2005).
MetLife. 2004. The MetLife Market Survey of Nursing Home & Home Care Costs. Westport, CT: MetLife Mature Market Institute.
National Alliance for Caregiving and AARP. 2004. “Caregiving in the U.S.” (April). Besthesda, Maryland and Washington, D.C.
Nichol, Kristin L. 2001. “Cost-Benefit Analysis of a Strategy to Vaccinate Healthy Working Adults Against Influenza.” Archives of Internal Medicine 161 (March 12): 749 – 759.
Office of Personnel Management. 2000a. “Sick Leave.” 26 September. <http://www.opm.gov/ oca/leave/ HTML/sicklv.htm> (April 17, 2005).
-----. 2000b. “Sick Leave to Care for a Family Member with a Serious Health Condition.” 26 October. <http://www.opm.gov/oca/leave/ HTML/12week.htm> (April 17, 2005).
Palmer, Sarah J. 1993. “Care of Sick Children by Parents: A Meaningful Role.” Journal of Advanced Nursing 18 (February): 185 – 191.
Phillips, Douglas J. 1990. “The Price Tag on Turnover.” Personnel Journal 2162(December): 58-61.
Potter, Jan, David J. Stott, Margaret A. Roberts, Alexander G. Elder, B. O’Donnell, Paul V. Knight, and William F. Carman. 1997. “Influenza Vaccination of Health Care Workers in Long-Term-Care Hospitals Reduces the Mortality of Elderly Patients.” Journal of Infectious Diseases 175 (January): 1-6.
Rutgers University Center for Women and Work analysis of data from U.S. Department of Labor, Family and Medical Leave Surveys, 2000 Update. April 12, 2005.

- 20 -
Sahyoun, Nadine R., Laura A. Pratt, Harold Lentzner, Achintya Dey, and Kristen N. Robinson. 2001. “The Changing Profile of Nursing Home Residents: 1985-1997.” Aging Trends 4. Hyattsville, MD National Center for Health Statistics.
Smith, Andrew. 1989. “A Review of the Effects of Colds and Influenza on Human Performance.” Journal of the Society of Occupational Medicine 39: 65-68.
-----. 1990. “Respiratory Virus Infections and Performance.” Philosophical Transactions of the Royal Society of London, Series B, Biological Sciences 327 (April 12): 519 – 528.
Stone, Robyn I., and Pamela Farley Short. 1990. “The Competing Demands of Employment and Informal Caregiving to Disabled Elders.” Medical Care 28 (June): 513 – 526.
Tsouna-Hadjis, Evie, Kostas N. Vemmos, Nikolaos Zakopoulos, and Stamatis Stamatelopoulos. 2000. “First-Stroke Recovery Process: The Role of Family Support.” Archives of Physical Medicine and Rehabilitation 81(July): 881-887.
U.S. Bureau of Labor Statistics. 2004a. Employment Characteristics of Families in 2003. USDL 04-719. Washington, D.C.: U.S. Bureau of Labor Statistics.
-----. 2004b. Job Openings and Labor Turnover: October 2004. USDL 04-2462. Washington, DC: U.S. Bureau of Labor Statistics.
-----. 2005. Employer Costs for Employee Compensation—December 2004. USDL 05-432. Washington, D.C.: U.S. Bureau of Labor Statistics.
U.S. Social Security Administration. 2005. Annual Statistical Supplement, 2004. Washington, DC: U.S. Social Security Administration. http://www.ssa.gov/policy/docs/statcomps/supplement/#toc (April 24, 2005).
Van Houtven, Courtney Harold, and Edward C. Norton. 2004. “Informal Care and Health Care Use of Older Adults.” Journal of Health Economics 23 (November): 1159 – 1180.
Wiatrowski, William J. 2004. “Documenting Benefits Coverage for all Workers.” U.S. Bureau of Labor Statistics. Compensation and Working Conditions Online. 26 May. <http://www.bls.gov/opub/cwc/print/cm20040518ar01p1.htm> (April 20, 2005).
Woloshin, Steven, Lisa Schwartz, Anna Tosteson, Chiang-Hua Chang, Brock Wright, Joy Plohman, and Elliott Fisher. 1997. “Perceived Adequacy of Tangible Social Support and Health Outcomes in Patients with Coronary Artery Disease.” Journal of General Internal Medicine 12 (October): 613-618.
1 Full- and part-time federal workers earn one hour of paid sick leave for every 20 hours worked and may use 5 days (13, if sick leave balance is maintained at a minimum of 80 hours) to “provide care for a family member who is
- 21 -
incapacitated as a result of physical or mental illness, injury, pregnancy, or childbirth . . . . [or] as a result of medical, dental, or optical examination or treatment” or bereavement (Office of Personnel Management 2000a, Office of Personnel Management 2000b). The definition of family is at least as broad as in the HFA. 2 The dataset used for the No Time to be Sick report did not include federal, military, agricultural, or private household workers. 3 We are not able to determine what portion of these 2.5 million workers are HFA eligible. For the most conservative cost estimate, we assume all would be. 4 Excludes those whose answers were supplied by a proxy; not working, self-employed, and unpaid workers; and federal and private household workers. 5 Days missed excludes maternity leave. The difference in days missed by sick leave status is statistically significant at the p < 0.000 level. 6 We do not make any adjustment for women who are covered by Temporary Disability Insurance (TDI), under the assumption that, since HFA leave is paid at 100 percent of wages while TDI is usually paid at around 60 percent of wages, and because pregnant women with TDI will likely need paid sick leave during their pregnancy when they don’t feel well or need to visit a doctor, all employed women who have babies will use all their HFA leave. 7 The current voluntary turnover rate is 20.4 percent (IWPR calculation using U.S. BLS 2004b). 8 This is the mean of six rates derived from data on three disease outbreaks.
___________________________________________________________________________________________ The Institute for Women’s Policy Research is a scientific research organization dedicated to informing and stimulating the debate on issues of critical importance to women and their families. IWPR focuses on issues of poverty and welfare, employment and earnings, work and family, health and safety, and women’s civic and political participation. IWPR, an independent, nonprofit, research organization, also works in affiliation with the graduate programs in public policy and women’s studies at The George Washington University.