r es u l ts su m m ary of l is ted c om p an ies in th e...
TRANSCRIPT

1 © All rights reserved
Please read Disclaimer on the back
February 2015 R es u l ts Su m m ary of L is ted C om p an iesin th e Sau di Mark et4Q2014
Executive Summary
The Q4-2014 Saudi corporate results were noticeably mixed. As a whole, the total market profitability dropped
24.4% YoY to reach SAR 19.9 billion. Seven sectors in TASI witnessed growth in profitability on annual basis, while
eight sectors witnessed an annual drop.
TASI’s Trailing PE is at 18.7x, PB is at 2.2x and dividend yield at 2.9%. Historically, TASI’s PE average for the last
10 years was around 17x. The MSCI Frontier Market Index PE is at 14.9x, and the MSCI Emerging Market Index PE
is around 12.5%. Our calculated forward 2015 PE for TASI is around 14.7x. We believe opening TASI for foreign
investors this year will attract new funds especially to sectors such as petrochemicals, banks, cement and selected
mid-sized companies.
It was no surprise that petrochemicals played a significant role in cumulative profitability annual decline. The
sector’s cumulative profitability dropped by 34.5% YoY to SAR 6.4 billion, following the rapid 50% drop in oil prices
within the same period. The petrochemical sector constituted only 32.5% of total market profitability in the quarter.
We believe we will see even lower profits in 2015, as the sector enjoyed three quarters of 2014 with oil prices above
USD 100.
The cumulative profitability of banks and financial services sector rose by 14.4% YoY to reach SAR 9.7 billion,
constituting 49% of total market profitability. Banks are the major player in TASI now. Growth of the sector is 2015
remains a challenge with the existence of fierce competition and lack of new products.
Cement Sector rebounded as its profitability rose 32.2% YoY to SAR 1.47 billion (third largest contributor to market
profitability of 7.5%). The year 2015 seems favorable for the cement sector.
Telecom sector is no longer a major player as it ended the quarter with cumulative loss of SAR 188 million, mainly
because of Mobily’s dramatic revision of profits. Growth is stagnant in this sector.
The building and construction sector witnessed 96% drop in profitability YoY caused mainly by Almojl Group.
Transportation sector witnessed significant drop in profitability on YoY basis, however this was mainly due to
Albahri 56% drop in profitability followed by Mubarrad’s loss of SAR 3.1 million compared to SAR 81 gain in
Q4-2013.
We have seen a positive surprise however in the Insurance sector. The sector made a quarterly profit of SAR 291
million compared to 1.2 billion losses in Q4-2013. The major contributions came from a significant turnaround
from the three biggest players in the sector NCCI, MedGulf, and Bupa. This year could witness a turnaround also for
smaller companies who started making profits.
Retail Sector profitability growth was stagnant in Q4-2015; however, we believe the sector will have a significant
boost in profitability in Q1-2015 due to the effect of recent two salary giveaways by the king. The valuation of
companies in this sector is expensive which makes it less attractive at the moment.
The industrial investment sector witnessed a sharp 152% YoY jump on profitability; however, this was mainly due
to rise in Maaden’s quarterly profits to SAR 376 million compared to SAR 29 million loss same quarter last year.
Maaden remains an attractive long-term investment opportunity. Our 2017 forecasted PE is 17.5x compared to a
current PE of 34.5x.

2 © All rights reserved
Please read Disclaimer on the back
February 2015 R es u l ts Su m m ary of L is ted C om p an iesin th e Sau di Mark et4Q2014
Dar Alarkan had the lowest P/BV in the Saudi market at 0.64x, followed by
Methanol Chemicals and Saudi Electricity Company at 1.06x and 1.13x,
respectively.
The TTM P/BV for the Saudi market stood at 2.2x.
Salama Cooperative and Saudi Indian lost 73.6% and 71% of its capital
(since inception), respectively.
11 of the top 15 highest accumulated loss to capital in the market are from
Insurance sector companies.
Taiba Holding Co. and Al Hassan Ghazi Ibrahim Shaker posted the lowest
PE in the Saudi market at 5x for the trailing twelve months (TTM), followed
by Advanced Petrochemical at 8.7x.
Average PE for the Saudi market on TTM basis stood at 18.7x.
Arabian Cement Company’s shares had the best dividend yield in the
Saudi market at 6.3%; the Cement sector dominated, with �ve companies
among the top 15, the sector in terms of dividend yield.
Overall dividend yield in the Saudi market was 2.9%.
Company D/Y*(%) P/Bv (x) P/E (x)
Arabian Cement Co. 6.3 2.45 12.01Qassim Cement Co. 6.3 2.21 14.65Saudi Cement Co. 6.2 4.73 13.61YANSAB 6 1.79 10.83Yamamah Cement Co. 6 2.74 14.48Advanced Petrochemical 5.9 3.45 8.78Taiba Holding Co. 5.9 1.65 5.02Yanbu Cement Co. 5.8 1.79 10.83Saudi Basic Industries Corp 5.7 1.73 10.69National Gas and IND. 5.5 2.41 16.04Saudi Telecom 5.3 2.18 11.95Saudi Automotive Services 5.2 1.73 13.47AL-Abdullatif Investment 5.1 2.53 13.51Saudi vitrified clay pipes 4.9 6.02 13.42Southern Province Cement Co. 4.7 5 14.64
Source: Bloomberg, AlJazira Capital
Company P/E (x) P/BV (x) D/Y (%)
Taiba Holding Co.* 5.02 1.65 5.9Al Hassan Ghazi Ibrahim Shaker* 5.39 2.85 3.27Advanced Petrochemical Co. 8.78 3.45 5.9Samba Financial Group 9.24 1.48 2.87Alujain Corporation* 9٫64 1.72 -Arab National Bank 10.61 1.6 2.96Saudi Basic Industries Corp 10.69 1.73 5.71Banque Saudi Fransi 10.73 1.68 2.69YANSAB 10.83 1.79 6.0Saudi Industrial Investment Group 10.83 1.4 3.52Zamil Industrial Investment Co 10.83 1.96 3.46AL-BABTAIN Company 10.88 2.41 2.43Al-Jouf Agriculture Co. 11.43 1.77 2.13Saudi Pharmaceutical Indust 11.57 1.5 -SAUDI HOLLANDI 11.68 2.82 2.09
Source: Bloomberg, AlJazira Capital *Non-Recurring gains.
Company Bk Value P/Bv (x) L/C (%)
Salama Cooperative Insurance 2.64 11.87 73.60%Saudi Indian Company 2.9 11.99 71%Arabia Insurance Cooperative 3.18 6.37 68.20%Amana Cooperative Insurance 3.95 4.05 60.50%Al Alamiya for Cooperative 2.07 15.22 58.60%Etihad Atheeb 4.22 1.9 57.80%Alinma Tokio Marine 4.44 11.99 55.60%Saudi Fisheries Co 4.77 6.5 52.30%Solidarity Saudi Takaful 5.04 4.43 49.60%Zain Telecom Company 5.06 1.44 49.40%Al-Rajhi Company for Cooperative 5.27 8.63 47.40%Gulf Union Cooperative 5.27 3.94 47.30%United Cooperative Assurance 5.53 3.55 44.70%Saudi Cable Company 5.63 1.86 43.70%Al-Ahlia Insurance Company 5.66 1.82 43.40%
L /C refers to losses to capital Source: Bloomberg, AlJazira Capital
Top 15 Companies
Lowest 15 Companies
Top 15 Companies
Highest 15 Companies
Lowest P/E
Accumulated Loss to Capital
Highest D/Y
Lowest P/BV
Company P/Bv (x) P/E (x) D/Y (%)
Dar Alarkan Real Estate Dev 0.64 15.34 -Methanol Chemicals Co. 1.06 43.81 -Saudi Electricity Company 1.13 17.13 -Saudi Arabian Amiantit Co. 1.15 17.85 -Saudi Re for Coop Reinsurance 1.21 129.67 -Saudi Advanced Industries Co. 1.24 54.83 -Nama Chemicals Co. 1.28 - -Arabian Pipes Company 1.29 100.37 -Sahara Petrochemical Co. 1.33 16.92 4.72Saudi Kayan Petrochemical Co 1.33 - -Saudi Industrial Services Co. 1.35 13.11 -Saudi Research and Marketing 1.38 16.2 -Jazan Development Co. 1.39 82.29 -Aseer Trading, Tourism & Mfg Co. 1.39 16.09 3.47Saudi Real Estate Co. 1.4 14.4 1.24
Source: Bloomberg, AlJazira Capital
Note: All statistics in this report are based on market close prices on Feb 8, 2015

3 © All rights reserved
Please read Disclaimer on the back
February 2015 R es u l ts Su m m ary of L is ted C om p an iesin th e Sau di Mark et4Q2014
Al Rajhi, which forms about 8.1% of the Saudi market, followed by SABIC at
6.9% and National Commercial Bank at 5.2%, accounts for nearly 20% of the market index.
Notably, the most in�uential stocks in the Saudi market are traditionally from Banking, Petrochemical, and Telecommunication sectors, though some companies from other sectors include jarir Marketing, Jabal Omar, Almarai, and Savola.
Al Tawuniya is the best performing stock since the beginning of the year,
appreciating 53.7%, followed by Saudi Industrial Export Co. Al Babtain Co,
achieving 46.4%, 45.4% respectively.
The list indicates that all companies have a returns above 25% since the
beginning of the year.
Etihad Etisalat Co. reported the highest negative return of 12.4%. This
was followed by Saudi British bank and Aljazira Takaful, with a stock price
decline of 6.8% and 3.6% YTD, respectively.
The list indicates six companies negatively performed since the beginning
of the year.
Company YTD % P/Bv (x) P/E (x)
Etihad Etisalat Co -12.42 1.44 151.34Saudi British Bank -6.8 2.14 13.68Aljazira Takaful Taawuni Co. -3.56 6.17 -Southern Province Cement Co. -3.3 5 14.64Bupa Arabia for Coop Insurance -0.51 6.39 21.98National Gas and Industrialization -0.06 2.41 16.04Saudi Telecom 0.17 2.18 11.95City Cement Co 0.53 2.18 19.44Arabian Cement Co 0.67 2.45 12.01Savola Group 1.21 4.21 20.78Saudi Marketing Company 1.37 5.85 27.38Saudi Hollandi Bank 1.57 2.09 11.68National Agriculture Marketing 1.63 12.5 45.61Saudia Dairy and Foodstuff 2.15 4.3 18.13Tabuk Cement Co 2.54 1.97 16.21
Source: Bloomberg, AlJazira Capital
Company YTD % P/Bv (x) P/E (x)
Al TAWUNIYA Company 53.66 3.7 8.92Saudi Industrial Export Co. 46.36 4.71 -AL BABTAIN Company 45.42 2.41 10.88Alinma Tokio Marine Co 42.57 12.05 -Alujain Corporation 40.56 1.72 6.69Saudi Arabia Refineries Co. 38.16 2.12 28.24Allied Cooperative Insurance Group 33.45 4.89 45.04Tourism Enterprise Co. 32.18 5.57 79.33Saudi Arabian Co-op Insurance Co 31.2 6.27 18.37Abdulmohsen Alhokair group 30.65 5.89 16.63Allianz Saudi Fransi Coop Ins. Co. 29.29 4.79 43.3Buruj cooperative Insurance 29.12 6.21 24.49Dar Alarkan Real Estate 28.41 0.64 15.34Alahli Takaful Co. 28.25 5.34 26.62National Agriculture Development 27.83 2.18 20.01
Source: Bloomberg, AlJazira Capital
Company Issued Shares
Free Shares F/I (%)
Kingdom Holding Company 37,05,882 1,853 5.00%Saudi Telecom 20,00,000 3,251 16.30%Saudi Electricity Company 41,66,594 7,158 17.20%Petrochem 4,80,000 840 17.50%Rabigh Refining and Petro Co. 8,76,000 1,610 18.40%Saudi Basic Industries Corp 30,00,000 6,338 21.10%Saudi Hollandi Bank 4,76,280 1,317 27.60%Alabdullatif Industrial 81,250 243 29.90%Abdulmohsen Alhokair Group 55,000 165 30.00%Al Hammadi Development 75,000 225 30.00%Saudi Marketing Co 35,000 105 30.00%Al Alamiya for Cooperative Ins 40,000 120 30.00%Aljazira Takaful Taawuni Co. 35,000 105 30.00%Saudi Airlines Catering Co. 82,000 246 30.00%Alinma Tokio Marine Co 20000 60 30.00%
Source: Tadawul, Bloomberg, AlJazira Capital F/I refers to free to issued shares No. of shares in ‘000
Best 15 Companies
Top 15 Companies
Worst 15 Companies
Least 15 Companies
Top price performers
Weight to the market index
Worst price performers
Ratio of free to issued shares
Company % of TASI No. of Free Shares (mn) P/E (x)
Al Rajhi Bank 8.09% 1,186 12.22Saudi Basic Industries Corp 6.89% 633 10.69National Commercial Bank 5.22% 713 12.67Jabal Omar Development 3.65% 546 116.76Savola Group 3.58% 400 20.78Samba Financial Group 3.18% 603 9.24Riyad Bank 2.85% 1,423 11.71Alinma Bank 2.71% 1,036 24.19Banque Saudi Fransi 2.56% 648 10.73Saudi Telecom 2.40% 325 11.95Jarir Marketing Co 2.06% 89.9 22.58Saudi Arabia Fertilizers Co. 2.03% 117.8 14.79Saudi British Bank 2.01% 325 13.68Etihad Etisalat Co 1.91% 444.3 151.34Almarai Company 1.88% 203 27.3
Source: Tadawul, Bloomberg, AlJazira Capital
No. of shares in ‘000
Kingdom Holding Company has the lowest ratio of free-to-issue shares,
where only 5.0% of the stocks issued are traded in the market.
According to market statistics, �ve companies have less than 20% of free �oats, as government funds hold substantial proportions of their shares.

4 © All rights reserved
Please read Disclaimer on the back
February 2015 R es u l ts Su m m ary of L is ted C om p an iesin th e Sau di Mark et4Q2014
Jarir led in terms of return on equity (RoE) at 58.6% on TTM basis, followed
by Al Hassan Ghazi Shaker at 57.4%. The top 14 companies realized RoE of
more than 30%.
Saudi Airlines Catering Co. registered the highest return on assets (RoA)
in the Saudi market at 37.3%, followed by Saudi Arabia Fertilizers Co. at
34.5%.
The top 15 companies generated RoA of more than 20%.
Company ROA (%) YTD % P/Bv (x)
Saudi Airlines Catering Co. 37.35 5.5 13.12Saudi Arabia Fertilizers Co. 34.53 8.48 -Jarir Marketing Co 31.75 9.68 13.53Bupa Arabia for Coop Insurance 30.29 -0.51 6.39Southern Province Cement Co. 28.78 -3.3 5Saudi Arabian Coop Insurance Co 26.69 31.2 6.27Al Hassan Ghazi Ibrahim Shaker 25.9 27.35 2.85Qassim Cement Co 25.75 6.03 4.31Taiba Holding Co. 25.45 7.94 1.65Al TAWUNIYA Company 24.96 53.66 3.7Saudi Cement Company. 24.28 3.75 4.73Herfy Food Services Co 23.3 20.84 8.01Saudi vitrified clay pipes co. 21.87 13.96 6.02Advanced Petrochemical Co. 21.32 24.47 3.45National Agriculture Marketing Co. 20.55 1.63 12.5
Source: Bloomberg, AlJazira Capital
Company ROE (%) YTD % P/Bv (x)
Jarir Marketing Co 58.58 9.68 13.53Al Hassan Ghazi Ibrahim Shaker 57.38 27.35 2.85Saudi Airlines Catering Co. 54.85 5.5 13.12Al-Tayyar Travel Group Holding Co. 44.39 12.29 7.04Saudi vitrified clay pipes co. 41.62 13.96 6.02Saudi Arabia Fertilizers Co. 39.35 8.48 -Southern Province Cement Co. 36.54 -3.3 5Fawaz Abdulaziz AlHokair Co 34.69 12.53 9.55Bupa Arabia for Coop Insurance 34.31 -0.51 6.39Saudi Cement Company. 33.51 3.75 4.73Taiba Holding Co. 32.44 7.94 1.65Advanced Petrochemical Co. 32.43 24.47 3.45Herfy Food Services Co 32.19 20.84 8.01Al TAWUNIYA Company 30.14 53.66 3.7Abdulmohsen Al Hokair 29.61 30.65 5.89
Source: Bloomberg, AlJazira Capital
Best 15 Companies Best15 CompaniesReturn on Equity (ROE) Return on Assets (ROA)
The net earnings of companies listed on the TASI declined 24.4% YoY during 4Q2014. The overall earnings for the quarter was SAR 19.8bn compared to
SAR 26.4bn in the corresponding period last year. Banking and Petrochemicals accounted for more than 81.5% of the earnings. SABIC, Saudi Telecom, and
National Commercial Bank were the major growth drivers, with 22.0%, 12.3%, and 9.2% share, respectively, in the total earnings in the quarter for all stocks
listed on the TASI.
E arn in g s ( P rior Y ear T T M) E arn in g s ( C u rren t Y ear T T M) % Y oY ( R H S)
10. 7%
25. 3%
2. 2%
-24. 4% -30. 0%
-20. 0%
-10. 0%
0. 0%
10. 0%
20. 0%
30. 0%
0
7,000
14,000
21,000
28 ,000
35,000
Q 1 2013/ 2014 Q 2 2013/ 2014 Q 3 2013/ 2014 Q 4 2013/ 2014
(SA
R m
n)
Total net pro�t for listed companies in the Saudi Market
Source: Bloomberg, AlJazira Capital

5 © All rights reserved
Please read Disclaimer on the back
February 2015 R es u l ts Su m m ary of L is ted C om p an iesin th e Sau di Mark et4Q2014
h The net profit for the Saudi market was SAR 19.9bn during 4Q2014 compared with SAR 26.4bn in 4Q2013, a -24.4% YoY decline.
h Weighted-average EPS for the Saudi market was SAR 0.58 per share in the quarter.
h Index heavyweights Petrochemicals and Banking sectors contributed the majority of the total earnings, with 32.5% and 49% share, respectively, while the cement sector’s net profit was 7.5% of the total net profit of the Saudi market.
h Industrial Investment sector was the best performer in the Saudi market, with a profit of SAR 595mn at the end of 4Q2014 as compared to SAR 236mn at the end of 4Q2013. It was primarily driven by Saudi Arabian Mining Company, which posted a profit of SAR 376mn in 4Q2014 vis-à-vis SAR -29mn in 4Q2013.
h While eight sectors witnessed YoY decline in profit, seven sectors registered YoY growth in profit in 4Q2014. The combined PAT decline of eight sectors was 64% YoY, led by the Energy & Utilities sector (down 168% YoY) and combined PAT increase of seven sectors was 32% YoY, led by the Industrial Investment sector.
Y T D T A SI I n dex P erf orm an ce
6,000 6,8 00 7,600 8 ,400 9,200
10,000 10,8 00 11,600
Feb-
13
May
-13
Aug-
13
Nov
-13
Feb-
14
May
-14
Aug-
14
Nov
-14
-10%
-5%
0%
5%
10%
15%
Mul
ti-In
vt
Agr
i. &
Foo
d
Tele
com
& IT
Ban
ks
Ho
tel
Bui
ldin
g
Med
ia
Pet
chem
Indu
stria
l Inv
t
Cem
ent
Ret
ail
Rea
l Est
ate
Tran
spor
t
Insu
ranc
e
Ene
rgy
YTD 2015 Sector Performance
3.3%
Sector
4Q2013 4Q2014YoY
Change%
4Q2014
Net Profit (SARmn)
EPS(SAR)
Net Profit (SARmn)
EPS(SAR)
Sector profit to Total
Banks & Financial Services 8,481.40 0.68 9,703.30 0.76 14.40% 49.00%Petrochemicals 9,812.40 1.28 6,431.10 1 -34.50% 32.50%Cement 1,116.90 0.78 1,476.20 1.11 32.20% 7.50%Retail 680.3 1.17 675.2 1.3 -0.70% 3.40%Energy & Utilities -658.7 -0.14 -1,765.30 -0.31 -168.00% -8.90%Agri & Food 1,126.10 0.87 1,168.50 0.8 3.80% 5.90%Telecom & IT 4,784.80 1.69 -188.3 -0.57 - -1.00%Insurance -1,185.90 -1.06 290.7 0.76 - 1.50%Multi-Investment 291.6 0.12 310.7 0.1 6.50% 1.60%Industrial Investment 235.8 0.22 594.6 0.39 152.20% 3.00%Real Estate Development 663.9 0.17 825.5 0.24 24.5% 3.40%Transport 433.6 0.98 199.8 0.44 -53.90% 1.00%Media & Publishing -55.3 -0.6 -39.5 -0.74 -28.50% -0.20%Hotel & Tourism 306.6 1.25 261.3 1.34 -14.80% 1.30%Building & Construction 360.3 0.73 15 0.51 -95.80% 0.10%Total Saudi Market 26,393.67 0.78 19,958.70 0.58 -24.4% 100.00%
Source: Tadawul website, AlJazira Capital
Sectors Performance

6 © All rights reserved
Please read Disclaimer on the back
February 2015 R es u l ts Su m m ary of L is ted C om p an iesin th e Sau di Mark et4Q2014
After posting 10.6% YoY growth in 3Q2014, net earnings for Saudi Arabia’s Banking sector increased 14.4% YoY to SAR 9.7bn in 4Q2014. The weighted-
average EPS stood at SAR 0.76 per share.
Most banking stocks posted YoY increase in profitability, with Bank Saudi Fransi registering the maximum growth in earnings (up 211% YoY). Only Al
Rajhi Bank and Saudi British Bank posted YoY decline in profitability (which was in low single digit).
Other heavyweights National Commercial Bank, Samba Financial, and Riyad Bank registered 1.7%, 22.5%, and 2.9% YoY growth, respectively.
Riyad Bank has the highest dividend yield in the sector at 4.1%.
Following factors led to YoY fluctuations in net profits for some companies in the sector:
h Al Rajhi Bank: Marginal decline in profits was primarily due to 47% YoY drop in non-special commission income, resulting in low operating
income which fell 12.9% YoY to SAR 3.09bn. The new regulations on fee income negatively impacted the company’s profit growth.
h Saudi Fransi: A healthy YoY profit growth of 211% was primarily due to 12% YoY surge in special commission income, 8% increase in non-special
commission income, and decline in provision expenses. Net special commission income was supported by 5% YoY growth in loans & advances,
with 10% YoY rise in customer deposits and improvement in NIMs.
h Riyad Bank: The marginal increase in profits was primarily led by high provision expense despite 8.2% YoY rise in net special commission income
and 17.4% YoY surge in non-special commission income.
h Samba Financial: The strong 22.5% YoY rise in net profit was primarily due to 5% YoY increase in net special commission income and a robust
32.6% YoY surge in the bank’s non-interest income.
h Saudi Hollandi Bank: Strong profitability was driven by a robust 24% YoY growth in net special commission income and 13% YoY growth in
non-special commission income. Loans & advances and deposits grew 22% and 24% YoY, respectively.
h Saudi British Bank: The bank’s bottom-line fell marginally due to high provisions and increase in overall operating expenses. This was partially
offset by a surge in net and non-special commission (up 9.6% YoY), driven by 8.6% YoY growth in loans and advances, and 5% YoY rise in customer
deposits.
B an k in g Sector
14,200 15,700 17,200 18 ,700 20,200 21,700 23,200 24,700 26,200
Feb-
13
May-1
3
Aug-
13
Nov-1
3
Feb-
14
May-1
4
Aug-
14
Nov-1
4
-14%
-7%
0%
7%
14%
SA
BB
Ban
k A
lJaz
ira
Ban
k A
lBila
d
Riy
ad
Alin
ma
SA
IB
Sau
di H
olla
ndi
Ara
b N
atio
nal
NC
B
Al R
ajhi
BS
F
Sam
ba
YTD 2014 Banking Sector
4.1% YTD
Company Name
4Q2013 4Q2014YoY
Change%
4Q2014
Net Profit (SARmn)
EPS(SAR)
Net Profit (SARmn)
EPS(SAR)
P/E (X) P/Bv (X) D/Y (%)
Banque Saudi Fransi 273.6 0.23 851 0.71 211.00% 12.41 1.62 2.9
Saudi Hollandi Bank 347.3 0.73 461.9 0.97 33.00% 12.04 2.12 2.2
Bank AlJazira 150.3 0.38 199 0.5 32.40% 18.81 1.79 -
Samba Financial Grp1,005.90 0.84 1,232.00 1.03 22.50% 10.18 1.34 3.3
Alinma Bank 279.9 0.19 332 0.22 18.60% 24.55 1.76 2.4
Arab National Bank 536.6 0.54 628.8 0.63 17.20% 11.34 1.57 1.7
BANK ALBILAD 213.7 0.53 248.9 0.62 16.50% 20.79 3.15 1.1
The Saudi Invest Bank 326.8 0.54 375 0.63 14.80% 11.15 1.34 3
Riyad Bank 1,030.30 0.35 1,060.00 0.35 2.90% 11.78 1.47 4.1
National Comm Bank 1,794.90 0.9 1,825.30 0.92 1.70% 13.58 2.63 1.1
The Saudi British Bank 975.5 0.98 969.4 0.97 -0.60% 12.56 2.11 2
Al Rajhi Bank 1,546.60 0.95 1,520.00 0.94 -1.70% 13.19 2.23 2.7
Total 8,481.40 0.68 9,703.30 0.76 14.41% 14.23 2.01 2.48
Source: Tadawul, Bloomberg, AlJazira Capital
Banking Sector

7 © All rights reserved
Please read Disclaimer on the back
February 2015 R es u l ts Su m m ary of L is ted C om p an iesin th e Sau di Mark et4Q2014
Net earnings for Saudi Arabia’s Petrochemical sector was SAR 6.4bn during 4Q2014 as against SAR 9.8bn in 4Q2013, a 35% YoY decline, primarily led by
heavyweights Rabigh Refinery (down 116% YoY) and SABIC (down 29% YoY). The weighted-average EPS stood at SAR 1.0 per share.
Nama Chemicals, Methonol Chemicals, and Rabigh Refinery were the worst performers in terms of YoY decline in 4Q2014. Five of 14 companies posted
YoY growth in net profit, with Saudi Kayan rising 245% YoY to SAR 12mn, followed by National Petrochemicals, which increased 158% YoY to SAR 193mn.
YANSAB and Advanced Petro Company have high dividend yield at 6.0% and 5.9%, respectively. Alujain Corporation stock performed the best, with 31%
YTD.
Following factors led to YoY fluctuations in net profits for some companies in the sector:
h SABIC: Lower average sales prices were partially offset by low costs of certain feedstock.
h Petro Rabigh: Steep crude oil price decline resulted in a significant decrease in the carrying value of inventory despite improvement in crack
spread which partly offset the negative impacts.
h SAFCO: Despite the rise in sales price, sale of smaller quantities of ammonia, and lower share of associate profits led to marginal decline in
profitability on YoY basis.
h Tasnee: 1) Price decline in titanium dioxide sector, 2) falling sales and prices of Acrylic Acid Complex products, and 3) decrease in Petrochemical
sector.
h SIIG: 1) Decline in product prices due to lower oil prices and 2) re-evaluation of final product inventory prices.
h Kayan: 1) Decrease in feedstock prices, 2) decline in Zakat provision, and 3) rise in other incomes associated with foreign currency exchange
gains. Profits grew YoY despite fall in average selling prices and sales quantity for most products apart from an increase in SG&A expenses and
financial charges.
Company Name
4Q2013 4Q2014YoY
Change%
4Q2014
Net Profit (SARmn)
EPS(SAR)
Net Profit (SARmn)
EPS(SAR)
P/E (X) P/Bv (X) D/Y (%)
Saudi Kayan Petro Co 3.4 0 11.8 0.01 244.80% - 1.25 -Petrochem 74.6 0.16 192.5 0.4 158.20% 15.14 2.39 -Alujain Corp 33.8 0.49 65.2 0.94 92.70% 8.82 1.73 -YANSAB 442.2 0.79 617.8 1.1 39.70% 10.35 1.65 6.0Advanced Petro Co 161.3 0.98 200.1 1.22 24.10% 9.99 3.15 5.9Saudi Arabia Fert. Co. 802 2.41 779.2 2.34 -2.80% 15.15 - 4.2Saudi Basic Indus Corp 6,157.40 2.05 4,356.30 1.45 -29.30% 10.76 1.55 5.7Sipchem 196.8 0.54 132.4 0.36 -32.70% 17.13 1.75 4.6TASNEE 300.1 0.4 160.7 0.24 -46.50% 15.41 1.49 -Sahara Petro Co. 178.2 0.41 92.2 0.21 -48.20% 18.19 1.23 5.2Saudi Indus Invest Grp 203 0.45 85 0.19 -58.10% 11.86 1.63 3.6Rabigh Ref & Petro Co 1,239.90 1.42 -197.9 -0.23 - 24.77 1.77 -Methanol Chemicals Co 36 0.3 -18.2 -0.2 -150.60% 46.74 0.95 -Nama Chemicals Co. -16.3 -0.13 -45.9 -0.4 -181.10% - 1.07 -Total 9,812.40 1.28 6,431.10 1 -34.50% 15.13 1.72 3.4
Source: Tadawul, Bloomberg, AlJazira Capital
Petrochemical Sector
P etroch em ical s Sector
4,500 5,100 5,700 6,300 6,900 7,500 8 ,100 8 ,700 9,300 9,900
Feb-
13
May
-13
Aug-
13
Nov
-13
Feb-
14
May
-14
Aug-
14
Nov
-14
-7% 0% 7%
14% 21% 28 % 35%
Yan
bu
SIIG
TAS
NE
E
SA
BIC
SA
FCO
Nam
a
Met
hano
l
Pet
ro R
abig
h
Sau
di K
ayan
SIP
CH
EM
Sah
ara
Nat
iona
l
Adv
ance
d
Alu
jain
% YTD 2014 Petrochemical Sector
0.5% YTD

8 © All rights reserved
Please read Disclaimer on the back
February 2015 R es u l ts Su m m ary of L is ted C om p an iesin th e Sau di Mark et4Q2014
Net earnings for Saudi Arabia’s Cement sector increased 32% YoY to SAR 1.5bn in 4Q2014 from SAR 1.12bn in 4Q2013. The weighted-average EPS stood
at SAR 1.11 per share.
Arabian Cement (up 236% YoY), Najran Cement (up 214% YoY), and Yanbu Cement (up 21%) registered robust earnings growth, while Tabuk Cement
(down 24% YoY), Yamamah Cement (down 15.0% YoY), and Southern Province Cement Co. (down 3.2% YoY) led the decline in earnings.
Currently, five cement companies among the top 15 by dividend yield, led by Arabian Cement (6.3%) and Qassim Cement (6.3%), make an attractive
proposition for investors to invest in the sector.
Following factors led to YoY fluctuations in net profits for some companies in the sector:
h Saudi Cement: Improvement in local demand, increase in the share of associated companies’ profits, and decline in Zakat expenses.
h Arabian Cement: 1) Increase in sales revenue to SAR 430mn in 4Q2014 from SAR 349mn in 4Q2013, 2) improved performance of the subsidiary
company due to rise in prevailing sales price in the Jordanian market, and 3) impairment loss of SAR 212mn related to the subsidiary company
in Jordan in 4Q2013.
h Najran Cement: Higher sales volume despite lower average sales price and higher selling, administrative, and finance expenses. In 4Q2013, high
costs of imported clinker used in cement production and arrears of withholding tax related to prior periods were witnessed.
h Southern Province Cement: In 4Q2013, impairment of miscellaneous income due to government subsidy for imported clinker was observed.
Company Name
4Q2013 4Q2014
YoY Change%
4Q2014
Net Profit (SARmn)
EPS(SAR)
Net Profit (SARmn)
EPS(SAR)
P/E (X) P/Bv (X) D/Y (%)
Arabian Cement Co -106.7 -1.07 145.6 1.46 - 12.04 2.55 6.3Najran Cement Co 20.4 0.12 64 0.38 213.80% 20.04 2.4 2.1AL JOUF CEMENT CO 8 0.1 20.7 0.2 160.50% 33.51 1.46 -Eastern Prov. Cement 54.6 0.64 78.7 0.92 44.10% 13.71 2.26 -Hail Cement Co. 28.9 0.3 40.9 0.42 41.30% 16.26 2.27 2.4Yanbu Cement Co. 160.2 1.02 193.3 1.23 20.60% 13.87 3.15 5.8Northern Rgn Cement 51.6 0.29 60 0.33 16.40% 17.12 1.92 4.3Saudi Cement Co 247 1.6 269.3 1.76 9.00% 14.32 4.79 6.2Qassim Cement 135.3 1.5 134.2 1.49 -0.80% 14.65 4.18 6.3City Cement Co 48.3 0.26 47.3 0.25 -2.00% 19 2.13 4.4Southern Prov Cement 253.5 1.81 245.3 1.75 -3.20% 14.48 5.11 4.8Yamamah Saudi Cem. 177.7 0.88 151.7 0.7 -14.60% 15 2.69 6Tabuk Cement Co. 38.1 0.42 28.9 0.32 -24.20% 16.35 1.94 3.9Umm Al-Qura Cem. Co 0 0 -3.7 -0.07 - - 4.31 -
Total 1,116.90 0.78 1,476.20 1.11 32.20% 15.12 2.89 5.21
Source: Tadawul, Bloomberg, AlJazira Capital
Cement Sector
C em en t Sector
5,500
6,100
6,700
7,300
7,900
8 ,500
9,100
Feb-
13
May
-13
Aug-
13
Nov
-13
Feb-
14
May
-14
Aug-
14
Nov
-14
-4% -2% 0% 2% 4% 6% 8 %
10% 12% 14% 16%
City
Sou
ther
n
Ara
bian
Tabu
k
Yam
amah
Sau
di
Nor
ther
n
East
ern
Hai
l
Qas
sim
Naj
ran
Al J
ouf
Um
m A
l
Yanb
u
YTD 2014 Cement Sector
3.9% YTD
9 © All rights reserved
Please read Disclaimer on the back
February 2015 R es u l ts Su m m ary of L is ted C om p an iesin th e Sau di Mark et4Q2014
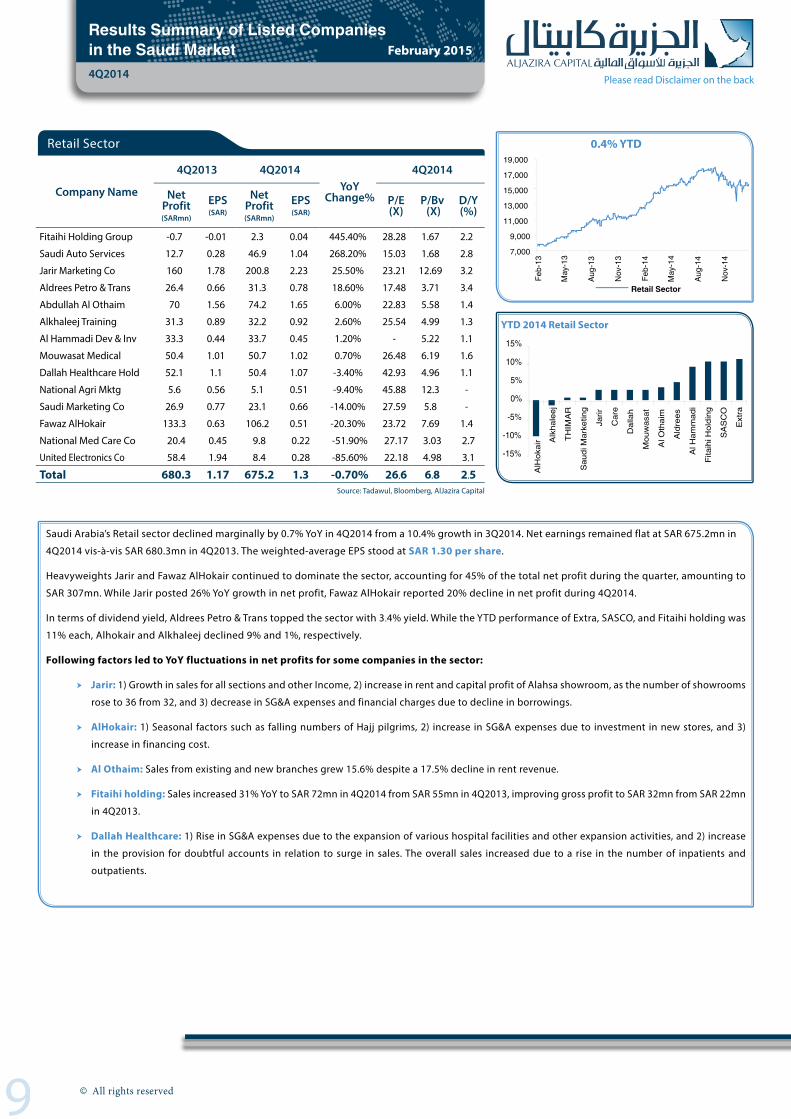
Saudi Arabia’s Retail sector declined marginally by 0.7% YoY in 4Q2014 from a 10.4% growth in 3Q2014. Net earnings remained flat at SAR 675.2mn in
4Q2014 vis-à-vis SAR 680.3mn in 4Q2013. The weighted-average EPS stood at SAR 1.30 per share.
Heavyweights Jarir and Fawaz AlHokair continued to dominate the sector, accounting for 45% of the total net profit during the quarter, amounting to
SAR 307mn. While Jarir posted 26% YoY growth in net profit, Fawaz AlHokair reported 20% decline in net profit during 4Q2014.
In terms of dividend yield, Aldrees Petro & Trans topped the sector with 3٫4% yield. While the YTD performance of Extra, SASCO, and Fitaihi holding was
11% each, Alhokair and Alkhaleej declined 9% and 1%, respectively.
Following factors led to YoY fluctuations in net profits for some companies in the sector:
h Jarir: 1) Growth in sales for all sections and other Income, 2) increase in rent and capital profit of Alahsa showroom, as the number of showrooms
rose to 36 from 32, and 3) decrease in SG&A expenses and financial charges due to decline in borrowings.
h AlHokair: 1) Seasonal factors such as falling numbers of Hajj pilgrims, 2) increase in SG&A expenses due to investment in new stores, and 3)
increase in financing cost.
h Al Othaim: Sales from existing and new branches grew 15.6% despite a 17.5% decline in rent revenue.
h Fitaihi holding: Sales increased 31% YoY to SAR 72mn in 4Q2014 from SAR 55mn in 4Q2013, improving gross profit to SAR 32mn from SAR 22mn
in 4Q2013.
h Dallah Healthcare: 1) Rise in SG&A expenses due to the expansion of various hospital facilities and other expansion activities, and 2) increase
in the provision for doubtful accounts in relation to surge in sales. The overall sales increased due to a rise in the number of inpatients and
outpatients.
Company Name
4Q2013 4Q2014YoY
Change%
4Q2014
Net Profit (SARmn)
EPS(SAR)
Net Profit (SARmn)
EPS(SAR)
P/E (X)
P/Bv (X)
D/Y (%)
Fitaihi Holding Group -0.7 -0.01 2.3 0.04 445.40% 28.28 1.67 2.2
Saudi Auto Services 12.7 0.28 46.9 1.04 268.20% 15.03 1.68 2.8
Jarir Marketing Co 160 1.78 200.8 2.23 25.50% 23.21 12.69 3٫2
Aldrees Petro & Trans 26.4 0.66 31.3 0.78 18.60% 17.48 3.71 3٫4
Abdullah Al Othaim 70 1.56 74.2 1.65 6.00% 22.83 5.58 1.4
Alkhaleej Training 31.3 0.89 32.2 0.92 2.60% 25.54 4.99 1.3
Al Hammadi Dev & Inv 33.3 0.44 33.7 0.45 1.20% - 5.22 1.1
Mouwasat Medical 50.4 1.01 50.7 1.02 0.70% 26.48 6.19 1.6
Dallah Healthcare Hold 52.1 1.1 50.4 1.07 -3.40% 42.93 4.96 1.1
National Agri Mktg 5.6 0.56 5.1 0.51 -9.40% 45.88 12.3 -
Saudi Marketing Co 26.9 0.77 23.1 0.66 -14.00% 27.59 5.8 -
Fawaz AlHokair 133.3 0.63 106.2 0.51 -20.30% 23.72 7.69 1.4
National Med Care Co 20.4 0.45 9.8 0.22 -51.90% 27.17 3.03 2.7
United Electronics Co 58.4 1.94 8.4 0.28 -85.60% 22.18 4.98 3٫1
Total 680.3 1.17 675.2 1.3 -0.70% 26٫6 6٫8 2٫5Source: Tadawul, Bloomberg, AlJazira Capital
Retail Sector
R etail Sector
7,000
9,000
11,000
13,000
15,000
17,000
19,000
Feb-
13
May
-13
Aug-
13
Nov
-13
Feb-
14
May
-14
Aug-
14
Nov
-14
-15%
-10%
-5%
0%
5%
10%
15%
AlH
okai
r Alk
hale
ej
THIM
AR
Sau
di M
arke
ting
Jarir
Car
e
Dal
lah
Mou
was
at
Al O
thai
m
Ald
rees
Al H
amm
adi
Fita
ihi H
oldi
ng
SA
SC
O
Ext
ra
YTD 2014 Retail Sector
0.4% YTD

10 © All rights reserved
Please read Disclaimer on the back
February 2015 R es u l ts Su m m ary of L is ted C om p an iesin th e Sau di Mark et4Q2014
Net earnings for Saudi Arabia’s Agriculture and Food sector grew in low single digit at c.4% YoY to SAR 1,169mn during 4Q2014 as against SAR 1,126mn in 4Q2013. The weighted-average EPS was SAR 0.8 per share.
The sector’s flat performance was due to high-weight stocks, including Savola, with earnings declining 23% in 4Q2014. Other major players, including Almarai and Saudi Airlines Catering contributed to the overall growth in the sector, with the net profit rise of 15% and 36%, respectively.
Saudi Airlines Catering was the highest and second-highest in terms of RoA and RoE, respectively, among all TASI-listed companies. The company also leads in dividend yield (3٫1%) in the sector. Herfy Foods rose 14% YTD, the highest in the sector.
Following factors led to YoY fluctuations in net profits for some companies in the sector:
h Almarai: 1) Growth in quarter sales of 10.7%, led by continuous sales growth in poultry, dairy & juice segments by 34.1% and 10.7%, respectively, despite a 3.8% fall in the sales of the Bakery segment, 2) relatively stable cost of sales led to a 24.0% growth in gross profit, 3) SG&A and depreciation increased due to continuous infrastructure expansion, and 4) reduction in net finance costs. Overall net profit rose for all business segments, except poultry, which lowered losses by 43.0% to SAR 72.0mn.
h Savola: 1) Net income fell in 4Q2014 from 4Q2103, as the latter witnessed capital gains of SAR231mn from land sale to Al-Madinah Al-Munauwarah to Knowledge Economic City, and 2) the impact of accounting treatment for operations in Iran and Sudan, along with balance sheet and income statement adjustments, and the full-year impact recognized in Q42013.
h Saudi Airlines Catering: Robust increase in sales of 10% YoY, led by strong inflight sales (up 6% YoY), Al Fursan Lounges sales (up 41% YoY), sky sales (up 16% YoY), and non-airlines sales (up 32%) were key growth drivers. Moreover, various cost provisions contributed to the overall net profit growth.
Company Name
4Q2013 4Q2014YoY
Change%
4Q2014
Net Profit (SARmn)
EPS(SAR)
Net Profit (SARmn)
EPS(SAR)
P/E (X) P/Bv (X) D/Y(%)
Ash-Sharqiyah Dev Co -0.9 -0.13 0.2 0.03 - - 10.42 -Jazan Dev Co. -50.1 -1 5.7 0.11 - 96.5 1.28 -Tabuk Agri Dev Co. -19.9 -0.4 1.7 0.04 - 71.7 1.49 1.9Saudi Airlines Cater Co 127.2 1.55 172.8 2.11 35.90% 23.8 12.7 3٫1National Agri Dev Co. 14.8 0.21 20 0.29 35.20% 22.47 1.91 -Almarai Company 373.3 0.63 428 0.72 14.70% 29.49 4.47 1.2Halwani Bros 22.5 0.79 23.6 0.83 4.90% 26.13 3.91 2.4Al-Jouf Agri Dev Co. 36.5 1.22 37 1.23 1.40% 12.36 1.78 2.3Herfy Food Services 51.3 1.11 48.7 1.05 -5.20% 24.81 7.53 2.7Anaam Intl Holding -11.6 -0.59 -12.9 -0.66 -11.10% - 3.67 -Saudi Fisheries Co. -14.1 -0.26 -11.7 -0.22 -16.90% - 5.54 -Qassim Agri Co. -6.2 -0.12 -5 -0.1 -19.30% - 1.86 -Saudia Dairy & Food 38.6 1.19 30.2 0.93 -21.60% 24.09 4.33 2.9Savola Group 564.2 1.08 434.4 0.79 -23.00% 20.79 4.23 2.5Bishah Agri Dev Co.* -0.7 -0.14 -1.1 -0.22 -63.10% - - -Food Products Co. 1.3 0.07 -3.3 -0.16 - 1311.72 3.56 1.3Total 1,126.10 0.87 1,168.50 0.8 3.80% 25٫2 4٫11 1٫27
Tadawul, Bloomberg, AlJazira Capital *Suspended from Trading
Agriculture & Food Industries Sector
A g ri & F ood Sector
6,000 7,100 8 ,200 9,300
10,400 11,500 12,600 13,700
Feb-
13
May
-13
Aug-
13
Nov
-13
Feb-
14
May
-14
Aug-
14
Nov
-14
0%
25%
Saud
i Fish
erie
s Bi
shah
Agr
i Sa
vola
Sa
udi A
irlin
es C
at.
Qas
sim A
gri
SADA
FCO
Ta
buk
Agri
Hal
wani
Bro
s Al
mar
ai
Al-J
ouf A
gri
Jaza
n De
pt.
Anaa
m
Ash-
Shar
qiya
h N
ADEC
Fo
od P
rodu
cts
Her
fy F
ood
YTD 2014 Agriculture & Food Industries Sector
3.1% YTD

11 © All rights reserved
Please read Disclaimer on the back
February 2015 R es u l ts Su m m ary of L is ted C om p an iesin th e Sau di Mark et4Q2014
Similar to that in 3Q2014, Saudi Arabia’s Telecom sector failed to continue its strong
performance in 4Q2014, with a sharp 104% YoY decline to post net loss at SAR 188mn
compared to a profit of SAR 4.8bn in the previous year. Overall sector performance was
weak, primarily due to a slump in the profitability of Etihad Etisalat (down 235% YoY). The
weighted-average EPS for 4Q2014 fell to SAR -0.57 per share from SAR 1.69 per share in the
previous year.
Saudi Telecom Company (STC) shows a worse performance in the quarter, with profits falling
33% to SAR 2.4bn, followed by a massive 235% YoY decline in Etihad Etisalat, posting a net
loss of SAR 2.3bn.
Zain and Etihad Atheeb Telecommunications reduced their losses to SAR 307mn and SAR
48mn in 4Q2014 from SAR 462mn and SAR 68mn in 4Q2013, respectively.
The YTD performance of Zain is the highest (9% gain), while Etihad Etisalat is down by12%
YTD.
Saudi Telecom has the highest dividend yield in the sector at 5.4%.
Following factors led to YoY fluctuations in net profits for major companies in the
sector:
h Saudi Telecom: 1) Increase in operating expenses, 2) loss from investment of SAR
164mn accounted for equity method versus gains of SAR 754mn in 4Q2013, and 3)
higher zakat payment worth SAR 110mn, a 178% rise from that in 4Q2013.
h Etihad Etisalat: 1) Fall in revenues (mainly due to a decrease in non-recurring revenues
from FTTH (fibre to home) capital leases, data center capacity sale agreements, and
equipment sales; 2) increase in operating expenses; 3) higher depreciation and
finance expenses; and 4) exceptional (one-off ) expenses during 4Q2014.
h Zain: 1) Improvement in gross profit due to rising demand for internet segment
services, 2) decline in repair and maintenance expenses, and 3) adjustment of the
useful life of some assets of the company.
Company Name
4Q2013 4Q2014YoY
Change%
4Q2014
Net Profit (SARmn)
EPS(SAR)
Net Profit (SARmn)
EPS(SAR)
P/E (X) P/Bv (X) D/Y (%)
Zain -462.3 -0.4 -306.5 -0.3 33.70% - 1.37 -Etihad Atheeb Tel Co -67.6 -0.4 -47.7 -0.3 29.50% - 1.64 -Saudi Telecom 3,622.70 1.8 2,442.40 1.2 -32.60% 12.1 2.21 5٫4Etihad Etisalat Co 1,692.00 2.2 -2,276.50 -3 - 137.18 1.44 3.3
Saudi Integrated Tel* - - - - - - - -
Total 4,784.80 1.69 -188.3 -0.57 -103.90% 35٫36 1٫72 3٫6Source: Tadawul, Bloomberg, AlJazira Capital *Suspended from Trading
Telecom.& I T Sector
T el ecom & I T Sector
1,500
1,8 00
2,100
2,400
2,700
3,000
3,300
Feb-
13
Apr-1
3
Jun-
13
Aug-
13
Oct
-13
Dec
-13
Feb-
14
Apr-1
4
Jun-
14
Aug-
14
Oct
-14
Dec
-14
-15%
-10%
-5%
0%
5%
10%
Mob
ily
Sau
di In
tegr
ated
Te
leco
m
STC
Ath
eeb
Tele
com
Mob
ile T
elec
om
YTD 2014 Telecom.& I T Sector
-5% YTD

12 © All rights reserved
Please read Disclaimer on the back
February 2015 R es u l ts Su m m ary of L is ted C om p an iesin th e Sau di Mark et4Q2014
Saudi Arabia’s Insurance sector registered net profit of SAR 291mn during 4Q2014 compared to SAR -1.2bn in the previous year . The sector posted
weighted-average profit of SAR 0.76 per share in the quarter.
Cooperative Insurance (Tawuniya), with the biggest weight in the sector index, posted net profit of SAR 160mn in the quarter compared to a loss of
SAR -533mn in the previous year, contributing maximum growth to the sector. Other heavyweights MEDGULF and Bupa Arabia posted net profit of SAR
52mn and SAR 124mn, respectively, in 4Q2014, as against SAR -245mn and SAR 92mn, respectively, in 4Q2013. With 25 of total 35 companies in the
sector reporting gains, the sector’s overall performance remained positive.
Al Alamiya, Alinma Tokyo, Cooperative Insurance, Trade Union Insurance, and Allianz are among the best performers in terms of YTD gains, up 59%,
36.4%, 35.9%, 31.6%, and 31.5%, respectively. Tawuinya Company has the highest dividend yield (1٫93%) in the sector.
Following factors led to YoY fluctuations in net profits for some companies in the sector:
h Tawuniya: Net earned premiums rose 12%, led by growth in gross premiums written. Net claims incurred decreased 44%.
h MEDGULF: Improvement in net underwriting due to change in the pricing policy enhanced product profitability.
Company Name
4Q2013 4Q2014YoY
Change%
4Q2014
Net Profit (SARmn)
EPS(SAR)
Net Profit (SARmn)
EPS(SAR)
P/E (X)
P/Bv (X) D/Y(%)
ALAHLI TAKAFUL 1.3 0.1 10.2 0.6 702.70% 33.18 5.19 -Allianz Saudi Fransi 1.6 0.1 11.4 0.6 614.60% 57.19 4.87 -BURUJ COOP 2.1 0.2 7.9 0.6 282.90% 48.83 6.12 -Arabian Shield Coop 3 0.1 9.7 0.5 227.50% 80.08 3.27 -Arabia Insurance Coop -13.3 -0.7 13.1 0.7 - - 7.29 -Saudi Indian Company -5.4 -0.5 2.4 0.2 - - 11.33 -Wataniya Insurance -28.1 -2.8 9.5 1 - 447.05 12.17 -Saudi Arabian -8.5 -0.8 2.6 0.3 - 22.64 5.9 -Tawuinya Company -533.4 -5.3 159.6 1.6 - 12.12 3.27 1٫93Malath Cooperative -6.6 -0.2 1.9 0.1 - - 3.3 -The Medi & Gulf Ins -244.5 -2.4 51.9 0.5 - 36.39 4.56 -Al Alamiya for Coop -9 -0.2 1.5 0 - - 42.79 -Al-Rajhi Company -10.9 -0.5 0.1 0 - - 7.72 -Cooperative Insurance -57.9 -2.1 0.4 0 - - 5.22 -Saudi Re for Coop -90.3 -0.9 -6.7 -0.1 92.60% 164.11 1.13 -Sanad Insurance -17.2 -0.9 -1.7 -0.1 90.10% - 6.72 -Salama Coop Ins -24.5 -2.5 -2.7 -0.3 88.80% 69.31 9.13 -Gulf General Coop 10 0.5 17.1 0.9 70.70% 152.23 3.24 -Solidarity Saudi Taka. -74.9 -1.4 -34.3 -0.6 54.20% - 4.12 -ACE ARABIA COOP 6.3 0.6 9.6 1 52.50% 49.1 3.39 -United Coop Assu -103.7 -3.7 -60.5 -2.2 41.70% 110.72 2.49 -Bupa Arabia for Coop 91.5 2.3 123.9 3.1 35.30% 20.57 6.01 -Al Sagr Co-operative 11.9 0.5 14.4 0.6 20.90% 50.34 2.25 -SABB Takaful 4.9 0.1 5.7 0.2 17.40% 71.39 3.42 -Al-Ahlia Ins Company -18.7 -0.6 -21 -0.7 12.30% - 2.3 -Saudi Enaya Coop Co -17.2 -0.4 -17.1 -0.4 -0.50% - 4.62 -Amana Coop Ins 17.7 0.6 13.4 0.4 -24.20% - 3.99 -Alinma Tokio Marine -8.9 -0.4 -11.6 -0.6 -29.80% - 11.53 -AXA Coop Insurance -0.9 0 -1.2 -0.1 -33.90% 46.21 3.64 -Allied Coop Ins 4.9 0.2 1.9 0.1 -61.10% 53.9 4.33 -Gulf Union Coop -21.5 -1 -1.9 -0.1 -91.20% - 3.52 -Saudi United Coop 12.5 0.6 -9 -0.4 - 97.6 2.7 -Weqaya Takaful * -57.9 -2.9 - - - - 43.96 -Aljazira Takaful Taaw * 0 0 -2 -0.1 - - - -MetLife AIG ANB * 0 0 -7.8 -0.4 - - 7.6 -Total -1,185.90 -1.06 290.7 0.76 - 87٫63 4٫29 0٫31
Source: Tadawul, Bloomberg, AlJazira Capital*No data available for comparison,
Insurance Sector
I n s u ran ce Sector
1,000 1,100 1,200 1,300 1,400 1,500 1,600 1,700 1,8 00
Feb-
13
May
-13
Aug-
13
Nov
-13
Feb-
14
May
-14
Aug-
14
Nov
-14
-15% -10%
-5% 0% 5%
10%
Alja
zira
Tak
aful
B
upa
Insu
ranc
e Weq
aya
San
ad In
sura
nce
Mal
ath
Am
ana
Med
gulf
Met
Life
S
ALA
MA
S
olid
arity
Tak
aful
A
l-Ahl
ia In
sura
nce
Uni
ted
Ass
uran
ce
WA
LAA
Insu
ranc
e W
AFA
Insu
ranc
e A
XA
Insu
ranc
e R
eins
uran
ce
0% 10% 20% 30% 40% 50% 60% 70%
Gul
f Uni
on
Enay
a In
sura
nce
Wat
aniy
a In
sura
nce
SABB
Tak
aful
Al
Sag
r Ins
uran
ce
Al-R
ajhi
Insu
ranc
e Ar
abia
G
ulf G
ener
al
BUR
UJ
Insu
ranc
e AC
IG
Arab
ian
Shie
ld
ACE
Insu
ranc
e SA
ICO
AL
AHLI
TAK
AFU
L Al
lianz
Tr
ade
Uni
on
Coo
pera
tive
Alin
ma
Toki
o
Al A
lam
iya
% YTD 2014 Insurance Sector
% YTD 2014 Insurance Sector
10.2% YTD

13 © All rights reserved
Please read Disclaimer on the back
February 2015 R es u l ts Su m m ary of L is ted C om p an iesin th e Sau di Mark et4Q2014
Net earnings of Saudi Arabia’s Hotel and Tourism sector stood at SAR 261mn during
4Q2014 compared to SAR 307mn in 4Q2013, a 14.8% YoY decline. The weighted-average
EPS was SAR 1.34 per share.
Earnings growth in the sector was driven by heavyweight Al-Tayyar, with 13.5% YoY increase
in net earnings.
Dividend yield for Al-Tayyar Travel Group Holding Co. and Abdulmohsen AlHokair was 1٫6%
each.
Company Name
4Q2013 4Q2014
YoY Change%
4Q2014
Net Profit (SARmn)
EPS(SAR)
Net Profit (SARmn)
EPS(SAR)
P/E (X) P/Bv (X) D/Y (%)
Al-Tayyar 208 1.4 236 1.6 13.50% 17.55 6.93 1٫61Tourism Enterprise Co. 0.5 0.07 0.6 0.05 4.70% 95.85 4.99 -Abdulmohsen Alhokair 60.9 1.1 50.2 0.91 -17.60% 19.54 5.3 1٫62
Saudi Hotels & Resort 37.2 0.37 -25.4 -0.25 -168.40% 30.54 1.8 -Total 306.6 1.25 261.3 1.34 -14.80% 18٫4 5٫75 1٫53
Source: Tadawul, Bloomberg, AlJazira Capital*YTD data not available
Hotel & Tourism Sector
0%
20%
S H AR AC O Al -T ayyar Al -H ok ai r T our i s m E n t p
H otel & T ou ris m Sector
7,000
11,000
15,000
19,000
23,000
27,000
Feb-
13
May
-13
Aug-
13
Nov
-13
Feb-
14
May
-14
Aug-
14
Nov
-14
% YTD 2014 Hotel & Tourism Sector
10٫5% YTD
Saudi Arabia’s Energy & Utilities sector reported net loss of SAR 1,765mn during 4Q2014 vis-à-vis SAR 659mn in the corresponding quarter of the previous year, a 168% YoY decline. SEC’s weak performance (down 172% YoY) led to the fall in growth. The weighted-average EPS was SAR -0.31 per share.
Dividend yield for SEC was 3٫9%, while that for National Gas was high at 5٫5%.
Loss increased for SEC in 4Q2014 due to the implementation of the convention on the use of the transport system, and high consumption.
Company Name
4Q2013 4Q2014YoY
Change%
4Q2014
Net Profit (SARmn)
EPS(SAR)
Net Profit (SARmn)
EPS(SAR)
P/E (X)
P/Bv (X)
D/Y (%)
National Gas 2.6 0.03 36.5 0.49 1312.00% 16.02 2.4 5٫5Saudi Electricity -661.3 -0.16 -1,801.80 -0.43 -172.50% 20٫49 1.08 3٫9
Total -658.7 -0.14 -1,765.30 -0.31 -168.00% 19٫65 1٫31 4٫89
Source: Tadawul website, AlJazira Capital
Energy & Utilities Sector
E n erg y & U til ity Sector
4,400 4,8 00 5,200 5,600 6,000 6,400 6,8 00 7,200
Feb-
13
May
-13
Aug-
13
Nov
-13
Feb-
14
May
-14
Aug-
14
Nov
-14
0% 1% 1% 2% 2% 3% 3% 4% 4%
G AS C O S aud i E l ec t r i c i t y
% YTD 2014 Energy & Utilities Sector
1.8% YTD

14 © All rights reserved
Please read Disclaimer on the back
February 2015 R es u l ts Su m m ary of L is ted C om p an iesin th e Sau di Mark et4Q2014
Saudi Arabia’s Industrial Investment sector earnings rose 152% YoY in 4Q2014 after falling 58% YoY in 4Q2013. The net profit surged to SAR 595mn in
4Q2014 from SAR 236mn in 4Q2013. The weighted-average EPS for the quarter was SAR 0.39 per share.
Even as 8 of the 14 companies posted YoY decline in net profit, the overall sector witnessed robust YoY growth, primarily led by strong performance
from heavyweights Saudi Arabian Mining Company (Maaden) (up 1,387%) and Saudi Pharma Industry (up 60%).
Al Sorayai Trading posted the highest YoY decline of 1,868%, followed by National Metal Manufacturing and Saudi Industrial Export with 355% YoY and
82% YoY decline, respectively; this was followed by other companies.
Alabdullatif has the highest dividend yield in the sector at 5٫4%.
YoY fluctuations in net profits for some companies in the sector were due to the following:
h Saudi Arabian Mining: 1) Higher sales growth due to rise in prices and quantities of all products, except gold, and 2) increase in other income
and decrease in general & administrative.
h Saudi Chemical: Net profit growth declined, primarily led by decrease in sales.
h Saudi Paper: Lower revenues due to decrease in the sales of paper rolls. However, the decline was offset by an increase in investment income
and fall in provision expenses to some extent. .
h Al Sorayai Trading: Decrease in sales prices and increase in the cost of production & provision of slow moving items as well as unrealized losses
from share investment portfolio during the quarter.
Company Name
4Q2013 4Q2014
YoY Change%
4Q2014
Net Profit (SARmn)
EPS(SAR)
Net Profit (SARmn)
EPS(SAR)
P/E (X) P/Bv (X) D/Y(%)
Saudi Arabian Mining -29.2 -0.03 376 0.3 - 26.4 1.57 -Al Hassan Ghazi -31 -0.89 8.5 0.24 - 5.95 2.45 3.5Basic Chemical Indus 3.7 0.13 6.5 0.24 75.10% 42.34 2.17 2.7Zoujaj 9.8 0.33 15.7 0.52 60.30% 18.25 1.81 4.6Saudi Pharma Indust. 57 0.48 91.3 0.76 60.10% 15.42 1.45 1.6Takween Adv Indus -1.5 -0.04 -0.8 -0.02 48.40% 29.4 3.35 1.1Saudi Chemical Co 74.8 1.18 66.5 1.05 -11.10% 12.2 2.24 3٫0Filing & Packing Mfg 6.2 0.54 5.5 0.48 -11.30% 24.99 3.37 1.9ALABDULLATIF 62.7 0.77 30.3 0.37 -51.60% 14.14 2.28 5٫4Saudi Paper Mfg Co. 7.2 0.16 3.2 0.07 -56.20% 45.3 1.69 -Astra Industrial Group 72.3 0.98 25.7 0.3 -64.40% 23.3 1.38 -Saudi Indus Export 0.3 0.03 0.1 0.01 -82.40% 199.08 4.01 1.1National Metal Mfg 1.7 0.06 -4.4 -0.16 - 47.67 2.51 1.4Al Sorayai Trading 1.7 0.04 -29.5 -0.79 - - 1.23 3Total 235.8 0.22 594.6 0.39 152.20% 21٫21 1٫89 2٫04
Source: Tadawul website, AlJazira Capital
Industrial Investment Sector
I n du s trial I n v es tm en t Sector
5,000 5,600 6,200 6,8 00 7,400 8 ,000 8 ,600 9,200 9,8 00
Feb-
13
May
-13
Aug-
13
Nov
-13
Feb-
14
May
-14
Aug-
14
Nov
-14
-40%
-20%
0%
20%
40%
60%
Astra
Indu
stria
l
AlSo
raya
i
AlAb
dulla
tif
SPIM
ACO
Maa
den
FIPC
O
Saud
i Che
mic
al
Basi
c C
hem
ical
Saud
i Pap
er
Shak
er
SIEC
O
Takw
een
Zouj
aj
Maa
dani
yah
% YTD 2014 Industrial Investment Sector
10% YTD

15 © All rights reserved
Please read Disclaimer on the back
February 2015 R es u l ts Su m m ary of L is ted C om p an iesin th e Sau di Mark et4Q2014
Net profit for Saudi Arabia’s Building & Construction sector stood at SAR 15mn in 4Q2014 compared to a profit of SAR 360.3mn in 4Q2013. The
weighted-average EPS for the quarter was SAR 0.51 per share.
Twelve of 17 companies reported a YoY decline in net profit, with Mohammad AL Among posting the highest loss in the sector at SAR 256mn in 4Q2014,
a 1,324% YoY fall. This was followed by Saudi Industrial Development and MESC posting 553% and 397% YoY decrease to SAR -32mn and SAR -6mn,
respectively, during 4Q2014.
Shares of Al-Babtain is among the best performers in terms of YTD gains, at 24%. Saudi vitrified clay topped the sector in terms of dividend yield, with
5.1% return.
Following factors led to YoY fluctuations in net profits for some companies in the sector:
h Mohammad Al Mojil Group: Key reasons for YoY decline – 1) cost of revenue exceeded the contract revenue by SAR 111.1mn in 4Q2014, while
contract revenue exceeded the cost of revenue by SAR18mn in 4Q2013, 2) shortage of cash resulted in lower resource and productivity vis-á-vis
4Q2013, and 3) provisions against contract costs at SAR 88mn in 4Q2014 vis-á-vis provision reversal of SAR 1.8mn in 4Q2013.
h National Gypsum: Strong profit growth of 1,373% YoY was primarily led by increase in sales.
h Saudi Ceramic: Lower profit due to increase in selling & marketing expenses, general & administrative expenses, and Zakat provision.
h Zamil: Improvement in sales and operating Income in air-conditioners sector. No adverse currency impact of the Indian rupee and Egyptian
pound compared to that during the same period last year.
Company Name
4Q2013 4Q2014
YoY Change%
4Q2014
Net Profit (SARmn)
EPS(SAR)
Net Profit (SARmn)
EPS(SAR)
P/E (X) P/Bv (X)
D/Y (%)
National Gypsum Co 0.2 0 2.3 0.1 1372.70% 40.88 1.79 3Abdullah AM Al-Khod. 8.5 0.2 45.6 0.9 438.70% 16.25 1.86 1.6AL-BABTAIN 19.8 0.5 30.4 0.7 53.70% 13.57 2.06 3Saudi Cable Co. -73.9 -1 -61.5 -0.8 16.80% - 1.74 -Zamil Industrial 60.1 1 64.9 1.1 8.00% 12.65 1.89 3.7Saudi vitrified clay 24.5 1.6 24 1.6 -2.00% 13.86 5.52 5.1Bawan Company 38.9 0.8 37.2 0.7 -4.30% 14.89 3.45 1Electric Industries Co 66.1 0.9 59 0.8 -10.80% 15.83 4.78 1.7Saudi Ceramic Co. 73.3 2 59.8 1.6 -18.30% 12.57 2.27 1.9Red Sea Hsg Services 43.5 0.7 29.3 0.5 -32.70% 15.48 2.5 2.5Saudi Arabian Amiantit 34 0.3 19.9 0.2 -41.50% 18.32 1.07 -United Wire Factories 24.7 0.6 12.9 0.3 -47.80% 17.49 3.15 3٫4Saudi Steel Pipe Co 11.8 0.2 5.3 0.1 -55.20% 42.32 1.67 -Arabian Pipes Co 37.9 0.9 -20.3 -0.5 - - 1.16 -MESC 1.9 0 -5.7 -0.1 - - 2.85 -Saudi Industrial Dev 7 0.2 -31.8 -0.8 - 90.16 1.51 -Mohammad Al Mojil* -18 -0.1 -256.4 -2.1 -1324.40% - - -Total 360.3 0.73 15 0.51 -95.80% 43٫09 2٫52 3٫1
Source: Tadawul, Bloomberg, AlJazira Capital *Suspended from Trading
Building & Construction Sector
B & C Sector
2,750
3,150
3,550
3,950
4,350
4,750
5,150
Feb-
13
May
-13
Aug-
13
Nov
-13
Feb-
14
May
-14
Aug-
14
Nov
-14
-20%
0%
20%
40%
Saud
i Cer
amic
Al
Moj
il Al
-Kho
dari
Pipe
s Vi
tri e
d cla
y pip
es
Amia
ntit
ASLA
K M
ESC
Saud
i Cab
le
EIC
Saud
i Ste
el P
ipe
Bawa
n Re
d Se
a
SIDC
G
ypsu
m
Zam
il AL
-BAB
TAIN
% YTD 2014 Building & Construction Sector
5.7% YTD

16 © All rights reserved
Please read Disclaimer on the back
February 2015 R es u l ts Su m m ary of L is ted C om p an iesin th e Sau di Mark et4Q2014
Net earnings of Saudi Arabia’s Transport sector stood at SAR 200mn during 4Q2014
compared to SAR 434mn in 4Q2013, a 54% YoY decline. The weighted-average EPS was
SAR 0.44 per share.
Earnings grew for two of four companies in the sector, with BUDGET and Saudi Public
Transport rising 19% and 1% YoY, respectively.
Mubarred lost SAR 3mn in 4Q2014 from a profit of SAR81mn in 4Q2013, the highest YoY
decline of 104% in the sector. Bahri Company followed, with a 56% YoY decline to SAR 124mn
in 4Q2014 from SAR 280mn in 4Q2013.
Saudi Public Transport shares ranked first in terms of dividend yield at 2.9%.
Company Name
4Q2013 4Q2014YoY
Change%
4Q2014
Net Profit (SARmn)
EPS(SAR)
Net Profit (SARmn)
EPS(SAR)
P/E (X) P/Bv (X) D/Y (%)
BUDGET 37.5 0.92 44.7 1.1 19.10% 18.35 4 2.2Saudi Public Transport 34.4 0.28 34.7 0.28 1.00% 31.29 2.15 2.9Bahri 280.3 0.89 123.5 0.36 -56.00% 23.22 1.94 2.6Mubarred 81.4 4.52 -3.1 -0.17 - 16.33 2.92 1.3Total 433.6 0.98 199.8 0.44 -53.90% 23.77 2.27 2.64
Source: Tadawul website, AlJazira Capital،
Transport Sector
0%
15%
30%
S AP T C O B ud get S aud i B ah r i Mubar r ad
% YTD 2014 Transport Sector
T ran s p ort Sector
4,000 5,100 6,200 7,300 8 ,400 9,500
10,600
Feb-
13
May
-13
Aug-
13
Nov-
13
Feb-
14
May
-14
Aug-
14
Nov-
14
10% YTD
Net earnings of Saudi Arabia’s Multi-investment sector grew 6.5% to SAR 311mn during
4Q2014 from SAR 292mn in 4Q2013. The weighted-average EPS stood at SAR 0.1 per share
for 4Q2014.
Profits grew for four of seven companies in the sector. Sector heavyweights Aseer Trading and
Kingdom Holding Company reported -10% and 15% YoY growth in earnings, respectively.
Saudi Arabia Refineries Company posted the highest YoY earnings growth of 321%.
Aseer has the highest dividend yield in the sector at 3.8%.
Company Name
4Q2013 4Q2014
YoY Change%
4Q2014
Net Profit (SARmn)
EPS(SAR)
Net Profit (SARmn)
EPS(SAR)
P/E (X) P/Bv (X) D/Y (%)
Saudi Arabia Ref -0.8 -0.05 1.8 0.11 - 36.21 1.97 -Al-Baha Invest & Dev -6.1 -0.41 -0.9 -0.06 85.60% - 42.78 -Saudi Indus Services 11.8 0.17 18.5 0.27 56.90% 17.84 1.28 2.9Kingdom Holding Co 231.2 0.06 266 0.07 15.00% 78.17 2.07 2.8Aseer Trading, Mfg 40.3 0.32 36.2 0.29 -10.00% 17.61 1.26 3.8Saudi Adv Indus Co. 4.6 0.11 2.3 0.05 -49.40% 59.93 1.15 2.4Al-Ahsa Development 10.7 0.22 -13.2 -0.27 - - 1.58 -Total 291.6 0.12 310.7 0.1 6.50% 47.66 1.77 2.30
Source: Tadawul, Bloomberg, AlJazira Capital
Multi-Investment Sector
Mul t i -i n ves t m en t S ec t or
3,000
3,500
4,000
4,500
5,000
5,500
Feb-
13
May
-13
Aug-
13
Nov
-13
Feb-
14
May
-14
Aug-
14
Nov
-14
-5% 0% 5%
10% 15% 20% 25% 30% 35%
King
dom
Holdi
ng
Al-B
aha
SAIC
Asee
r
Al-A
hsa
SISC
O
SARC
O
% YTD 2014 Multi-Investment Sector
6.5% YTD

17 © All rights reserved
Please read Disclaimer on the back
February 2015 R es u l ts Su m m ary of L is ted C om p an iesin th e Sau di Mark et4Q2014
Net profit for Saudi Arabia’s Real Estate Development sector increased 24.4% YoY to SAR 825.5mn in 4Q2014 from SAR 663.9mn in 4Q2013. Weighted-
average EPS for the quarter was SAR 0.39 per share.
Taiba Holding Co. posted the highest net earnings growth of 332% YoY in 4Q2014, with a profit of SAR 278mn compared to SAR 64mn in the corresponding
period the last year.
While all companies contributed to the profitability of the sector, Knowledge Eco City posted net loss of SAR -58mn in 4Q2014 as against net profit of
SAR 9mn in 4Q2013, a 740.1% YoY decline. Other companies which registered YoY decline in net profit include Dar Alarkan Real Estate Development
(down 26% YoY) and Emaar The Economic City (down 73% YoY). After Taiba, Saudi Real Estate’s net profit grew an impressive 126.5% YoY to SAR 132mn
in 4Q2014 from SAR 58mn in 4Q2013.
Shares of Emaar Economic City are among the best performers in terms of YTD gains, posting 21% increase. Arriyadh had the highest dividend yield
among its peers in the sector, with 4.4% return.
YoY fluctuations in net profits for some companies in the sector was due to the following:
h Knowledge Economic City: Net loss due to 1) settlement infrastructure costs recorded as assets under construction during the development
period and in conjunction with the sale and delivery of villas built at Dar Aljjwar phase-1, and 2) the need for maintenance and management of
Dar Aljjwar phase-1.
h Saudi Real Estate: Higher profits due to SAR 68.3mn profit from land sale and revenues from investee companies during the quarter.
h Emaar: Net profit fell in 4Q2014 due to decrease in the sales of residential and industrial land.
Company Name
4Q2012 4Q2014
YoY Change%
4Q2014
Net Profit (SARmn)
EPS(SAR)
Net Profit (SARmn)
EPS(SAR)
P/E (X) P/Bv (X) D/Y(%)
Taiba Holding Co. 64.5 0.4 278.4 1.9 331.80% 5.04 1.53 3.7Saudi Real Estate Co. 58.4 0.5 132.2 1.1 126.50% 16.28 1.31 2.7Arriyadh Development 45.3 0.3 53.4 0.4 17.90% 15.54 1.75 4.4Makkah Const & Dev 78 0.5 85 0.5 9.00% 41.06 2.24 3.1Dar Alarkan RE Dev 156.8 0.1 115.6 0.1 -26.30% 17.81 0.57 -Emaar The Eco City 254.3 0.3 69.1 0.1 -72.80% - 1.49 -Knowledge Eco City 9.1 0 -58 -0.2 - - 2.01 -Jabal Omar Dev Co * -2.53 0 149.8 0.16 - 116.03 5.26 -Total 663.9 0.17 825.5 0.39 24.4% 30.51 1.87 1.28
Source: Tadawul, Bloomberg, AlJazira Capital
*Q1-1436 A.H
Real Estate Development Sector
0%
15%
30%
Taib
a
Jaba
l Om
ar
Mak
kah
Con
stru
ctio
n
Arriy
adh
KEC
SREC
O
Dar
Al A
rkan
Emaa
r EC
% YTD 2014 Real Estate Development Sector
R eal E s tate
3,250
4,050
4,8 50
5,650
6,450
7,250
8 ,050
Feb-
13
May
-13
Aug-
13
Nov-
13
Feb-
14
May
-14
Aug-
14
Nov-
14
5٫7% YTD

18 © All rights reserved
Please read Disclaimer on the back
February 2015 R es u l ts Su m m ary of L is ted C om p an iesin th e Sau di Mark et4Q2014
Saudi Arabia’s Media & Publishing sector reported net loss of SAR 39٫5mn for 4Q2014
compared to loss of SAR 55.3mn in 4Q2013.
Weighted-average EPS for the quarter remained in the red (negative SAR 0.7), primarily led by Tihama Advertising, which posted negative EPS at SAR -1.6.
Tihama Advertising and Public Relations net loss was mainly led by increase in provision for
doubtful debts of SAR 6mn compared to the corresponding quarter the last year. Moreover,
SAR 4.5mn decrease in the share of associates, along with an SAR 1.5mn rise in finance
charges led by higher debts, contributed to overall losses.
While Saudi Research and Marketing Group posted net loss of SAR 19.9mn at the end of
4Q2014, it improved 54.3% YoY and registered an EPS of SAR -0.2 during 4Q2014.
Saudi Research has the lowest P/B ratio at 1.25x, followed by Saudi Printing at 1.34x and
Tihama Advertising at 8.25x.
Company Name
4Q2013 4Q2014
YoY Change%
4Q2014
Net Profit (SARmn)
EPS(SAR)
Net Profit (SARmn)
EPS(SAR)
P/E (X) P/Bv (X) D/Y (%)
Saudi Research -43.6 -0.5 -19.9 -0.2 54.30% - 1.25 -Saudi Printing 3.6 0.1 4.8 0.1 33.70% 30.95 1.34 -Tihama Advertising -15.3 -1 -24.4 -1.6 -59.80% - 8.25 -Total -55.3 -0.6 -39٫5 -0.7 28٫5% 17.93 2٫1 0
Source: Tadawul, Bloomberg, AlJazira Capital
Media and Publishing Sector
0% 1% 2% 3% 4% 5% 6% 7% 8 %
TAPR
CO
SRM
G
SPPC
% YTD 2014 Media and Publishing Sector
4٫5% YTD
Media Sector
1,750 2,350 2,950 3,550 4,150 4,750 5,350 5,950 6,550
Feb-
13
May
-13
Aug-
13
Nov
-13
Feb-
14
May
-14
Aug-
14
Nov
-14

Monthly TASI Movement in 5 Years
Please read Disclaimer on the back
February 2015 R es u l ts Su m m ary of L is ted C om p an iesin th e Sau di Mark et4Q2014
Asset Management | Brokerage | Corporate Finance | Custody | Advisory
Head Office: King Fahad Road, P.O. Box: 20438, Riyadh 11455, Saudi Arabia، Tel: 01 2256000 - Fax: 01 2256068
Aljazira Capital is a Saudi Investment Company licensed by the Capital Market Authority (CMA), license No. 07076-37
RESE
ARC
H D
IVIS
ION
RESE
ARC
H
DIV
ISIO
NRA
TIN
GTE
RMIN
OLO
GY
BRO
KERA
GE A
ND IN
VEST
MEN
T CE
NTER
S DI
VISI
ON
Disclaimer
AlJazira Capital, the investment arm of Bank AlJazira, is a Shariaa Compliant Saudi Closed Joint Stock company and operating under the regulatory supervision of the Capital Market Authority. AlJazira Capital is licensed to conduct securities business in all securities business as authorized by CMA, including dealing, managing, arranging, advisory, and custody. AlJazira Capital is the continuation of a long success story in the Saudi Tadawul market, having occupied the market leadership position for several years. With an objective to maintain its market leadership position, AlJazira Capital is expanding its brokerage capabilities to o�er further value-added services, brokerage across MENA and International markets, as well as o�ering a full suite of securities business.
1. Overweight: This rating implies that the stock is currently trading at a discount to its 12 months price target. Stocks rated “Overweight” will typically provide an upside potential of over 10% from the current price levels over next twelve months.
2. Underweight: This rating implies that the stock is currently trading at a premium to its 12 months price target. Stocks rated “Underweight” would typically decline by over 10% from the current price levels over next twelve months.
3. Neutral: The rating implies that the stock is trading in the proximate range of its 12 months price target. Stocks rated “Neutral” is expected to stagnate within +/- 10% range from the current price levels over next twelve months.
4. Suspension of rating or rating on hold (SR/RH): This basically implies suspension of a rating pending further analysis of a material change in the fundamentals of the company.
The purpose of producing this report is to present a general view on the company/economic sector/economic subject under research, and not to recommend a buy/sell/hold for any security or any other assets. Based on that, this report does not take into consideration the specific financial position of every investor and/or his/her risk appetite in relation to investing in the security or any other assets, and hence, may not be suitable for all clients depending on their financial position and their ability and willingness to undertake risks. It is advised that every potential investor seek professional advice from several sources concerning investment decision and should study the impact of such decisions on his/her financial/legal/tax position and other concerns before getting into such investments or liquidate them partially or fully. The market of stocks, bonds, macroeconomic or microeconomic variables are of a volatile nature and could witness sudden changes without any prior warning, therefore, the investor in securities or other assets might face some unexpected risks and fluctuations. All the information, views and expectations and fair values or target prices contained in this report have been compiled or arrived at by Aljazira Capital from sources believed to be reliable, but Aljazira Capital has not independently verified the contents obtained from these sources and such information may be condensed or incomplete. Accordingly, no representation or warranty, express or implied, is made as to, and no reliance should be placed on the fairness, accuracy, completeness or correctness of the information and opinions contained in this report. Aljazira Capital shall not be liable for any loss as that may arise from the use of this report or its contents or otherwise arising in connection therewith. The past performance of any investment is not an indicator of future performance. Any financial projections, fair value estimates or price targets and statements regarding future prospects contained in this document may not be realized. The value of the security or any other assets or the return from them might increase or decrease. Any change in currency rates may have a positive or negative impact on the value/return on the stock or securities mentioned in the report. The investor might get an amount less than the amount invested in some cases. Some stocks or securities maybe, by nature, of low volume/trades or may become like that unexpectedly in special circumstances and this might increase the risk on the investor. Some fees might be levied on some investments in securities. This report has been written by professional employees in Aljazira Capital, and they undertake that neither them, nor their wives or children hold positions directly in any listed shares or securities contained in this report during the time of publication of this report, however, The authors and/or their wives/children of this document may own securities in funds open to the public that invest in the securities mentioned in this document as part of a diversified portfolio over which they have no discretion. This report has been produced independently and separately by the Research Division at Aljazira Capital and no party (in-house or outside) who might have interest whether direct or indirect have seen the contents of this report before its publishing, except for those whom corporate positions allow them to do so, and/or third-party persons/institutions who signed a non-disclosure agreement with Aljazira Capital. Funds managed by Aljazira Capital and its subsidiaries for third parties may own the securities that are the subject of this document. Aljazira Capital or its subsidiaries may own securities in one or more of the aforementioned companies, and/or indirectly through funds managed by third parties. The Investment Banking division of Aljazira Capital maybe in the process of soliciting or executing fee earning mandates for companies that is either the subject of this document or is mentioned in this document. One or more of Aljazira Capital board members or executive managers could be also a board member or member of the executive management at the company or companies mentioned in this report, or their associated companies. No part of this report may be reproduced whether inside or outside the Kingdom of Saudi Arabia without the written permission of Aljazira Capital. Persons who receive this report should make themselves aware, of and adhere to, any such restrictions. By accepting this report, the recipient agrees to be bound by the foregoing limitations.
AGM - Head of ResearchAbdullah Alawi+966 11 [email protected]
Senior Analyst Syed Taimure Akhtar +966 11 2256146 [email protected]
Senior Analyst
Talha Nazar +966 11 [email protected]
AnalystSultan Al Kadi+966 11 [email protected]
Analyst
Jassim Al-Jubran +966 11 [email protected]
General manager - brokerage services and sales
Ala’a Al-Yousef+966 11 [email protected]
AGM-Head of international and institutional
brokerage
Luay Jawad Al-Motawa +966 11 [email protected]
AGM- Head of Western and Southern Region Investment Centers & ADC
Brokerage
Abdullah Q. Al-Misbani +966 12 6618400 [email protected]
AGM-Head of Sales And Investment Centers
Central Region
Sultan Ibrahim AL-Mutawa +966 11 [email protected]
AGM-Head of Qassim & Eastern Province
Abdullah Al-Rahit +966 16 3617547 [email protected]
AGM - Head of Institutional Brokerage
Samer Al- Joauni +966 1 225 6352 [email protected]