r esumes - eric - education resources information … 0.1. t\i re\ i-1 0 a comparison or students...
TRANSCRIPT

R E F O R T T R ESUMESED 013 246 SP 001 287;% COMPARISON OF STUDENTS SCORING ABOVE THE EIGHTIETHPERCENTILE OR DELOW THE TWENTIETH PERCENTILE ON EITHER THESCHOOL AND COLLEGE ABILITY TEST OR THE WATSON- GLASER TEST OFCRITICAL THINKING.BY- CURRY, JOHNNORTH TEXAS STATE UNIV., DENTON
PUB DATE OCT 67EDRS PRICE MF--$0.25 HC-$1.00 25P.
*DESCRIPTORS-- *ACADEMIC ACHIEVEMENT, ADMISSION CRITERIA,EDUCATION MAJORS, GRADES (SCHOLASTIC), MATHEMATICS,*PREDICTIVE ABILITY (TESTING), *PREDICTIVE MEASUREMENT,*PREDICTIVE VALIDITY, SEX DIFFERENCES, TEACHER EDUCATION,TRANSFER STUDENTS, WATSON GLASER TEST OF CRITICAL THINKING,.SCHOOL AND COLLEGE ABILITY TEST
IN ORDER TO ESTABLISH THE FEASIBILITY OF A CUT -OFF SCOREFOR ENTRANCE INTO TEACHER EDUCATION PROGRAMS AT NORTH TEXASSTATE UNIVERSITY, SCORES OF 1,346 STUDENTS WHO EITHER PLACEDABOVE THE BOTH PERCENTILE (N-672) OR BELOW THE 20THPERCENTILE (N -674) ON EITHER THE SCHOOL AND COLLEGE ABILITYTEST OR THE WATSON- GLASER TEST OF CRITICAL THINKING WERECOMPARED WITH THEIR ACADEMIC RECORDS. PARTICULAR EMPHASIS WAS
'PLACED ON THE SCORES OF THE 164 TEACHER EDUCATION MAJORS WHOWERE INCLUDED IN THE STUDY. IT WAS FOUND THAT (A) MATHEMATICSMAJORS PERFORMED BEST ON THE TESTS---58.62 PERCENT SCORINGABOVE THE BOTH PERCENTILE AND ONLY 1.72 PERCENT BELOW THE20TH,. (B) FEMALES SCORED BELOW MALES BUT MADE HIGHER GRADESIN EDUCATION AND HAD HIGHER OVERALL ACADEMIC AVERAGES, (C)ELEMENTARY EDUCATION STUDENTS MADE LOWER SCORES ON THE TWOTESTS THAN DID SECONDARY EDUCATION STUDENTS BUT EARNED HIGHERGRADES IN EDUCATION COURSES AND HAD HIGHER OVERALL ACADEMICAVERAGES, (D) JUNIOR COLLEGE TRANSFEREES SCORED BELOWSTUDENTS WHO TOOK ALL THEIR WORK AT NORTH TEXAS STATE ANDALSO HAD LOWER GRADES AND LOWER OVERALL ACADEMIC AVERAGES,(E) THERE WAS LITTLE RELATIONSHIP BETWEEN THE SCORES MADE ONTHE TESTS AND GRADES MADE IN THE STUDENT'S MAJOR. IT ISCONCLUDED THAT THE 20TH PERCENTILE ON EITHER TEST SHOULD NOTBE USED AS A CUT -OFF POINT SINCE THE GRADE POINT AVERAGE OFTHOSE WHO SCORED BELOW THIS FIGURE ON THE SCAT WAS 1.66 AND1.67 ON THE WATSON- GLASER. (AW)

01287
0.1.t\Ire\I-1
A COMPARISON Or STUDENTS SCORING ABOVE lige0 EIGHTIETH PERCENTILE OR. BELOW THE DIENTrETHCI PERCENTILE ON EITHER THE SCHOOL ANDLLJ COLLEGE ABILITY TEST OR Mil;
WATSON-GIASER TESTOF CRITICAL THINKING
By
John Curry
North Texas State University
Denton, Texas
October, 1967a -
U.S. DEPARTMENT OF HEALTH, EDUCATION & WELFARE
OFFICE OF EDUCATION
THIS DOCUMENT HAS BEEN REPRODUCED EXACTLY AS RECEIVED FROM THE
PERSON OR ORGANIZATION ORIGINATING IT. POINTS. OF VIEW OR OPINIONS
STATED DO NOT NECESSARILY REPRESENT OFFICIAL OFFICE OF EDUCATION
POSITION OR POLICY.
OCT 1 3 IV

A COMPARISON OF STUDENTS SCORING ABOVE THE EIGHTIETH PERCENTILE ORBELOW THE TWENTIETH PERCENTILE ON EITHER THE SCHOOL AND COLLEGEABILITY TEST OR THE WATSON- GLASER TEST OF CRITICAL TIMING
When the formal program of Rani ssion to the teacher education program
was initiated at North Texas State University in 1963, one phase of the
admission procedure was the administration of a battery of tests. The
tests chosen were the SCAT and the Watsone=Glaser plus a personality test
which has been changed from time to time. The two tests have been admin_
istered to approximately 4,000 students during the past four years.
In September, 1967, a check was made of the records maintained in
the admissions office to locate all students who had scored above the
80th percentile on either test or below the 20th percentile on either test.
After locating the names and scores made by these subjects, the students'
records in the Registrarb Office were obtained to gather additional data.
Any students whose records were not complete were eliminated from the
study. There were 428 students who were thus not used in the analysis
of the data. Some of these were accounted for in that they had probably
married and could not be located. Others had dropped out of school before
completing an additional term. In several instances, it was impossible
to include a student because he had not taken additional work in his teach-
ing field. There were 122 students who were below the 20th percentile on
the "atson-Glaser who could not be included. Fifty-one were above the 80th
percentile but excluded. On the SCAT there were 108 above the 80th
percentile and 78 below the 20th percentile who were not included.
A tabulation was made by areas of those who scored. above the 80th
percentile or below the 20th percentile on the SCAT. These data are presented.
in Table I.1

2
TABLE I
NUMBER AND PERCENT OF STUDENTS SCORING ABOVE THE 80TH PERCENTILE OR
BELOW THE 2CTH PERCENTILE ON THE SCAT
Below 20th
Total Wm:00er
Above 80th
Elementary MajorsSocial StudiesPhysical EducationIndustrial ArtsSpeech-DramaHome Economics.EnglishScienceForeign Language
MusicBusinessMathematicsArtNorth Texas StudentsTransfer-Sr. CollegeTransfer-Jr. College
421183114634o
591963643
11581
5854
767
375339
-4
11523
39198
1525
.21101/16
139
55
95
27.33.12.5634.2130.1520.0018.647.65
5.5511.6218.2612.341.72
29.6218.1214.6620.02
49 11.636o 32.785 4.38
7 11.117 17.506 lo.16
8o 4o.81
19 52.7714 32.5532 27.8217 20.98
34 58.62
5 9.25186 24.2589 23.7362 18.28
tom
An examination of Table I will show that of the 421 elementary majors
included in this study, 27.31 per cent were below the 20th percentile and
11.63 per cent were above the 80th percentile on the SCAT. The vast majority
were naturally between the 80th and the 20th. The norms used were national,
and it seems fairly apparent that many more than 49 should have been above
the 80th percentile out of many hundreds who have taken the tests.
Of the subject areas covered in this study, mathematics majors had
the largest percentage (58.62) in the top 20 per cent. Only one mathematics
major was in the bottom 20 per cent. Science was close behind. with 52.77
per cent above 80th and 5.55 per cent below the 20th.

3
The area with the smallest per cent above the 80th was physical
education with 4.38 per cent. There had been only five physical education
majors who had been in the top twenty per cent. Art, home economics, and
industrial arts were the other areas with a small per cent above the
80tb. percentile. One would expect approximately 20 per cent to fall at
either end of the scale.
A similar tabulation was made for students who had attended North
Texas since their college enrollment, those who bad transferred from
senior colleges and those transferring from junior colleges. A study of
Table I will show that 28.02 per cent of the students who had transferred
from a junior college and who were included in this study were below the
20th percentile in the SCAT while 18.28 per cent were above the 80th
percentile. ETSU students were slightly higher with 14.66 per cent in the
bottom one.fifth and 24.25 per cent in the top one-fifth. A slightly
smaller per cent of the transfers from senior colleges were below the 20th
(14.66) and also, fewer (23.73) were above the 80th. These data would
seem to indicate that junior college students score lower on the SCAT than
do transfer students from senior colleges or students who have been at
NTSU for all of their program.
A similar tabulation was made for the results on the Matson.GLaser.
The data are presented in Table II. From Table III it becomes apparent
that the students included in this study did not do as well as they did
on the SCAT. BO group had more than 30 per cent of its members above the
80th percentile. It might also appear that the subjects did better on

4
TABLE nNUMBER MID PERCENT OP STUDENTS SCORING ABOVE THE 8GTH PERCENTILE
OR BELOW THE 20TH PERCENTILE ON THE WATSON-GLASER
Total Below 20th
N
Above 80th
N
ElementarySocial StudiesPhysical EducationIndustrial ArtsSpeech-DramaHome-EconomicsEnglishScience
Foreign languageMusicBusiness
YathematicsArtNorth Texas StudentsTransfer-Sr. CollegeTransfer-Jr. College
42118313.4
634o59
3.963643
3.3.5
83.
5854
767375339
108 25.6542 22.9549 42.9826 43..267 17.50
19 32.2o3o 15.306 16.679 20.93
24 20.8616 19.758 13.79
14 25.92164 3.4.6o87 23.20
109 32.15
50 11.8733. 16.93
5 4.387 11.119 22.506 3.0.3.6
42 21.424 3.3:.3.14 9.3o
19 3.6.5215 18.5117 29.31
5 .2112 149.60
5
66 3.7.6o39 11.50.
skill tests situations such as are found. in the SCAT than they did withthe nthinkingnproblems of which the Watson.Glaser is compoied.
Junior college transfers did. not do as well on this test as did eithertransfers from senior colleges or students who had. been enrolled onlyat North Texas.
There were 563 students remaining in the study who were on theopposite ends of the scale in the SCAT. These data are presented in Table
--;44,v0.1444:-0,400°4''

5
TABLE III
MEANS, STANDARD DEVIATIONS, AND FISHER t FOR STUDENTSABOVE THE 8CTH PERCENTILE OR BELOW
THE 20TH PERCH LE ON THE SCAT
Above 80thN= 311
MiliN111111100,
Below 20thN = 252
VialerIm
a
Watson Glaser 77.34 7.00 63.08 8.67 21.55
Total Hours N.T. 44.94 17.49 41.73 15.97 2.59
Grade Points 96.45 43.93 70.44 33.31 7.75
G.P.A. .2.13 .51 1.66 .41 11.90
Hours 1st Field 35.00 16.29 31.98 16.53 2.16
Grade Points 75.61 45.24 53.71 34.96 6.30
G.P.A. 2.13 .56 1.63 .51 10.81
Hours Education 16.02 8.28 17.94 9.37 - 2.57
Grade Points 37.20 21.58 33.37 21.17 2.11
G.P.A. 2.27 .52 1.80 .76 8.79 _
A study of Table III will show that students who were below the 20th
percentile on the SCAT had significantly lower scores on the Watson... Glaser,
significantly lower grade point average on work taken at North Texas, signi.
ficantly lower grade point average in first teaching field and a significantly
lower average in education. The only area in which the differencewas in
favor of the lower group was in the number of hours taken in education.
The lower group had taken an average of 1.92 more hours of education than
had those above the 80th percentile.

6
While there was a highly significant difference in each instance, it
should be pointed out that the students who scored below the 20th percenttl.e
on .,14.e SCAT still maintained a G.P.A. of 1.66 on all work attempted, an
averege of 1.63 in the first teaching field and 1.80 in education. It seems
quite obvious that the 20th percentile cannot be used as a cut-off point
on the SCAT if academic grades are a criteria of success.
Data relative to those above the 80th percentile or below the 20th
percentile on the Watson.Glaser are presented in Table IV.
TABLE IV
MEANS, STANDARD DEVIATIONS, AND FISHER t FOR STUDENTS ABOVE
THE 80TH PERCENTILE OR BELOW THE afm PERCENTILE
ON THE WATSON-GIASER
Above 80th Below 20th
N = 119 N = 314
1111t .........4..1.,...M.P.0.../.00......m..,....10...
M a M o- t
SCAT 62.46 12.02 38.83 10.48 22.74
Total Hrs. NT 39.03 15.70 43.71 16.53 .3.07
Grade Points 83.41 40.62 74.47 35.11 2.56
GPA 2.11 .50 1.67 .44 10.19
Hours 1st Field 33.13 17.13 33.77 16.08 - .41
Grade Points 67.40 42.47 57.36 34.93 2.83
GPA 2.01 .57 1.66 .51 7.00
flours . Ethic. 14.91 8.83 17.03 9.16 .2.50
Grade Points 34.49 21.91 32.63 21.56 .91
2.29 .53 1.83 .73 7.29GPA

A study of Table IV will reveal that students who scored low on the
WatsonGlaser also scored low on the SCAT. The difference in means was
highly significant. Students below the 20th percentile had taken more
hours than those above the 80th percentile and had received grades which
were significantly lower. The low group had also taken more hours in their
first teaching field but received lower grades. The difference was
significant at better than .01. The same situation held for education
where the students below the 20th percentile had completed an average of
17.03 hours With a G.P.A. of 1.83 while those above the 80th percentile
had completed an average of 14.91 hours with a G.P.A. of 2.29. As with
the SCAT, students who scored below the 20th percentile still made quite
respectable grades. The 20th percentile could not be used as a cut..off
point on this test without eliminating students who can be successful.
Data relative to the performance of men and women is presented in
Table V.
TABLE V
MEANS, STANDARD DEVIATIONS, AND FISHER t
FOR MALE AND FEMALE STUDENTS
FemaleN 1045
NMINIMMOINIMIlmimMOIMMINNINgm.MMIMII=.
M o'
MaleN = 439
40"ftwaft.
.eaPwallalw.waftwastiwkb
SCAT 49.40 14.07 50.47 14.83 .1.32Watson Glaser 70.96 9.12 69.20 10.00 3.29Hours at NT 42.75 16.00 42.52 18.14 .24
Grade Points 84.29 38.71 75.74 41.01 3.81
G.P.A. 1.96 .48 1.74 .57 5.56
Hours 1st Field 30.99 15.13 39.72 16.76 -9.82Grade Points 58.65 37.85 73.99 41.36 -6.92G.P.A. 1.84 .58 1.83 .53 .49
Wars Education 17.18 9.38 14.98 7.77 4.31
Grade Points 37.18 22.42 28.72 18.43 6.97
G.P.A. 2.13 .51 1.84 .71 8.91
4tr

8
Several interesting items are apparent in Table V. The er±Ixt group
of students (1,48:0 were included. The heavy concentration of females was
probably caused. by the number of women in elementary education. On the
SCAT, the males scored slightly higher but the difference was not significant.
On the Watson Glaser, the females scored 1.76 points above the males, and
while this difference was not great it we significant at better than the
.01 level. Each group had completed slightly over 42 hours of work since
enrolling in their first education course. The females had made a grade
point average of 3..96 which was .22 above the mean for the males. On the
North Texas grading scale this represented approximately one..fourth of a
letter grade, and the difference was highly significant in favor of the
females.
When comparing hours completed and grade points in the first teaching
field, the males had completed more hours and gained more grade points.
The differences here were highly significant, but the grade point average
was almost identical for the two groups. The females had completed 17.18
hours in education while the males had completed 14.98. This difference
in favor of the females was significant at better than the .CI level. The
grade points and the grade point average was also in favor of the females
with the difference in average of .29 attaining significance beyond the
.001 level. One might conclude that the higher over,. all grade point average
of the females could in large measure be attributed to their having taken
more hours of education and attaining a high grade point average in this
field. Men, on the other hand, had almost the same g.p.a. in education
as in their first teaching field.

9
The group was then divided on the basis of elementary oi-secondary
level of preparation. The data arc presented in Table VI.
TABLE VI
MEANS, STANDARDDEVIATIONS, AND FISHER tFOR ELF ENTARY AND SECONDARY
PREPARATION LEVELS
REFIIMB
ElementaryN = 540
SecondaryN= 942
,IP.111111.1.0r0111.....e....
14 cr
SCAT 46.07 13.33 51.78 14.44 - 7.53
Watson4laser 69.77 9.30 70.80 9.48 - 2.04
Hours at N.T. 42.72 16.30 42.66 16.87 .07
Grade Points 83.81 38.80 80.58 39.99 1.51
G.P.A. 1.94 .45 1.87 .55 2.57
Lours in 1st Field 26.49 16.14 37.64 14.66 -13.56
Grade Points 47.93 39.25 71.95 37.01 .11.76
G.P.A. 1.73 .56 1.90 .56 - 5.44
Hours in Edue. 20.92 10.21 14.02 7.07 15.31
Grade Points " 76 24.94 28.91 17.03 14.47
G.P.A. 2.09 .48 2.02 .65 2.01
easomoormia
A study of Table VI reveals that the secondary group achieved a mean
score on the SCAT which was 5.71 points above the mean for the elementary
group. This difference was significant at better than the .01 level. The
difference of 1.03 on the Watson Glaser in favor of the secondary group

10
was significant at better than the .05 level. There was no significant
difference in the number of hours completed since enrollment in the first
education course, but the higher grade point average of .M7 in favor of
the elementary group was significant at just less than the .01 level.
Secondary majors had completed an average of 11.15 more hours in their
first teaching field and had attained a mean of 1.90 which was .17 more
than the elementary group. The difference was significant beyond the .01
level.
In education, the elementary group had completed a mean of 20.92 hours
which was 6.90 hours more than the secondary group. This difference was
significant beyond the .01 level. The elementary group had attained a
grade point average in education which. was .07 greater than the secondary'
group. This difference while small was significant at the X15 level.
These data would seem to indicate that the elementary group took more
hours of education and made considerably better grades in education than in
their area of specialization. Their over-all grade point average was also
better than in their area of specialization. One should point out that the
grade in the area of specialization would approach a "B" while in education
the grade would be slightly above: a "B". The secondary group also made
better grades in education than in the first teaching field which was
better than their over.. all average. The average grade of this secondary
group would be slightly less than a le.
One of the areas of concern was to know how the students who had
attended North Texas throughout their career would compare with transfer
students. Information comparing North Texas students with transfers from
Texas senior colleges is presented in Table VII.

TABLE VII
MEANS, STANDARD DEVIATIONS, AND FISHER t FOR =7: It TE - STUDENTSAND TRANSFERS FROM TEXAS SENIOR COLLEGES
North TexasN = 766
Transfer .. TSCN = 376
11
M a t
SCAT 50.33 14.02 51.64 14.35 ..1.47
Watson Glaser 70.90 8.75 71.33 9.84 .. .72
Hours at E.T. 44.29 16.65 40.65 16.35 3.49
Grade Points 86.21 40.24 78.28 37-98 3.20
G.P.A. 1.93 .54 1.91 .46 .68
Hours 1st field 33.97 16.07 32.87 15.73 1.09
Grade Points 64.80 39.89 60.80 38.16 1.60
G.P.A. 1.87 .58 1.80 .54 1.81
Hours in Educ. 16.89 8.91 26.58 9.14 .55
-..pae Points 35.93 21.57 35.02 22.11 .67
G.P.A. 2.09 .61 2.05 .52 1.23
A study of Table VII will show that students who transferred to North
Texas from other senior colleges in Texas achieve slightly higher scores
on both the SCAT and Watson Glaser than do student who have taken all their
work at North Texas. This difference in mean score was not significant oneither test. North Texas students made slightly high grade point averages
on all work, in the first teaching field and in education. These differences i
were small and were non..significant. Them data would seem to indicate

12
that students who transfer to North Texas from other senior colleges are
on a par with North Texas students on each measure studied.
Information comparing students who had transferred from Texas Junior
Colleges with students who had taken all of their work at North Texas is
presented in Table VIII.
TABLE VIII
MEANS, STANDARD DEVIATIONS, AND FISHER tFOR NORTH TEXAS STATE STUDENTS AND
TRANSFERS FROM TEXASJUNIOR COLLEGES
North TexasN = 766
Junior CoLle3eN = 340
cr t1111111.
SCAT 50.33 14.02 46.13 14.27 4.55
Watson Glaser 70.90 8.75 68.38 10.10 4.14
Hours at N.T. 44.29 16.65 41.36 16.59 2.71
Grade Points 86.21 40.24 75.78 38.63 4.07
G.P.A. 1.93 .54 1.80 .50 3.93
Hours 1st Field 33.97 16.07 33.51 16.67 .44
Grade Points 64.80 39.89 62.49 40.04 .90
G.P.A. 1.87 .58 1.83 .54 1.03
Hours.. Ethic. 16.89 8.91 15.65 8.91 2.12
Grade Points 35.93 21.57 31.48 21.00 3.17
G.P.A. 2.09 .61 1.95 .61 3.77
AL
MINIMMINI.P1111M110..1110.11111

13
An examination of Table VIII will show that students who have
attended North Texas throughout their college career made a mean
score on the SCAT which was points higher than that made by
transfers from junior colleges. This difference was significant at
better than the .01. level. The difference of 2.52 points on the
Watson Glaser in favor of the North Texas students was also significant
at better than the .01 level. These data would seem to indicate that
students vho started their college work at North Texas score signi..
ficantly higher on each of these measures than do students who transfer
from junior colleges.
When one examines the relative standings as measured by grade
point average it becomes obvious that North Texas students obtain a
hfghei. over ..s11 grade point average and a higher mean grade point
in education. In each case the differences were significant at
better than the .01. level. In the first teaching field the difference
was only .04 in favor of the North Texas students, but this difference
was not significant.
As with the SCAT and the Watson Glaser it would appear that
students who have transferred to North Texas made a significantly
lower grade point average in education and over. all than do students
who had attended North Texas for their entire program. Students who
had been at North Texas also made higher mean grades in their first
teaching field, but this difference was not significant.
Approximately one..half of the students involved in the study had
already completed their program so a campatison was made with those
currently enrolled. This information is presented in Table IX.

A study of the data in Table ix would show that students who have
completed. their program made a mean score on the MAT which was only
slightly higher than that made by those currently enrolled. Students
currently enrolled made a mean score which was 1.81 points above the
score made by those who have completed their program. This difference
was highly significant.
TABLE DC
MEANS, STANDARD DEVIATIONS, AND FISHER t FOR STUDENTS
WHO HAVE COMPLETED THE PROGRAM .AND
FOR THOSE CURRENTLY EZIROLLED
CompletedN = 624
Currently EnrolledN = 629
SIM
SCAT 50.43 14.74
Watson Glaser 69.60 9.00
Hours.N.T. 53.00 12.57
Grade Points 104.77 34.36
GP.A. 1.98 .45
Hours.lst field 36.40 16.59
Grade Points 68.74 41.86
G.P.A. 1.84 .55
Houra.Education 22.82 7.91
Grade Points 49.33 20.29
G.P.A. .2.15 .45
49.64 13.81 .97
71.41 9.26 -3.48
37.73 14.00 19.65
71.63 33.85 17.52
1.88 .48 3.8o
32.74 15.55 4.06
63.09 38.06 2.55
1.89 .57 -1.72
12.69 6.16 25.08
26.12 15.15 23.40
2.04 .67 3,26
Students who have completed their program made a mean over..all
grade point average which was .10 above that made by those currently
44,

enrolled. This difference while small was significant. It is interestingto note that students who were currently enrolled made a slightly higher
mean grade point in the first teaching field. This difference was not
significant. Those who had completed had a mean grade point in education
which was .11 greater than the mean of those currently enrolled. This
difference was significant at better than the .01 level.
It was felt that some comparison between subject areas wald be of
value. These data for elementary majors and majors in Social Studies,
Physical Education, and I.A. are printed in Table ?=.
TABLE X
MEANS, STANDARD DEVIATIONS, AND FISHER t COMPARING ELEMENTARY MAJORS;WITH SOCIAL STUDIES, PHYSICAL EDUCATION, AND INDUSTRIAL ARTS
Elementary Social Studies117--. 421 N = 1.83
P. E.N = 114
I. A.N = 63
M a_
SCAT 45.59
WatsonGlaser 69.65
Hours..N.T. 42.56
GradePoints 84.29
G.P.A. 1.95Hours 1stField 21.18
GradePoints 35.36
G.P.A. 1.66Hours..Edue. 22.19
GradePoints 47.91
G.P.A. 2.121
12.86
9.24
16.22
38.49
.46
6.77
17.35.55
10.14
24.76II
.4711
11
52.8(1 14.50
71.00 10.51.
42.48116.36
75.42 35.43
1.77 .50
32.61 12.57,..i
53.65 26.251.65 .58
14.921 7.48
30.38 17.16.
2.00 .53.
. 6.15
1.75
.05
2.55
4.16
12.03
-.7.29.15
10.10
10.06
2.29
41.5j
66.34
44.1d
77.3939.4911.7g
38.181
78.67'21.762.b8
13.23
23.77114.31
1.7a
10.32i.
8.43
18.07..
.44
8.49
.41
6.23
.5a
2.87
3.38
.93.
1.66
4.44
..3.5.01
.14.48
.. 7.42
10.44
11.61
6:58
I
44.7412.46
67.441I
38.2211.5.32
-9.44
1.771
' 7.56
5.242.02
6.00l
0*9.38
1.79
10.69
35.i2
.50
9.57
27.73
.46
5.95
13.56
.53
..50
1.80
1.93
2.8o
2.69
18.19
15.64
4.96
5.64
6.97
4.28
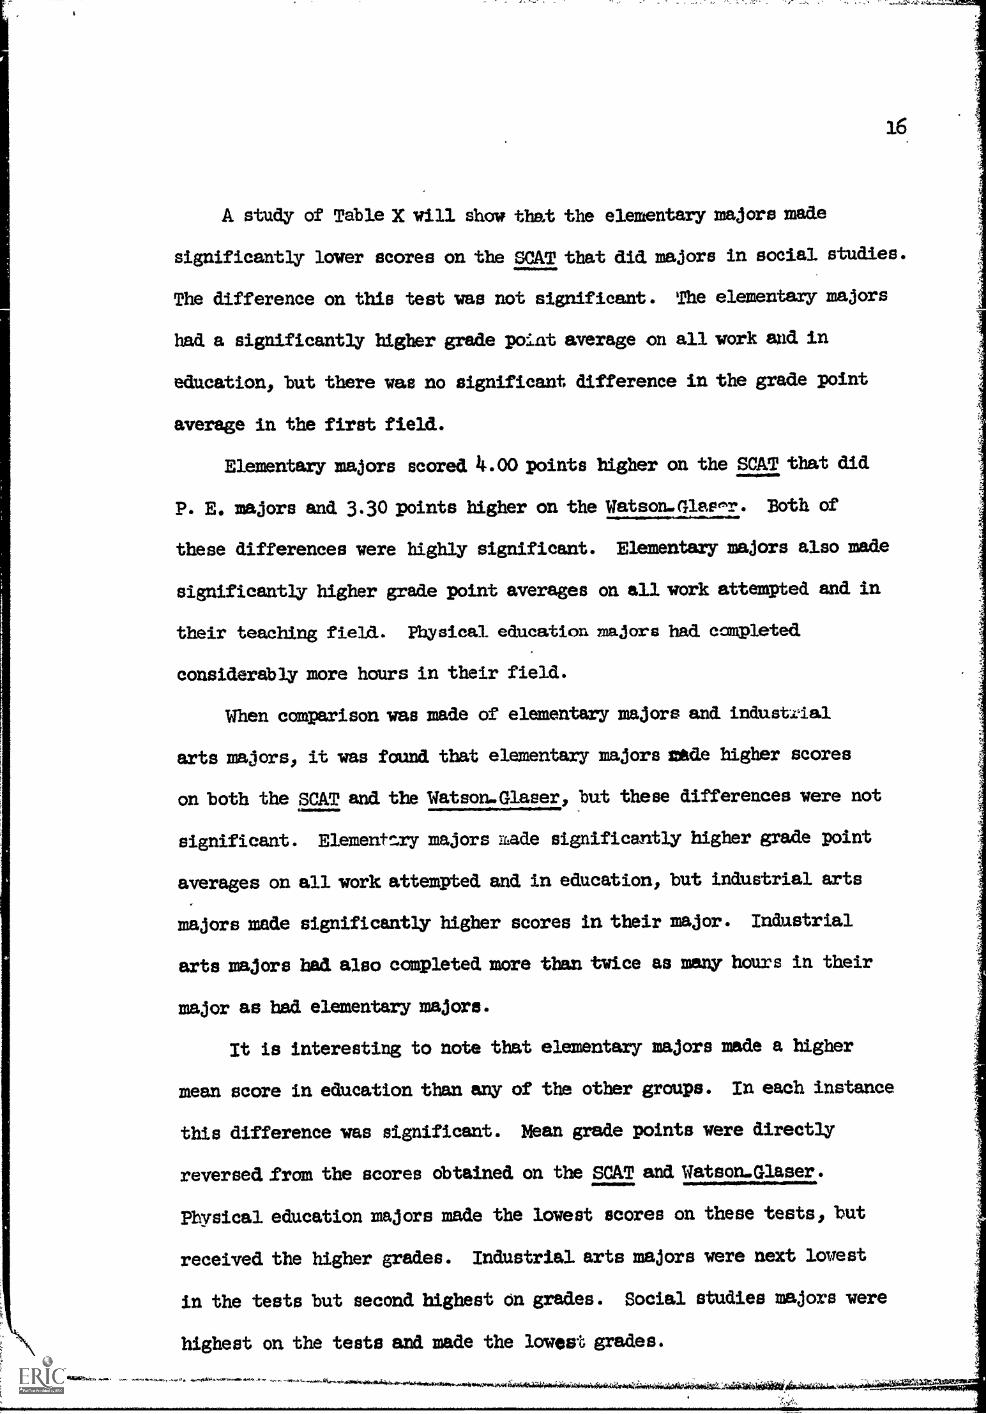
A study of Table X will show that the elementary majors made
significantly lower scores on the SCAT that did. majors in social studies.
The difference on this test was not significant. The elementary majors
had a significantly higher grade point average on all work and in
education, but there was no significant difference in the grade point
average in the first field.
Elementary majors scored 4.00 points higher on the SCAT that did
P. E. majors and 3.30 points higher on the Watson-Glase,r. Both of
these differences were highly significant. Elementary majors also made
significantly higher grade point averages on all work attempted and in
their teaching field. Physical education majors had completed
considerably more hours in their field.
When comparison was made of elementary majors and industrial
arts majors, it was found that elementary majors rade higher scores
on both the SCAT and the Watson.Glaser, but these differences were not
significant. Elementary majors Rade significantly higher grade point
averages on all work attempted and in education, but industrial arts
majors made significantly higher scores in their major. Industrial
arts majors had also completed more than twice as maw hours in their
major as had elementary majors.
It is interesting to note that elementary majors made a higher
mean score in education than any of the other groups. In each instance
this difference was significant. Mean grade points were directly
reversed from the scores obtained on the SCAT and Watson-Glaser.
Physical education majors made the lowest scores on these tests, but
received the higher grades. Industrial arts majors were next lovest
in the tests but second highest on grades. Social studies majors were
highest on the tests and made the lowest grades.

17
Comparisons between elementary majors and majors in speech and
drama, home economics, and music are found in Table XI.
TABLE XIDEANS, STANDARD DEVIATIONS, AND FISHER t FOR
ELEMENT= MAJORS, SPEECH AND DRAMA;HOME ECONOMICS MD MUSIC
31 1
Elementary Speech and Drama Home Economics. N =4 421 N = 40 N ggi 59
MusicN =115 __
cr cr t X t M cr
WatsonGlaser
Hours a.N.T.
GradePoints
G.P.A.
Hours isField
GradePoints
Hours.Educ.
GradePoints
G.P.A.
45.59
69.65
42.56
84.29
1.95
t.21.18
35.36
1.66
22.19
12.86
9.24
16.22
38.49
.46
6.77
17.35
.55
10.14
I48.9/
43.08;
78.°4I
$
1.74I
33.24
66.24SI
2.0CI
14.4Ci
U
12.78 -1.55 45.46:11.89
8.6T-2.17,68.8o' 9.34
17.97'. .19 39.46111.89
41. 4 31 .96
.57' 2.46
8.0.6.8022.341.6.58
.50-3.85
6.914 5.79
47.91 24.76 29.81 18.03, 5.56
2.12 .47 1.991 1.38
70.56'
1.76
3.43.
.61
1.80
8.03
15.31
1.89
31.05
.49
8.67
31.39
.48
3.56
7.84
.51
.07
.66
1.34
2.52
2.65
.21.60
.15.5
71.93
12.53
11.91
2.89
1
51.67
71.25
44.71
87.28
1.93
61.94
14696
2.17
14.05
27.92
1.95
t
15.1.0 - 4.37
8.871- 1.64I
17.300 1.23$
43.481.. .72
.43, .51
21.114.36.09
58.27'.33.40
.46
7.31
18.91
.99
- 9.09
9.52
9.65
_ 2.82
A study of Table XI will show that elementary majors and home
economics majors made approximately the same score on the SCAT and the
Watson-Glaser. The slight difference in favor of the elementary majors

was not significant. cn either test. Elementary majors made average grades
which were significantly higher than the home economies majors on all work
and significantly lower grades in the major but reversed this to attain
a significantly higher grade in education.
Majors in speech and drama scored significantly higher on the
Watsoo.Glaser than did elementary majors and also higher on the SCAT
but this difference was not significant. Elementary majors achieved a
mean grade point on all work attempted which was .20 higher than blieech
and drama majors. This difference was significant at better than the .05
level. In the major, the speech and drama students attained significantly
higher mean grades than did. elementary in their specialization area.
Elementary majors made a higher mean grade in education, but the difference
was not significant.
Music majors scored significantly higher than elementary majors on
the SCAT and somewhat higher on the Watson.Glaser, but the difference
here was not significant. The two groups achieved almost identical grade
point averages overall, but the music majors made significantly high grades
in their major than elementary made in their specialization. Elementary
majors made significantly higher grades in education than did music majors.
As in prior comparisons, elementary majors made higher grades in
education and lower grades in the specialized area. Most of these differences
welN1 significant.
Comparisons between elementary majors and majors in English, science,
and foreign language are made in Table XII.

19
TABLE XII
MEANS, STANDARD DEVIATIONS, AND FISHER t FOR ELEMENTARY MAJCRSENGLISH, SCIENCE, AND FOREIGN LANGUAGE
ElementaryN = 421
M a
EnglishN = 196
ScienceN = 36
Foreign LanguageN = 43
a. ta. /4 cr
SCAT
WatsonGlaser
Hours..
N.T.
45.59112.86
69.65 9.24
56.02
72.92
42.561 16.22 44.02
GradePoints 84.29.38.49
G.P.A. 1.95 .46
Hours_ 1st 21.184 6.77Field.
Grade 35.36117.35Points
G .P .A .
Hour s-
Educ.
GradePoints 47.9; 24.76
G.P.A. 2.121 .47
1.64 .55
22.191 10.14
13.34
8.34
17'.88
88.45 41.40
2.03! .64
29.511 7.27
W.52 23.16
1.93 .56
14.72! 7.27
'32.39 17.47
2.22! .57;
.9.12
.4.09
.1.02
. 1.22
. 1.65
-8.97
58.97
70.94
39.11
76.33
1.88
33.17
.9.04 60.58
.5.90 . 1.80
10.62 15.08
9.12 32.47
..1.90 2.05
M
15.24
8.53
18.51
45.40
.55
16.04
35.74
.58
8.05
20.55
.54
1.17
.81
.6.43
.5.13
.1.48
5.04
4.52
.69
55.23
70.19
38.93
85.67
2.12
26.67
60.56
2.27
2.07
27.14
2.22
12.12
9.24
15.08
43.98
.53
5.94
20.05
.56
5.95
.4.55
. .36
1.36
. .22
.2.07
.3.20
- 5.55
.7.15
7.78
14.501 6.59
.66 .1.08
An examination of Table XII will reveal that elementary majors scored
significantly lower on the SCAT than any of the other three groups, but
not significnatly lower than the science and foreign language groups inthe Watson-Glaser. English majors scored 3.27 points above the elementary
majors on the Watson.Glaser. This difference was significant at betterthan the .01 level. On all work attempted, English majors scored higher

20
than elementary majors, but the difference was not significant. Foreign
language majors also scored higher than elementary majors and this difference
was significant at the .05 level. Each of the other majors received higher
grades in their major that did elementary majors in their specialization
area. This difference was significant for English and foreign language
majors but not significant for science majors.
In education, English and foreign language majors received slightly
higher mean grades while science majors were lower than elementary majors.
None of these differences was significant.
Data regarding elementary majors,' business majors, mathematics majors
and art majors are contained in Table XIII. A study of Table XIII will
show that elementary majors made slightly higher scores on the SCAT
and Watson.. Glaser than did art majors. The differences* .were not
significant. Business majors scored slightly higher, but the difference
was not significant. On over..all grade point average the elementary
majors made a higher mean grade point than any of the three groups.
The difference between elementary majors and art majors was significant
in favor of the elementary majors. Each of the three majors made a
higher mean grade point in their first teaching field than elementary
majors made in their area of specialization. The difference was
significant for mathematics majors. Elementary majors made slightly
higher grades in education than did mathematics or art majors, but
slightly lower than business majors. The differences were not
significant.

21
TABLE XIII
MEANS, STANDARD DEVIATIONS, AND FISHER 1." FOR ELEMENTARY MAJORS,
BUSINESS MAJORS, MATHEMATICS MAJORS AND ART MAJORS
ElementaryN = 421
BusinessN = 81
MathematicsN = 58
ART
N = 54
OR
M a' tOIOND
ir-
SCAT 45.59
Watson 69.65
Glaser
12.86 50.23
9.24 71.681
Hours.. 42.56' 16.22 42.51,N.T.
Grade 84.29 38.49 80.23Points
G.P.A. 1.95
Hour s..2.st 21.18
Field
Grade 35.36Points
G.P.A. 1.66
Hours.. 22.19Educ.
Grade 47.91Points
G.P.A. 2.3.2
.46 1.88
6.77 46.85
17.35
.55
10 14
24.76
.47
--i 1
12..59 .. 2.89 64.93113.59
8.26 - 1.81 74.67: 9.851
15.03
33.91
.56
12.41
83.51 35.44
1.77 .57
6.24
i31.04 16.41
2.17 .53
.02 46.62
.85 90.17
1.17 1.90
-19.71 29.86
.14.00'54.5o
-1.66 1.82
8.38116.60
707 35.59
. .65 2.11
17.51
42.34
.4.9
7.50
..1o.44
- 3.87
- 1.75
- 1.07
.78
- 5.78
4-5.00
68.50
39.48
72.50
1.80
32.11
21.36,. 4.82 55.83
.511. 2.08 1.74
9.00 4.91 16.50
21.14
.51
4.47
.10
13.85
9.01.
14.47
.31
.86
1.28
37.83 2.08
.47
14.404,
29.38
.44
9.43
2.07
-7.05
-5.00
..L01
4.84
34.04121.834.88
2.02 .50
CONCLUSIONS
The results of this study led to the following conclusions:
1. It would. be undesirable to est &blish the 20th percentile as
a cut..offpgatxtn either the SCAT or Watson-Glaser. The grade point
average of all those below the 20th percentile on the SCAT was 1.66.
1.23I