r fisman g heal vinay b. nair - washington university...
TRANSCRIPT

1
Preliminary Draft - Comments Welcome
CORPORATE SOCIAL RESPONSIBILITY: DOING WELL BY DOING GOOD?*
RAY FISMAN
GEOFFREY HEAL VINAY B. NAIR#
Abstract We provide a framework for analyzing corporate social responsibility (CSR). Our model of CSR in this paper has two important ingredients – CSR is at least in part a profit motivated decision; and different CSR activities are aimed at different audiences. We examine the implications of our framework using a ‘visible’ CSR index that captures consumer-oriented CSR. We find that CSR is more prevalent in advertising-intensive (consumer-oriented) industries, and CSR is more positively related to profitability in these industries. Further, the effect of CSR on profits is stronger in competitive industries, especially when few other firms undertake such actions, suggesting that CSR may be used as a means of differentiation in otherwise competitive environments. We also find tentative evidence that the profit effects of CSR are more positive when large external shareholders are on the board. Finally, we document that different types of CSR activities targeted toward different audiences appear to be unrelated.
* The authors thank Franklin Allen, Randall Morck, Michael Roberts and Jeremy Stein for discussions. # Fisman and Heal are at the Graduate School of Business, Columbia University and Nair is at The Wharton School, University of Pennsylvania.
2
In the business community, Corporate Social Responsibility (CSR) has emerged as a
significant theme.1 While the growing emphasis on CSR is affecting the relationship
between companies and their various stakeholders - investors, customers, vendors,
suppliers, employees, communities and governments - there is little agreement on the
causes or effects of CSR, let alone a consensus on what CSR is.
This lack of a well-defined analytical framework generates difficulties in the
study of CSR, since the term seems to have different connotations to different audiences.
Further, even where there is some agreement on the behaviors that we wish to call
socially responsible, the effects of so-called responsible actions are poorly understood. In
particular, how does CSR affect the bottom line? 2 Is the relationship between CSR and
profitability affected by a firm’s circumstances? A better understanding of these
questions directly addresses a classic, yet timely, issue. Is there a conflict between
maximizing shareholder value and maximizing stakeholder or social value? Does a
corporation do well (financially) by doing good (socially)?
In this paper, we provide, with a view to anchoring the notion of CSR, a simple
framework that views social responsibility as part of business decisions that managers
and shareholders of a firm take. The framework we present views social responsibility as
actions that improve the welfare of interest groups who can affect firm value. Thus, there
1 The Economist recently surveyed executives and investors on CSR. Of the136 executives and 65 investors who responded, eighty-five percent said corporate social responsibility (CSR) was now a “central” or “important” consideration in investment decisions. This figure is almost double the 44% who said CSR was “central” or “important” five years ago, demonstrating the growth in CSR’s significance. Similar findings were also reported by the Global CEO Survey conducted by PriceWaterhouseCoopers. 2 Executives, in the survey cited cost implications (42%) and unproven benefits (40%) as the two biggest obstacles to implementing CSR programs.

3
will be levels of CSR activity, specific to each interest group, which may be chosen to
maximize firm profits. We also allow for a firm’s decision-makers to have non-pecuniary
motives for improving the welfare of interest groups, so that the level of CSR activity
actually chosen may deviate to some degree from profit maximization. This framework
allows us to discuss the various existing connotations of CSR as profit motivated or
driven by non-financial considerations.3 Furthermore, using this framework we can then
examine the circumstances under which social responsibility is positively (or negatively)
related to firm profits. That is, we test the extent to which doing good is a by-product of
seeking to do well.
To perform our tests, we use data provided by KLD Research & Analytics Inc in
their SOCRATES database. This database monitors various dimensions of a firm’s social
responsibility, and forms the basis for Domini 400 Social Index, the first and largest
socially screened index in the world. The database covers approximately 650 companies
listed on the S&P 500 or Domini 400 Social Indexes (as of August each year) for the
years between 1991 and 2002. The database consists of screens that are used to assign
strengths and concerns with respect to different activities that have an immediate social
impact.
We focus specifically on CSR that is targeted towards the community that
constitutes the firm’s existing and potential customers. This has both conceptual and
practical advantages. The Economist Survey cites brand enhancement as the most
3 Our analysis thus highlights conditions where CSR is more likely to be a result of the agency costs between managers and shareholders, as argued by Barnea and Rubin (2005), among others.

4
prominent motivation for CSR; consumer-oriented CSR is then a natural starting point.4
Community relations is the most visible aspect of CSR (see, for example, Business in the
Community, 2000), so we use this to measure consumer-oriented CSR. Empirically, we
use the Community Relations Strengths section of the SOCRATES database to form an
index (V-index) that captures the community oriented ‘visible’ CSR activities in which a
firm is involved. The details of the index are provided in later sections, but it is useful to
note here that the index captures a firm’s involvement in generous giving programs, and
in initiatives to provide housing and education, especially to the economically
disadvantaged.
We perform empirical tests of several types: First, we investigate whether the
characteristics of a firm's industry are correlated with the V-index. That is, do we find
CSR to be most prevalent in industries where it should confer the greatest advantage? For
example, we check whether visible CSR is more prevalent in advertising intensive
industries (i.e., those most likely to be affected by consumer perceptions). We then
investigate potential profit motives directly by examining the relationship between CSR
and various measures of profit. We begin by looking at the reduced form correlation
between CSR and profitability. More interestingly, we combine the previous two
analyses to examine the interaction of industry characteristics and CSR in predicting
profitability, i.e., we determine the circumstances under which CSR yields the greatest
benefits (or incur the greatest costs).
We summarize these findings on CSR, advertising and profitability as follows:
4 Executives in ‘the survey’ felt CSR practices could help a company’s bottom line, mainly through brand enhancement (61%).

5
• Visible CSR is most prominent in advertising-intensive industries. We use
advertising intensity as an industry-level proxy for the importance of firms’
identities to consumers.
• There is very little correlation between CSR and profitability overall.
• Firm performance is negatively correlated with visible CSR in industries with low
advertising-intensity, but this effect vanishes in industries with high advertising
intensity.
Thus, the effect of CSR on profitability depends crucially on firm/industry
characteristics. To shed more light on these findings, we investigate the impact of product
market competition on the documented positive link between CSR and firm profitability.
Product market competition can affect a manager’s incentive to take CSR-oriented
actions. To the extent that product market competition serves to discipline managers as in
Shleifer and Vishny (1997), we expect CSR to be more oriented to profits and less to
managerial utility in competitive industries. Product market competition can also affect
the profitability of CSR itself for several reasons. We save the discussion of possible
channels for section 5 and simply note our finding here. Empirically,
• we find that the benefits of CSR are increasing in the extent of industry-level
competition, but decreasing in the fraction of other firms in the industry that also
have high CSR.
To explain the existence of firms that take CSR-oriented actions even when there
exists a negative link between CSR and firm profitability, we posit that CSR will be less
profit-motivated in companies with poor corporate governance. Poor corporate
governance allows the board and management to make CSR expenditures according to

6
personal preferences rather than profit concerns. We find limited support for this view;
specifically,
• the presence of outside blockholders with board representation results in a more
positive relationship between CSR and profitability.
These findings are consistent with the framework we lay out below, and also
highlight the heterogeneity in the (profit) benefits from visible CSR. The desirability of
CSR depends on the level of consumer-orientation (as indicated by advertising intensity),
the level of competition in the industry, and the number of other firms taking CSR-
oriented actions. Further, deviations of CSR activity from our framework can also be
explained based on the strength of corporate governance.
Our framework also emphasizes that CSR activity is audience specific and is
independently chosen. If there are no obvious reasons why the benefits across different
audiences are related, then different types of CSR activities would be unrelated. Indeed,
we find that CSR activities directed towards different stakeholders appear to be
uncorrelated. Thus a firm viewed as a good corporate citizen by employees might be
viewed otherwise by consumers or regulators.
We are certainly not the first to consider the performance effects of CSR. There
exists a vast literature on the relationship between CSR and financial returns, generated in
part by the rising prominence of socially responsible investment (SRI) funds. (see Geczy,
Levin, and Stambaugh (2004) for a more recent evaluation of the returns of SRI funds). Griffin
and Mahoney (1997) survey a broad range of such studies that range in their focus from

7
product recalls and antitrust lawsuits to charitable giving and corporate reputation.5
Additionally, in the environmental economics literature, there are a number of studies
relating environmental policies to corporate performance (see Dowell, Hart, and Yeung
(2000) and Hamilton (1995) for examples of these). Environmental performance certainly
fits within our theoretical framework of CSR that follows, and to this extent these studies
are of relevance for us. At the same time, our framework implies that it is important to
consider each component of CSR separately, and that it may be misleading to make
general inferences about the costs and benefits of CSR in general from these studies on
environmental CSR.6.
Additionally, many of these studies document only correlations with firm
performance, thus leaving room for several alternative implications (though this critique
does not apply to the event studies on toxic releases. Our focus on the heterogeneous
effects of CSR helps us to address some of the causality issues that afflict these earlier
studies. For example, profitable companies may spend more on CSR because of high
free cash flow, confounding any interpretation of a CSR-profit correlation. By drawing a
comparison across firms that we identify ex ante as likely having differential financial
benefits from CSR expenditures, we mitigate these concerns to some degree. For
example, for both high- and low-advertising intensity firms, higher profits may lead to
higher CSR expenditures, but if CSR activity is indeed beneficial only for advertising-
5 See Griffin and Mahoney (1997) for a discussion of the methodological and econometric problems in these studies. 6 We note, however, that environmental CSR may be important to consumers in some industries (e.g., chemicals, energy), though we do not expect this to be the case more generally.

8
intensive firms, we would expect a link between profits and (visible) CSR only for high
advertising firms.
More generally, our primary interest is in understanding the firm-specific
circumstances that mediate the relationship between CSR and performance (rather than
the average effect itself), and we embed our empirical analysis in a well-defined
theoretical framework. Thus the theoretically motivated question that we study here is:
When and how does CSR increase firm value?
Before proceeding to our theoretical framework, the policy implications of our
findings warrant a brief discussion. Viewing CSR as a profit motivated decision, we
document the benefits (and costs) of CSR for firm value and shareholders. However,
even in cases where CSR is undesirable for shareholders, it might still be beneficial for
society. In some ways, we document the limits of ‘doing good by doing well’.
Understanding these limits is only be a first step in the broader debate as to whether a
firm should be shareholder oriented or stakeholder oriented.
The rest of the paper is structured as follows. We first present a basic framework to
capture the notion of CSR as a tool in maximizing profits. In section II, we explain the
data sources we use. In section III, we document our main results linking CSR to firm
profits and valuation. In section IV, we explore the impact of corporate governance on
CSR choices. In section V, we address some extensions. The conclusion follows.
I. THE ROLE OF CSR IN BUSINESS DECISION-MAKING
In this section, we provide a simple framework to characterize the different types
of CSR activities and their optimal levels. The starting point of our analysis is that

9
individuals derive utility from direct monetary payoffs, as well as ‘non-pecuniary’
utility.7 Individuals (this includes both managers and shareholders) thus get utility from
‘doing well’ (i.e., profit), and ‘doing good’:
An agent’s utility is thus
P(.) + t S(.)
where P(.) is the pecuniary payoff, S(.) is the non-pecuniary component of the utility
function and t is a reflection of the individual's relative concern for doing good. A
familiar interpretation of such a utility form, in the corporate finance literature, has been
private benefits that managers enjoy. A difference in the levels of concern for non-
pecuniary payoffs, t, between shareholders and managers would then create a role for
corporate governance where shareholders monitor managerial actions. For now though,
we assume that there is no such role so that shareholders and managers have the same
utility function.
Since a firm functions with several different stakeholders, CSR activities are
audience specific – e.g they are targeted towards community (visible CSR), employees
(internal CSR), regulators, lawmakers and judges (political CSR). If the extent to which
these different audiences can affect firm value differ, there is no reason to believe that a
firm active in one of these types would also be active in another. Thus, a firm that is
considered socially responsible by one group of stakeholders might be viewed otherwise
by another group. In the empirical tests that follow, we will focus on one particular
7 This simply builds on the assumption that individuals’ utility may include the payoffs of others; the literature on giving experiments provides substantial validation of this assumption (See, for example, Charness and Rabin, 2002).

10
component – visible CSR – but comparable empirical analyses could plausibly be done
for other CSR components.
Now consider the manager’s problem where for simplicity we limit the revenue
function of the firm, R(.), to contain only elements of CSR, and further limit ourselves to
visible CSR, which will be the focus of our empirical work. In what follows, we assume
that both R(.) and S(.) are concave functions of CSR activity. Thus, we have:
U(V,a) = R(V,a) – ½ pgV2 + t*S(V) = P(V,a) + t*S(V)
where V is visible CSR, ½ pg V2 are the costs borne due to the CSR program, ‘a’ is a
firm-specific multiplier that reflects how much customers care about CSR, and P is the
profit function of the firm. In our empirical work below, we will often think of this
multiplier as being an industry characteristic, such as advertising intensity. A higher
value of ‘a’ signifies a more beneficial (or less detrimental) impact of visible CSR. That
is, d2R/da dV > 0. If this assumption holds (as we investigate in the empirical section
below), then the level of V chosen will increase with ‘a’.8 This yields our first empirical
prediction:
Firm characteristics & CSR
Proposition 1: If R(.) and S(.) are concave functions of V, then dV*/da >0
Proof: The first order condition for max utility with respect to V is
Rv – pgV + tSv = 0
8 The optimal level of CSR satisfies d(R+tS)/dV = pgV.

11
Using the implicit function theorem, we get
dV/da = -Rva / [Rvv – pg – tSvv],
which is positive if (but not only if) R and S are concave in V.
That is, for firms (or industries) with greater multipliers, there will be more CSR
(holding the distribution of managerial preferences constant).
Governance and CSR
We now allow for heterogeneity in preferences for CSR, that is in t, between managers
and shareholders. There is a number of plausible explanations for these divergent
preferences. Since managers are more easily identified, it is possible that they have more
to gain, or lose, from the corporation’s social actions. Alternatively, from a governance
perspective, managers might indulge for self image in rent seeking activities that do not
improve firm profits. Thus, managers who are more entrenched and face a lower risk of
dismissal would spend more on such activities. We may capture this higher managerial
preference for CSR activities by assuming that managers have a higher ‘t’, denoted by
‘tM’, than shareholders who have preferences ‘tS’. If managers are able to impose their
preferences on the firm’s CSR expenditures, this manifests itself in a higher realized
value of t (=tM), so that the difference tM-tS = x can be viewed as the extent of managerial
entrenchment, x. Thus, instead of choosing the level of CSR that shareholders desire, the
manager chooses V to maximize utility and hence satisfy the following first order
condition:
Rv – pgV -+ tmSv = 0
12
The above expression directly implies two additional results:
Proposition 2: If tM-tS=x>0, the level of CSR activity is increasing in managerial
entrenchment.
Proof: From the expression above, we can see that
dV/dtM = - Sv / [Rvv – Pg + tMSvv] > 0.
Thus, dVM/dx = dV/dtM . dtM/dx = dV/dtM> 0
Proposition 3: If tM-tS = x > 0, higher CSR reduces profitability in firms with higher
entrenchment (d2P/dxdV < 0)
Proof: dP/dV = dR/dV - pg . V = -tMdS/dV <0. Thus, d2P/dXdV = - dtM/dX dS/dV = -
dS/dV < 0.
Thus, companies of managers who have a high taste for CSR will suffer relatively
less in industries where there is a greater profit benefit from CSR, since in such industries
the level of optimal CSR and the chosen level of managerial CSR are closer.
We now turn to our empirical work, utilizing this conceptual framework to
examine and interpret the patterns we observe in the data.
II DATA AND EMPIRICAL STRATEGY
To perform our tests, we extract balance sheet information from COMPUSTAT. This
is then combined with information on a firm’s social actions provided by KLD Research &
Analytics Inc in their SOCRATES database. KLD uses this database to monitor a firm’s
social responsibility, and this forms the basis of the Domini 400 Social Index – the first and

13
largest socially screened index in the world .9 SOCRATES is a proprietary database program
that provides access to KLD’s ratings and other data pertaining to the social records of a
subset of publicly traded U.S. companies between 1991 and 2003. The number of companies
tracked by KLD expanded from approximately 500 to over 3000 by 2003.
The database consists of screens that are used to assign strengths and concerns with
respect to different activities that have an immediate social impact. Each screen assigns a
zero/one score for a particular social indicator and is part of an overall evaluation of
corporate social performance. As mentioned earlier, we restrict our focus to community-
oriented CSR, which we term visible CSR.
To proxy for a firm’s visible CSR activities, we compile what we refer to as the V-index
based on the strengths in KLD.10 This index utilizes three community based CSR screens that
the database tracks through the time period which measure a firm’s actions in donating to
non-profits and the economically disadvantaged. Their description follows.
1) Generous Giving: The company has consistently given over 1.5% of trailing three-
year net earnings before taxes (NEBT) to charity, or has otherwise been notably
generous in its giving.
2) Innovative Giving: The company has a notably innovative giving program which
supports nonprofit organizations particularly those promoting self sufficiency among
9 The fund manages over 1.8 bn in socially responsible investment vehicles such as the Domini Social Equity Fund, the Domini Social Bond Fund and the Domini Money Market Account. 10 Slightly stronger results are obtained if we include community concerns as well as strengths. We omit concerns because they are essentially a mirror image of strengths, which results in much double counting. Additionally, we omit some community screens since they were introduced only in 2000 or later and consequently have virtually no overlap with our other data.
14
the economically disadvantaged. Companies that permit non-traditional federated
charitable giving drives in the workplace are often noted in this section as well.
3) Support for Housing: The company is a prominent participant in public/private
partnerships that support housing initiatives for the economically disadvantaged, e.g.,
the National Equity Fund or the Enterprise Foundation.
Aggregating over these three indicator variables, our V-index thus ranges between 0 and
3, with a higher value signifying better visible-CSR.11 A concern about using just these
screens is that we are ignoring some other components of CSR that may affect a company’s
public profile and are not captured by these screens such as environmental actions and human
rights violations. In a later section, we discuss these concerns.
Our empirical methodology is straightforward and builds on a key implication of the
framework in the previous section: higher levels of community CSR should be observed
for firms for which community perceptions matter more for profitability. It then follows
that firms that do not implement visible CSR programs when the community is important
should have lower profitability. Similarly, firms that indulge in high visible CSR activity
when the community is less important (due, for example, to lapses in corporate
governance) should also have lower profitability. In sum, we investigate whether firms
that operate in industries most affected by visible CSR benefit (in terms of profitability)
more than firms in industries where visible CSR is less likely to be important.
11 KLD also began tracking from, 1994, ‘support for education’ which was defined as: The company has either been notably innovative in its support for primary or secondary school education, particularly for those programs that benefit the economically disadvantaged, or the company has prominently supported job-training programs for youth. Our results were qualitatively similar when we included this strength in our index and, consequently, decreased the sample to focus on the period between 1994 and 2002.

15
Consequently, we look at the impact of visible CSR on firm valuation and profitability
under differing importance levels of the community.
To measure the importance of community perception, we characterize industries by
the extent of consumer orientation since those with the strongest such orientation are
most likely to be affected by consumer perceptions. This is in agreement with the casual
survey evidence, reported in the introduction, that executives consider brand awareness
an important benefit of CSR activities. The variable used to capture differing levels of
importance attached to consumers is the median of the advertising expenditure to sales
ratio for each 4-digit SIC code during the 1990s, calculated using the full sample of
COMPUSTAT firms.
We use the Herfindahl-Hirschman Index (HHI), given by the sum of squares of the
percentages of the market shares held by the firms in a market, as a measure of product
market competition. Our data are at the 4-digit SIC code level and are derived from the
1982 Economic Census.12 Since this variable is only available for manufacturing firms,
its inclusion significantly reduces our sample size.
Finally, we use the IRRC database to create a managerial entrenchment index (G).
This index, first compiled by Gompers, Ishii and Metrick (2003), utilizes charter level
provisions to characterize firms as either shareholder friendly or manager friendly.13 We
rescale the data to range from zero to one, with higher values denoting higher governance
(i.e., lower managerial entrenchment). Finally, we also utilize the blockholder data from
Compact Disclosure, corrected for biases and errors by Dlugosz, Fahlenbrach, Gompers
12 This is most recent data for which HHI is available. 13 For more information on the construction of this index, see Gompers, Ishii and Metrick (2003).
16
and Metrick (2005).14 Since this database exists between 1996 and 2001, tests that utilize
such blockholder information are restricted to this time period as well. We use data both
on total outside blocks as well as outside blocks owned by those with board
representation.
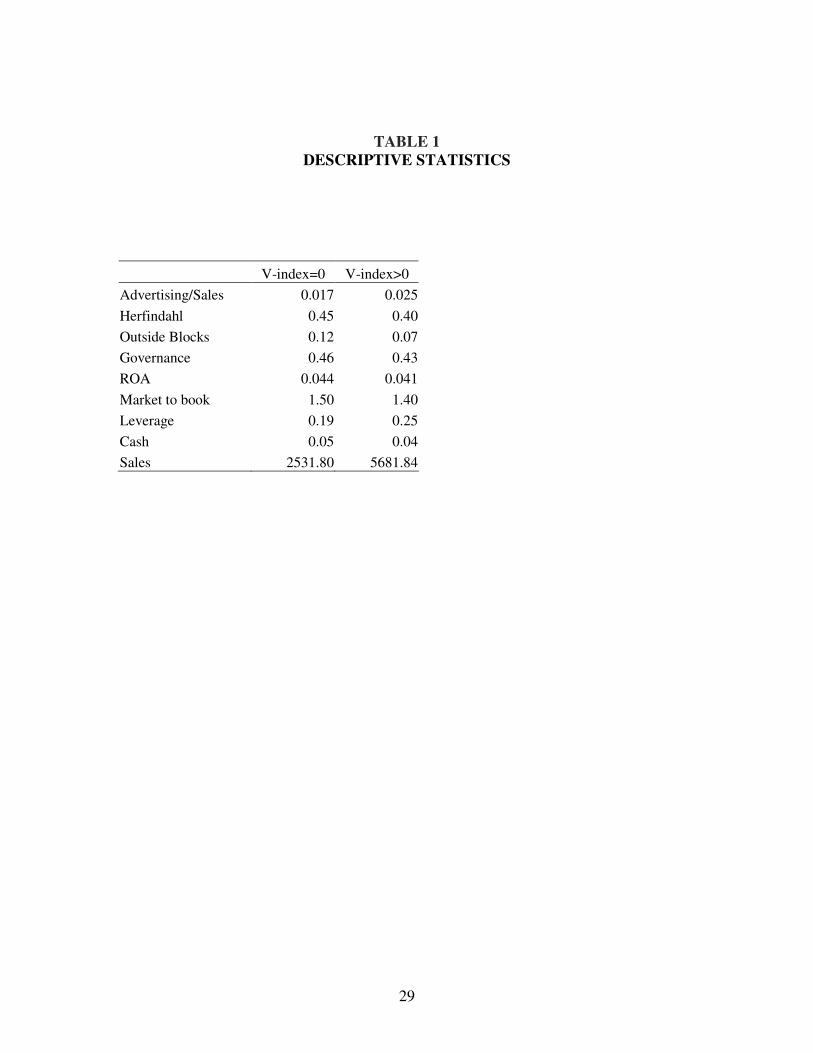
In Table 1, we summarize the median values of several firm characteristics based on a
sample split of the V-index (=0 and > 0). Although these are only differences in medians,
it is useful to make some preliminary observations. As predicted, visible CSR activity is
higher in industries with a higher advertising to sales ratios. Thus visible CSR does
appear to increase as the importance of consumers – and hence of brand awareness and
community giving – increases.
Interestingly there are hardly any differences in cash holdings of firms that differ in
their visible CSR activity. Thus, there does not appear to be any obvious evidence that
firms with more cash to spend simply spend it on CSR activities even if such activities
might not affect firm value. However, it might be the case that more profitable firms
generate higher cashflows and after spending on CSR activities end up with cash levels
similar to less profitable firms that do not spend on CSR activity. Even if CSR activity is
unrelated to profitability, one would then observe a positive association between CSR
and profitability. As we will see later, looking at the link between CSR and profitability
across groups of firms with differing consumer orientation makes our results less hostage
to such an interpretation. It also appears that there are small differences in CSR activity
based on product market competition and managerial entrenchment. We now turn to a
14 For details on these corrections, see Dlugosz, Jennifer, Ruediger Fahlenbrach, Paul A. Gompers, and Andrew Metrick (2005).

17
more structured econometric approach to study in greater detail the determinants of CSR
and the characteristics that mediate the CSR-performance relationship.
III CSR: The evidence
A. WHO DOES VISIBLE CSR?
In columns (1) and (3) of Table 2, we report the correlation between advertising
intensity, competition, and the V-index at the industry level, as well as of some common
firm-specific characteristics, such as firm size, cash holdings and leverage that might
affect the level of CSR of the V-index, averaged by industry. In the remaining columns,
we examine the correlation between several measures of corporate governance and the V-
index, at the firm level.
The results in Table 2 confirm the pattern described in the summary statistics
above: visible CSR activity is higher in industries that are consumer focused, as proxied
by higher advertising intensity. This effect is statistically significant at the 1% level.
Other variables do not appear to explain visible CSR activity in a statistically significant
manner. In the case of the industry based Herfindahl index, the lack of significance might
be due to the fact that the test utilizes only 109 observations. In columns (3) and (4) we
show examine the effect at the firm level of Outside Blocks and G on CSR. In neither
case is there a significant correlation. Cremers and Nair (2005) suggest that outside
blockholders may only serve a useful governing role if they have the right to control firm
decision-making. By this argument, outside blocks should reduce CSR only if
governance is is high. This suggests including the interaction of Outside Blocks and G,
which should be negatively related to CSR. Model (5) includes this interaction, which is

18
negative and significant. This casts at least some doubt on viewing CSR activity as an
ingredient of higher profitability, since a more shareholder-oriented firm is expected to
take actions that improve firm profitability. Finally, in model (6) we examine the effect of
Outside Blocks with board representation; while the point estimate is negative, it is not at
all significant (the interaction with G is also negative and insignificant).
B. CSR and FIRM PERFORMANCE
Our primary interest is the relationship between CSR and two aspects of firm
performance. As an indicator of firm operating performance we use the firm’s return on
assets. We also use firm Q (market value to book value) to check whether CSR has an
impact on firm valuations. Using two distinct measures also serves as a robustness check
on the results.
Table 3 reports the results of regressions that use either ROA or log(Q) as the
dependent variable and the V-index as the independent variable. All models include
log(sales) as a control and industry fixed effects at the 4-digit SIC level as well as year
fixed effects. Models (1) and (3) in Table 3 indicate a weak negative relationship
between CSR and firm profitability and valuation but this effect is not consistently
significant. However, our main interest is to examine how this relationship is affected by
firm-specific characteristics.
CSR and Consumer Orientation
In models (2) and (4) of Table 3, we report the estimates of a model that includes
the interaction of advertising intensity and CSR in predicting profits. These results
provide support for a positive impact of visible CSR activity in high advertising intensive

19
industries (relative to low advertising intensity industries): when ROA is the dependent
variable, the interaction term CSR*Advertising is marginally significant and positive (p
value=0.11); this interaction term is significant at the 5 percent level when log(Q) is the
dependent variable. The direct effect of CSR is now significantly negative in both
regressions, implying that taking both direct and indirect effects into account there is a
negative correlation between CSR and performance for very low advertising intensity
industries. This effect drops to zero for relatively high advertising intensity industries: at
the 90th percentile of advertising (0.056), the effect of CSR on profitability is close to
zero. This is consistent with firms receiving at least some ancillary benefit that offsets
the costs of CSR in industries where image matters, while there are relatively few
offsetting gains in less consumer oriented industries.
That the negative impact of CSR dominates only in low advertising industries
helps to address one issue raised earlier regarding the interpretation of performance-CSR
regressions. In particular, there is the concern of reverse causation under which firms
with higher profits simply have more cash to spend, which would generate a profit-CSR
relationship. Since we would expect this story to apply across all types of firms, our
comparison of this relationship across industries helps to alleviate these concerns
Above, we have used advertising intensity as a proxy of the importance of
consumers and brand image. This proxy however captures two separate but closely linked
ingredients: one pertains to making the product appealing to consumers regardless of
other choices that the consumer faces and the second pertains to making the product more
appealing than other similar alternatives. We now focus on this second channel, by
examining the extent of alternative products available to consumers.
20
The Role of Product Market Competition
In this section we investigate how competition in product markets affects the
impact of CSR on firm profits. Product market competition might discipline firms in
their choice of CSR activities - in competitive situations, managers might be more likely
to undertake profit maximizing, rather than wasteful, CSR activities. Additionally, the
benefits of CSR itself might change as product market competition changes. In a more
competitive landscape, CSR is more likely to be a differentiating factor for more
consumers since price differences among comparable products are likely to be low, and
since products themselves are likely to be similar. Thus the benefits of CSR might be
higher in competitive industries.
Table 4 (Models (1) and (4)) reports coefficients from regressions that shed light
on this question. Using the 1982 Herfindahl index as our measure of product market
competition, we find that the impact of CSR on firm value and profit is decreasing as the
level of competition decreases. The explanation we provide above that would be
consistent with this pattern is based on firms using CSR as a means of differentiation in
an otherwise competitive landscape.
However, the effectiveness of CSR as a means of differentiation might be
attenuated if many other firms in the industry are also identified as high CSR firms.15 We
therefore examine whether the effect of CSR on profits is greater when relatively few
15 In equilibrium, if all firms are indulging in CSR, the incremental benefit of CSR to any one firm should then be low. Out of equilibrium however, it might be case that when most firms in an industry practice visible CSR, customers, through their purchasing decisions, might penalize firms who avoid CSR activities. So, with consumer demand depending on CSR relative to that of competitors, there could be a non-linear relation between CSR and firm profitability.

21
firms in an industry are engaged in CSR. Specifically, for firm i in year t, we add the
interaction of a firm’s own V-index and the average V-index for all firms in i's industry
in year t. Table 4, models (2) and (5), shows these results. We find that the interaction of
a firm’s own V-index and the average V-index of its peers is significant at the 1 percent
level for both ROA and Q as dependent variables. The magnitude in both cases is such
that the correlation between CSR and performance is negative if the industry average V-
index rises above a half. Finally, in model (3) we include both the average V-index of a
firm’s peers as well competition interacted with the V-index. We find that the peer effect
declines marginally in magnitude and is much less significant, but this is primarily due to
the reduced sample size.
IV. UNDERSTANDING FIRM’S ACTIONS: THE ROLE OF GOVERNANCE
The above results, while supporting the notion that CSR may be consistent with
profit maximization, also suggest that we ask why firms may choose CSR beyond the
profit-maximizing level. For example, why do firms in industries with low advertising
intensity undertake CSR activities? As we discuss above in our theoretical framework,
this may be due to the personal preferences of management, who indulge in CSR at the
expense of shareholder value. In this section we thus examine the extent to which
managerial entrenchment, which allows for greater deviation of managerial decisions
from shareholders’ wishes, may explain deviations from optimal CSR choice.
Table 5 presents results to models that use a number of different governance
metrics that proxy for different aspects of corporate governance. In each case, we include

22
an interaction term of governance and the V-index that captures the extent to which the
level of governance affects the impact of CSR on performance.
We first utilize the blockholder data from Compact Disclosure, corrected for
biases and errors by Dlugosz, Fahlenbrach, Gompers and Metrick (2005). Two different
measures are used here. The first, denoted by Outside Block, captures the presence of
non-officer blockholders, defined as shareholders who own greater than 5% of the firm
but are not on the board of directors. The second, denoted by Outside Block Board,
captures the presence of non-officer blockholders who are on the board of the directors.
According to Dlugosz et al (2005), these are primarily private equity investors, who may
be particularly active in ensuring that management does not dissipate value. We also use,
as an alternative measure of governance, the Governance index (G) compiled by
Gompers, Ishii and Metrick (2003).16 We rescale this variable to take on values between
zero and one with higher values indicating stronger shareholder rights..
We do not find an intermediating effect of Outside_Block or of the G index on the
link between CSR and profitability but a strong effect for Outside_Block_Board. Since
shareholders who make up Outside_Block_Board are likely to be active in monitoring
management actions and to be able to act, the positive sign on the interaction term
suggests that CSR decisions are indeed more profitable when governance is strong. In
particular, it implies that when such shareholders have a substantial stake in the firm,
there is no negative correlation between CSR and profit.
16 See Gompers, Ishii and Metrick (2003) for details on the construction of this index.

23
V. OTHER ELEMENTS OF CSR
The proposed framework of CSR in this paper has two important ingredients –
CSR is at least in part a profit motivated decision; and different CSR activities are aimed
at different audiences. In the preceding sections, using visible CSR, we have documented
evidence that corporate CSR activity is indeed consistent with our framework of ‘doing
well by doing good’. We have also provided some evidence on how deviations from this
view could be attributed to poor corporate governance.
In this section, we shed light on the second ingredient of the framework. To do so,
we first characterize CSR activity directed towards employees and also towards
regulators, and then check the correlation between different CSR activities. If the profit
motives of catering to employees, or to regulators, are different from catering to the
community, one would then not expect to observe any correlation between CSR which is
community oriented and that which is employee oriented. This would then suggest that
firms considered as good citizens by one stakeholder (community) might be viewed
otherwise by another stakeholder (employees).17
We thus proceed to construct two other measures of CSR activity. To capture
CSR towards employees (E-index), we again use data from the SOCRATES database
provided by KLD Research & Analytics. The screens we use are:
1. Strong Union Relations: The company has a history of notably strong union
relations.
17 This is assuming, of course, that environmental and employee CSR is largely invisible to consumers. As we mention in the introduction, there may be select circumstances where information on these alternative types of CSR is made available to consumers through the media or special interest groups.

24
2. Cash Profit Sharing: The company has a cash profit-sharing program through
which it has recently made distributions to a majority of its workforce.
3. Employee Involvement: The company strongly encourages worker
involvement and/or ownership through stock options available to a majority of
its employees, gain sharing, stock ownership, sharing of financial information,
or participation in management decision-making.
4. Strong Retirement Benefits: The company has a notably strong retirement
benefits program.
Thus, the E-index utilizes four CSR screens that the database tracks through the
time period.18 As the description above illustrates, these screens track a firm’s actions
towards employees. Similarly, we focus on a firm’s actions towards the environment to
characterize CSR activity catered towards regulators (R-index).19 As before, we use the
screens described below to construct the R-index.
1. Beneficial Products and Services: The company derives substantial revenues
from innovative remediation products, environmental services, or products
that promote the efficient use of energy, or it has developed innovative
products with environmental benefits.20
2. Pollution Prevention : The company has notably strong pollution prevention
programs including emissions reductions and toxic-use reduction programs.
18 The database also has other screens that, however, only exist for part of the sample period. We used screens that were available for the entire sample period of 1992 to 2004. 19 This index is potentially incomplete in that it does not include information on corporate political donations. 20 The term “environmental service” does not include services with questionable environmental effects, such as landfills, incinerators, waste-to-energy plants, and deep injection wells. Through 1994, “substantial revenues” was specified as more than 4% of total revenues.

25
3. Recycling: The company either is a substantial user of recycled materials as
raw materials in its manufacturing processes, or a major factor in the
recycling industry.
4. Alternative Fuels: The company derives substantial revenues from alternative
fuels. The term “alternative fuels” includes natural gas, wind power, and solar
energy. The company has demonstrated an exceptional commitment to
energy efficiency programs or the promotion of energy efficiency.
The correlations between visible CSR and the E-index is only 0.05. Similarly, the
correlation between visible CSR and the R-index is low (0.01). Further, the correlation
between the E-index and the R-index is also only 0.04. These correlations are striking in
that it shows how firms considered socially responsible by one audience can be viewed
otherwise by another. It perhaps also highlights how firms do not consider employee and
regulator oriented CSR activity as ‘visible’. Finally, these numbers support the proposed
framework where CSR activity is audience specific and is chosen with the goal of
maximizing profits.
VI CONCLUSION
In this paper, our main goal is to generate a well-structured way of thinking about
CSR that may be used to frame the debate on the role of CSR in business. We feel that
up to now this debate has to a largely occurred in a theoretical vacuum, making it
difficult to progress in generating a systematic understanding of the issues involved.
In our framework, managers derive utility from CSR directly through a ‘warm
glow’ and indirectly through the impact of CSR on profits (for example, by doing

26
charitable work that are valued by consumers). We derive predictions on the prevalence
of profit-motivated CSR. Further, assuming that managers’ non-pecuniary benefits from
the firm’s CSR choices are stronger than those of shareholders, we derive predictions for
the effect of corporate governance on CSR. We further emphasize that CSR has different
dimensions that appeal to very different constituencies. Importantly, we generate
predictions that we may then examine in the data. Our empirical exercise, while far from
conclusive, does suggest that CSR does appear to be motivated by profits and audience
specific.
Our intention is to outline a platform that may be expanded in future work. The
theory leaves much room for further refinements and applications. Further, our empirical
results are certainly not conclusive, but rather open the door, we hope, for much-needed
further research on an important topic.

27
REFERENCES “8th Annual Global CEO Survey,” PriceWaterhouseCoopers.
Barnea, Amir and Amir Rubin, “Corporate Social Responsibility as a Conflict Between
Owners,” Working Paper, University of British Columbia (2005).
Charness, Gary and Matthew Rabin, "Understanding Social Preferences With Simple
Tests," The Quarterly Journal of Economics, 117:3 (2002), 817-869.
Cremers, K.J. Martijn and Vinay B. Nair, “Governance Mechanisms and Equity Prices,”
Journal of Finance, Forthcoming (2005).
Dlugosz, Jennifer, Ruediger Fahlenbrach, Paul A. Gompers, and Andrew Metrick, “Large
Blocks of Stock: Prevalence, Size, and Measurement,” Journal of Corporate
Finance, Forthcoming (2005).
Dowell, Glen, Stuart Hart, and Bernard Yeung, “Do Corporate Global Environmental
Standards Create or Destroy Market Value?” Management Science, 46:8 (2000),
1059-1074.
Geczy, Christopher C, David Levin, and Robert F. Stambaugh, “Investing in Socially
Responsible Mutual Funds,” The Wharton School , Working Paper (2003).
Gompers, Paul A., Joy L. Ishii, and Andrew Metrick, “Corporate Governance and Equity
Prices,” Quarterly Journal of Economics, 118:1 (2003), 107-155.
Griffin, Jennifer J, and John F. Mahoney, “The corporate social performance and
corporate financial performance debate”. Business and Society (1997), 5-31.

28
Hamilton, J., "Pollution as News: Media and Stock Market Reactions to the Toxic
Release Inventory Data,” Journal of Environmental Economics and Management,
28 (1995) 98-103.
Shleifer, Andrei and Vishny, Robert W., "A Survey of Corporate Governance," Journal
of Finance, 52:2 (1997), 737-783.
“Survey: The Good Company,” The Economist, 374:8410 (2005).
“Winning with Integrity”, Business in the Community,
http://www.bitc.org.uk/resources/publications/winning.html (2000)
29
TABLE 1 DESCRIPTIVE STATISTICS
V-index=0 V-index>0 Advertising/Sales 0.017 0.025 Herfindahl 0.45 0.40 Outside Blocks 0.12 0.07 Governance 0.46 0.43 ROA 0.044 0.041 Market to book 1.50 1.40 Leverage 0.19 0.25 Cash 0.05 0.04 Sales 2531.80 5681.84

30
TABLE 2 WHO DOES CSR?
(1) (2) (3) (4) (5) (6) Advertising Rate 2.235*** (0.754) Herfindahl -0.045 (0.040) Outside Block -0.076 0.742** (0.142) (0.335) Governance -0.121 0.116 (0.092) (0.154) Outside Block -1.614*** *Governance (0.585) Outside Block Board -0.131 (0.357) Cash/Assets -0.078 -0.213 0.127 0.073 0.176 0.129 (0.136) (0.229) (0.143) (0.093) (0.148) (0.142) log(Sales) 0.074*** 0.107*** 0.079*** 0.089*** 0.088*** 0.082*** (0.014) (0.032) (0.018) (0.013) (0.018) (0.018) Industry FE No No Yes Yes Yes Yes Year FE No No Yes Yes Yes Yes Observations 302 107 2719 6282 2470 2719 R-squared 0.15 0.10 0.40 0.34 0.41 0.40 Notes: CSR, the sum of KLD's four community strength indicator variables, is the dependent variable in all regressions. In models (1) and (2), the dependent variable is the mean value for each 4-digit SIC code. Models (3) and (4) utilize company-level data for 1996-2001. Model (5) uses company-level data for 1990-2001. Advertising is the median of advertising expenditure to sales at for each 4-digit SIC code during 1990-2000. Herfindahl is the 1982+A1 Herfindahl Index for each 4-digit SIC code. Outside Block is the fraction of shares held by outside blockholders. Outside Block Board is the fraction of shares held by individuals, trusts or companies whose voting is influenced by an officer or director. It is essentially hedge funds and VC funds. Governance is the headcount of 24 corporate governance statutes. Robust standard errors in parentheses, clustered at the company level. * significant at 10%; ** significant at 5%; *** significant at 1%

31
TABLE 3 CSR AND FIRM PERFORMANCE
(1) (2) (3) (4) CSR -0.004* -0.008*** -0.015 -0.037* (0.002) (0.003) (0.015) (0.021) Advertising 0.121** 0.706 *CSR (0.055) (0.443) Observations 7222 6085 7228 6112 R-squared 0.26 0.24 0.53 0.49 Notes: log of one plus the ratio of market to book is the dependent variable in models (1) and (2); return on assets is the dependent variable in models (3) and (4). CSR is the sum of KLD's four community strength indicator variables. Advertising is the median of advertising expenditure to sales at for each 4-digit SIC code during 1990-2000. All models include log(Sales) as a control, with slope changes allowed at quartiles, industry fixed effects at the 4-digit SIC level, and year fixed effects. Robust standard errors in parentheses, clustered at the company level. * significant at 10%; ** significant at 5%; *** significant at 1%

32
TABLE 4
THE ROLE OF PRODUCT MARKET COMPETITION (1) (2) (3) (4) (5) (6) CSR 0.004 0.006* 0.009 0.047 0.030 0.071 (0.007) (0.003) (0.009) (0.049) (0.023) (0.066) HHI*CSR -0.010** -0.009* -0.061* -0.055* (0.005) (0.005) (0.033) (0.031) Ind_av_CSR -0.013*** -0.008 -0.060*** -0.037 *CSR (0.003) (0.005) (0.020) (0.041)
Observations 2276 7222 2276 2275 7228 2275 R-squared 0.24 0.26 0.24 0.48 0.53 0.48 Notes: ROA is the dependent variable in models (1) and (2); log of Q is the dependent variable in models (3) and (4). CSR is the sum of KLD's four community strength indicator variables. Advertising is the median of advertising expenditure to sales at for each 4-digit SIC code during 1990-2000. Ind_av_CSR is the average of the value of CSR for each 4-digit SIC code in each year. All models include log(Sales) as a control, with slope changes allowed at quartiles, industry fixed effects at the 4-digit SIC level, and year fixed effects. Robust standard errors in parentheses, clustered at the company level. * significant at 10%; ** significant at 5%; *** significant at 1%

33
TABLE 5 THE IMPORTANCE OF CORPORATE GOVERNANCE
(1) (2) (3) (4) (5) (6) CSR -0.003 -0.005 -0.012** -0.003 -0.030 -0.015 (0.004) (0.003) (0.006) (0.025) (0.023) (0.041)
Outside Blocks -
0.058*** -
0.431*** (0.015) (0.108) Outside Blocks -0.006 -0.157 *CSR (0.019) (0.134) Affiliated Entity Blocks -0.024 0.004 (0.036) (0.258) Affiliated Entity Blocks 0.118** 1.121*** *CSR (0.058) (0.370) Governance 0.010 0.186** (0.010) (0.073) Governance 0.018 -0.017 *CSR (0.012) (0.088) Observations 2690 2690 6223 2709 2709 6231 R-squared 0.34 0.33 0.27 0.64 0.64 0.56 Notes: ROA is the dependent variable in models (1) - (3); log of Q is the dependent variable in models (4) - (6). CSR is the sum of KLD's four community strength indicator variables. Outside Block is the fraction of shares held by outside blockholders. Affiliated Entities is the fraction of shares held by individuals, trusts or companies whose voting is influenced by an officer or director. It is essentially hedge funds and VC funds. Governance is the headcount of 24 corporate governance statutes. Models (3) and (6) use data from 1990-2001; all other models use data from 1996-2001. All models include log(Sales) as a control, with slope changes allowed at quartiles, industry fixed effects at the 4-digit SIC level, and year fixed effects. Robust standard errors in parentheses, clustered at the company level. * significant at 10%; ** significant at 5%; *** significant at 1%