r graphics examples - github pages
TRANSCRIPT

R graphics examples

3D Surface Plots
Plot of fitness (z axis) for two principal component traits (PC1 and PC2)
persp() function (base R)Published inIJPS (2010)

Multiple plots
Pairwise regressions
lattice packagePublished inEvolution (2011)

GIS/Mapping
World climate data (white, orange green) and sample sites (blue dots) from garlicmustard.org
dismo, raster, rgdal, maptools, leap packages

Multi-panel simulation model
Fitness surfaces (smooth curves) with simulated genotypes (dots) and Lande-Arnold selection gradients (green curve)
ggplot2 package Published inPRSB (2010)
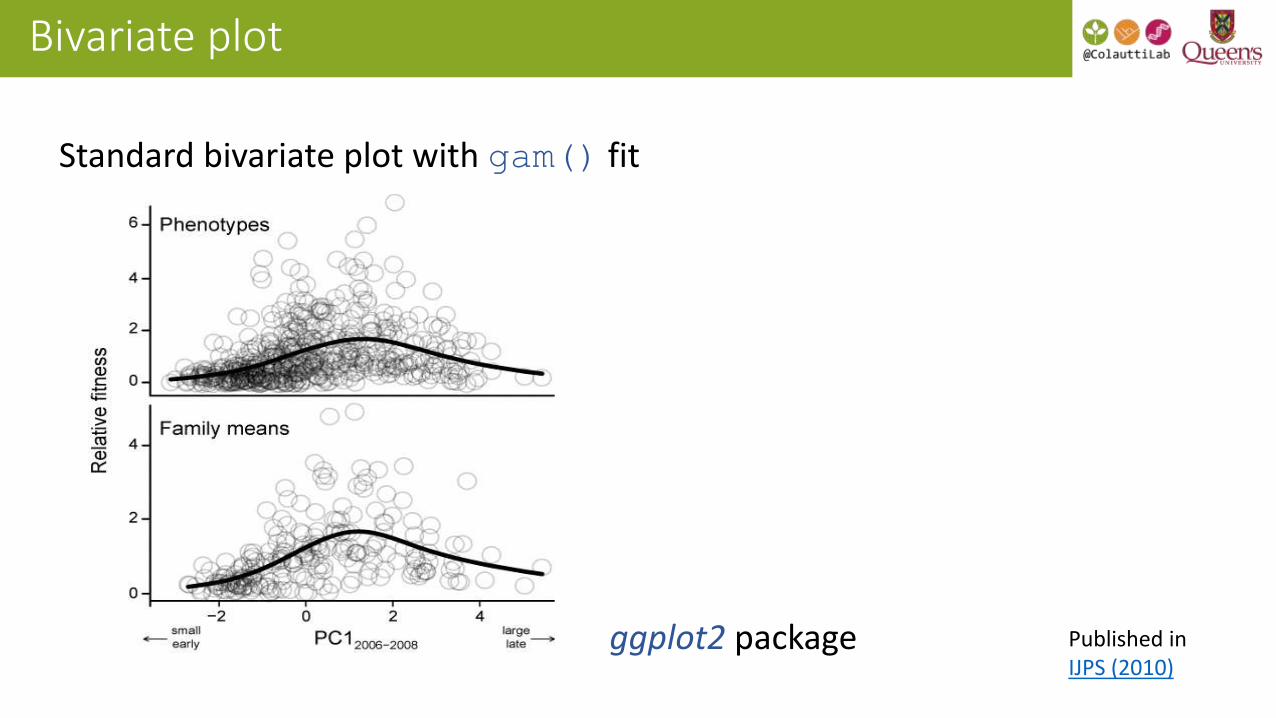
Bivariate plot
Standard bivariate plot with gam() fit
ggplot2 package Published inIJPS (2010)

Multi-panel plots of means + 95% C.I.
Standardized effect sizes testing different hypotheses for individual species (circles) or meta-analyses of many species (triangles). Lines show 95% C.I.
ggplot2 package Published inScience (2013)
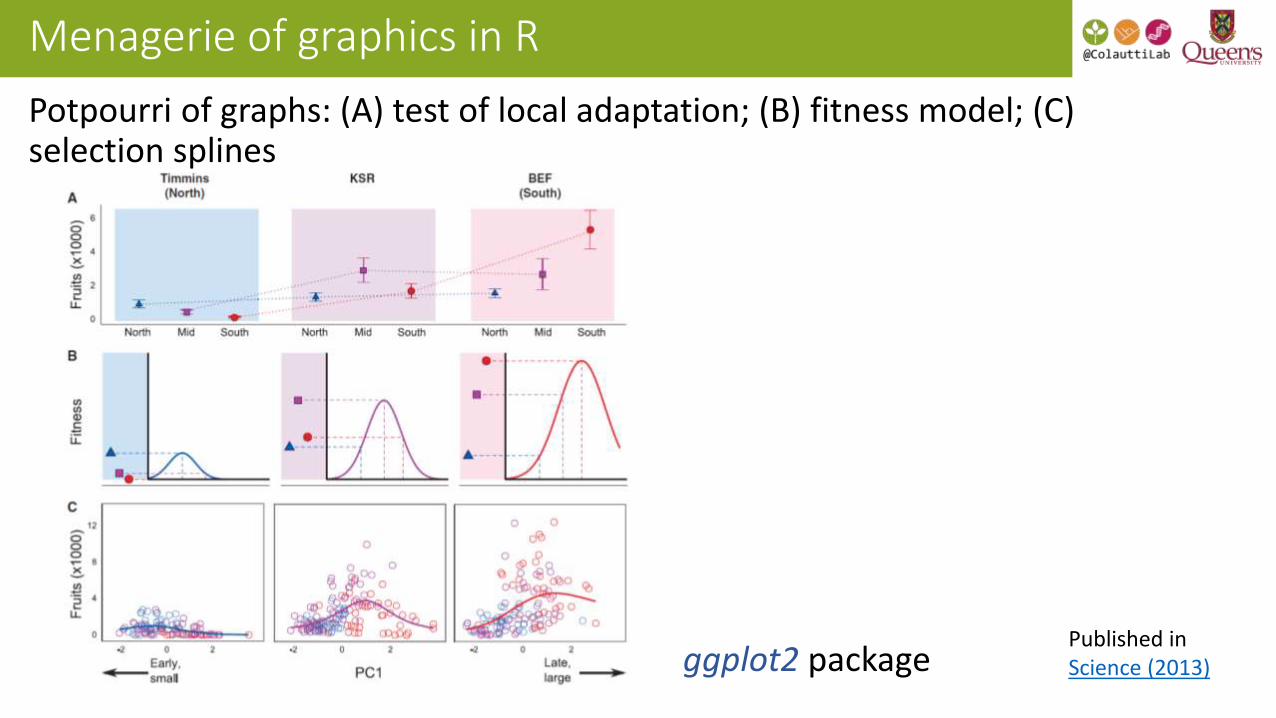
Menagerie of graphics in R
Potpourri of graphs: (A) test of local adaptation; (B) fitness model; (C) selection splines
ggplot2 packagePublished inScience (2013)
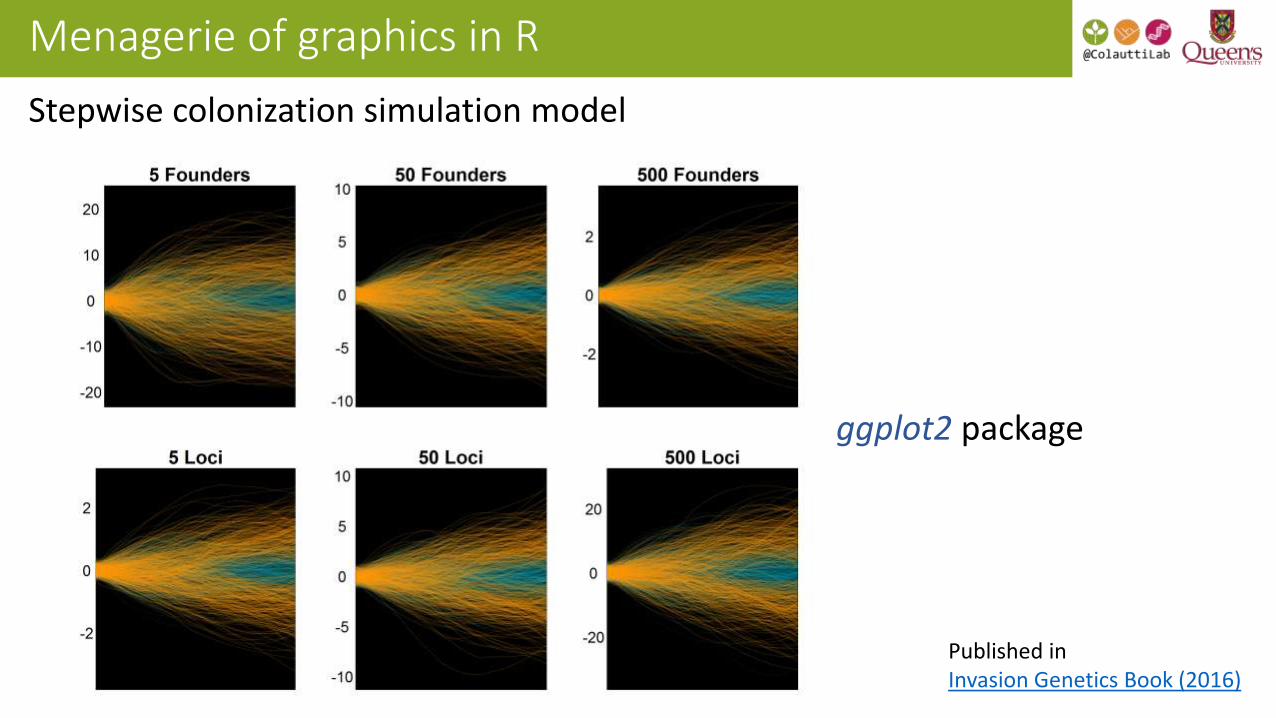
Menagerie of graphics in R
Stepwise colonization simulation model
ggplot2 package
Published inInvasion Genetics Book (2016)

Graphics Design Inspiration
http://www.davidmccandless.com/
http://coolors.co/
https://color.adobe.com/
http://idl.cs.washington.edu/
R Graphics Concepts
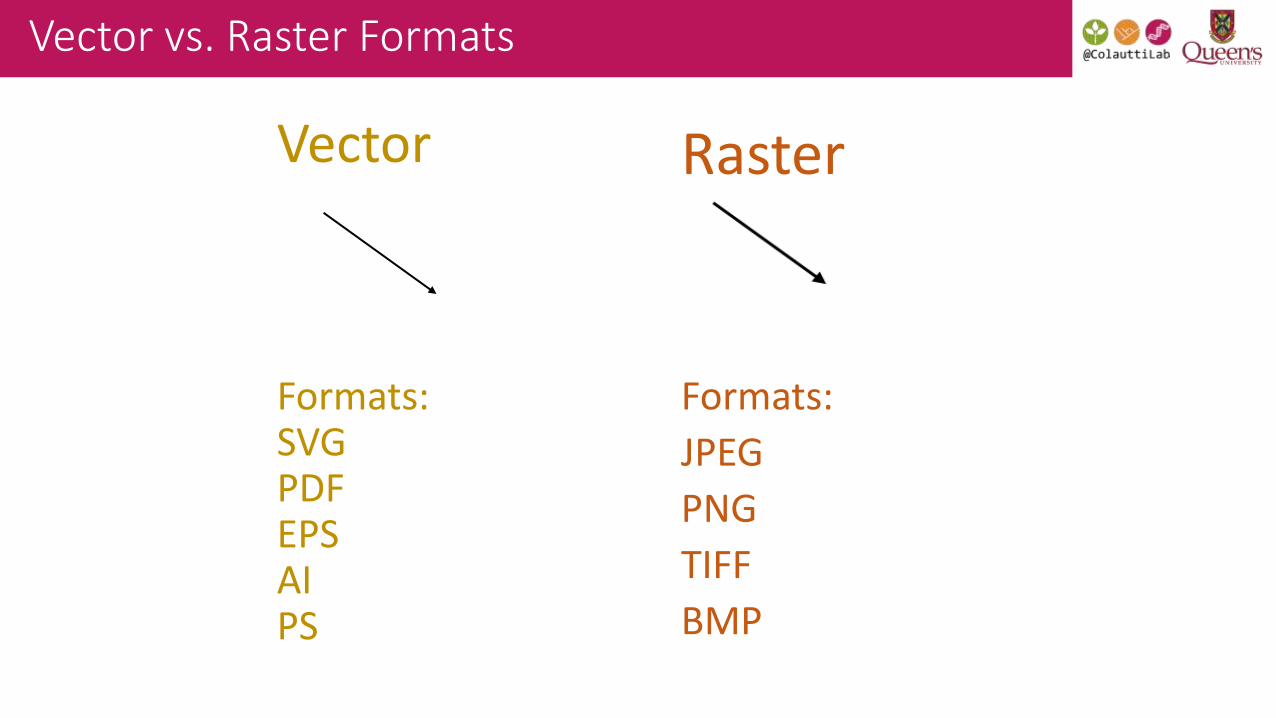
Vector vs. Raster Formats
Vector Raster
Formats:SVGPDFEPSAIPS
Formats:
JPEG
PNG
TIFF
BMP
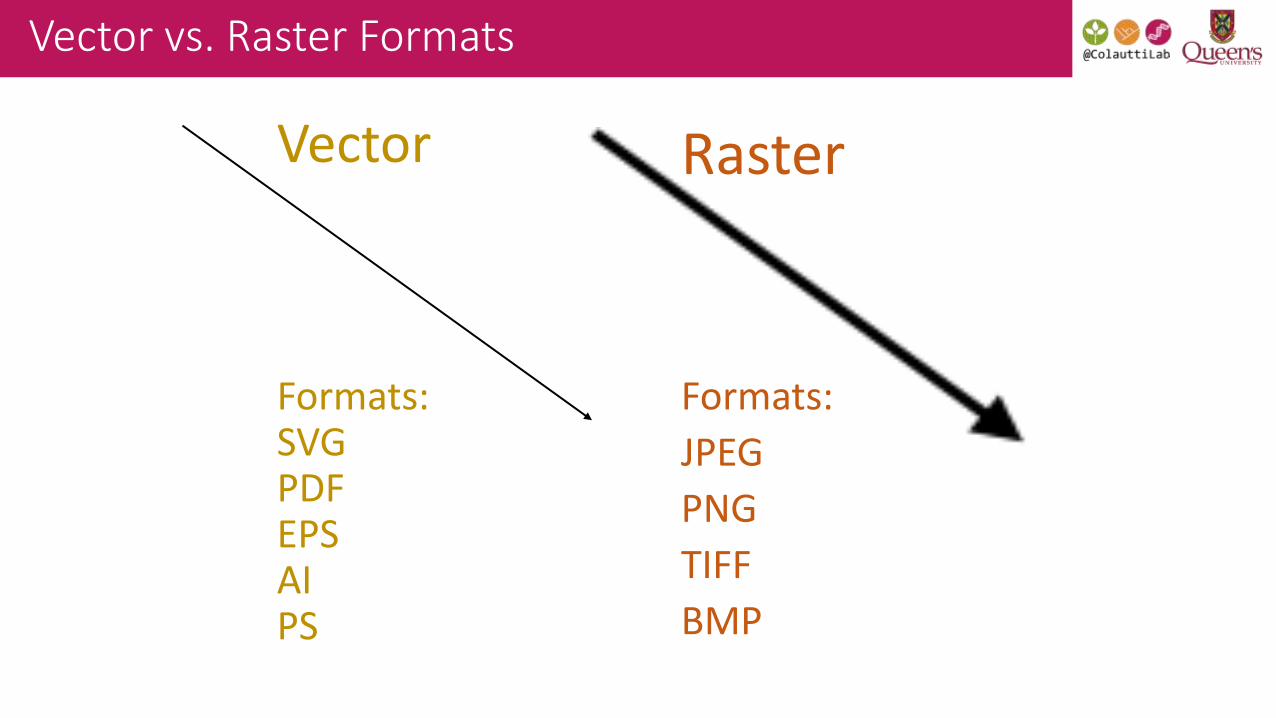
Vector vs. Raster Formats
Vector Raster
Formats:SVGPDFEPSAIPS
Formats:
JPEG
PNG
TIFF
BMP

Changing formats
Vector Raster
Easy, no loss of information
Hard – which pixels to keep?
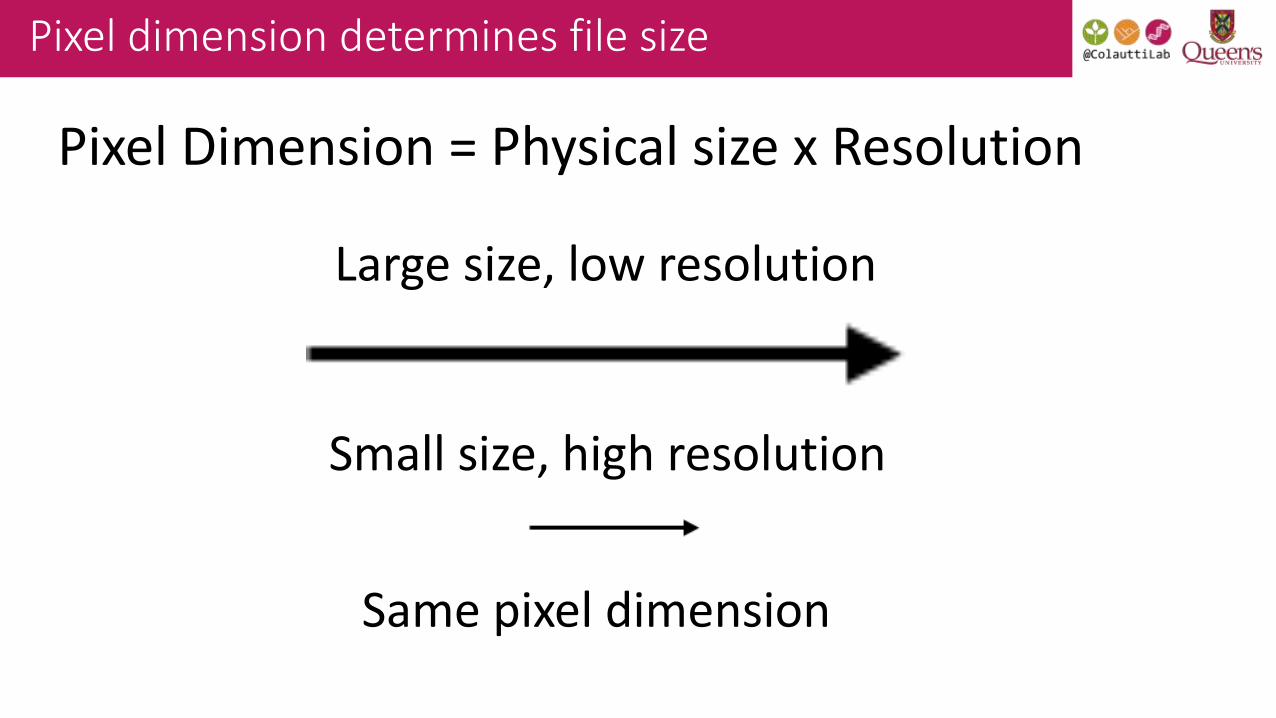
Pixel dimension determines file size
Pixel Dimension = Physical size x Resolution
Same pixel dimension
Large size, low resolution
Small size, high resolution

RGB (screen) vs CMYK (print)
Screen Print
Haddock & Dunn (2010)

Useful graphics software
DON'T USE POWERPOINT FOR PUBLICATION
Paid software:
•Adobe Photoshop (pixels)
•Adobe Illustrator (vectors)
FREE Software:
•GIMP (pixels)
• Inkscape (vectors)
http://www.gimp.org/
https://inkscape.org/en/

EBImage for Image Analysis in R
Bioconductor: bioinformatics tools in Rhttp://www.bioconductor.org/packages/release/bioc/html/EBImage.html
EBImage – R-based image processinghttp://www.bioconductor.org/packages/release/bioc/html/EBImage.html
Quick EBImage intro tutorial:http://www.bioconductor.org/packages/release/bioc/vignettes/EBImage/inst/doc/EBImage-introduction.pdf
Full documentation:http://www.bioconductor.org/packages/release/bioc/manuals/EBImage/man/EBImage.pdf
ggplotAnd the grammar of graphics

Grammar of graphics
geom(e.g. point, histogram, boxplot)x =y =colour = size = …
coord
++
data

ggplot2 ‘grammar’
data
– any information you want to plot
geoms
– geometric objects (lines, points, polygons)
coord
– coordinate system of the graph (e.g. Cartesian, polar, lat/long)
ggplot2 ‘grammar’
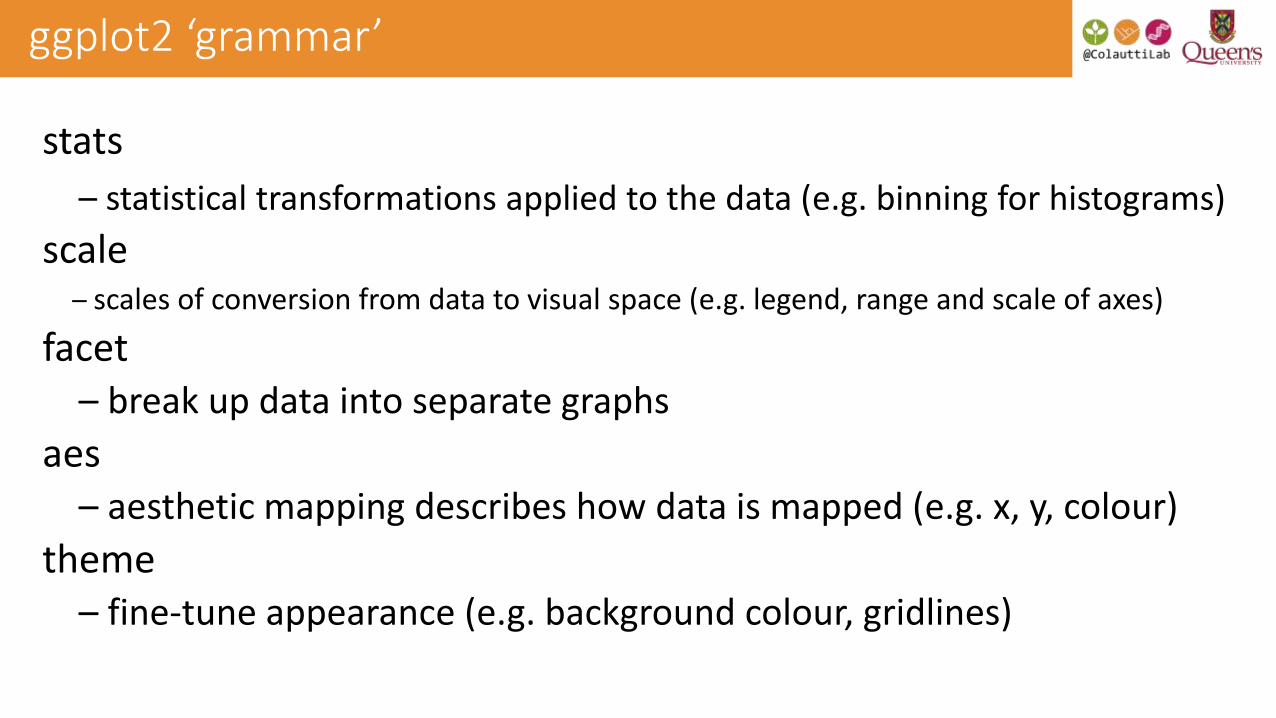
stats
– statistical transformations applied to the data (e.g. binning for histograms)
scale– scales of conversion from data to visual space (e.g. legend, range and scale of axes)
facet – break up data into separate graphs
aes– aesthetic mapping describes how data is mapped (e.g. x, y, colour)
theme– fine-tune appearance (e.g. background colour, gridlines)

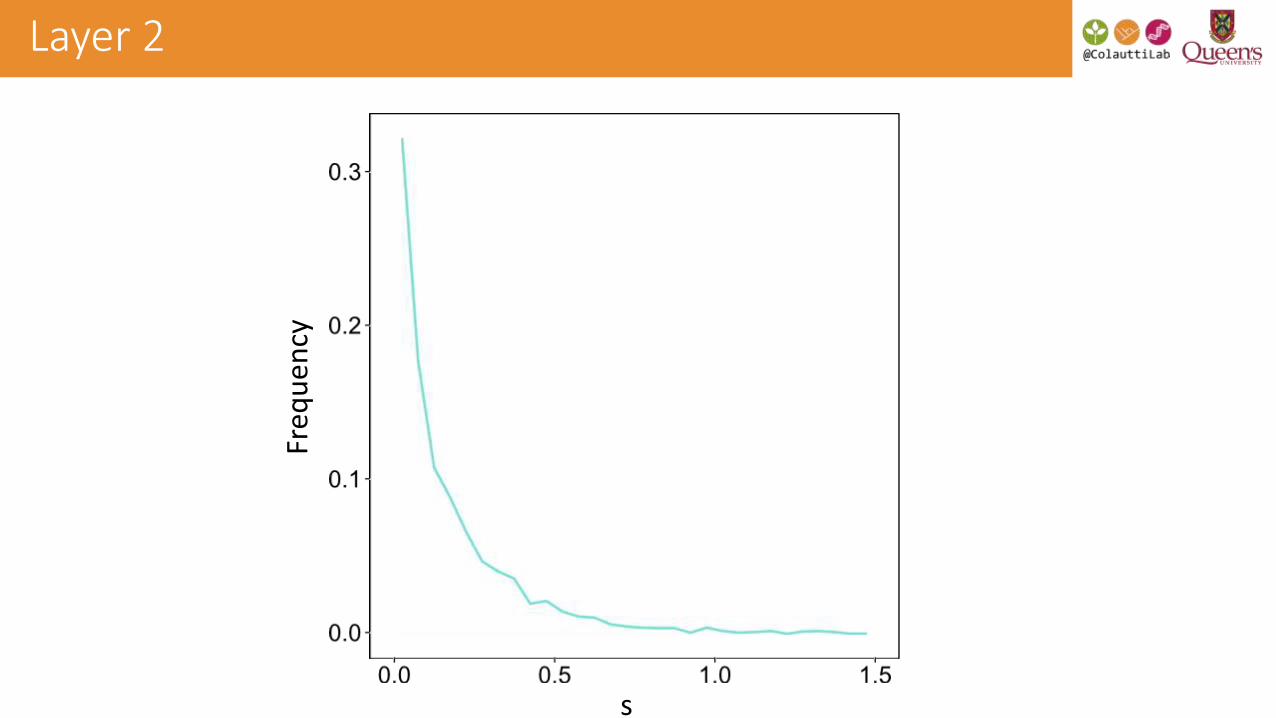
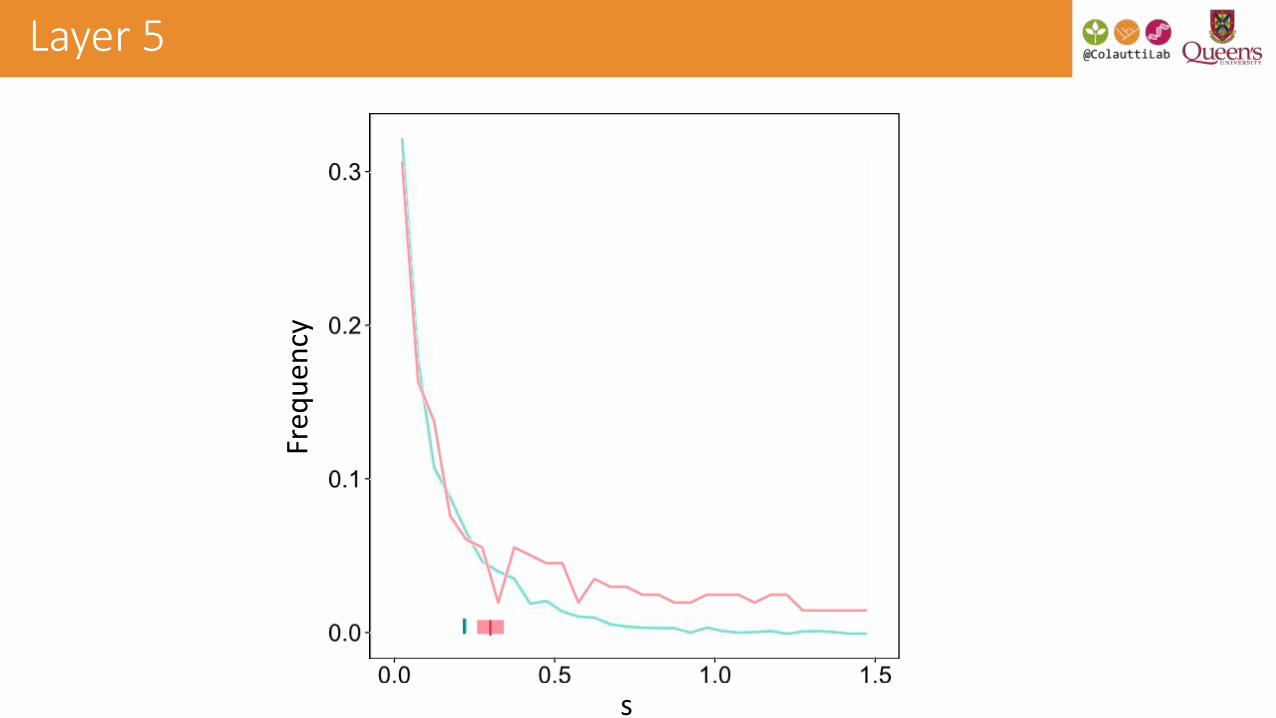
Think of R graphics as ‘layers’…

s
Freq
ue
ncy
Layer 1
s
Freq
ue
ncy
Layer 2

s
Freq
ue
ncy
Layer 3

s
Freq
ue
ncy
Layer 4
s
Freq
ue
ncy
Layer 5
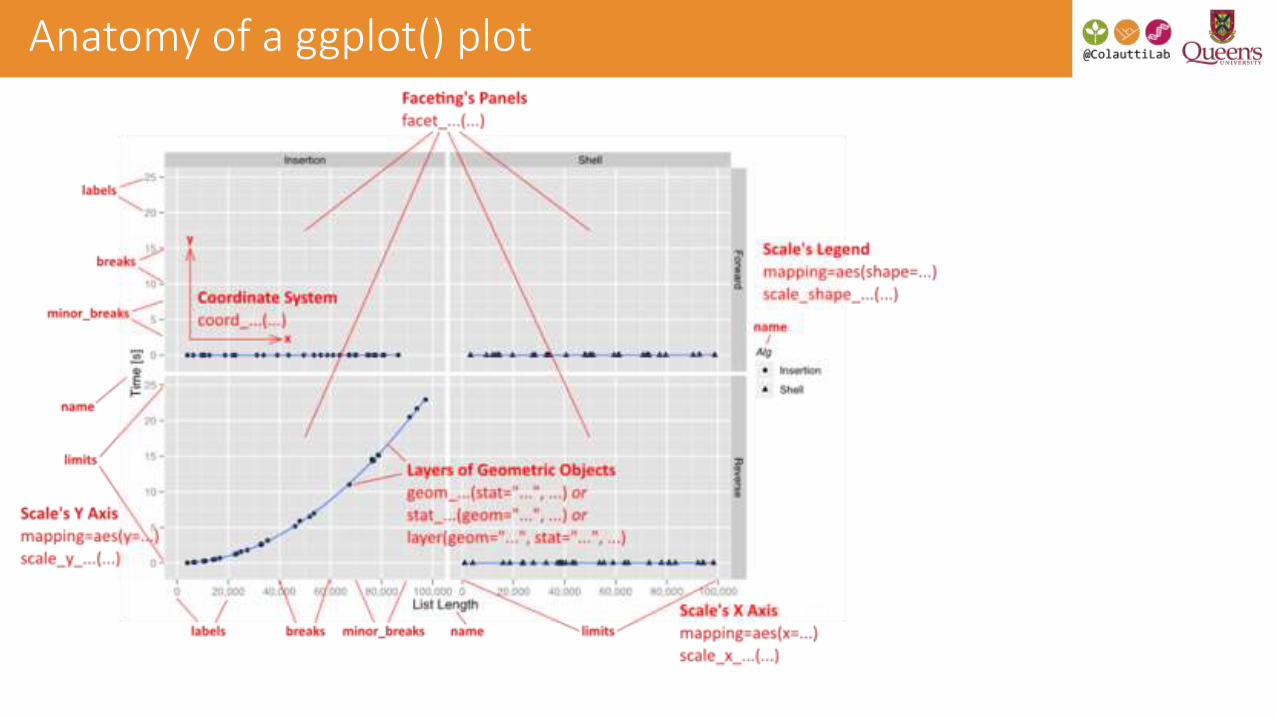
Anatomy of a ggplot() plot

Geom list