r-ras2 overexpression in tumors of the human central...
TRANSCRIPT

R-RAS2 overexpression in tumors of the humancentral nervous systemGutierrez-Erlandsson et al.
Gutierrez-Erlandsson et al. Molecular Cancer 2013, 12:127http://www.molecular-cancer.com/content/12/1/127

Gutierrez-Erlandsson et al. Molecular Cancer 2013, 12:127http://www.molecular-cancer.com/content/12/1/127
RESEARCH Open Access
R-RAS2 overexpression in tumors of the humancentral nervous systemSylvia Gutierrez-Erlandsson1†, Pedro Herrero-Vidal2†, Marcos Fernandez-Alfara2, Susana Hernandez-Garcia1,Sandra Gonzalo-Flores2, Alberto Mudarra-Rubio2, Manuel Fresno2 and Beatriz Cubelos2*
Abstract
Malignant tumors of the central nervous system (CNS) are the 10th most frequent cause of cancer mortality. Despitethe strong malignancy of some such tumors, oncogenic mutations are rarely found in classic members of the RASfamily of small GTPases. This raises the question as to whether other RAS family members may be affected in CNStumors, excessively activating RAS pathways. The RAS-related subfamily of GTPases is that which is most closelyrelated to classical Ras and it currently contains 3 members: RRAS, RRAS2 and RRAS3. While R-RAS and R-RAS2 areexpressed ubiquitously, R-RAS3 expression is restricted to the CNS. Significantly, both wild type and mutated RRAS2(also known as TC21) are overexpressed in human carcinomas of the oral cavity, esophagus, stomach, skin andbreast, as well as in lymphomas. Hence, we analyzed the expression of R-RAS2 mRNA and protein in a wide varietyof human CNS tumors and we found the R-RAS2 protein to be overexpressed in all of the 90 CNS cancer samplesstudied, including glioblastomas, astrocytomas and oligodendrogliomas. However, R-Ras2 was more stronglyexpressed in low grade (World Health Organization grades I-II) rather than high grade (grades III-IV) tumors,suggesting that R-RAS2 is overexpressed in the early stages of malignancy. Indeed, R-RAS2 overexpression wasevident in pre-malignant hyperplasias, both at the mRNA and protein levels. Nevertheless, such dramatic changes inexpression were not evident for the other two subfamily members, which implies that RRAS2 is the main factortriggering neural transformation.
Keywords: RAS family proteins, R-RAS2, CNS tumors, TC21
BackgroundThe RAS family of small GTPases is comprised of 36genes that encode 37 proteins. It is classified into 21 sub-families, of which only genes in the classic RAS subfam-ilies (HRAS, NRAS and KRAS) and RRAS2 have been seento carry mutations in human cancers [1]. RRAS2 (alsoknown as TC21) is a member of the RAS-Related (RRAS)subfamily, which also includes RRAS (referred to hence-forth as RRAS1) and RRAS3 (also known as MRAS) [2]. Ofthe 3 members of this subfamily, R-RAS2 is the most simi-lar to classic RAS (55-60% protein identity) [3] and thisgene has been shown to be mutated in a leiomyosarcomacell line, a breast cancer cell line, as well as in ovarian car-cinoma [4-7]. However, overexpression of the wild type
* Correspondence: [email protected]†Equal contributors2Centro de Biología Molecular Severo Ochoa, Departamento de BiologíaMolecular, Universidad Autónoma de Madrid, Madrid 28049, SpainFull list of author information is available at the end of the article
© 2013 Gutierrez-Erlandsson et al.; licensee Biothe Creative Commons Attribution License (htdistribution, and reproduction in any medium
form of R-RAS2 has also been frequently detected in car-cinomas of the breast, skin, esophagus, stomach and oralcavity. Furthermore, RRAS2 is the only RAS family mem-ber besides classical RAS that can transform NIH-3 T3cells. Hence, there is strong evidence that RRAS2 may beinvolved in the transformation related to different types ofcancer [8-11].The role of R-RAS2 in normal tissue has been studied in
RRas2−/− mice, which are lymphopenic due to defects inthe proliferation and survival of both T and B cells [12].Interestingly, while mice heterozygous for the null muta-tion (RRas2+/−) express 50% of the protein found in wildtype mice, they are phenotypically more similar to the nullknockout mice than to wild type controls [13]. In conjunc-tion with the frequently observed overexpression of wildtype R-RAS2 in human cancer, these observations suggestthat the expression of the R-RAS2 must be tightly regu-lated during normal tissue development and homeostasis.
Med Central Ltd. This is an open access article distributed under the terms oftp://creativecommons.org/licenses/by/2.0), which permits unrestricted use,, provided the original work is properly cited.

Gutierrez-Erlandsson et al. Molecular Cancer 2013, 12:127 Page 2 of 11http://www.molecular-cancer.com/content/12/1/127
The switch I and II effector domains of R-RAS2 areidentical to those of classical RAS [3], indicating that R-RAS2 may also act in the pathways activated by classicalRAS [14]. However, while classic RAS exerts its pro-proliferative activity via the activation of the Raf-ERKpathway of MAP kinases, R-RAS2 appears to activatethis pathway poorly as it does not recruit Raf1 [15], al-though it is a strong activator of the PI3K pathway[16,17].In the USA, malignant tumors are diagnosed in the
central nervous system (CNS) of 6.6 out of every 100,000individuals each year, affecting mostly children and theelderly. In developed countries they are associated with amortality of 2.7 per 100,000 men and women each year,the 10th most frequent cause of mortality due to cancer[18]. Although some of these tumors are very malignant,mutations in classic RAS members are rare, even thoughthe activity of RAS effectors like PI3K may be enhanced[19-21]. Indeed, since mutations in classic RAS genes, spe-cifically in NRAS [22], were only detected in 2 out of 94glioblastomas studied, we investigated whether the expres-sion of other RAS family members may be altered in hu-man CNS tumors. Accordingly, we studied the expressionof R-Ras2 mRNA and protein in a wide variety of humanCNS tumors. R-RAS2 was overexpressed in samples of288 different human CNS cancers, including glioblast-omas, astrocytomas and oligodendrogliomas. However,R-Ras2 was more strongly expressed in low-grade (gradesI-II) tumors rather than in high grade tumors (III-IV),suggesting that R-RAS2 is overexpressed in the earlystages of malignancy.
MethodsWestern blottingBrain tissue samples were homogenized in 1 ml of lysisbuffer (50 mM Tris [pH 8], 150 mM NaCl, 1% NP40and a protease inhibitor cocktail [Sigma-Aldrich, USA]),incubated on ice for 45 minutes and centrifuged at11,000 rpm. The protein concentration of the lysate wasmeasured by spectrophotometry, and the proteins werethen resolved on 15% SDS-PAGE gels (80 μg/well) andtransferred to a nitrocellulose membrane. The mem-brane was probed overnight at 4°C with a specific rabbitantiserum against R-Ras2 (1:1000) purified with a GST-R-Ras2 fusion protein [12]. The GST-RRAS2 fusion pro-tein was generated by the insertion of a cDNA encodingRRAS2 into the pGEX-4 T3 vector as recommended bythe manufacturer (Pharmacia). Antibody binding wasdetected using a horseradish peroxidase-conjugated anti-rabbit immunoglobulin G (GE Healthcare UK), whichwas visualized by chemiluminescence (BioRad Labora-tories, California, USA) after washing 3 times with 1%TBS Tween buffer and by exposure of the membrane toX-ray film.
R-RAS2 expressionR-RAS2 expression was assessed in the commercial BrainTumor Screen (CC17-11-004: n = 200) and Brain Me-dulloblastoma (CC17-11-002: n = 60) tissue microarrays(Cybrdi). The arrays were equilibrated in 0.3 M NaCl,0.1 M Tris–HCl [pH 7.4] containing 1% (v/v) newborncalf serum and then probed at 4°C overnight with the spe-cific anti-α-R-RAS2 antibody (1:100). After washing thor-oughly, antibody binding was detected with a biotinylateddonkey anti-rabbit IgG (1 h) and then with a streptavidin-biotinylated horseradish peroxidase complex (1 h). The ar-rays were again washed and they were then incubated fora further 6 minutes in 0.1 M sodium phosphate in thepresence of H2O2 (0.1 mg/ml) and diaminobenzidine(0.5 mg/ml), producing a colorimetric reaction that wasstopped by adding 0.1 M sodium phosphate.
Sample quantificationThe expression of R-RAS2 in immunohistochemical (IHC)images was evaluated by calculating the integrated densityof DAB in four equal and representative regions of interestin each sample using ImageJ 1.44c analysis software [23]The integrated density calculation represents the sum ofthe values of the pixels in the image or selection, which isequivalent to the product of the area and the mean gray-scale value. For RGB images, the mean is calculated byconverting each pixel to an 8-bit grayscale using the for-mula gray = (red + green + blue) ⁄ 3. The average densitymeasurements of the samples were compared with thoseobtained from the controls and the results were expressedas a percentage of the corresponding control. Each samplewas assessed by 5 independent evaluators.
RT-qPCRRNA samplesA total of 32 human samples, including normal and braincancer tissue samples, were analyzed to assess the expres-sion of the genes of interest. The cancer tissues represented4 different clinical stages and where possible, mixed ages,genders and ethnic groups. Total RNA was isolated fromthe selected tissue using Cytomyx (HBRT102, Lexington,MA) and it was subjected to stringent quality control. Thehigh-quality total RNA obtained by Cytomyx was sent toOriGene Technologies, who generated 1st strand cDNAthat was subsequently reverse transcribed using an oligo-dT primer. The complementary DNAs (cDNAs) were syn-thesized using a protocol optimized to generate long andrare cDNAs, and to eliminate genomic DNA contamin-ation. These cDNAs were transferred into Tissue qPCRArray plates containing dried, PCR-ready, first-strandcDNAs (Brain Cancer cDNA Array I from OriGeneTechnologies).

Gutierrez-Erlandsson et al. Molecular Cancer 2013, 12:127 Page 3 of 11http://www.molecular-cancer.com/content/12/1/127
qPCRPCR was performed in intron-spanning assays using theprimers RRAS1 (ENSG00000126458; Fw 5′-GGCAGATCTGGAGTCACAGC-3′, Rv 5′-ACGTTGAGACGCAGTTTGG-3′) and RRAS3 (ENSG00000158186; Fw 5′- CAGCTTTGAGCACGTGGA-3′, Rv 5′- CGAGGATCATCGGGAATG-3′), designed using Probe Finder software (RocheApplied Science, https://www.roche-applied-science.com/sis/rtpcr/upl/index.jsp). Specific intron-spanning primersfor RRAS2 (ENSG00000133818; Fw 5′-AGCACGGCAGCTTAAGGTAA-3′, Rv 5′-CTTTCCGTGTTGGTTCTGGT-3′)were designed using Primer Express 2.0 software (AppliedBiosystems). The specificity of each assay was determinedby performing a BLAST search. A non-intron spanningassay was prepared by OriGene Technologies using primersdesigned against the Homo sapiens β-actin (ACTB) se-quence (NCBI accession # NM_001101). RRAS1 andRRAS3 were provided by Sigma Aldrich, RRAS2 byInvitrogen and ACTB by OriGene Technologies.The qPCR reactions were performed manually as indi-
cated by OriGene, except that the lyophilized cDNA wasdiluted in twice the suggested volume of water (to evaluate2 genes per plate instead of 1) and the reactions weretransferred to a 384-well plate. The remaining reagentswere added in the suggested proportions and qPCR wasperformed on an ABI 7900HT Fast Real-Time PCR Sys-tem (Applied Biosystems), using Sybr green as a fluo-rescent dye for detection. Relative gene expression wasnormalized to ACTB expression according to the 2-ΔΔCt
method (Livak & Schmittgen, 2001), as suggested byOriGene Technologies. This approach reduced the disper-sion of the expression data within the biological groupsand validated this approach. The qPCR data was analyzedwith GenEx Professional 5.3.7 software (MultiD, Sweden).
Statistical analysesAll results are expressed as the mean ± standard deviation(SD). The experimental groups were compared using atwo-sample Student’s t-test. To corroborate these statis-tical differences, we performed an additional ANOVA test,assembling the samples in groups according to tumortype. The Student’s t-test and ANOVA p values are indi-cated in the figure legends.
Exclusion criteriaSamples exhibiting necrosis or more than 20% contam-ination with normal tissue were excluded from the ana-lyses (C2, C9, C10, D7, D8, D9, D10, E11, E12, F4, F6and F7 from Brain Cancer cDNA Array, sample number178 from CC17-11-004 Array, and samples 13, 14 and15 from CC17-01-002 Array). The tumors for which thedegree of malignancy was not established were also ex-cluded from the study (F8, F9, F10, F11 and F12 fromBrain Cancer cDNA Array). Similarly, the samples whose
values had a mean deviation +/− 2SD were also elimi-nated from the study (C4, C11, D1, E1 and E12 fromBrain Cancer cDNA Array; samples numbers 22, 37, 38,75, 85, 150 and 152 from CC17-01-002 Array). Theremaining samples were all included in the study.
ResultsExpression of the R-RAS2 protein in human CNS tumorsWe analyzed the expression of R-RAS2 in 199 human CNStumor samples from 105 patients, with a wide range oftumor types (Table 1a). The expression of the R-RAS2protein was assessed by immunohistochemistry using thepolyclonal antiserum described previously, the specificity ofwhich was confirmed by immunoblotting total brainhomogenates of wild type and RRas2−/− mice (Additionalfile 1: Figure S1c). R-RAS2 was overexpressed in all cancertypes and grades when compared to the 23 normal braintissue samples taken from patients (Figure 1, Additional file1: Figure S1a and Additional file 2: Figure S3). Densitomet-ric quantification revealed R-RAS2 protein expression to bebetween 3- and 7-fold higher in malignant tissue (n = 170)than in normal brain tissue (n = 23), although R-RAS2overexpression appeared to be inversely correlated withthe tumor grade for all the tumor types analyzed. Thus,R-RAS2 was overexpressed approximately 8-fold more ingrade III glioblastomas (n = 13) when compared to normaltissue, while only a 4-fold increase in expression wasobserved in grade IV tumors (n = 15: Figure 1). Likewise,R-RAS2 expression increased 5-fold in grade I-II astrocyto-mas but only 3-fold in grade III astrocytomas. Finally,R-RAS2 expression increased approximately 7-fold in gradeI-II oligodendrogliomas (n = 9) and 4-fold in grade III tu-mors (n = 4). Interestingly, R-RAS2 protein overexpressionwas also associated with non-malignant hyperplasia in thebrain (Figure 1 and Additional file 2: Figure S3). Together,these results suggest that R-RAS2 is overexpressed in awide variety of brain tumors, yet more intensely in pre-malignant conditions. Moreover, R-RAS2 overexpression isalso more pronounced in lower grade tumors than in high-grade glioblastomas, astrocytomas and oligodendrogliomas(Figure 1, Additional file 1: Figure S1a and Additional file 2:Figure S3).An analysis of RRAS2 expression in a second array of
highly malignant CNS tumors, 57 samples from 19 pa-tients (Table 1b), also revealed R-RAS2 overexpression ingrade IV medulloblastomas (n = 18), cerebromas (n = 9),meningioma (n = 11), ependymomas (n = 3) and undiffe-rentiated (n = 15) tumors (Figure 2 and Additional file 1:Figure S1b). Significant differences in R-RAS2 expressionwere observed depending of the type and origin of thetumor, with the strongest R-RAS2 expression detected inmedulloblastomas and the weakest in undifferentiatedependymoma (Figure 2).

Table 1 Samples obtained from a commercial brain
Histo-Pathology Grade1 Patients Samples Mean age Men (%)
a) Clinicopathologic data of 193 human CNS samples
Brain tissue - 13 23 35,3 ± 19,2 38,5
Hyperplasia - 2 3 34,7 ± 8,1 50
Mixed glioma - 2 4 41 ± 3,5 100
Glioblastoma III 7 13 60,5 ± 14,4 85,7
IV 9 15 49,5 ± 16,9 66,6
Astrocytoma I 32 59 37,6 ± 10,3 69,6
II 28 54 43,5 ± 14,2 60,7
III 5 9 44,4 ± 7,3 20
Oligodendroglioma I-II 2 4 29,5 ± 0,6 50
II-III 3 5 57,4 ± 15,1 100
III 2 4 42,5 ± 11 100
b) Clinicopathologic data of 56 human CNS tumor samples
Medulloblastoma IV 6 18 8,8 ± 5 66,6
Cerebroma IV 3 9 26,6 ± 16,9 33,3
Meningioma IV 4 11 40 ± 9,5 75
Ependymoma IV 1 3 14 ± 0 100
Undifferenciated IV 5 15 11,2 ± 4 60
Histo-Pathology Grade1 Patients Mean age Men (%)
c) Clinicopathologic data of 32 human CNS samples
Brain tissue - 1 55 0
Hyperplasia - 1 45 ± 0 100
Astrocytoma I 1 27 ± 0 0
II 2 39,5 ± 19,1 50
III 3 35 ± 4,6 100
Oligoastrocytoma II 1 37 ± 0 0
III 1 41 ± 0 100
Oligodendroglioma II 1 33 ± 0 100
III 3 45,3 ± 5,1 0
Ependymoma III 1 49 ±0 0
Meningioma I 13 53,8 ± 13,6 38,5
II 4 61 ± 11,2 501Classified according to the WHO criteria.
Gutierrez-Erlandsson et al. Molecular Cancer 2013, 12:127 Page 4 of 11http://www.molecular-cancer.com/content/12/1/127
Overexpression of RRAS2 mRNA in human brain tumorsRRAS2 overexpression in human CNS tumors was con-firmed by RT-qPCR in tissue samples from 32 patients(Table 1c). In different brain tumor types, RRAS2 mRNAexpression was 2- to 22-fold higher than in normal tissue(Figure 3a). The highest levels of expression were found ingrade II astrocytomas (22-fold increase, n = 2), whereas 4-fold increases were detected in grade III astrocytomas (n =3), confirming that RRAS2 is more strongly overexpressedin lower-grade tumors. RRAS2 mRNA overexpression wasalso detected in pre-malignant hyperplasia (a 16-fold in-crease, n = 1: Figure 3a and Additional file 3: Figure S2). Theonly exception was a grade I astrocytoma sample in which
low RRAS2 mRNA levels were detected (n = 1), althoughthis may have been due to misclassification. even thoughthe number of mRNA samples classified by tumor type wasnot sufficiently high to generate statistically significant dif-ferences, the mRNA expression data supported the proteinexpression results. However, when the tumors were groupedtogether in function of their degree of malignancy (grade I,n = 13; grade II, n = 8; and grade III, n = 8) statistically sig-nificant differences in expression were observed (Figure 3d).
Confirmation of R-RAS2 expression in western blotsWe analyzed the expression of R-RAS2 in western blotsof low grade (n = 5) and high grade (n = 5) malignant

Brain tissue
Hyperplasia
Glioblastoma III
Glioblastoma IV
Astrocytoma I
Astrocytoma II
Astrocytoma III
Oligodendroglioma I
Oligodendroglioma II
Oligodendroglioma III
Grade
Rel
ativ
e R
Ras
2 ex
pres
sion *
******10
Nor
mal
Hyp
erpl
asia
Glio
blas
tom
aA
stro
cyto
ma
Olig
oden
drog
liom
a
8
6
4
2
0
Figure 1 R-RAS2 protein expression in human CNS tumors. Samples were obtained from the commercial Brain Tumor Screen tissuemicroarray (CC17-11-004). Cryostat sections of human brain tissue (from normal brain, hyperplasias, glioblastoma grade III or IV, astrocytomagrades I, II or III, and oligodendroglioma grades I, II or III) were analyzed by immunostaining with antibodies against R-RAS2, and they werecounterstained with hematoxylin and eosin. A quantitative analysis of R-RAS2 expression was performed for each brain tumor subtype,normalizing the R-RAS2 values to the levels expressed in normal tissue. R-RAS2 protein expression is represented as the diaminobenzidineabsorbance, which reflects the presence of the protein in the samples. Student’s t-test *p < 0.05, **p < 0.0005, ***p < 0.00005. ANOVA p < 0.00001.Scale bars = 50 μm.
Gutierrez-Erlandsson et al. Molecular Cancer 2013, 12:127 Page 5 of 11http://www.molecular-cancer.com/content/12/1/127
astrocytomas (Table 2). The results obtained indicate theexistence of R-RAS2 overexpression associated with tumorprogression as opposed to the control tissue (n = 3). Fur-thermore, stronger expression was observed in tumors witha lower degree of malignancy (Figure 4a and b). These dataconfirm the results obtained previously by immunohisto-chemistry and RT-qPCR, where R-RAS2 was seen to be
expressed more strongly in the lower grade tumors as op-posed to the higher grade tumors (p < 0.05; Figure 4b).
In CNS tumors, R-RAS2 is the most stronglyoverexpressed gene within the R-RAS subfamilyRRAS2 gene expression was compared by qPCR with thatof the other 2 genes in this R-RAS subfamily (RRAS1 and

0
25
50
75
100
Rel
ativ
e R
Ras
2 ex
pres
sion
Medulloblastoma IV Cerebroma IV Meningioma IV
Ependymoma IV Undifferentiated IV
Medulloblastoma IV
Cerebroma IV
Meningioma IV
Ependymoma IV
Undifferentianted IV
****
Figure 2 Expression of R-RAS2 protein in tissue from highly malignant human CNS tumors. Samples were obtained from the commercialBrain Medulloblastoma tissue microarray (CC17-01-002). Cryostat sections of human brain tumor tissue from medulloblastomas, cerebromas,meningiomas, ependymomas and undifferentiated tumor tissue were immunostained with an antiserum against R-RAS2, and counterstained withhematoxylin and eosin. R-RAS2 expression is represented as the diaminobenzidine absorbance in the samples, and R-RAS2 expression in eachbrain tumor subtypes was quantified and normalized to the expression in control samples Student’s t-test *p < 0.05, **p < 0.00005. ANOVAp < 0.00001. Scale bars = 50 μm.
Gutierrez-Erlandsson et al. Molecular Cancer 2013, 12:127 Page 6 of 11http://www.molecular-cancer.com/content/12/1/127
RRAS3) in the same CNS tumor samples (n = 32). Weobserved a general increase in RRAS1 mRNA in CNS tu-mors and a decrease in RRAS3 expression in CNS tumors(Figure 3b, Additional file 3: Figure S2 and Table 3). Whenwe assessed RRAS1, RRAS2 and RRAS3 expression ac-cording to tumor type and grade (Figure 3b-d), the expres-sion of RRAS1 and RRAS2, but not that of RRAS3, wassignificantly stronger in grade I and II tumors than ingrade III tumors (p < 0.01). However, while RRAS2 over-expression in grade I tumors was 13-fold higher than innormal tissue, RRAS1 levels only experienced a 5-fold in-creased (Figure 3b-e).
DiscussionThis is the first study to demonstrate that R-RAS2 isoverexpressed in a wide variety of human CNS tumors.R-RAS2 was overexpressed in all the tumors analyzedwhen compared with normal tissue, and significantlystronger expression was detected in low-grade as opposedto high-grade tumors. Hence, R-RAS2 overexpressionseems to be associated with the early stages of transform-ation and indeed, R-RAS2 overexpression was also associ-ated with gliosis and hyperplasia, both of which areconsidered to be pre-malignant processes. When the ex-pression of mRNA encoding the other 2 members of theRAS-related subfamily was assessed, the brain specificRRAS3 was not overexpressed in CNS tumors. By con-trast, RRAS1 mRNA expression was enhanced in CNS tu-mors, albeit not to the same extent as RRAS2. Given that
unlike RRAS1 or RRAS3, RRAS2 can transform NIH-3 T3cells [8-11], and in light of the low frequency of oncogenicmutations in classic Ras genes, we hypothesize thatR-RAS2 overexpression is an important event in the trans-formation of neural cells, particularly those that do notcarry oncogenic RAS mutations (database reference).Nevertheless, further studies will be necessary to demon-strate this assumption.There is compelling evidence that R-RAS2 activity is
linked to the activation of the PI3K pathway. Indeed,R-RAS2 directly recruits and activates several catalyticsubunits of type I PI3K [23,24]. In conjunction, these datasuggest that by activating the PI3K pathway, R-RAS2 canpromote neural cell survival and proliferation in associationwith transformation in several types of CNS cancers. Thishypothesis is consistent with the high frequency of inacti-vating or deleting mutations in PTEN, a negative regulatorof PI3K activity, in brain tumors [25-27].One of the principal causes of cancer are increases in
PTEN-PI3K signaling [28] given that mutations in PI3Kor PTEN that maintain these proteins active inducetumorigenic processes [29,30]. In the CNS in particular,PTEN and PI3Kα appear among the 15 genes mostfrequently mutated in tumors (Cosmic database, SangerInstitute), irrespective of their location and histologicaltype. Nevertheless, the frequency with which mutationsappear in PTEN/PI3K does increase in function of themalignancy of the tumor. Thus, for example, the fre-quency of mutations in PTEN increases from 1% in

0
5
10
15
20
25
Brain tissue
Meningioma I
Meningioma II
Astrocytoma I
Astrocytoma II
Astrocytoma III
Hyperplasia
Oligoastrocytoma II
Oligoastrocytoma III
Oligodendroglioma II
Oligodendroglioma III
Ependymoma IIIRel
ativ
e m
RN
A le
vels
RRas2
0
5
10
15
20
25
0
2
4
6
8
10
0
0,25
0,5
0,75
1
1,25**
* ***
c d e
Rel
ativ
e m
RN
A le
vels
RRas1 RRas2 RRas3
Rel
ativ
e m
RN
A le
vels
Rel
ativ
e m
RN
A le
vels
0 I II III 0 I II III 0 I II IIIGrade Grade Grade
a
0,03
0,06
0,13
0,25
0,5
1
2
4
8
16
32
Rel
ativ
e m
RN
A le
vels
RR
as1
RR
as2
RR
as3
RR
as1
RR
as2
RR
as3
RR
as1
RR
as2
RR
as3
RR
as1
RR
as2
RR
as3
RR
as1
RR
as2
RR
as3
RR
as1
RR
as2
RR
as3
RR
as1
RR
as2
RR
as3
RR
as1
RR
as2
RR
as3
RR
as1
RR
as2
RR
as3
RR
as1
RR
as2
RR
as3
RR
as1
RR
as2
RR
as3
RR
as1
RR
as2
RR
as3
b
Figure 3 RRAS2 fulfils an important role in low grade tumors. a) A qPCR analysis of the cDNA obtained from different human brain samplesfrom the commercial Brain Cancer cDNA Array I (HBRT102) was performed using specific oligos. The mean expression of RRAS2 mRNA is shownfor each tumor subtype and grade, and all the values shown are relative to the expression of RRAS2 mRNA in healthy tissue. b-e) The expressionof all RRAS subfamily members is altered in tumor cells. A qPCR analysis of the cDNAs from human brain tumors represented according to thetumor type. RRAS1, RRAS2 and RRAS3 transcripts were measured in each sample from the Brain Cancer cDNA Array I (HBRT102). c-e) Transcriptlevels of the different R-RAS subfamily members were gather and analyzed according to the degree of malignancy (WHO criteria), normalizing allthe data relative to the expression in healthy tissue. Student’s t-test *p < 0.05, **p < 0.01. ANOVA p < 0.05.
Gutierrez-Erlandsson et al. Molecular Cancer 2013, 12:127 Page 7 of 11http://www.molecular-cancer.com/content/12/1/127

Table 2 Clinical data of different grade astrocytomasanalyzed in western blots
Histo-pathology Grade1 Patients Samples Mean age Men (%)
Brain tissue - 3 3 41,3 ± 37 33,3
Astrocitoma II 5 5 44 ± 10 40
Glioblastoma IV 5 5 66,6 ± 13 401Classified according to the WHO criteria.
Gutierrez-Erlandsson et al. Molecular Cancer 2013, 12:127 Page 8 of 11http://www.molecular-cancer.com/content/12/1/127
grade I astrocytomas to 21% in grade IV astrocytomas.Likewise, PI3K does not appear to be mutated in lowgrade astrocytomas but the frequency of mutations inhigh grade malignant tumors of this type reaches 6%.The same occurs in oligodendrogliomas in which thefrequency of mutations in PTEN and PI3Kα is 3-2% inlow grade tumors, reaching 4 and 10%, respectively, inhigh grade tumors (Cosmic database, Sanger Institute).Alternatively, activating mutations and overexpression
of classical Ras subfamily members have been describedas elements responsible for the development of tumorsin human [3], although only 0.5% of CNS tumorspresent mutations in classical RAS. Indeed, mutations in
0
0,5
1
1,5
2
2,5
3
3,5
kDa
-37
-20
GAPDH
RRAS2
Grade
0 II IV
ND
V R
RA
S2/
GA
PD
H
*
*
*a b
c
CII
IV
Figure 4 Increased R-RAS2 expression in astrocytomas. a) R-RAS2 andastrocytoma (n = 5) and grade IV astrocytoma (n = 5) analyzed in Western bto the amount of protein in the control, grade II and IV astrocytomas. StudR-RAS2 at different tumor stages.
RRAS2 have not been found in the CNS (n = 7,378: Cos-mic database, Sanger Institute). Given the above, wepropose that the overexpression of R-RAS2 may be animportant event in the initiation of the neural trans-formation process in low grade CNS tumors, in whichthe PTEN/PI3K pathway has still to be activated due tomutation.
ConclusionsOur findings demonstrate that R-RAS2 mRNA and pro-tein is overexpressed in a wide variety of human CNStumors, including glioblastomas, astrocytomas, oligo-dendrogliomas and medulloblastomas. While R-RAS2was overexpressed in all CNS tumor types, its expressionwas inversely related to the degree of malignancy,suggesting that R-RAS2 overexpression is an early eventin neural cell transformation.
Ethical standardsThis study was performed in compliance with all applic-able European and Spanish law.
ontrol Grade
Grade
GAPDH expression in lysates of control brain tissue (n = 3), grade IIlots. b) Graph show the mean and SD of the signal quantified relativeent’s t-test p < 0.005. c) Diagram showing the hypothesis of the role of
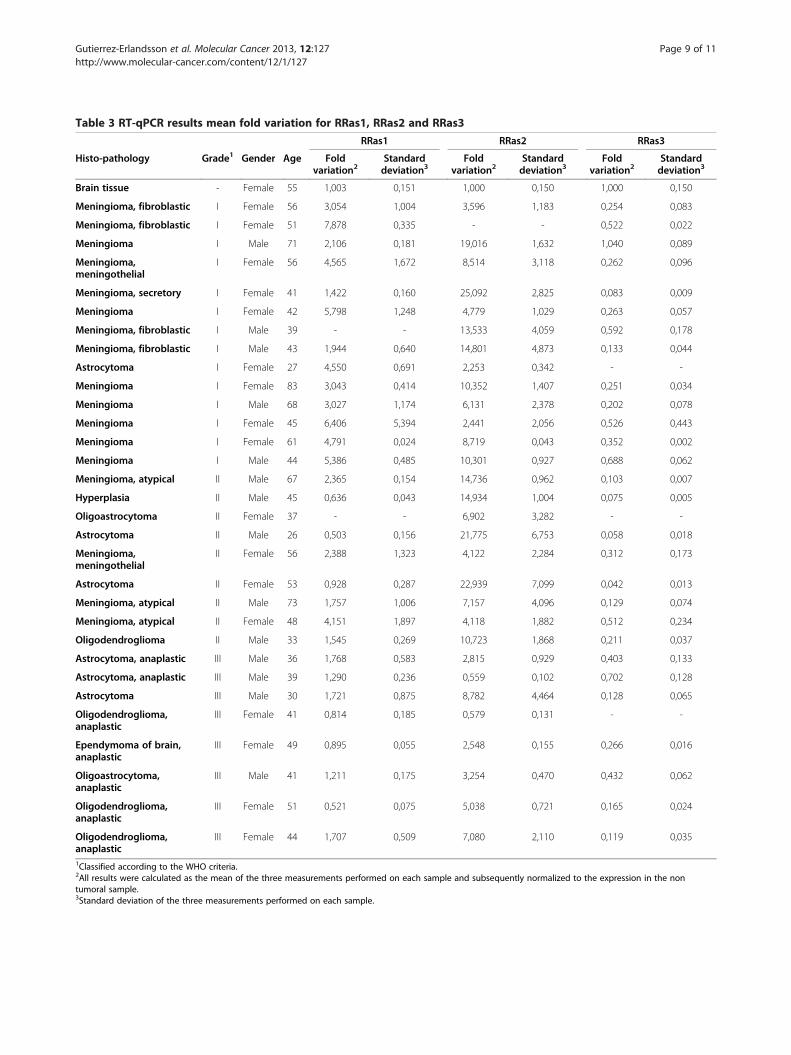
Table 3 RT-qPCR results mean fold variation for RRas1, RRas2 and RRas3
RRas1 RRas2 RRas3
Histo-pathology Grade1 Gender Age Foldvariation2
Standarddeviation3
Foldvariation2
Standarddeviation3
Foldvariation2
Standarddeviation3
Brain tissue - Female 55 1,003 0,151 1,000 0,150 1,000 0,150
Meningioma, fibroblastic I Female 56 3,054 1,004 3,596 1,183 0,254 0,083
Meningioma, fibroblastic I Female 51 7,878 0,335 - - 0,522 0,022
Meningioma I Male 71 2,106 0,181 19,016 1,632 1,040 0,089
Meningioma,meningothelial
I Female 56 4,565 1,672 8,514 3,118 0,262 0,096
Meningioma, secretory I Female 41 1,422 0,160 25,092 2,825 0,083 0,009
Meningioma I Female 42 5,798 1,248 4,779 1,029 0,263 0,057
Meningioma, fibroblastic I Male 39 - - 13,533 4,059 0,592 0,178
Meningioma, fibroblastic I Male 43 1,944 0,640 14,801 4,873 0,133 0,044
Astrocytoma I Female 27 4,550 0,691 2,253 0,342 - -
Meningioma I Female 83 3,043 0,414 10,352 1,407 0,251 0,034
Meningioma I Male 68 3,027 1,174 6,131 2,378 0,202 0,078
Meningioma I Female 45 6,406 5,394 2,441 2,056 0,526 0,443
Meningioma I Female 61 4,791 0,024 8,719 0,043 0,352 0,002
Meningioma I Male 44 5,386 0,485 10,301 0,927 0,688 0,062
Meningioma, atypical II Male 67 2,365 0,154 14,736 0,962 0,103 0,007
Hyperplasia II Male 45 0,636 0,043 14,934 1,004 0,075 0,005
Oligoastrocytoma II Female 37 - - 6,902 3,282 - -
Astrocytoma II Male 26 0,503 0,156 21,775 6,753 0,058 0,018
Meningioma,meningothelial
II Female 56 2,388 1,323 4,122 2,284 0,312 0,173
Astrocytoma II Female 53 0,928 0,287 22,939 7,099 0,042 0,013
Meningioma, atypical II Male 73 1,757 1,006 7,157 4,096 0,129 0,074
Meningioma, atypical II Female 48 4,151 1,897 4,118 1,882 0,512 0,234
Oligodendroglioma II Male 33 1,545 0,269 10,723 1,868 0,211 0,037
Astrocytoma, anaplastic III Male 36 1,768 0,583 2,815 0,929 0,403 0,133
Astrocytoma, anaplastic III Male 39 1,290 0,236 0,559 0,102 0,702 0,128
Astrocytoma III Male 30 1,721 0,875 8,782 4,464 0,128 0,065
Oligodendroglioma,anaplastic
III Female 41 0,814 0,185 0,579 0,131 - -
Ependymoma of brain,anaplastic
III Female 49 0,895 0,055 2,548 0,155 0,266 0,016
Oligoastrocytoma,anaplastic
III Male 41 1,211 0,175 3,254 0,470 0,432 0,062
Oligodendroglioma,anaplastic
III Female 51 0,521 0,075 5,038 0,721 0,165 0,024
Oligodendroglioma,anaplastic
III Female 44 1,707 0,509 7,080 2,110 0,119 0,035
1Classified according to the WHO criteria.2All results were calculated as the mean of the three measurements performed on each sample and subsequently normalized to the expression in the nontumoral sample.3Standard deviation of the three measurements performed on each sample.
Gutierrez-Erlandsson et al. Molecular Cancer 2013, 12:127 Page 9 of 11http://www.molecular-cancer.com/content/12/1/127

Gutierrez-Erlandsson et al. Molecular Cancer 2013, 12:127 Page 10 of 11http://www.molecular-cancer.com/content/12/1/127
Additional files
Additional file 1: Figure S1. a) Combined R-RAS2 expression levelsin all samples from a brain tumor tissue microarray. R-RAS2 proteinlevels were expressed as the diaminobenzidine absorbance that reflectsthe presence of the protein in the samples. The R-RAS2 in human braintissue is expressed relative to that found in healthy brain samples. Allvalues were normalized to the levels detected in control tissue and theerror bars are due to technical errors. All samples were derived fromdifferent human CNS tumors obtained from a commercial array (CC17-11-004). b) Combined R-RAS2 expression in samples from a braintissue microarray. R-RAS2 protein levels expressed as thediaminobenzidine absorbance that reflects the presence of the protein inthe samples. All samples were derived from different grade IV humanCNS tumors obtained from a commercial brain medulloblastomaTMA (CC17-01-002). The error bars are due to technical errors.c) Confirmation of anti-R-RAS2 specificity. In Western blots theantiserum raised against R-Ras2 identified the protein in total brainsamples but not in lysates from mutant RRas2−/− mice. As a loadingcontrol, the same aliquots were probed with anti-α tubulin antibodies(bottom).
Additional file 2: Figure S3. R-RAS2 protein expression in differentgrades of tumors. Representative photographs of each tumor from theBrain Tumor Screen Tissue microArray (CC17-11-004) after the array wasanalyzed by immunostaining with anti-R-RAS2, and counterstained withhematoxylin and eosin. LA, Little Astrocytoma; HG, Hyperplasia ofgliocyte; A, Astrocytoma; and O, Oligodendroglioma.
Additional file 3: Figure S2. Combined results of the qPCR analyses.The cDNAs assayed were derived from different human brain samplesobtained from a commercial cancer cDNA array (HBRT102). The sampleswere analyzed using specific oligos for RRAS1, RRAS2 and RRAS3 mRNA.RRAS1 (a), RRAS2 (b) and RRAS3 (c) mRNA expression in tumor tissues andhyperplastic samples was normalized to β-actin expression, and the dataare expressed relative to the mRNA expression in healthy tissue. The errorbars are due to technical errors.
Competing interestsThe authors declare that they have no competing interests.
Authors’ contributionsSGE, PHV, MFA, SHG, SGF and AMR performed the experiments. BCconceived the idea, designed the experiment and drafted the manuscript.MF and BC edited the manuscript, which all the authors read and approved.
AcknowledgementsWe would like to thank Marta Nieto, Paola Bovolenta, Florencia Cavodeassiand Pilar Esteve for continued support. We thank the “Biobanco de tumors,Hospital Virgen de la Salud, Toledo. RD 09/0076/00074 for providing theastrocytoma samples to be analyzed in western blots. We are also grateful tothe “Servicio de genómica y secuenciación masiva de CBMSO”, and to IreneArellano, Raquel Martín Morales and Cristina Prieto for their excellenttechnical assistance. This work was supported by grants SAF2012-31279 fromthe ‘Comisión Interministerial de Ciencia y Tecnología’ and the ‘Ramón yCajal’ program (RYC-2010-06251, to B.C.). We also thank the FundaciónRamón Areces for its institutional support of the ‘Centro de BiologíaMolecular Severo Ochoa’.
Author details1Centro Nacional de Biotecnología, Consejo Superior de InvestigacionesCientíficas, Universidad Autónoma de Madrid, Madrid 28049, Spain. 2Centrode Biología Molecular Severo Ochoa, Departamento de Biología Molecular,Universidad Autónoma de Madrid, Madrid 28049, Spain.
Received: 6 May 2013 Accepted: 17 October 2013Published: 23 October 2013
References1. Karnoub AE, Weinberg RA: Ras oncogenes: split personalities. Nat Rev Mol
Cell Biol 2008, 9:517–531.
2. Ehrhardt A, Ehrhardt GR, Guo X, Schrader JW: Ras and relatives–job sharing andnetworking keep an old family together. Exp Hematol 2002, 30:1089–1106.
3. Alarcon B, Martinez-Martin N: RRas2, RhoG and T-cell phagocytosis. Small2011, 3:97–101. 110.4161/sgtp.19138.
4. Graham SM, Oldham SM, Martin CB, Drugan JK, Zohn IE, Campbell S, Der CJ:TC21 and Ras share indistinguishable transforming and differentiatingactivities. Oncogene 1999, 18:2107–2116.
5. Cox AD, Brtva TR, Lowe DG, Der CJ: R-Ras induces malignant, but notmorphologic, transformation of NIH3T3 cells. Oncogene 1994,9:3281–3288.
6. Chan AM, Miki T, Meyers KA, Aaronson SA: A human oncogene of the RASsuperfamily unmasked by expression cDNA cloning. Proc Natl Acad SciU S A 1994, 91:7558–7562.
7. Huang Y, Saez R, Chao L, Santos E, Aaronson SA, Chan AM: A novelinsertional mutation in the TC21 gene activates its transforming activityin a human leiomyosarcoma cell line. Oncogene 1995, 11:1255–1260.
8. Barker KT, Crompton MR: Ras-related TC21 is activated by mutation in abreast cancer cell line, but infrequently in breast carcinomas in vivo.Br J Cancer 1998, 78:296–300.
9. Sharma R, Sud N, Chattopadhyay TK, Ralhan R: TC21/R-Ras2 upregulationin esophageal tumorigenesis: potential diagnostic implications. Oncol2005, 69:10–18. Epub 2005 Jul 2028.
10. Clark GJ, Kinch MS, Gilmer TM, Burridge K, Der CJ: Overexpression of theRas-related TC21/R-Ras2 protein may contribute to the development ofhuman breast cancers. Oncogene 1996, 12:169–176.
11. Lee JH, Pyon JK, Lee SH, Lee YJ, Kang SG, Kim CH, Kim DW, Nam HS, ParkYH, Jeong DJ, Cho MK: Greater expression of TC21/R-ras2 in highlyaggressive malignant skin cancer. Int J Dermatol 2011, 50:956–960.910.1111/j.1365-4632.2010.04846.x.
12. Delgado P, Cubelos B, Calleja E, Martinez-Martin N, Cipres A, Merida I, BellasC, Bustelo XR, Alarcon B: Essential function for the GTPase TC21 inhomeostatic antigen receptor signaling. Nat Immunol 2009, 10:880–888.Epub 2009 Jun 2028.
13. Larive RM, Abad A, Cardaba CM, Hernandez T, Canamero M, de Alava E,Santos E, Alarcon B, Bustelo XR: The Ras-like protein R-Ras2/TC21 isimportant for proper mammary gland development. Mol 2012,23:2373–2387. Epub 2012 Apr 2325.
14. Rodriguez-Viciana P, Sabatier C, McCormick F: Signaling specificity by Rasfamily GTPases is determined by the full spectrum of effectors theyregulate. Mol Cell Biol 2004, 24:4943–4954.
15. Rosario M, Paterson HF, Marshall CJ: Activation of the Ral andphosphatidylinositol 3′ kinase signaling pathways by the ras-relatedprotein TC21. Mol Cell Biol 2001, 21:3750–3762.
16. Erdogan M, Pozzi A, Bhowmick N, Moses HL, Zent R: Signaling pathwaysregulating TC21-induced tumorigenesis. J Biol Chem 2007,282:27713–27720. Epub 22007 Jul 27726.
17. Rong R, He Q, Liu Y, Sheikh MS, Huang Y: TC21 mediates transformationand cell survival via activation of phosphatidylinositol 3-kinase/Akt andNF-kappaB signaling pathway. Oncogene 2002, 21:1062–1070.
18. Bondy ML, Scheurer ME, Malmer B, Barnholtz-Sloan JS, Davis FG, Il'yasova D,Kruchko C, McCarthy BJ, Rajaraman P, Schwartzbaum JA, et al: Brain tumorepidemiology: consensus from the brain tumor epidemiologyconsortium. Cancer 2008, 113:1953–1968. 1910.1002/cncr.23741.
19. Hu X, Pandolfi PP, Li Y, Koutcher JA, Rosenblum M, Holland EC: mTORpromotes survival and astrocytic characteristics induced by Pten/AKTsignaling in glioblastoma. Neoplasia 2005, 7:356–368.
20. Guha A, Feldkamp MM, Lau N, Boss G, Pawson A: Proliferation of humanmalignant astrocytomas is dependent on Ras activation. Oncogene 1997,15:2755–2765.
21. Mawrin C, Sasse T, Kirches E, Kropf S, Schneider T, Grimm C, Pambor C,Vorwerk CK, Firsching R, Lendeckel U, Dietzmann K: Different activation ofmitogen-activated protein kinase and Akt signaling is associated withaggressive phenotype of human meningiomas. Clin Cancer Res 2005,11:4074–4082.
22. Knobbe CB, Reifenberger J, Reifenberger G: Mutation analysis of the Raspathway genes NRAS, HRAS, KRAS and BRAF in glioblastomas.Acta Neuropathol 2004, 108:467–470. Epub 2004 Oct 2028.
23. Schneider CA, Rasband WS, Eliceiri KW: NIH Image to ImageJ: 25 years ofimage analysis. Nat Methods 2012, 9:671–675.
24. Murphy GA, Graham SM, Morita S, Reks SE, Rogers-Graham K, Vojtek A,Kelley GG, Der CJ: Involvement of phosphatidylinositol 3-kinase, but not

Gutierrez-Erlandsson et al. Molecular Cancer 2013, 12:127 Page 11 of 11http://www.molecular-cancer.com/content/12/1/127
RalGDS, in TC21/R-Ras2-mediated transformation. J Biol Chem 2002,277:9966–9975. Epub 2002 Jan 9911.
25. Okkenhaug K, Bilancio A, Farjot G, Priddle H, Sancho S, Peskett E, Pearce W,Meek SE, Salpekar A, Waterfield MD, et al: Impaired B and T cell antigenreceptor signaling in p110delta PI 3-kinase mutant mice. Sci 2002,297:1031–1034. Epub 2002 Jul 1018.
26. Bonneau D, Longy M: Mutations of the human PTEN gene. Hum Mutat2000, 16:109–122.
27. Karakas B, Bachman KE, Park BH: Mutation of the PIK3CA oncogene inhuman cancers. Br J Cancer 2006, 94:455–459.
28. Cantley LC: The phosphoinositide 3-kinase pathway. Sci 2002,296:1655–1657.
29. Bader AG, Kang S, Zhao L, Vogt PK: Oncogenic PI3K deregulatestranscription and translation. Nat Rev Cancer 2005, 5:921–929.
30. Luo J, Sobkiw CL, Logsdon NM, Watt JM, Signoretti S, O'Connell F, Shin E,Shim Y, Pao L, Neel BG, et al: Modulation of epithelial neoplasia andlymphoid hyperplasia in PTEN+/− mice by the p85 regulatorysubunits of phosphoinositide 3-kinase. Proc Natl Acad Sci U S A 2005,102:10238–10243.
doi:10.1186/1476-4598-12-127Cite this article as: Gutierrez-Erlandsson et al.: R-RAS2 overexpression intumors of the human central nervous system. Molecular Cancer2013 12:127.
Submit your next manuscript to BioMed Centraland take full advantage of:
• Convenient online submission
• Thorough peer review
• No space constraints or color figure charges
• Immediate publication on acceptance
• Inclusion in PubMed, CAS, Scopus and Google Scholar
• Research which is freely available for redistribution
Submit your manuscript at www.biomedcentral.com/submit