r tutorial lecture -...
TRANSCRIPT
(Big) Data Processing
Philip J Cwynar
University of Pittsburgh School of Information Sciences
and Intelligent Systems Program
R programming
(Big) Data Processing
R is a programming language and software environment for statistical analysis, graphics representation and reporting. R was created by Ross Ihaka and Robert Gentleman at the University of Auckland, New Zealand, and is currently developed by the R Development Core Team.
R is freely available under the GNU General Public License, and pre-compiled binary versions are provided for various operating systems like Linux, Windows and Mac.
Background

(Big) Data Processing
The following important features of R: R is a well-developed, simple and effective programming language which includes conditionals, loops, user defined recursive functions and input and output facilities.
R has an effective data handling and storage facility,
R provides a suite of operators for calculations on arrays, lists, vectors and matrices.
R provides a large, coherent and integrated collection of tools for data analysis.
R provides graphical facilities for data analysis and display either directly at the computer or printing at the papers.
Intro

(Big) Data Processing
R is world’s most widely used statistics programming language. It's the # 1 choice of data scientists and supported by a vibrant and talented community of contributors. R is taught in universities and deployed in mission critical business applications.

(Big) Data Processing
R studio https://www.rstudio.com/
https://www.rstudio.com/products/rstudio/download/

(Big) Data Processing

(Big) Data Processing
IDE Layout
(Big) Data Processing
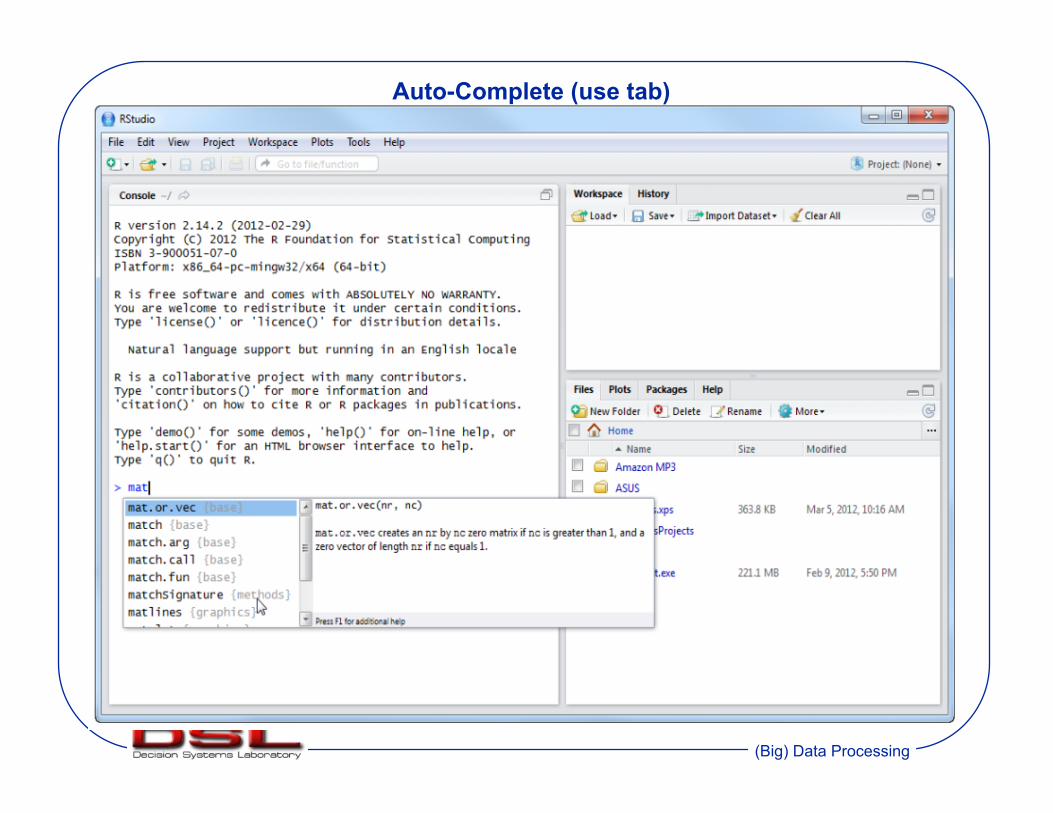
Auto-Complete (use tab)

(Big) Data Processing
Auto-Complete (even variables!)

(Big) Data Processing
Installing New Packages
(Big) Data Processing
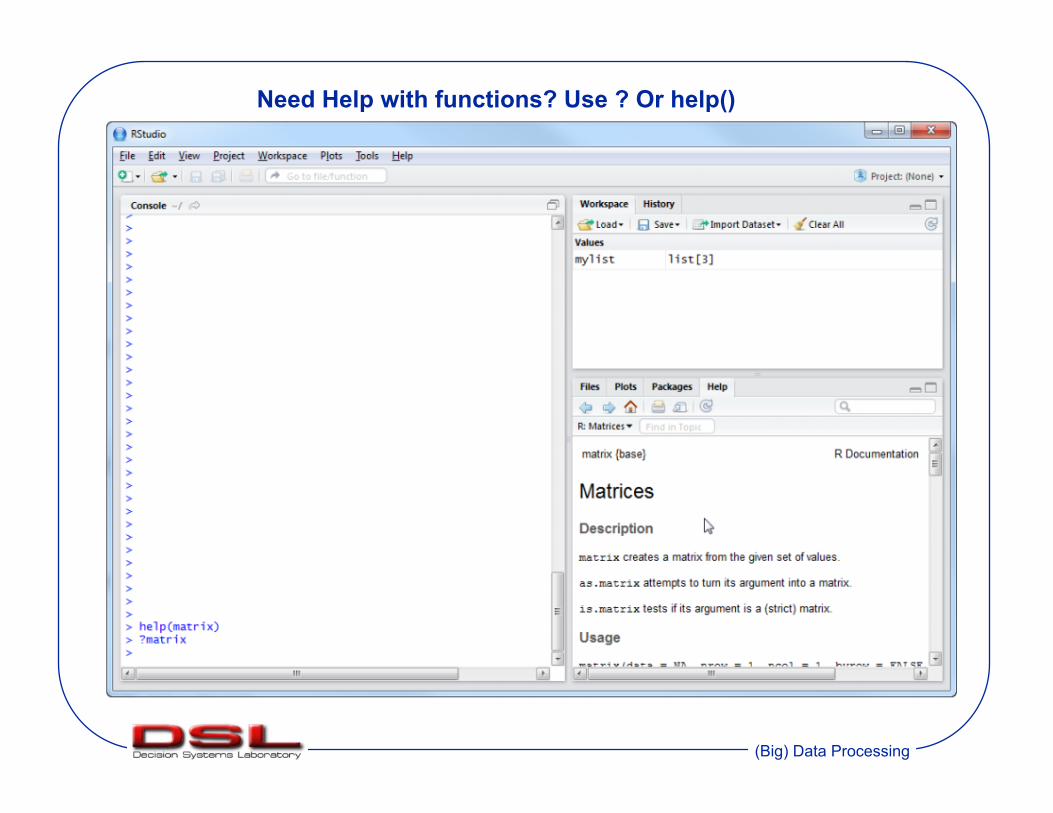
Need Help with functions? Use ? Or help()

(Big) Data Processing
Loading a file

(Big) Data Processing
R 101

(Big) Data Processing
R - Data Types
In contrast to other Programming languages like C and java in R the variables are not declared as some data type. The variables are assigned with R-Objects and the data type of the R-object becomes the data type of the variable just like in Python There are many types of R-objects. The frequently used ones are • Vectors • Lists • Matrices • Arrays • Factors • Data Frames

(Big) Data Processing

(Big) Data Processing
Data Type Example Command Line Logical TRUE , FALSE v <- TRUE
print(class(v)) it produces following result: [1] "logical"
Numeric 12.3, 5, 999 v <- 23.5 print(class(v)) it produces following result: [1] "numeric"
Integer 2L, 34L, 0L v <- 2L print(class(v)) it produces following result: [1] "integer"
Complex 3 + 2i v <- 2+5i print(class(v)) it produces following result: [1] "complex"
Character 'a' , '"good", "TRUE", '23.4' v <- "TRUE" print(class(v)) it produces following result: [1] "character"
Raw "Hello" is stored as 48 65 6c 6c 6f
v <- charToRaw("Hello") print(class(v)) it produces following result: [1] "raw"
R - Data Types cont…

(Big) Data Processing
The variables can be assigned values using leftward, rightward and equal to operator. The values of the variables can be printed using print() or cat()function. The cat() function combines multiple items into a continuous print output.
Variable Assignment
# Assignment using equal operator. !var1 = “abcdefg” !!# Assignment using leftward operator. !var2 <- 12345 !!# Assignment using rightward operator. !c(TRUE,1) -> var.3 print(var.1) cat ("var.1 is ", var.1 ,"\n") cat ("var.2 is ", var.2 ,"\n") cat ("var.3 is ", var.3 ,"\n")
(Big) Data Processing
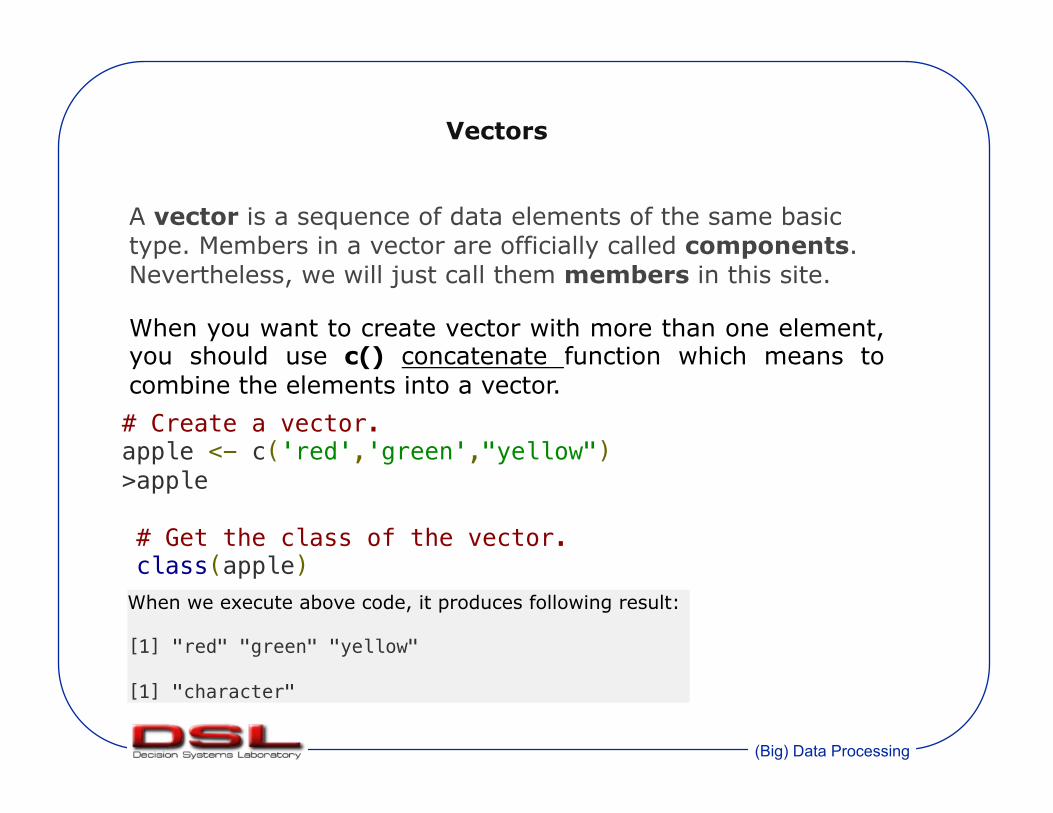
When you want to create vector with more than one element, you should use c() concatenate function which means to combine the elements into a vector.
Vectors
# Create a vector. !apple <- c('red','green',"yellow") !>apple!! # Get the class of the vector. ! class(apple) When we execute above code, it produces following result: ![1] "red" "green" "yellow" !![1] "character"
A vector is a sequence of data elements of the same basic type. Members in a vector are officially called components. Nevertheless, we will just call them members in this site.

(Big) Data Processing
When different objects are mixed in a vector, coercion occurs so that every element in the vector is of the same class.

(Big) Data Processing

(Big) Data Processing
(Big) Data Processing
h"p://cran.r-project.org/doc/contrib/R_language.pdf

(Big) Data Processing
All the elements of a matrix must be of the same type (numeric, logical, character, complex).
Matrices

(Big) Data Processing

(Big) Data Processing

(Big) Data Processing
# Create a matrix. M = matrix( c('a','a','b','c','b','a'), nrow=2,ncol=3,byrow = TRUE) !!

(Big) Data Processing
Data frames are tabular data objects. Unlike a matrix in data frame each column can contain different modes of data. The first column can be numeric while the second column can be character and third column can be logical. It is a list of vectors of equal length.
Data Frames are created using the data.frame() function.
Data Frames
# Create the data frame. !BMI <- data.frame( gender = c("Male", "Male","Female"), !height = c(152, 171.5, 165), weight = c(81,93, 78), Age =c(42,38,26) ) !print(BMI)

(Big) Data Processing

(Big) Data Processing

(Big) Data Processing
(Big) Data Processing
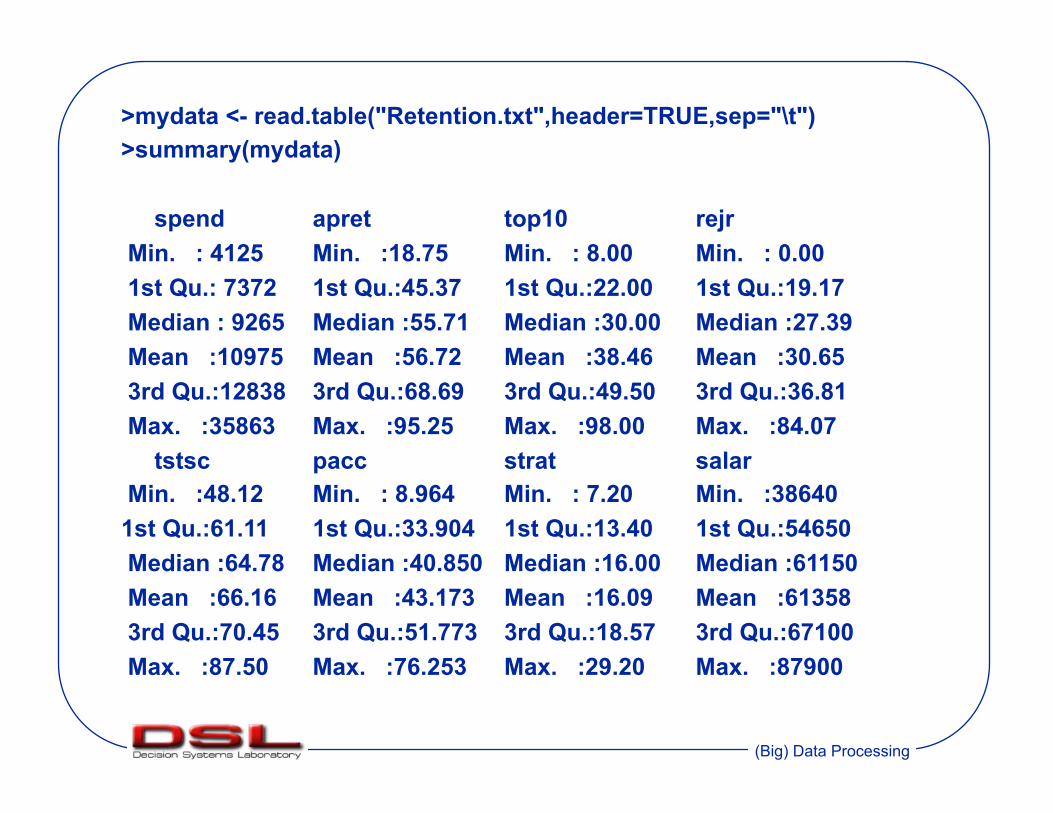
>mydata <- read.table("Retention.txt",header=TRUE,sep="\t") >summary(mydata) spend apret top10 rejr Min. : 4125 Min. :18.75 Min. : 8.00 Min. : 0.00 1st Qu.: 7372 1st Qu.:45.37 1st Qu.:22.00 1st Qu.:19.17 Median : 9265 Median :55.71 Median :30.00 Median :27.39 Mean :10975 Mean :56.72 Mean :38.46 Mean :30.65 3rd Qu.:12838 3rd Qu.:68.69 3rd Qu.:49.50 3rd Qu.:36.81 Max. :35863 Max. :95.25 Max. :98.00 Max. :84.07 tstsc pacc strat salar Min. :48.12 Min. : 8.964 Min. : 7.20 Min. :38640 1st Qu.:61.11 1st Qu.:33.904 1st Qu.:13.40 1st Qu.:54650 Median :64.78 Median :40.850 Median :16.00 Median :61150 Mean :66.16 Mean :43.173 Mean :16.09 Mean :61358 3rd Qu.:70.45 3rd Qu.:51.773 3rd Qu.:18.57 3rd Qu.:67100 Max. :87.50 Max. :76.253 Max. :29.20 Max. :87900
(Big) Data Processing
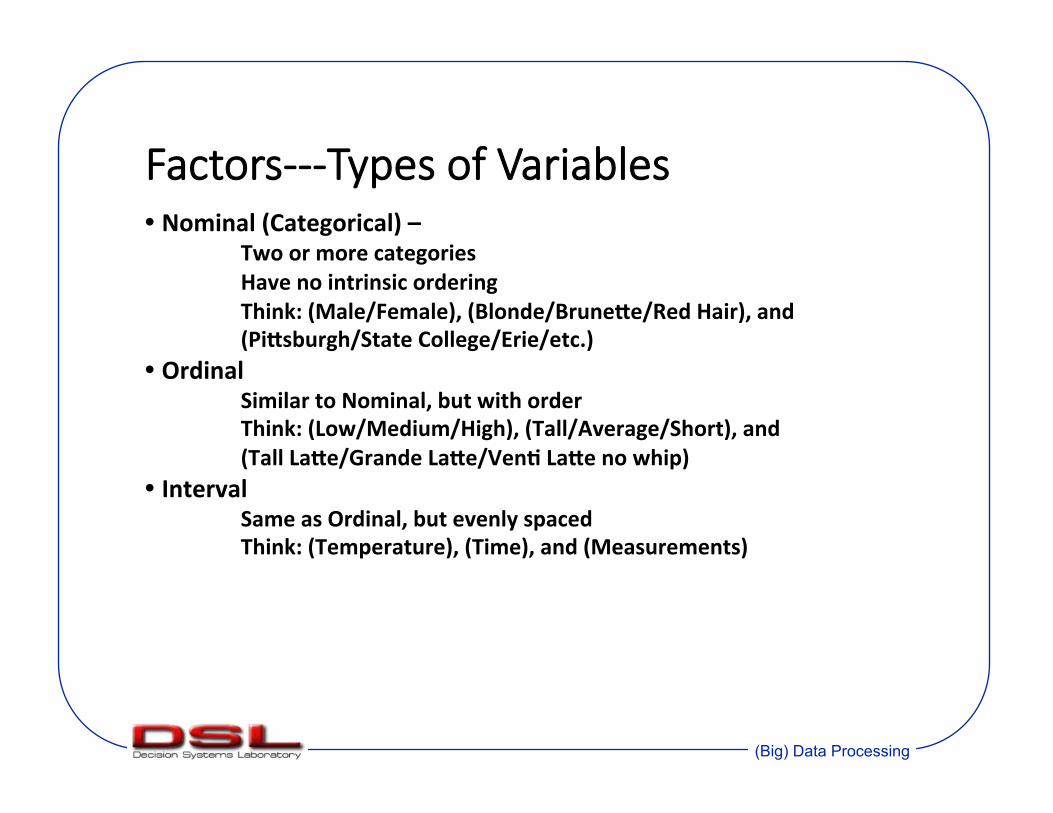
Factors---Types of Variables
• Nominal(Categorical)– Twoormorecategories Havenointrinsicordering
Think:(Male/Female),(Blonde/Brune"e/RedHair),and(Pi"sburgh/StateCollege/Erie/etc.)
• Ordinal SimilartoNominal,butwithorder
Think:(Low/Medium/High),(Tall/Average/Short),and(TallLa"e/GrandeLa"e/VenRLa"enowhip)
• Interval SameasOrdinal,butevenlyspaced Think:(Temperature),(Time),and(Measurements)

(Big) Data Processing
ggplot2

(Big) Data Processing
(Big) Data Processing
Terminology Mapping
TakingthedataandtheaestheRcsandmappingbetweenthemtovisualizeresults
Geom GeometricObjects–Points,lines,polygons(Remindyouofsomething?) Stat
StaRsRcalTransformaRon Example:TakingthedataandcounRngobservaRonstocreateahistogram Scale GivesyouanunderstandingoftherangeofdatainthevisualizaRons
Think:LegendorAxis
(Big) Data Processing
Terminology (cont.) Coord
CoordinateSystemEitherbyCartesianorpolarcoordinates
FacetFaceRngSpecificaRonThink:SmallmulRples..SegmenRngdataintogroupsfordeeperunderstandingAgroupofnodesinaclusterbecomingasinglenodetounderstandgrouptogroupinteracRon

(Big) Data Processing
Examples

(Big) Data Processing
● http://docs.ggplot2.org/current/geom_histogram.html
Histogram

(Big) Data Processing
ggplot2 Quick Reference: facetThe faceting approach supported by ggplot2 partitions a plot into a matrix of panels. Each panel shows a different subset of the data. There are two faceting approaches: • facet_wrap(~cell) - univariate: create a 1-d strip of panels, based on one factor, and wrap the strip into a 2-d matrix • facet_grid(row~col) - (usually) bivariate: create a 2-d matrix of panels, based on two factors
Facet Grid

(Big) Data Processing
● http://docs.ggplot2.org/current/facet_grid.html ● http://www.cookbook-r.com/Graphs/Facets_(ggplot2)/
Facet Grid

(Big) Data Processing
The violin plot is similar to box plots, except that they also show the probability density of the data at different values (in the simplest case this could be a histogram). Typically violin plots will include a marker for the median of the data and a box indicating the interquartile range, as in standard box plots. Overlaid on this box plot is a kernel density estimation.
Violin Plots

(Big) Data Processing
● http://docs.ggplot2.org/current/geom_violin.htm
Violin Plots

(Big) Data Processing
● https://learnr.wordpress.com/2010/01/26/ggplot2-quick-heatmap-plotting/
Heat Maps

(Big) Data Processing
https://learnr.wordpress.com/2010/01/26/ggplot2-quick-heatmap-plotting/
nba<-read.csv("h"p://datasets.flowingdata.com/ppg2008.csv")nba$Name<-with(nba,reorder(Name,PTS))
With • “EvaluateanRexpressioninanenvironmentconstructedfromdata,possiblymodifyingtheoriginaldata.”• nba$Name<-with(nba,reorder(Name,PTS))
Heat Maps cont…
(Big) Data Processing
R Markdown R Markdown is an authoring format that enables easy creation of dynamic documents, presentations, and reports from R.
The image cannot be displayed. Your computer may not have enough memory to open the image, or the image may have been corrupted. Restart your computer, and then open the file again. If the red x still appears, you may have to delete the image and then insert it again.
http://www.rstudio.com/wp-content/uploads/2015/02/rmarkdown-cheatsheet.pdf

(Big) Data Processing
● https://cran.r-project.org/
Useful Links
● http://zevross.com/blog/2014/08/04/beautiful-plotting-in-r-a-ggplot2-cheatsheet-3/ ● http://tutorials.iq.harvard.edu/R/Rgraphics/Rgraphics.html ● http://blog.echen.me/2012/01/17/quick-introduction-to-ggplot2/ ● http://had.co.nz/ggplot2/ ● https://github.com/jennybc/ggplot2-tutorial ● http://www.ceb-institute.org/bbs/wp-content/uploads/2011/09/handout_ggplot2.pdf ● http://www.r-bloggers.com/basic-introduction-to-ggplot2/

(Big) Data Processing
Facet
http://sape.inf.usi.ch/quick-reference/ggplot2 Whisker
http://asq.org/learn-about-quality/data-collection-analysis- tools/overview/box-whisker-plot.html
Violin
http://www.sthda.com/english/wiki/ggplot2-violin-plot-quick-start- guide-r-software-and-data-visualization
Machine learning kaggle titanic
https://www.datacamp.com/courses/kaggle-tutorial-on-machine- learing-the-sinking-of-the-titanic

(Big) Data Processing
Kaggle Titanic Assignment

(Big) Data Processing
(Big) Data Processing
Titanic Data Graphics (1) Go to kaggle.com > Titanic: Machine Learning from Disaster and download (train.csv) (2) You will submit a single R file (DOCUMENTED) (3) You will create a plot (for each, so 5 plots in total) in ggplot2 using: ● a. Whisker-plot ● b. Histogram ● c. Facet grid ● d. Violin plot ● e. Heatmap
(4) Write up a 500 – 1500 word document talking about the assignment using the graphics to describe the passengers of Titanic.
(Big) Data Processing
Examples
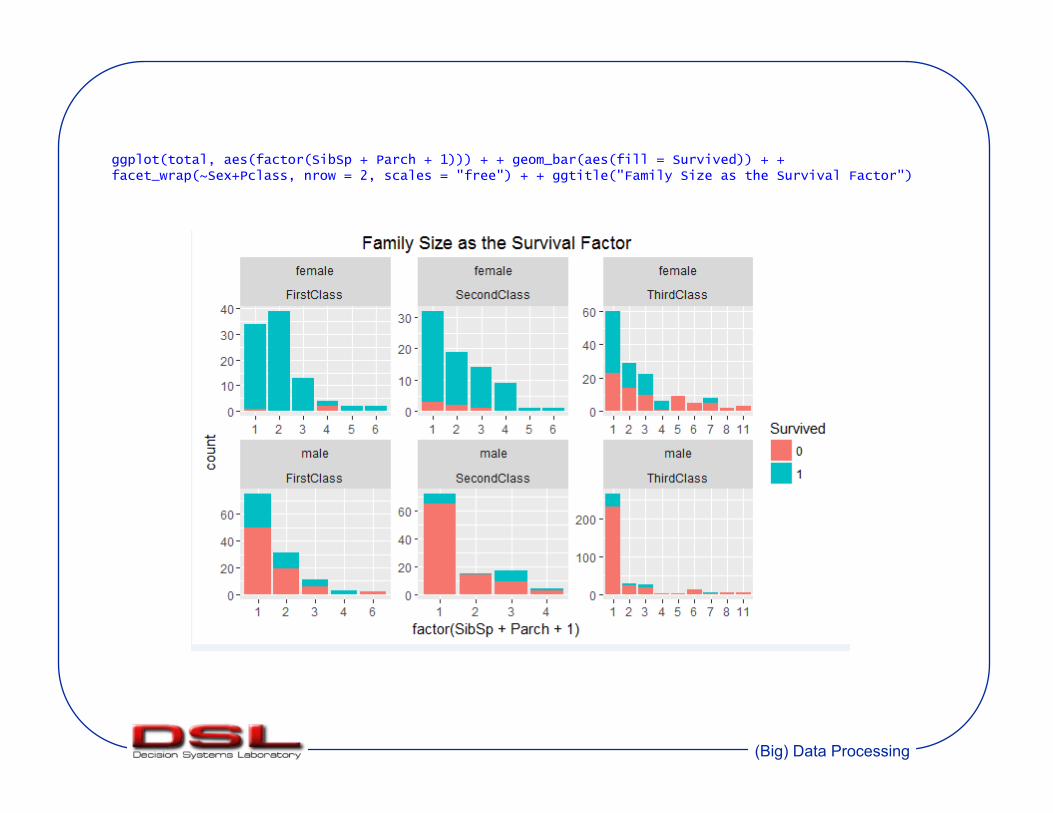
(Big) Data Processing
ggplot(total, aes(factor(SibSp + Parch + 1))) + + geom_bar(aes(fill = Survived)) + + facet_wrap(~Sex+Pclass, nrow = 2, scales = "free") + + ggtitle("Family Size as the Survival Factor")

(Big) Data Processing
ggplot(total, aes(Pclass)) + + geom_bar(aes(fill = Survived)) + + facet_grid(~Sex) + + ggtitle("Pclass and Sex as the Survival Factors")
(Big) Data Processing
Midterm Exam Next week
You can bring with you to the exam one double-sided letter-size sheet of paper with notes. There are no limits on the font size – you can cram as much information on these two pages as you wish – but the notes have to be handwritten personally by you and this is a strict requirement. Copied or computer-printed sheets are not allowed.