r uimtelijk p lan b ureau netherlands institute for spatial research regional knowledge networks in...
Post on 21-Dec-2015
214 views
TRANSCRIPT
RUIMTELIJK PLANBUREAU
NETHERLANDS INSTITUTE FOR SPATIAL RESEARCH
Regional knowledge networks in the Dutch ICT services and life sciences sector
Anet Weterings & Roderik PondsNetherlands Institute for Spatial ResearchThe Hague, the Netherlands
Paper prepared for the DIME-LIEE / NTUA Athens 2006 conference, 30 November – 1 December 2006
Background of the study
• Aim of Dutch Ministery of Economic Affairs (2004): to stimulate regional contacts between firms (mainly SMEs) and research institutes
• Economic geography:– Localised knowledge networks with many
regional contacts among organisations– Firms within those networks obtain more
knowledge and therefore perform better

Recent criticism
• Spatial proximity is not a necessary condition for knowledge transfer: are there regional knowledge networks?
• More attention for heterogeneity among firms in the regional network:– Due to differences in power (mainly size
of the firm)– Differences in the internal knowledge
base

Three research questions
• Are there regional knowledge networks and what is the structure of those networks?
• What type of firms use regional contacts to obtain knowledge?
• To what extent is there a relation between the firm’s network position and it’s innovative performance?

Outline empirical research
• Two sectors: ICT services and life sciences
• Three regions: South-Holland and Gelderland (life sciences) and the Middle of the Netherlands (ICT services)
• Data collection through telephone survey (response 38-45%)
• Social network analysis and regression analyses

Measuring knowledge contacts
• Question: Have you ever approached an organisation in the region when you were confronted with problems and has this helped to solve the problem?
• Distinction between contacts for:– Technological knowledge– Organisational knowledge
• ‘roster recall’ method: mention contacts on a list of names and add missing contacts

Life Sciences - Gelderland
Technological
Organisational
20 firms interviewedFirms with contactsTechnological: 95%Organisational: 35%
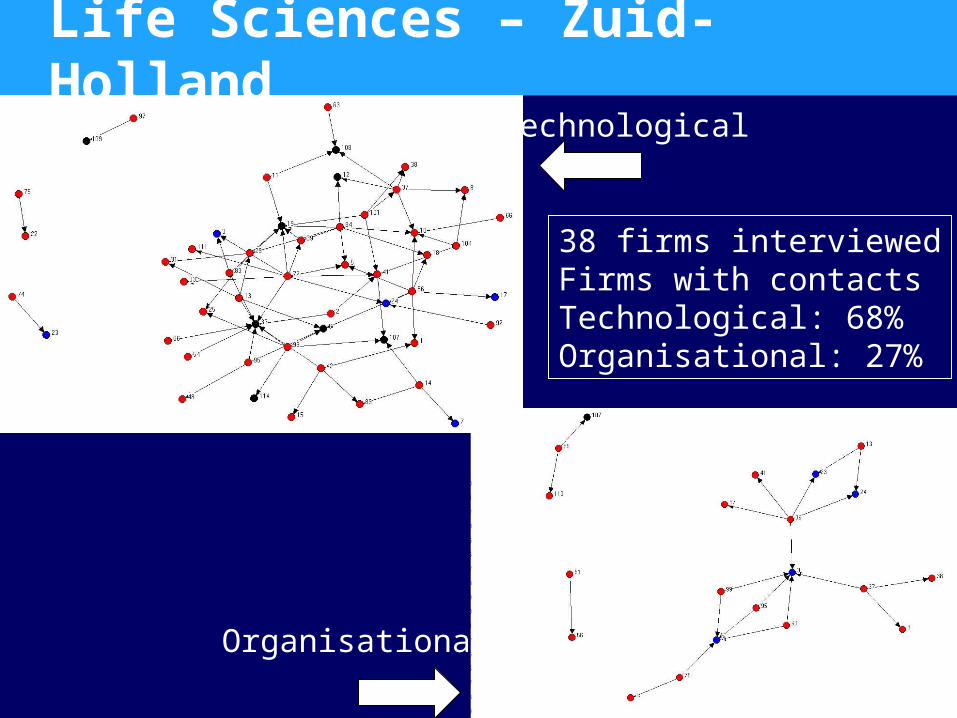
Life Sciences – Zuid-Holland
Technological
Organisational
38 firms interviewedFirms with contactsTechnological: 68%Organisational: 27%
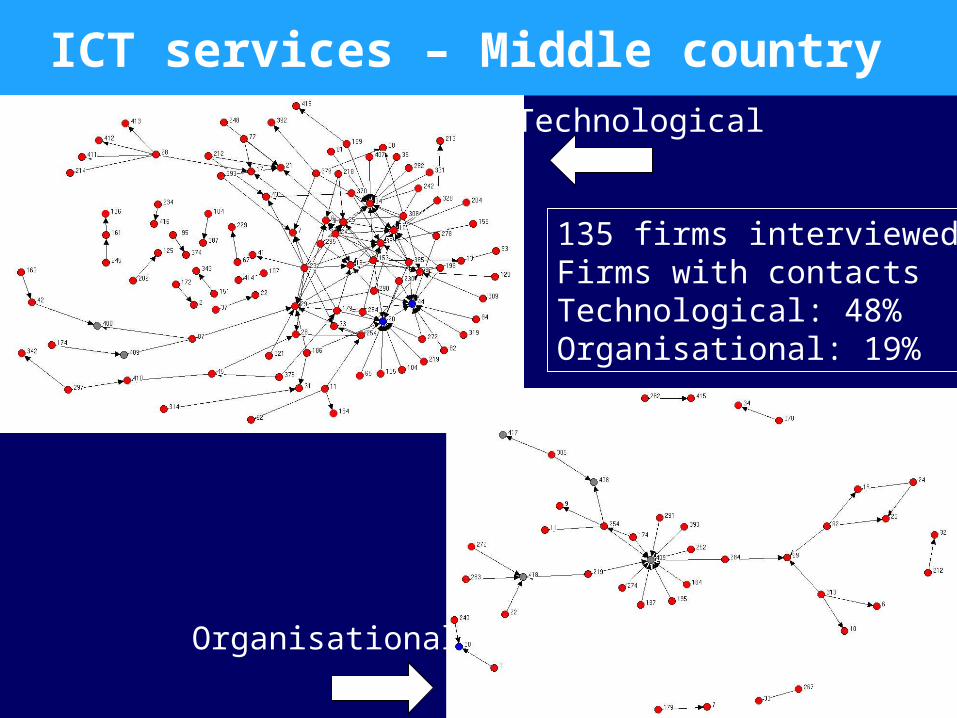
ICT services – Middle country
Technological
Organisational
135 firms interviewedFirms with contactsTechnological: 48%Organisational: 19%
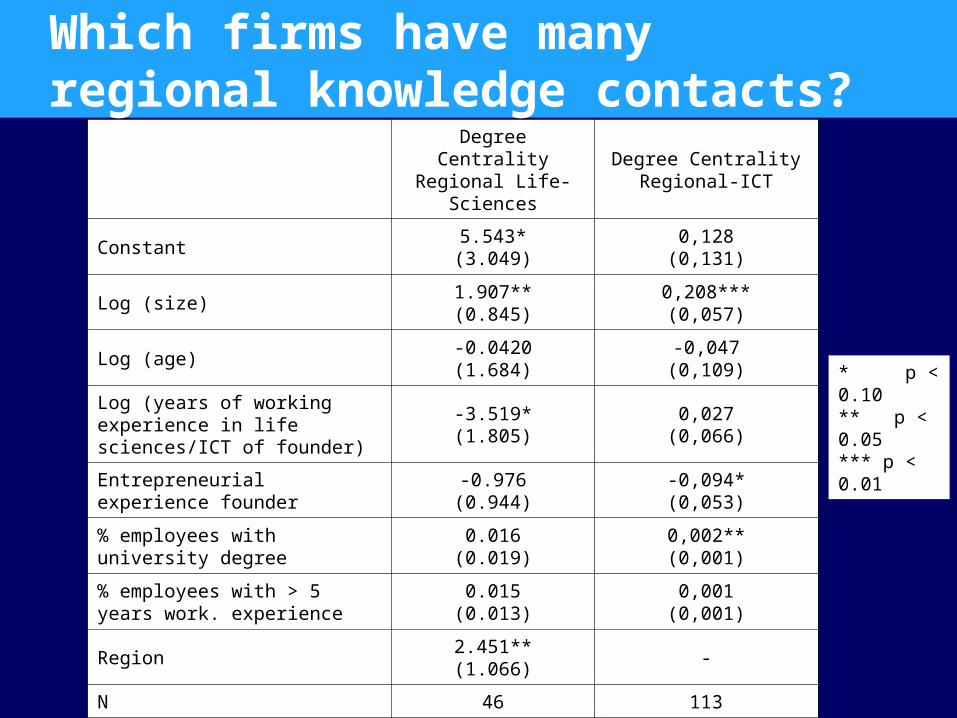
Which firms have many regional knowledge contacts?
Degree CentralityRegional Life-Sciences
Degree CentralityRegional-ICT
Constant5.543*(3.049)
0,128(0,131)
Log (size)1.907**(0.845)
0,208***(0,057)
Log (age)-0.0420(1.684)
-0,047(0,109)
Log (years of working experience in life sciences/ICT of founder)
-3.519*(1.805)
0,027(0,066)
Entrepreneurial experience founder-0.976(0.944)
-0,094*(0,053)
% employees with university degree0.016
(0.019)0,002**(0,001)
% employees with > 5 years work. experience
0.015(0.013)
0,001(0,001)
Region2.451**(1.066)
-
N 46 113
F 1.79 4,77***
R-square 0.107 0,205
* p < 0.10** p < 0.05 *** p < 0.01

Measure innovative performance• Different measures for the two
sectors:
• Life sciences: number of patents• ICT services: share of turnover due to
the sales of new products or services between 2003 and 2006

Relation firm’s network position and innovative performance
ICT-OLS ICT-backward
Constant 33,252*(18,585)
29,537*(15,072)
Log (unvalued degree centrality)
-5,503(11,444)
-
Number of non-regional Relationships
-0,452(2,416)
-
Share fte in development new products or services
0,388***(0,109)
0,414***(0,090)
Log (size)7,414
(8,146)-
Log (age)-22,266(13,950)
-
Log (years of working experience life sciences founder)
-5,721(7,724)
-
Dummy entrepreneurial exp.founder
10,310(6,412)
13,419**(5,642)
% employees with universitydegree
0,258***(0,096)
0,262***(0,091)
% employees with > 5 years working experience
0,022(0,077)
-
N 92 92
F 4,925*** 14,207***
R-Square 0,348 0,324
Life-Sciences OLS
Life-SciencesBackward
Constant -0,779**(0,377)
-0,537**(0,264)
Log (unvalued degree centrality)
0,547**(0,201)
0,620***(0,176)
Number of non-regional relationships
-0,009(0,024)
-
Log (size)0,211*(0,110)
-
Log (age)0,079
(0,206)-
Log (years of working experience life sciences founder)
0,272(0,219)
0,412**(0,189)
Dummy entrepreneurial experience of founder
0,076(0,117)
-
% employees with university Degree
0,003(0,002)
-
% employees with > 5 years working experience
0,000(0,002)
-
Region 0,023(0,127)
-
N 39 39
F 2,215* 7,437***
R-Square 0,389 0,287
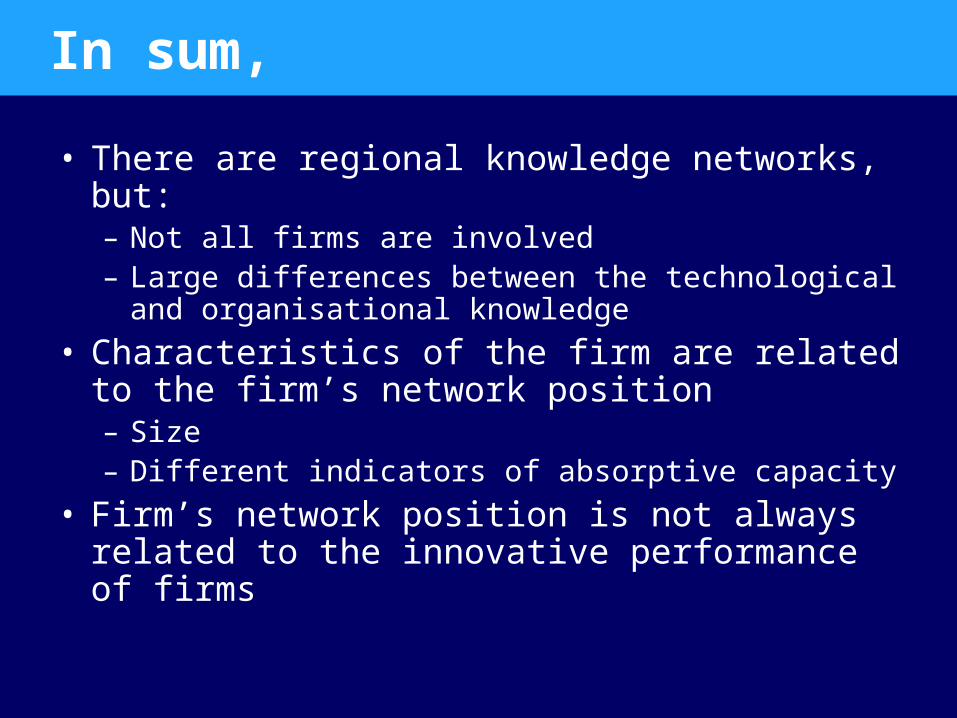
In sum,
• There are regional knowledge networks, but:– Not all firms are involved– Large differences between the technological
and organisational knowledge
• Characteristics of the firm are related to the firm’s network position– Size– Different indicators of absorptive capacity
• Firm’s network position is not always related to the innovative performance of firms
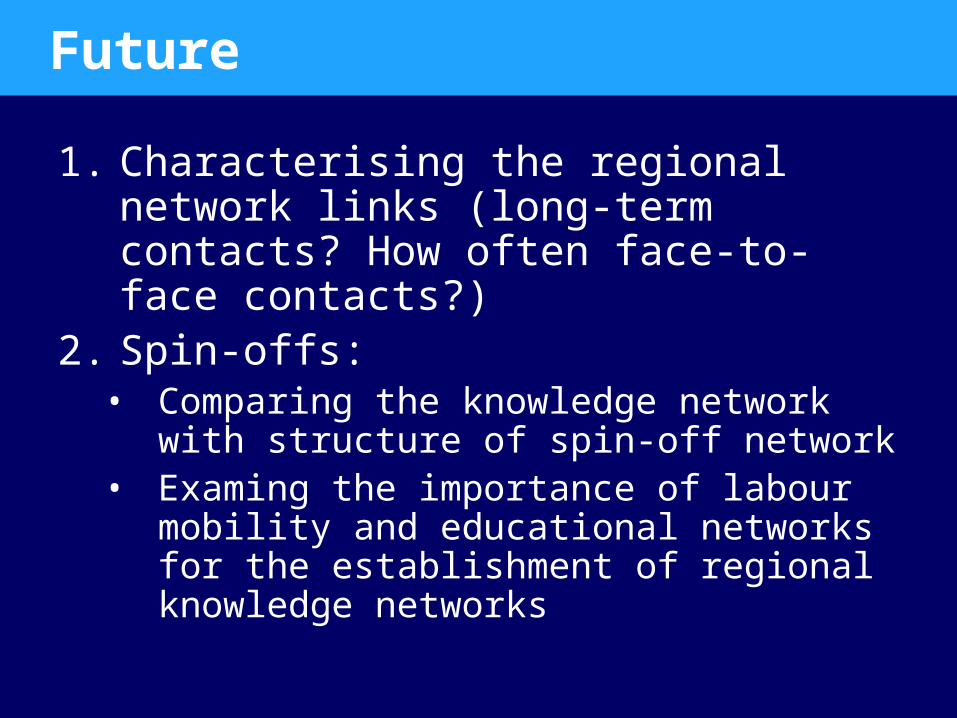
Future
1. Characterising the regional network links (long-term contacts? How often face-to-face contacts?)
2. Spin-offs:• Comparing the knowledge network with
structure of spin-off network • Examing the importance of labour
mobility and educational networks for the establishment of regional knowledge networks